




Abstract
This study examined the spatial and temporal patterns of the paleobiome types in the Three-River Headwaters Region (TRHR, Sanjiangyuan) in China from the middle Holocene (i.e. 6000 BP). Existing studies explored the patterns of paleobiome types by identifying the type of biomes in pollen sites, based on the taxonomical assemblage of pollen samples. This site-wise identification, however, is not suited for the analysis of the TRHR because pollen sites in the region-level are discrete and low-resolution. In this study – to solve the lack of the pollen sites – climate data, which are easy to interpolate, were extracted from the pollen data by pollen transfer functions. Next, the extracted climate data were calibrated and interpolated over the TRHR and study period. Then, a physiological biome model based on climate was used to produce the chronology of the distribution of the biome types. Consequently, the chronology was reconstructed with a time interval of 50 years and a spatial cell size of 0.5 ° × 0.5 °. From the results, the variations in the distribution of the paleobiome types were mainly dominated by 36 patterns over 10 biome types. In detail, tundra and semidesert were the main types, and the alternation of these two types was the main pattern. Further, the long-term evolution was from tundra to semi-desert, and the precipitation was the main driving force for changes in biomes, while temperature also had some influence.
Keywords
Introduction
Biomes are the world’s major communities consisting of plants and animals living in similar environments (Campbell et al., 1997), and are widely used in many fields. For example, in ecology, the interactions between biodiversity and environment can be inferred from the biomes, as the distribution of biomes is highly related to soil and climatic conditions (Millennium Ecosystem Assessment, 2005). In geomorphology, hydro-geomorphological processes can be partially explained by biomes, as biome types influence the sedimentary and morphological environment (Gurnell et al., 2012). In history, the development of civilization is restricted by biomes, as biomes in different types provide different opportunities for agriculture and husbandry (Diamond, 2005).
The Three-River Headwaters Region (TRHR), which is the source of the Yangtze River, Yellow River, and Lancang River (i.e. the Mekong River in South Asia), is the biggest nature reserve and the first national park in China (Wang, 2017). The TRHR contains numerous unique plants and protected animals of the Qinghai-Tibetan Plateau, such as Tibetan antelopes, snow leopards, and orchids, so it is a vital ecological safe shelter zone in China. However, the ecology of the TRHR is highly sensitive to the distribution of biome types, which varies frequently and significantly over time (Li and Xu, 2012; Zhao et al., 2011). Furthermore, the distribution of the biome types in the TRHR is influenced by climatic changes significantly (Thompson et al., 2003; Yao et al., 1997). Therefore, to plan and manage the ecological protection zone of the TRHR, an adequate understanding of the historical trends of the distribution of the biome types is urgent. Also, a thorough explanation of the interaction of the distribution of the biome types with climate changes is necessary.
Traditionally, the distribution of biome types is studied using BIOME6000 (Prentice and Thompson, 1998) model. This model was first applied to reconstruct the distribution of biome types in Europe during the Mid-Holocene (Prentice et al., 1996), and then it was used to reconstruct the distribution globally (Prentice and Thompson, 1998). In the BIOME6000 model, taxonomic assemblages of pollen samples (i.e. the proportions of plants inside pollen samples) are first mapped onto plant functional types (PFTs), which is a set of plants with similar living environments and functions (e.g. leaf-form); and then, PFTs are mapped onto biome types to get the result. When the taxonomic assemblages are not predefined for a particular pollen sample, the predefined taxonomic assemblage that is most similar to the collected assemblage was selected to define the biome. This model accurately identifies biomes from pollen samples but cannot map the continuous distribution of biome types, as the biomes are indexed by discrete and low-resolution pollen sites, which are difficult to interpolate (Prentice and Thompson, 1998). Although some studies interpolated the values related to taxonomic assemblages (Guiot et al., 1996, Ren and Beug, 2002) to increase the resolution, it is hard to explain why these values can be interpolated. As a result, the BIOME6000 model can only be used on a continental or sub-continental scale (Ren and Beug, 2002), where the scarcity of pollen sites is not a problem, while the TRHR is on the regional scale. In addition, the BIOME6000 model cannot describe the interactions between the distribution of the biome types and the climate factors.
Thus, this study proposed a new method for reconstructing the distribution of the biome types based on interpolatable climate factors. In detail, we first extracted climate variables from taxonomic assemblages of pollen samples, based on the pollen transfer functions proposed by Shen et al. (2006). Next, we calibrated and interpolated the climate variables and used the physiological model proposed by Prentice et al. (1992) to reconstruct biome types. Through this process, we reconstructed the chronology of the distribution of the biome types in the TRHR since the middle Holocene (e.g. from 6000 BP to 0 BP), with a time interval of every 50 years and a spatial grid cell size of 0.5° (about 2400 km2 a cell). Based on this chronology, we analyzed the spatial and temporal patterns of biome types in the TRHR, and explored the climate factors influencing these patterns. This study will contribute to the paleobiome research in the TRHR and could inspire the paleobiome reconstruction on the regional scale.
Study area and data
Study area
As shown in Figure 1, the Three-River Headwaters Region (TRHR) ranges from 89.4°E to 102.25°E, and from 31.54°N to 36.28°N, and has an average elevation of over 4000 m above sea level. The area of the TRHR is 364,000 km2, making up 50.4% of the total area of the Qinghai Province. It consists of 16 counties and one township, and the population size was around 590,000 in 2002. The rivers in the TRHR significantly changed the history of China (Chen et al., 2012; Kidder and Liu, 2014), and is still playing an important role in the national ecological shelter zone, livelihoods, economy, and politics in China.
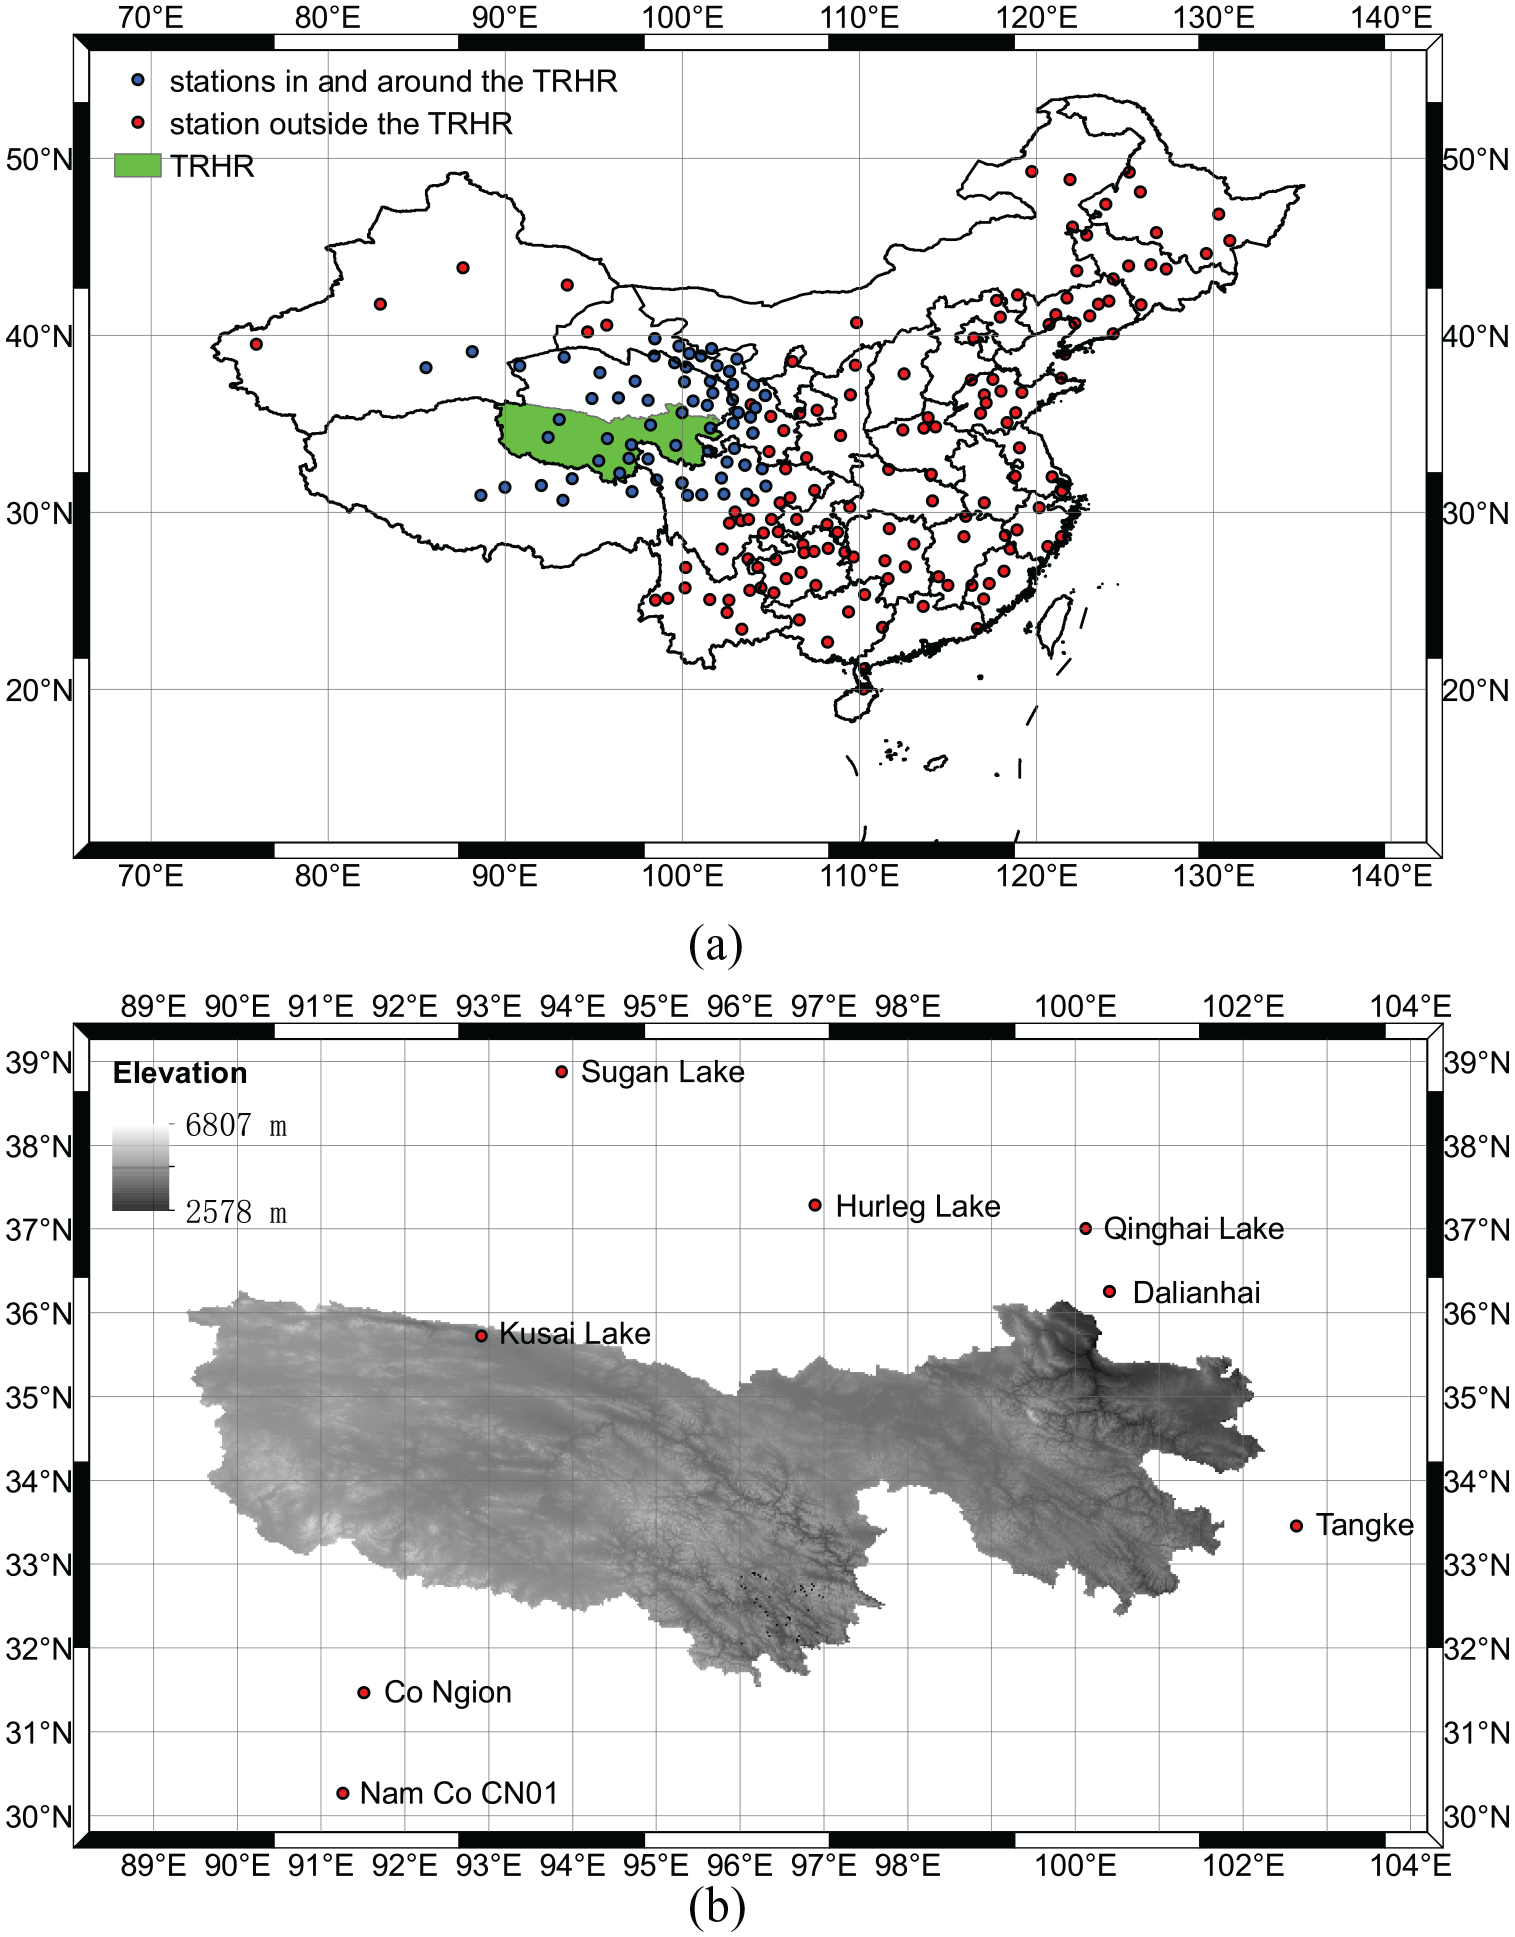
The study area (the Three-River Headwaters Region (TRHR, Sanjiangyuan)) and the data sources: (a) the location of the TRHR and the distribution of the meteorological stations; and (b) the elevation of the TRHR and the distribution of the pollen sites.
The TRHR has an alpine climate (Ren and Beug, 2002), with a mean annual temperature between −5.6 and 7.8°C, and a mean annual precipitation between 262.2 and 772.8 mm from northwest to southeast. The amount of sunshine is represented as 5658–6469 MJ/m2. The soil types in the TRHR include alpine cold desert soil, alpine meadow soil, alpine steppe soil, mountain meadow soil, grey cinnamon soil, chestnut soil, and mountain forest soil. Among these soil types, the alpine meadow soil is dominant, and frozen soil covers large areas. According to Yu et al. (2000), the biome types in the TRHR are mainly tundra, steppe and desert, and cool mixed forest exists in the eastern part of this region.
Data
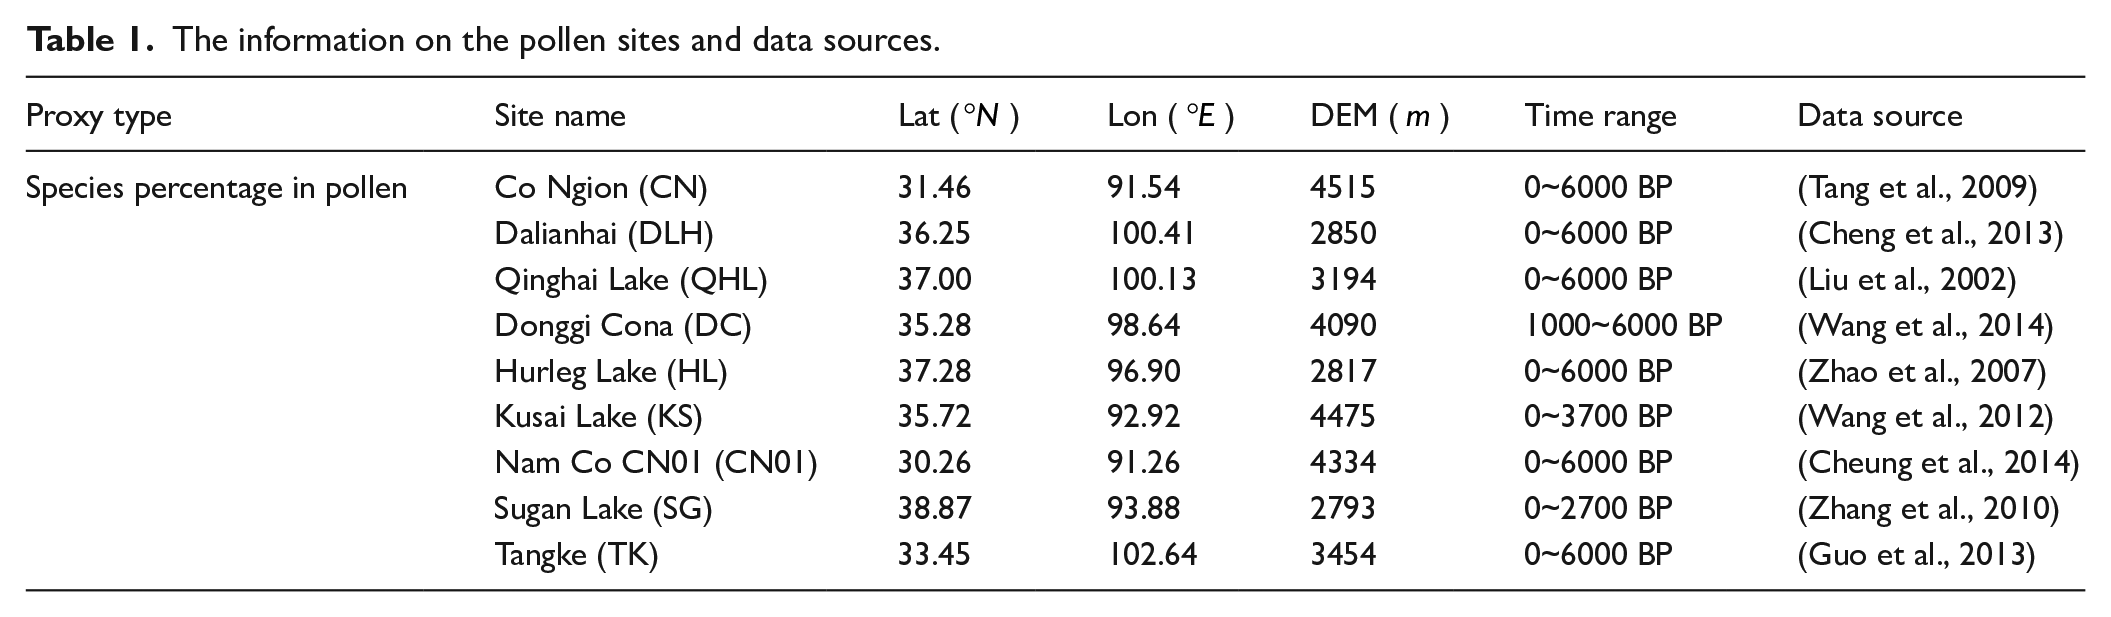
The data used in this study consist of climate data and pollen data. The climate data were collected from meteorological stations (maintained by the China Meteorological Administration), and the pollen data were collected from pollen sites (recorded in literatures). The locations of the meteorological stations and the pollen sites are indicated in Figure 1, with the additional information about the pollen sites presented in Table 1 and Appendix 1.
The information on the pollen sites and data sources.
In this study, climate data from 1951 to 2007 were used to analyze the spatial and seasonal distribution of climate variables, but the climate data in some stations are not available or only partially available for the period 1951–1960. Therefore, multi-variable linear functions were created between the meteorological stations with missing data and other stations. The linear functions are established based on the period 1961–2007 and then used to recover the climate data from 1951 to 1960. In addition, as the number of stations outside the THRH is higher than the number of years used for the regression, the direct use of stations outside the region as predictors will cause overfitting. Therefore, the principal component analysis (PCA) was used to process the climate data in the stations outside of the TRHR.
Methods
Figure 2 presents a schematic diagram of the method used in this study. It consists of two parts: (1) the extraction of the climatic data from the pollen samples and (2) the chronology reconstruction of the distribution of the paleobiome types from the climate distribution interpolated from the previous climate data.
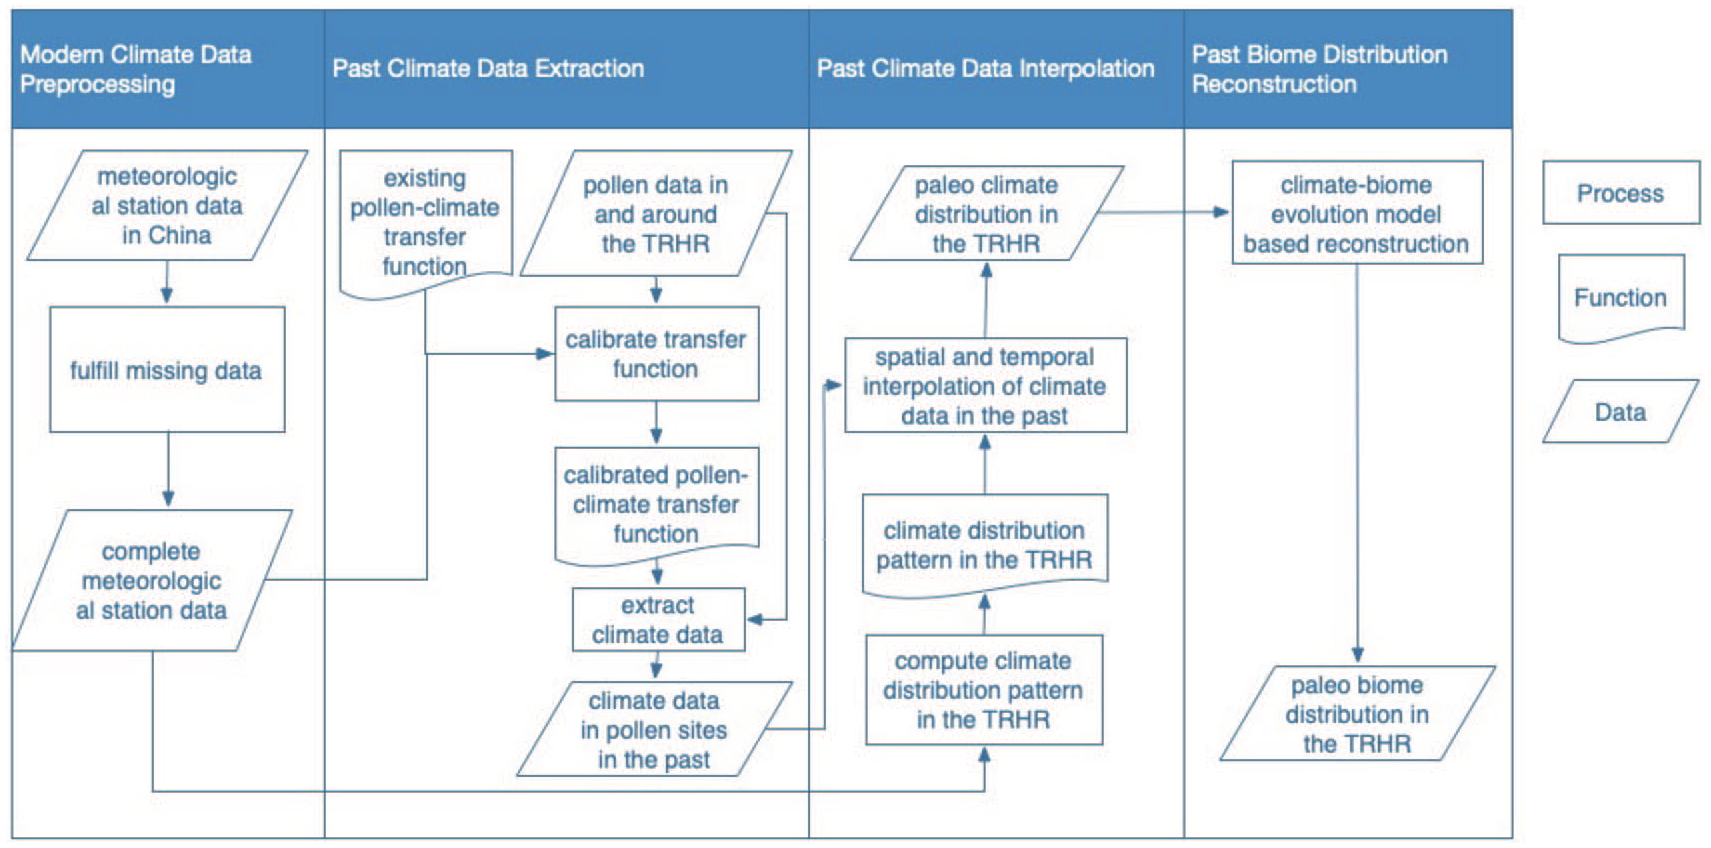
Schematic representation of the method used in this study. TJuly is the temperature in July; TJan is the temperature in January; and MAP is the mean annual precipitation.
Extraction of climate data
The method proposed by Shen et al. (2006) was adopted to extract the temperature and precipitation from the pollen samples, as it focuses on the central Qinghai-Tibetan Plateau – where the TRHR is located – and achieves high performances. Further, this method has been widely used in the studies of the climate change in the Qinghai-Tibetan Plateau (Tang et al., 2009) and other places around the world (Cañellas-Boltà et al., 2009; Chen et al., 2014). However, the method by Shen et al. (2006) has not been fine-tuned for the TRHR, so a calibration is adopted in this study. We conduct this calibration by building a linear regression between the climate data calculated from pollen samples and the climate data interpolated from the meteorological station in the pollen sites in the 1950s.
In detail, the CoKriging algorithm was used for the interpolation, by utilizing the correlations between different spatial points and the digital elevation model (DEM) as the covariable. In CoKriging, the DEM is selected as the covariable since there is often a strong correlation between the change of the elevation and the change of the climate variables. For instance, the change in temperature is controlled by the lapse rate because of the law of thermodynamics, and the relationship between elevation and precipitation in the TRHR could be described by a piecewise function (Shi et al., 2016).
After the linear function for calibration is built, the climate variables in the pollen sites in history were first calculated using the method by Shen et al. (2006), and then the linear regressions built were applied to generate the revised climate variables TJuly and MAP. Next, a linear regression was created using the modern data to predict the mean January temperature TJan from the mean July temperatures TJuly.
Reconstruction of the chronology of the distribution of the paleobiome types
To reconstruct the chronology of the distribution of the paleobiome types, the biome-climate model BIOME1 proposed by Prentice et al. (1992) was used, with the following advantages: (1) As a global model, BIOME1 can predict most plants and is robust in various climate conditions. (2) The climatic tolerances of plants are assumed to be similar to their Nearest Living Relatives (NLR) (Yao et al., 2009), so the model can be used for long-term research. (3) The model is straightforward compared to other models and only needs a limited number of parameters, making it a powerful tool in studies of the paleobiome where data are particularly scarce. And (4) the model has been frequently used in various fields, such as ecosystem, vegetation, climate, carbon cycling, and water resources (Neilson, 1995; Sitch et al., 2003).
The BIOME1 model utilizes the difference of the climatic tolerances of biomes to filter the biomes that can exist in a specific climate. After the climatic tolerances are calculated, the plant types that survive in a particular climatic environment, with the highest dominance (minimal D) in Appendix 1, are introduced into Appendix 2 to get the biome types.
In detail, the climatic tolerances include cold, chilling, heat, and moisture requirements. The original BIOME1 model also uses the soil type, which influences water storage, to distinguish soil moisture and runoff. In this study, however, the soil type was not included, and the capacity of water storage was set to be very large. The remaining climatic tolerances, in Appendix 1, are represented by mean temperature of the coldest month (Tc), growing degree-days on 5°C base (GDD5), growing degree-days on 0°C base (GDD0), mean temperature of the warmest month (Tw), and the Priestley-Taylor coefficient of annual moisture availability (α). For each pollen sites, to compute the growing degree-days, the following equation was used:

where Ti is the mean daily temperature of the day i and T0 is the temperature base (0 or 5°C). The daily temperature data are interpolated from the TJuly and TJan using the following equations, by assuming that the daily mean temperature follows a triangular function (Kilibarda et al., 2014).

where i means day i, 30.42 indicates the expected coldest day of the year, 365 is the length of the year, and k and d are parameters. The parameters k and d should be computed using the TJuly and TJan, and the mean daily temperature of day i is obtained as Ti. Next, the algorithm described in Prentice et al. (1992) and Prentice et al. (1993) was selected to compute the Priestley-Tayler coefficient α from the daily temperature, mean annual precipitation, and latitude.
Then, we transfer the data in pollen sites to grid data by performing a spatial interpolation. As the results of the BIOME1 model can only be accurate when the grid cell size is larger than 0.5° (Jarvis and McNaughton, 1986), the resolution of the interpolation in this study is set to 0.5° × 0.5°. The CoKriging method with the DEM data as the covariable was adopted to rasterize the climate data, but it requires a large number of sample points, while the number of pollen sample points in the TRHR is limited. Therefore, instead of directly using the climate data generated at the pollen sites, some multi-variable linear functions were applied to compute the climate data for meteorological stations in/around the TRHR from the data in pollen samples. These data in meteorological station were subsequently used to compute the grid-cell data by interpolation. In detail, the linear functions here are generated using the climate records in meteorological stations and pollen sites from 1961 to 2007, while the climate records in pollen sites in that period are generated using CoKriging spatial interpolation. Through this, the spatial pattern of the climate from 1961 to 2007 is transferred back to the history, assuming that the spatial pattern did not change.
Analysis and results
Data treatment and analysis
For the multivariable linear functions for filling the missing data from 1951 to 1960, 145 stations outside and 74 stations within/around the TRHR were used. In the PCA that preprocesses the data outside the TRHR, the top-ranked axes of which the sum of the ratios explained 95% of the variation were filtered and selected as predictors, and nineteen PCA axes were selected for TJuly and 31 for MAP. Then, the axes whose corresponding p-values in the linear regressions less than 0.1 were selected to retrain the linear regressions to get the final model. Table 2a summarizes the statistical results: The median of the R2 values of the TJuly regressions of all the in/around stations is 0.81, while that of MAP is 0.37, similar to the R2 value reported by other studies connecting the climate data with tree rings is also around 0.3 (He et al., 2014).
Results of data treatment and analysis. (a) statistics summaries of the R2 of regression functions to complete missing data in the period 1951–1960, and that of the regressions to predict climate data in the meteorological stations in/around the Three-River Headwaters Region (TRHR) from pollen sites; (b) results of the regressions for calibrating the original pollen transfer functions, and the results of the regressions for predicting TJan from TJuly; (c) statistics summaries of the cross-validation results of the CoKriging method interpolating climate data from the data in meteorological stations.
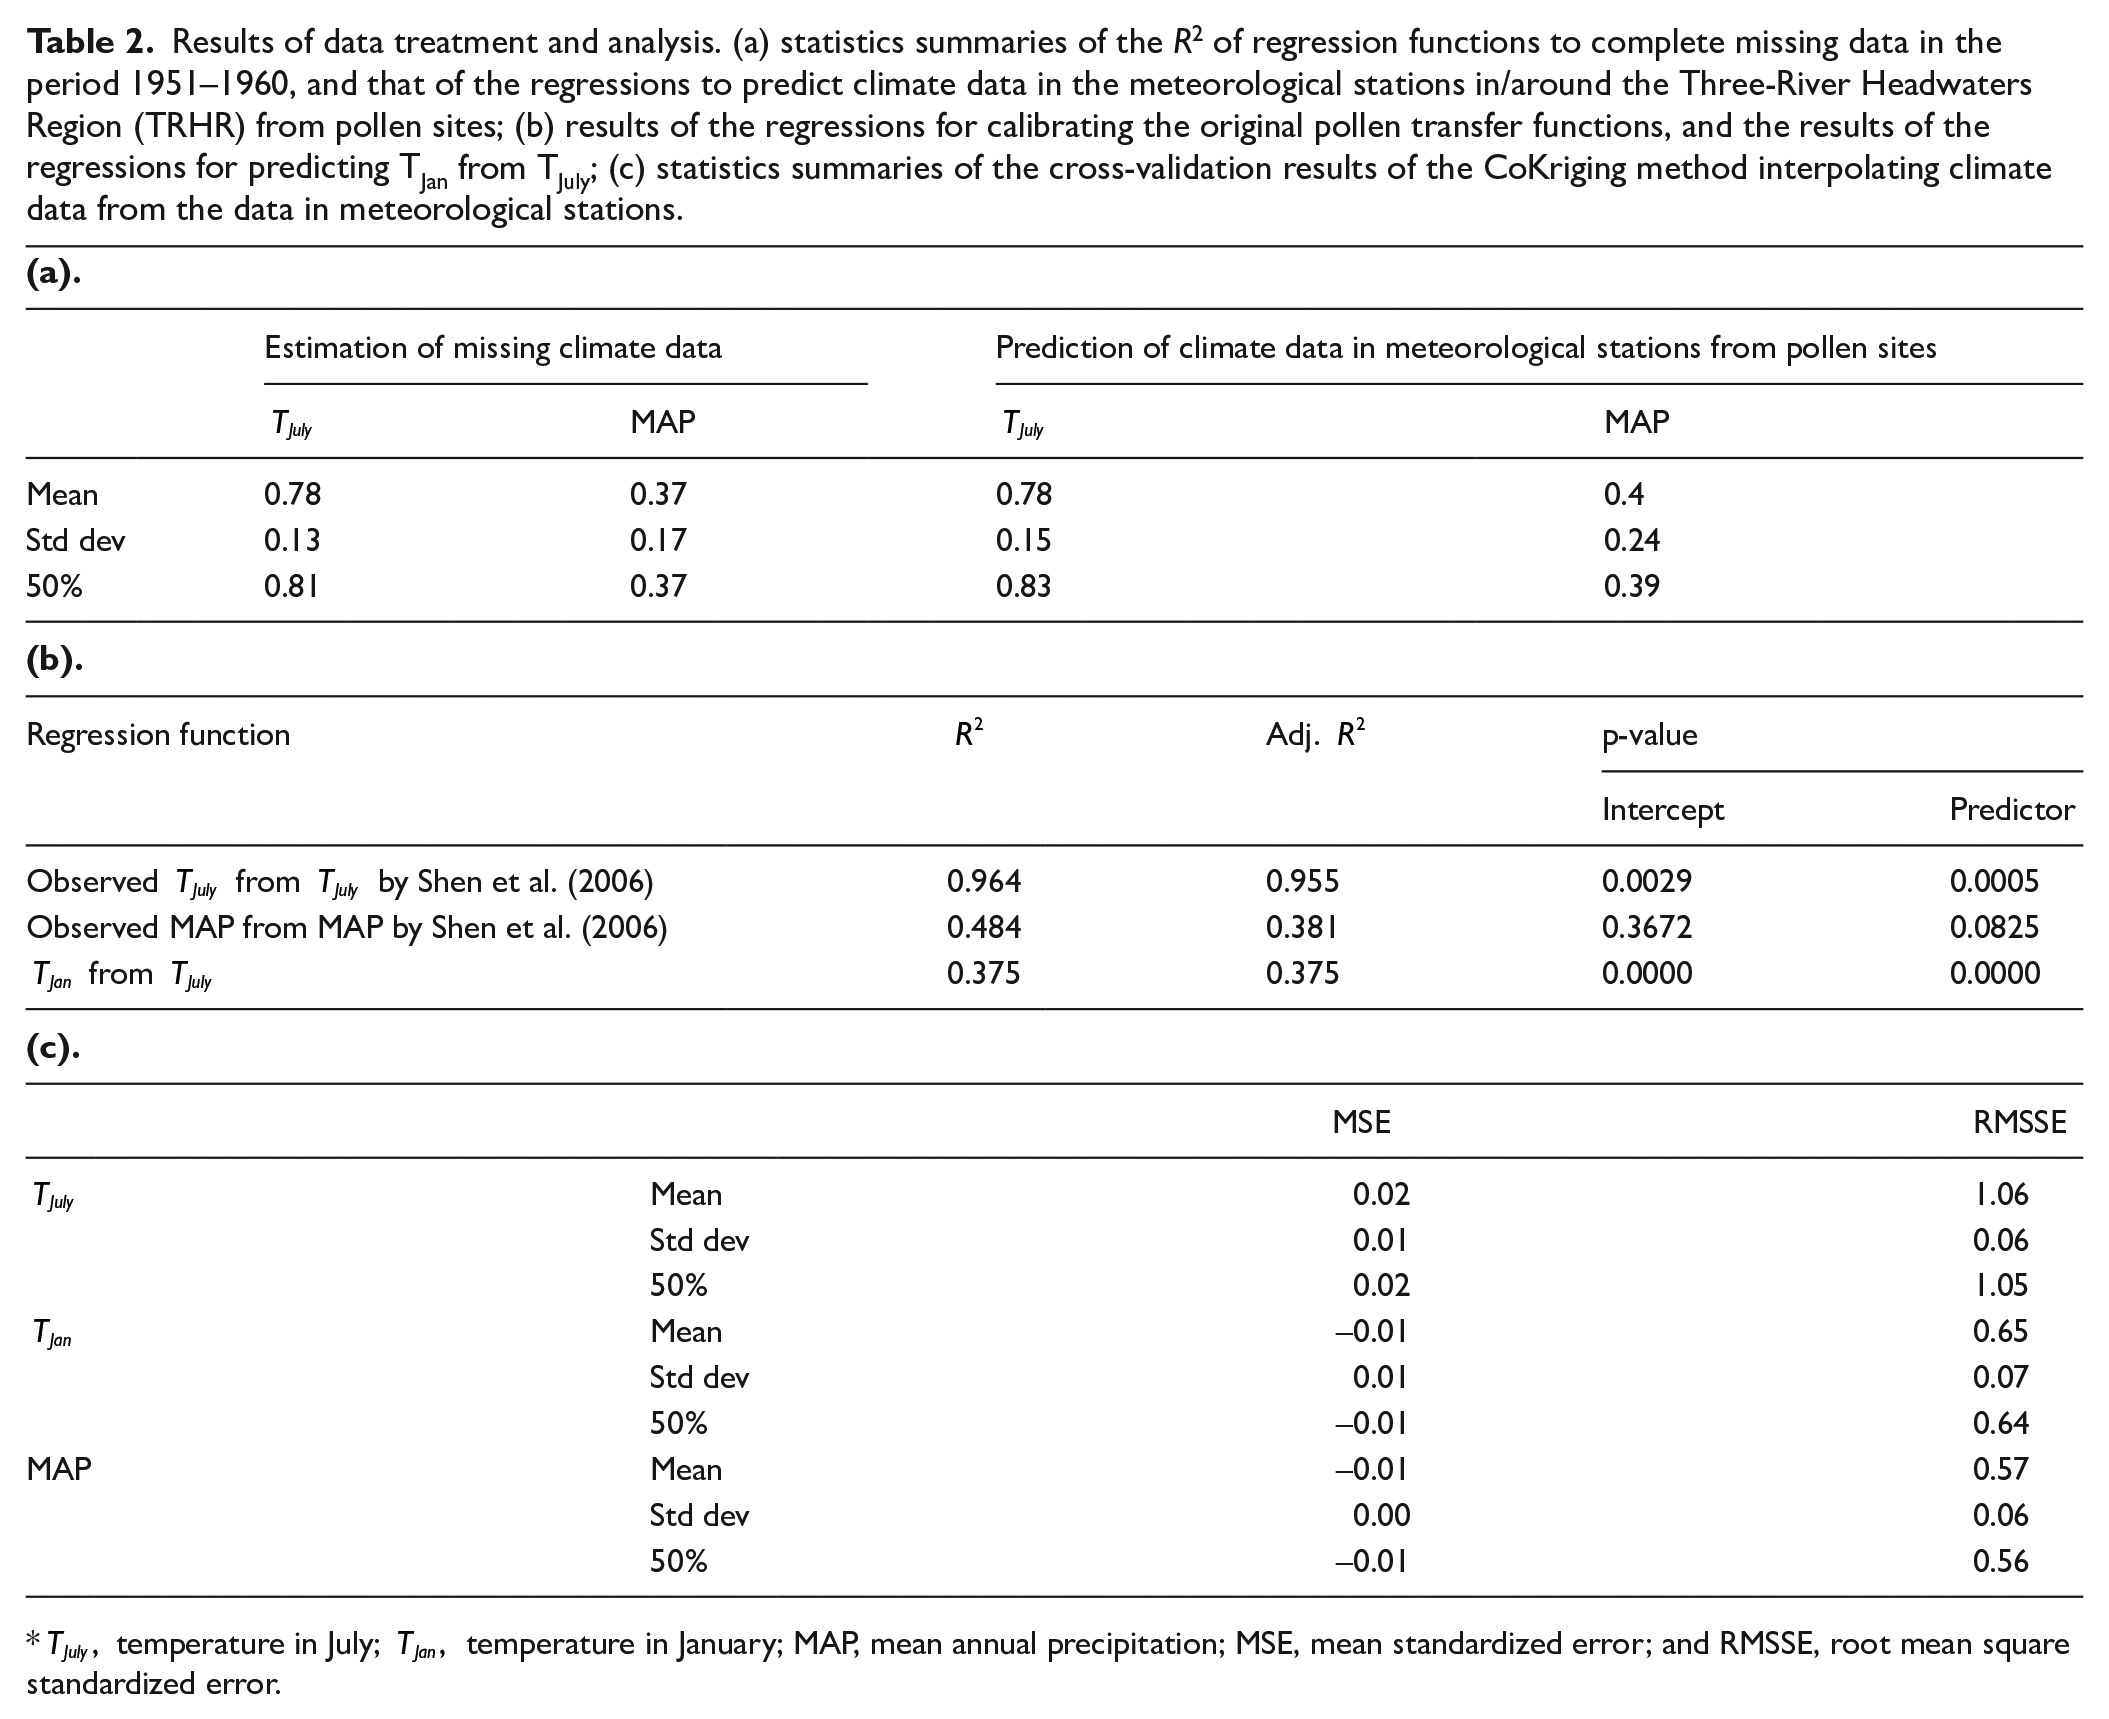
Next, for the linear functions calibrating the method proposed by Shen et al. (2006) and the linear function calculating TJan form TJuly, Table 2b presents the statistical results. Furthermore, the linear functions transferring the calibrated climate data in pollen sites to the meteorological stations in/around the TRHR are described in Table 2a. Finally, the statistical results of using the CoKriging method to spatially interpolate data from meteorological stations are listed in Table 2c. In detail, cross-validation was used, and the mean standardized error (MSE, mean error over prediction standard error) and root mean square standardized error (RMSSE, root mean square error over prediction standard error) were calculated to measure the accuracy and variability of the interpolations. The interpolations are considered highly acceptable because the MSEs are close to 0, and the RMSSEs are close to 1 (at least for Means and Medians).
Distribution of the biome types in history
As the results of our method, there are 151 biome cells in the TRHR area, and each grid cell is assumed to contain only one biome type in each time step (50 years). Figure 3 illustrates the spatial distribution of the biome types and that of the groups of the biome types in the TRHR during the whole study period. In this figure, if a biome type/group ever existed in a given data cell, that type/group will be marked over that cell, and if more than one type/group existed in different time steps, there would be an overlap of the symbols of the types/groups. The results indicate that 10 biome types existed in the history of the TRHR: tundra, semidesert, cool grass/shrub, taiga, ice polar desert, cool mixed forest, cold deciduous forest, cool conifer, cold mixed forest, and temperate deciduous forest. Furthermore, three groups of the biome types existed: non-tree (tundra, semidesert, and cool grass/shrub), tree (taiga, cool mixed forest, cold deciduous forest, cool conifer, cold mixed forest, and temperate deciduous forest), and ice polar desert.

Spatial distribution of the biome types in the history of the Three-River Headwaters Region (TRHR): (a) non-tree group and ice polar desert; (b) tree group; and (c) overview of the three groups of the biome types (the non-tree, tree, and ice polar desert groups).
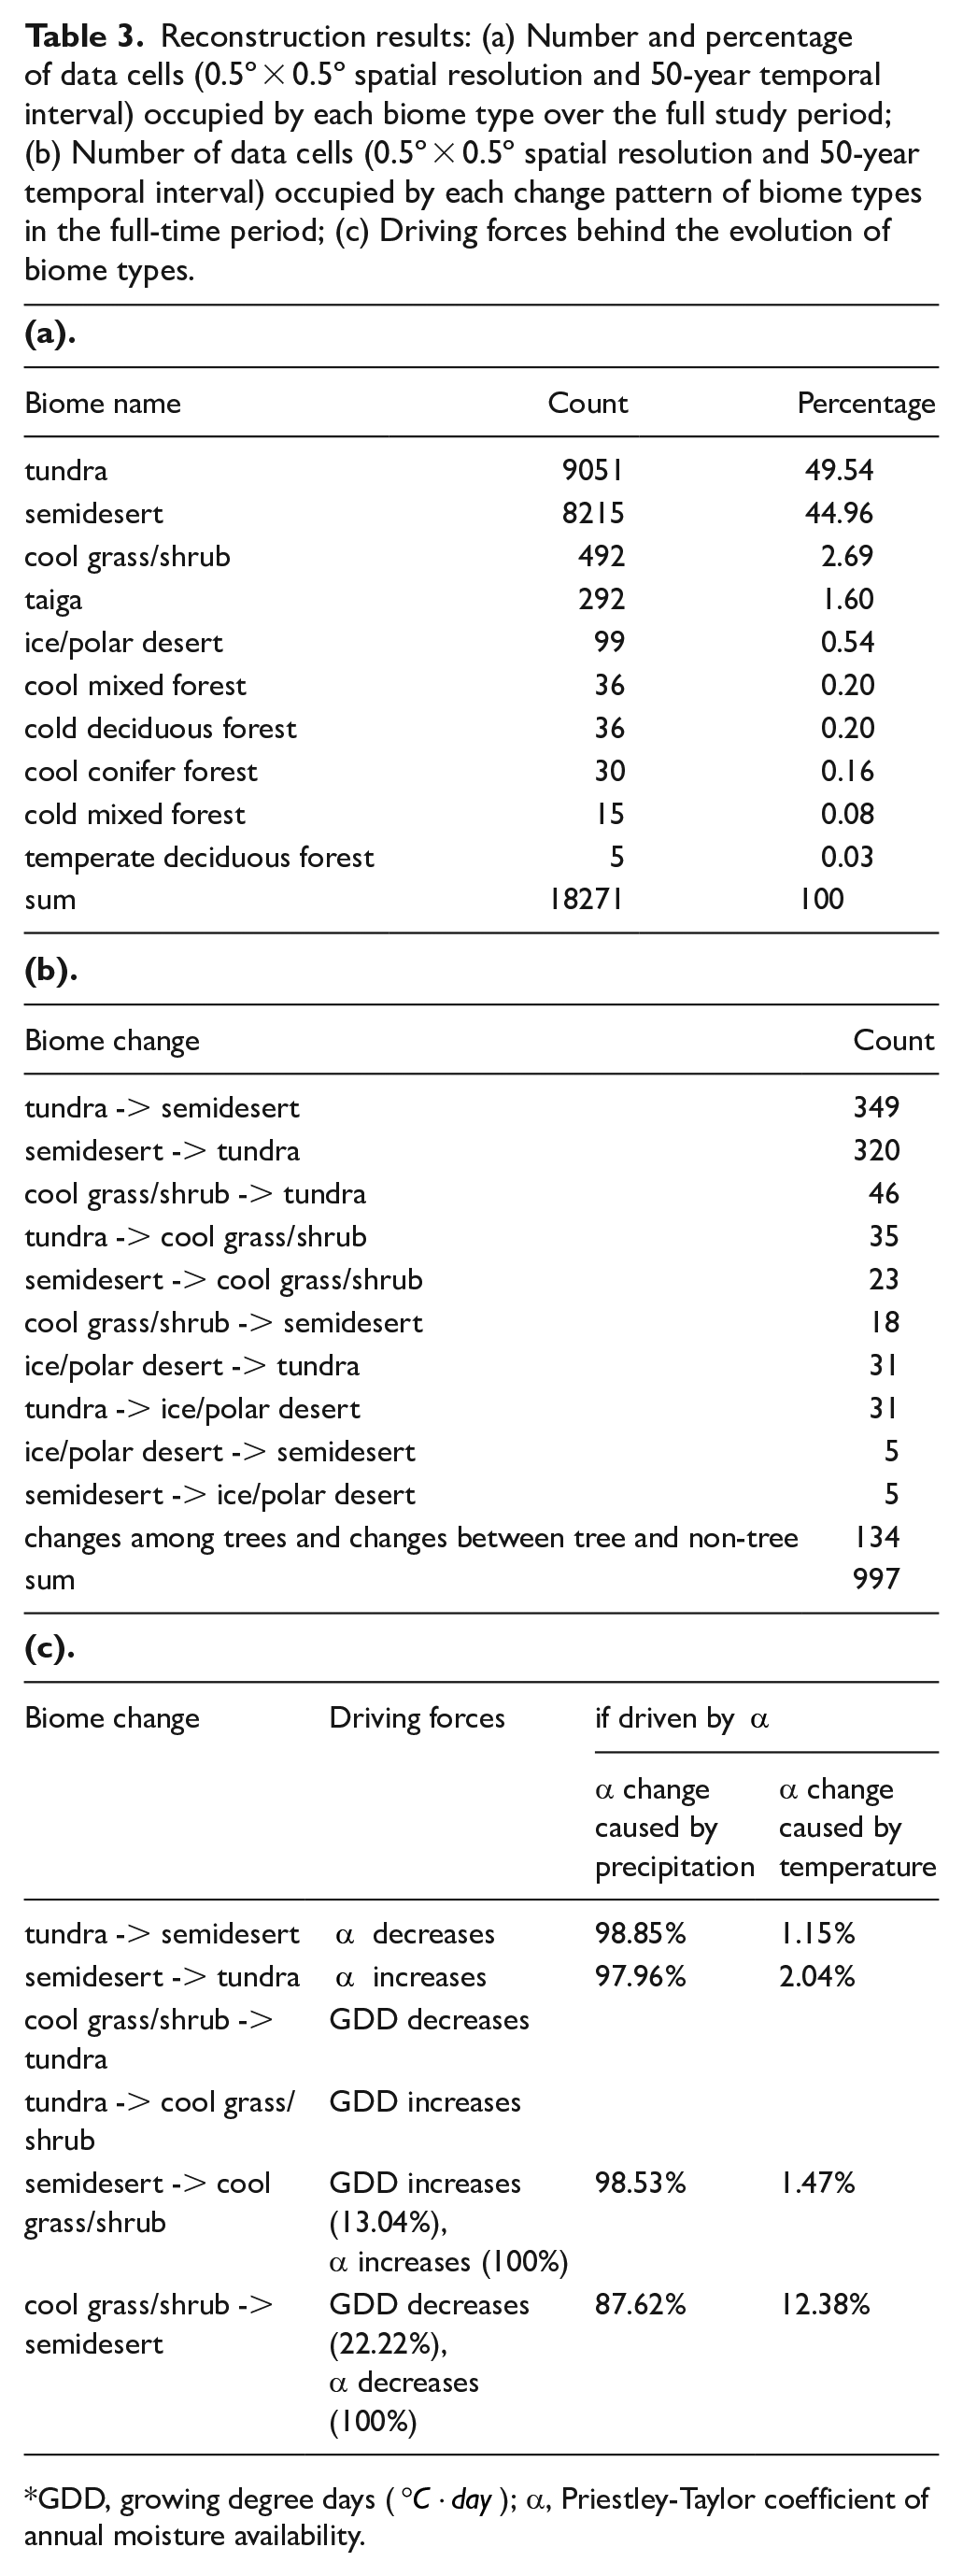
Further, it can be concluded that the non-tree biome types (tundra, semidesert, and cool grass/shrub) are the main biome types from the middle Holocene, for two reasons. The first reason is that, Figure 3c, which illustrates the spatial distribution of the three groups, shows that the non-tree biome types spread over all the spatial cells of the TRHR, while the remaining types existed in only about 22% of the area. The second reason is that, Table 3a, which sums up the number of spatial cells along the time axis for different biome types, presents that tundra and semidesert occupied more than 94% of the records over the study period.
Reconstruction results: (a) Number and percentage of data cells (0.5° × 0.5° spatial resolution and 50-year temporal interval) occupied by each biome type over the full study period; (b) Number of data cells (0.5° × 0.5° spatial resolution and 50-year temporal interval) occupied by each change pattern of biome types in the full-time period; (c) Driving forces behind the evolution of biome types.
GDD, growing degree days (
Among the main biome types, tundra is distributed in two main regions (see Figure 3a): The first region covers most of the area in the southeastern TRHR, with a boundary line from (90.5°E, 33.5°N) to (99.5°E, 36°N); and the second region is small and is located in the northwestern TRHR. By contrast, semidesert is mainly distributed in the central and northern parts of the TRHR, with a southern boundary around the latitude of 33.25°N; and adjacent, there is a second rectangular-shaped region occupied by semidesert, with a diagonal from (94.75°E, 33.2 °N) to (95.75°E, 31.75°N).
Evolution of the biome types in history
The results produced by the biome model suggest that the evolution of the distribution of the biome types in the TRHR followed specific rules, and a total of 36 change patterns existed from the middle Holocene to the present day, as presented in Table 3b. It can be inferred that the main change patterns are the bidirectional changes between tundra and semidesert, as the frequency of these patterns account for 67% of all the change patterns, while none of the other patterns occupies more than 5%. Together with that tundra and semidesert are the main biome types in the TRHR (see Section 4.2), tundra, semidesert and their non-tree group will be the focus of the further discussion.
Figure 4a shows the spatial distribution of the change patterns between tundra and semidesert in the TRHR. The two change patterns mainly existed in the northeastern, northwestern, and southwestern regions, and they together cover about 45% of the area. Figure 4b shows the directions and amounts of long-term changes of non-tree biome types in the TRHR from the middle Holocene. In this figure, the directions of arrows between circles show the long-term directions of the shifts among the non-tree biome types, while the arrows from or to the outside of the circles indicate whether the corresponding biome gained or lost area from the groups of tree and ice polar desert. The percentages above the arrows indicate the proportions of the total area changed in that direction, while the percentages below a biome type indicate the changed proportion of the area of that biome type.
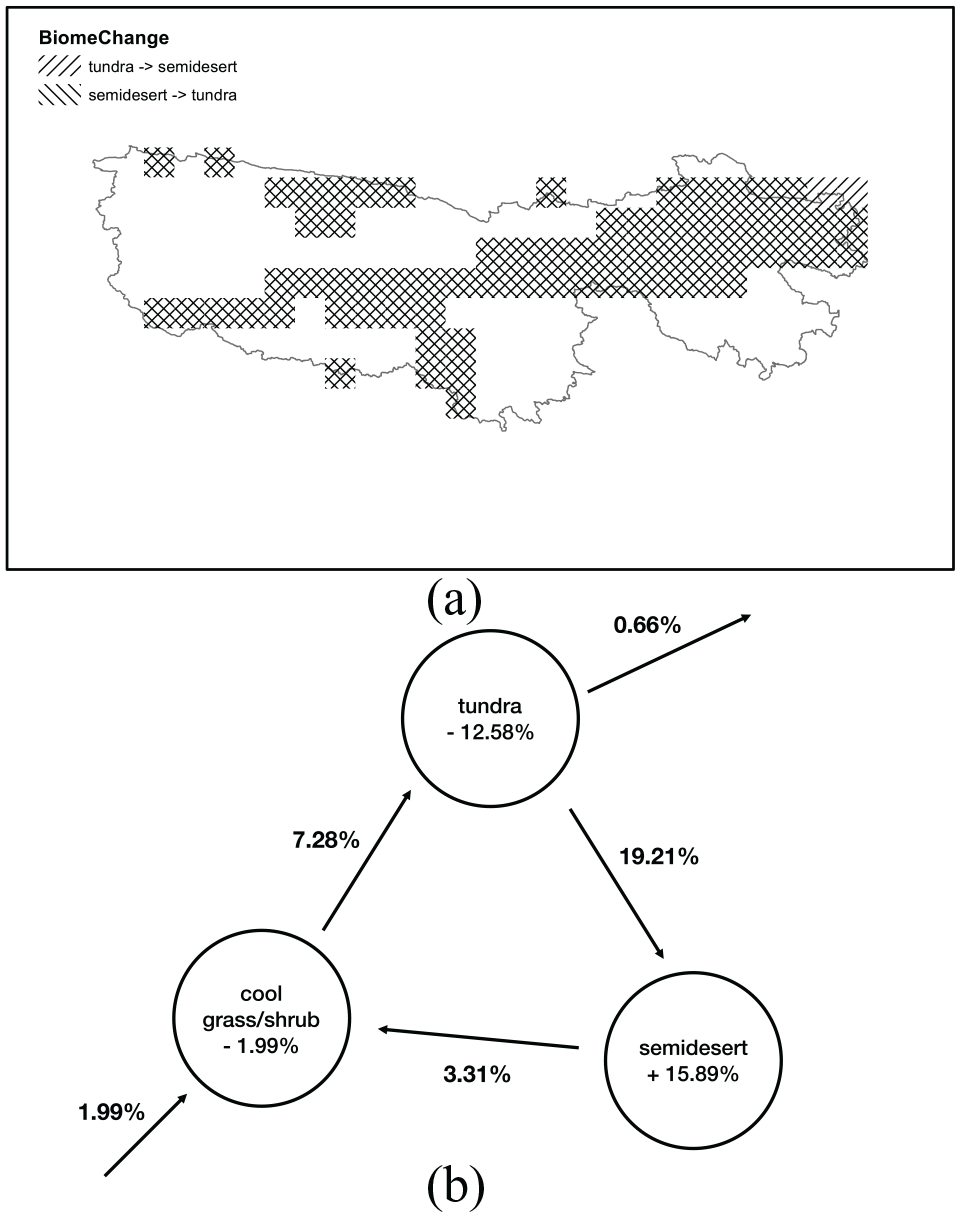
Change patterns of the biome types: (a) Spatial distribution of the main patterns of the biome type changes (bidirectional changes between tundra and semidesert); and (b) directions and amounts of the changes of the non-tree biome types from 6000 BP to 0 BP.
Further, Figure 4b demonstrates that the area of the semidesert type expanded, and the areas of both tundra and cool grass/shrub shrank. Furthermore, some areas from the tree group transferred to the non-tree group, as the sum of the changes of non-tree biome types is 1.32%. The biomass of the expanding semidesert type and non-tree group is lower than that of the shrinking tundra and cool grass/shrub types and tree group (Gibbs, 2006), resulting in a decrease of total biomass in the TRHR from the middle Holocene.
Figure 5 shows the temporal variations of changes between tundra and semidesert. In detail, Figure 5a compares the variations of the two patterns by plotting the number of changed cells in each time step for the two patterns, while Figure 5b presents the total variations of the two patterns by summing the mentioned numbers. As shown in Figure 5a, there are always lags between the nearest peaks belonging to the two patterns because the change from tundra to semidesert alternates with the change in the opposite direction. In Figure 5b, the changes of biome types during the period after 1AD have been far more intensive compared to the changes during the period before 1AD. Furthermore, regarding a period with an increasing change intensity followed by a period of decreasing intensity as a stage, the evolution of the biome types can be divided into five stages, as follows: (1) from about 4001BC to 2501BC; (2) 2501BC to 1651BC; (3) 1651BC to 51BC; (4) 51BC to AD700; and (5) AD700 to AD1700. The period since 1700 is short and the stage is incomplete, so this new stage is not discussed in this study. Around 2200BC, there is a big shift from tundra to semidesert, which requires further analysis.
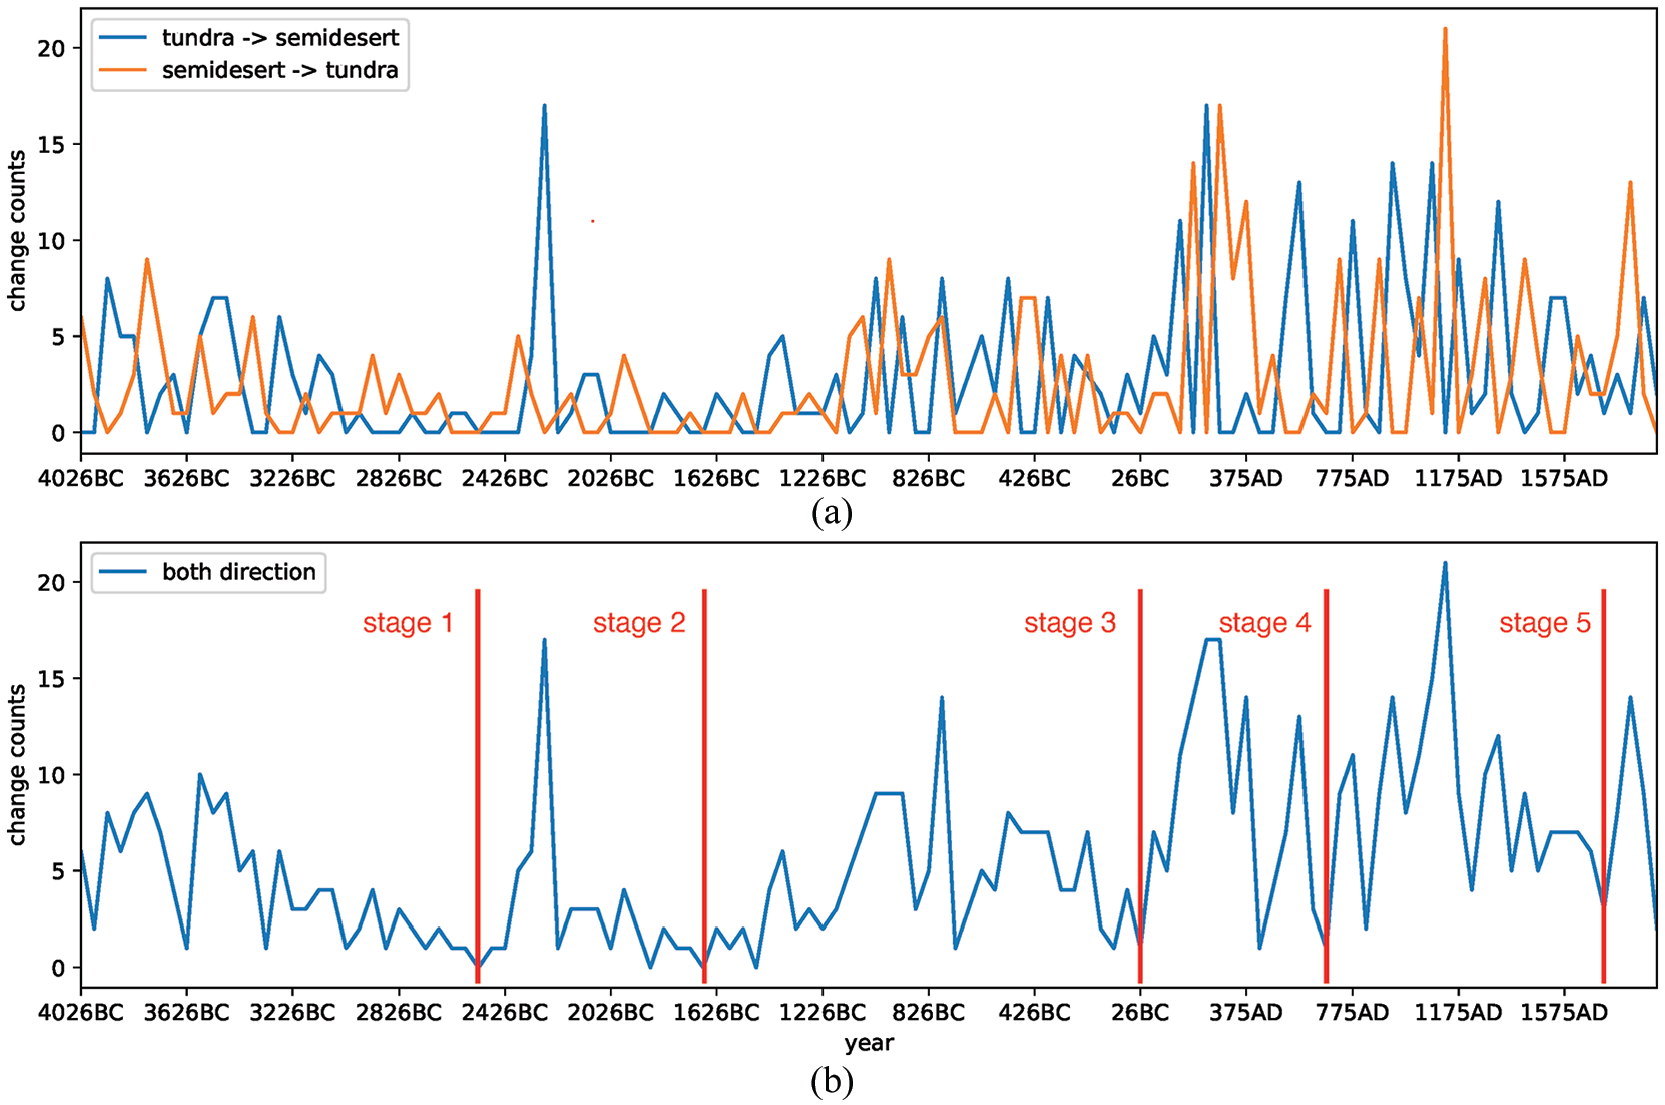
Temporal variations of changes between tundra and semidesert: (a) comparison of the two patterns; and (b) the total variation of the two patterns, where the red lines divide the process into five stages. The x-axis represents time, and the y-axis represents the number of data cells with changes at that time.
Climatic factors driving biome evolution
As described in Section 3.2, environmental constraints Tc, GDD, Tw, and α are highly related to the distribution of the biome types, so we analyze the evolution of the distribution based on these constraints. Based on Appendices 1 and 2, Table 3c shows that the bidirectional changes between tundra and semidesert must be accompanied with the changes in the α, and the bidirectional changes between tundra and cool grass/shrub must be with the changes in the GDD. What’s more, Table 3c also presents that the bidirectional changes between semidesert with cool grass/shrub must be with the changes in the α constraint, and sometimes with the GDD change. Together with that the bidirectional changes between tundra and semidesert is the main change pattern, it can be concluded that α is the main driving force behind biome changes in this region, followed by GDD.
In detail, GDD changes are mainly caused by temperature fluctuations, while changes in α are controlled by both temperature and precipitation. Further, according to Prentice et al. (1992, 1993), α are positively correlated with precipitation and negatively correlated with temperature, so the following equations were used to determine the causes of α changes:


where P represents the mean annual precipitation and T represents the evaporation, which is controlled by temperature. The subscript 1 refers to the end of the change, while the subscript 0 refers to the start of the change. Based on the two equations, Table 3c summarizes the “α change caused by precipitation” and “α change caused by temperature,” and it suggests that precipitation is the main reason for the changes in α. Together with that α is the main driving force, it can be inferred that precipitation could be the main driving force behind the evolution of the distribution of biome types in the TRHR, followed by temperature. In addition, Figure 4b shows that there are more changes from tundra to semidesert than from cool grass/shrub to tundra and from semidesert to cool grass/shrub. Therefore, based on Table 3c, the decreases in precipitation and temperature are the main causes of the paleobiome-type changes in the TRHR in the long term.
Discussion
Two factors, with little impact on the results, were ignored to simplify the method. The first factor is the human activity, which is weak because the population in the TRHR is scarce as it is located in the west side of the geo-demographic demarcation line (Heihe-Tengchong Line) of China. In detail, the west side occupies 57% of the area of China but only contains 6% of the population in 2002 (Naughton, 2007), and the population size of the TRHR is 590,000 in 2002, which is small compared with the area of 364,000 km2. Therefore, human activities only contributed 13% of the change of the vegetation productivity while the climate contributed 87% in recent years (Li et al., 2016).
The second factor is the geological uplift: If the elevation had changed dramatically from mid-Holocene, the method which uses elevation would be unfeasible. The factor was ignored because according to Chevalier et al. (2011), only the northeastern part of the Qinghai-Tibetan Plateau has continued to rise since 10,000 BP, while the TRHR stopped rising in 5,330,000 BP.
However, some factors with a potential effect on the results were also ignored. The first factor is the water capacity of the soil, which was set to be infinite and provides more water support for vegetation growth than the real situation; so causes some aberrations such as tundra being determined as a cool grass/shrub biome. The second factor is the slope of the ground, which was assumed to not influence plant growth. However, a steep slope contains less or no vegetation, so ignoring this factor might result in an underestimation of the desert in the model. The last factor that was ignored in this study was the ecological pressure caused by plant-eating animals that can change the local ecology and decrease the stability of the environments. These factors will be introduced in future studies.
Besides the considerations mentioned above, the results in this study were compared with other research to estimate the feasibility of this study. First, the results in this study were compared with a dataset of the current distribution of biome types, built from BIOME6000 (Prentice and Thompson, 1998) and in the form of data points. The comparison shows that there are 12 modern biome points in the TRHR, of which 7 points match the results of our study. In detail, the 34.5°N latitude line includes four out of the five mismatched points, and in these four cases, tundra in the dataset is detected as semidesert in the results. Since tundra is located in the south and semidesert in the north, the boundary between tundra and semidesert is shifted 0.5° south in the results compared to the BIOME6000 dataset. The discrepancy may be caused by the rejection of the factors mentioned above or by a bias in the interpolating steps due to the uneven distribution from north to south of the pollen sites. Therefore, the number of the pollen sites will be expanded in future studies to alleviate this issue.
The distribution of the biome types in Mid-Holocene (6000 BP) was also used to estimate the results in this study, as the Mid-Holocene is a classic period used by the paleoclimate modeling community to check the feasibility of model results (Yu et al., 1998). In this evaluation, two paleobiome datasets were chosen: The first one is the same as in the modern dataset test, constructed by BIOME6000 (Prentice and Thompson, 1998), and the second one is a dataset from Yu et al. (2000). These datasets only contain two biome points located in the TRHR, and the first point is located at (34.5°N, 92°E), while the second point is located at (34.5°N, 92.5°E). The biome types of these points are all semidesert, which matches the results in this study, but the number of data points is small and needs to be expanded in future studies.
Further, the results of this study could be confirmed by Herzschuh et al. (2010). From the latter paper, the changes from trees to steppe vegetation occurred step-wise around Qinghai Lake since the middle Holocene, and the temperate steppe was gradually replaced by high-alpine meadows on the central and eastern Qinghai-Tibetan Plateau in the same period. Also, this paper discovered that deserts expanded around Hurleg Lake after 6500 BP and retreated again after 2600 BP, all consistent with our results. Besides, our results could also be confirmed by Zhu et al. (2008), which described that the environment in the central Qinghai-Tibetan Plateau changed from warm-humid to cold-dry since 6000 BP. Because our results show that decreases in precipitation and temperature are the main causes of the change of the biome types in the TRHR in the long term.
Finally, it should be noticed that the sampling frequency and the accuracy of pollen records decrease when going further back in geological time, which may result in inaccuracies in the ancient time. Therefore, a comparison with related research is needed in future studies. In addition, as described in section 4.1, the complex data interpolation process is achieved by the interactions among meteorological stations and pollen sites. The interaction loop ran only once in this study, but more loops mean more consistent and accurate results. This should be included in future studies.
Conclusion
This study reconstructs the chronology of paleobiome distributions in the Three-River Headwaters Region in China from the middle Holocene (i.e. 6000 BP–0 BP), using a popular physiological model BIOME1 (Prentice et al., 1992). The climate inputs for this model were extracted from pollen data by calibrating existing pollen transfer functions and by using complicated spatial and temporal interpolations.
The results indicated the existence of 10 different biome types in the history of the TRHR, which can be categorized into three major groups: the non-tree biomes, the tree biomes, and the ice polar/desert. The results also indicated that the non-tree biomes, especially the tundra and semidesert types, were the main biome types in the region. Overall, the changes in the distribution of the biome types were found to be controlled by 36 patterns, and the bidirectional changes between tundra and semidesert were the most dominant ones. The alternations of the biome types also indicated that the long-term directions of the evolution of the biomes were from tundra to semidesert. Based on the intensity of the changes, five distinct stages of biome-type evolution were identified. Precipitation was the main driving force for changes in the distribution of biome types, while temperature also had an influence. In addition, the decreases in precipitation and temperature are the main causes of the paleobiome type changes in the TRHR in the long term.
Supplemental Material
Appendices – Supplemental material for Reconstructing the distribution of the paleobiome types in the Three-River Headwaters Region in China from the middle Holocene
Supplemental material, Appendices for Reconstructing the distribution of the paleobiome types in the Three-River Headwaters Region in China from the middle Holocene by Xin Mao, Tiejian Li, Chen Chen, Jiaye Li, Bellie Sivakumar and Jiahua Wei in The Holocene
Footnotes
Funding
The author(s) disclosed receipt of the following financial support for the research, authorship, and/or publication of this article: This study was supported by the National Key Technologies Research and Development Program of China (2016YFE0201900, 2017YFC0403600), the Fund for Public Welfare of the Ministry of Water Resources of China (201501028) and the National Natural Science Foundation of China (51579131, 91547204).

Data Availability
Data used in this paper from references and the Internet are listed below.
1.
Physiological biome model (see also appendix 1 and 2):
[1] Prentice IC, Cramer W, Harrison SP et al. (1992) Special paper: a global biome model based on plant physiology and dominance, soil properties, and climate. Journal of Biogeography 19(2): 117.
2.
Pollen transfer functions:
[1] Shen C, Liu K, Tang L et al. (2006) Quantitative relationships between modern pollen rain and climate in the Tibetan Plateau. Review of Palaeobotany and Palynology 140(1–2): 61–77.
3.
Pollen data
[1] Cheng B, Chen F, and Zhang J (2013) Palaeovegetational and palaeoenvironmental changes since the last deglacial in Gonghe Basin, northeast Tibetan Plateau. Journal of Geographical Sciences 23(1): 136–146.
[2] Cheung MC, Zong Y, Zheng Z et al. (2014) A stable mid-late Holocene monsoon climate of the central Tibetan Plateau indicated by a pollen record. Quaternary International 333: 40–48.
[3] Guo C, Luo F, Ding X et al. (2013) Palaeoclimate reconstruction based on pollen records from the Tangke and Riganqiao peat sections in the Zoige Plateau, China. Quaternary International 286. Climate and Vegetation Dynamics, eastern Asia: 19–28. DOI: 10.1016/j.quaint.2012.09.027.
[4] Liu X, Shen J, Wang S et al. (2002) A 16000-year pollen record of Qinghai Lake and its paleo-climate and paleoenvironment. Chinese Science Bulletin 47(22): 1931.
[5] Tang L, Shen C, Li C et al. (2009) Pollen-inferred vegetation and environmental changes in the central Tibetan Plateau since 8200 yr BP. Science in China Series D: Earth Sciences 52(8): 1104–1114.
[6] Wang Y, Liu X, Herzschuh U et al. (2012) Temporally changing drivers for late-Holocene vegetation changes on the northern Tibetan Plateau. Palaeogeography 353–355: 10–20.
[7] Wang Y, Herzschuh U, Shumilovskikh LS et al. (2014) Quantitative reconstruction of precipitation changes on the NE Tibetan Plateau since the Last Glacial Maximum - extending the concept of pollen source area to pollen-based climate reconstructions from large lakes. Climate of the Past 10(1): 21–39.
[8] Zhang K, Zhao Y, Yu Z et al. (2010) A 2700-year high resolution pollen record of climate change from varved Sugan Lake in the Qaidam Basin, northeastern Tibetan Plateau. Palaeogeography 297(2): 290–298.
[9] Zhao Y, Yu Z, Chen F et al. (2007) Holocene vegetation and climate history at Hurleg Lake in the Qaidam Basin, northwest China. Review of Palaeobotany and Palynology 145(3): 275–288.
4.
Meteorological station data
[1] China Meteorological Data Service Center by China Meteorological Administration at http://data.cma.cn/en/?r=data/index&cid=6d1b5efbdcbf9a58
Supplemental Material
Supplemental material for this article is available online.
References
Supplementary Material
Please find the following supplemental material available below.
For Open Access articles published under a Creative Commons License, all supplemental material carries the same license as the article it is associated with.
For non-Open Access articles published, all supplemental material carries a non-exclusive license, and permission requests for re-use of supplemental material or any part of supplemental material shall be sent directly to the copyright owner as specified in the copyright notice associated with the article.
