
Abstract
In this study, we compared new testate amoeba records produced by the conventional water-based wet-sieving method to testate amoeba data from previous palynological analyses of two Holocene peat profiles from British Columbia, Canada. We used 132 paired samples from the same peat cores to compare the composition of testate amoeba assemblages between the two methods and evaluate the potential of palynological testate amoeba records as quantitative paleohydrological proxies in peatlands. Our results suggest that the palynological treatments (acetolysis, 10% KOH and 150 µm sieving) substantially reduce test concentrations, diversity and richness in most pollen-slide samples. The smaller sieve size used in the palynological treatment (i.e. 150 µm) removed only a small fraction of the total tests, but could introduce a species-specific bias in assemblage composition. However, major shifts between wet and dry conditions, as shown by the water table depth (WTD) reconstructions using wet-sieved samples, were relatively well captured by the palynological datasets in most instances. The palynological assemblages with counts of >50 tests (n = 30) provided WTD estimates similar to those inferred from the wet-sieved samples as the most dominant hydrophilous and xerophilous taxa were relatively well represented in the pollen-slide samples in the two studied peat cores. Testate amoeba data from pollen slides can provide useful paleohydrological information particularly when combined with other paleoenvironmental proxies. Nonetheless, if the goal is to generate quantitative paleohydrological reconstructions, we recommend that testate amoeba analyses be conducted using the wet-sieving method, as testate amoeba concentrations, diversity and richness are typically much lower in samples prepared with palynological treatments.
Keywords
Introduction
Testate amoebae are a polyphyletic group of protists widely used as proxies of past hydrological changes in peatland ecosystems (Mitchell et al., 2008a). They are abundant and diverse in peatlands, especially in Sphagnum bogs, and their shells (tests) are well preserved over millennia. The tests of these microorganisms are commonly used to reconstruct changes in water table depth (WTD) using modern training sets developed from a variety of peatland types, mainly in northern high-latitudes (Beaulne et al., 2018; Lamarre et al., 2013; Payne et al., 2006). Recently, testate amoeba transfer functions were developed at the continental scale in North America and Europe (Amesbury et al., 2016, 2018) and research has been expanding worldwide to peatlands from arctic permafrost sites (Swindles et al., 2015) and tropical regions (Swindles et al., 2014).
Testate amoebae are commonly encountered in peat-based palynological studies (Payne et al., 2012). The tests identified on pollen slides are typically included among non-pollen palynomorphs and have been used as additional indicators of past surface wetness variability in peatlands while reconstructing local and regional vegetation dynamics (e.g. Garneau, 1998; Kuhry, 1997; Lacourse et al., 2019; Lavoie and Richard, 2000; van Geel, 1978; van Geel et al., 1981). It is generally assumed that testate amoeba analyses from pollen slides provide poor paleohydrological records compared to those obtained using the conventional wet-sieving preparation method (Hendon and Charman, 1997). The treatments used to isolate pollen and spores from peat such as acetolysis, KOH and sieving can cause significant loss of testate amoebae and affect the composition of assemblages (Hendon and Charman, 1997), although weak concentrations of KOH can help concentrate tests in wet-sieved samples (Barnett et al., 2013; Charman et al., 2010). Moreover, the number of tests counted on pollen slides is often too low to provide representative assemblages that can be used to produce reliable quantitative paleohydrological reconstructions with transfer functions (e.g. >50 tests; Payne and Mitchell, 2009; Payne et al., 2012). Consequently, most previous palynological studies have interpreted the remains of testate amoebae, alongside other relevant non-pollen palynomorphs, as indicator taxa for wet and dry surface conditions, as suggested by the presence of hydrophilous and xerophilous taxa rather than as a basis for quantitative WTD reconstruction (Karpińska-Kołaczek et al., 2018; Lacourse and Davies, 2015; Muller et al., 2003).
Few studies have compared the composition of testate amoeba assemblages obtained by the two preparation methods in fossil peat samples. Hence, the potential of testate amoebae as paleohydrological indicators in palynological studies needs to be better investigated in order to improve their use in further studies. In this study, we compare new testate amoeba records produced by the conventional wet-sieving method to testate amoebae data from previous palynological studies on the same two Holocene peat profiles (Lacourse and Davies, 2015; Lacourse et al., 2019). The main objectives are to (1) compare the composition of testate amoeba assemblages based on taxa concentrations and relative abundances, (2) determine the differences in taxa diversity and richness, and (3) evaluate the potential of palynological testate amoeba assemblages as quantitative proxies of paleohydrological changes in peatlands.
Material and methods
Study sites
Testate amoeba analyses were conducted on Holocene peat cores obtained from two bogs located 160 km apart on Vancouver Island in British Columbia, Canada. Both peatlands were the focus of previous multi-proxy paleoecological studies that included analyses of pollen, macrofossils, carbon, and nitrogen, and identification of testate amoebae, among other non-pollen palynomorphs (Lacourse and Davies, 2015; Lacourse et al., 2019). Port McNeill Bog (PMB) is a small (20 ha) ombrotrophic bog dominated by Sphagnum and ericaceous shrubs, with an average summer water table depth of 20 cm. Grant’s Bog (GB) is part of a large wetland complex (70 ha) and is also a Sphagnum-ericad bog. Water table depth was 16 cm at the coring location in July 2013. Both peatlands formed in the early Holocene following lake infilling and both are characterized by substantial changes in peat type and accumulation rates over the Holocene. Details on the two peatlands, sampling methods, paleoenvironmental reconstructions and chronologies are provided in Lacourse and Davies (2015) and Lacourse et al. (2019).
Testate amoeba analyses
In this study, new testate amoeba records were produced for both study sites using the conventional wet-sieving method and then compared to testate amoeba data previously obtained from standard palynological analyses. Lacourse and Davies (2015) and Lacourse et al. (2019) prepared peat samples (1–2 cm3) for pollen and non-pollen palynomorph analyses (including testate amoebae) using 150 µm sieving, 10% KOH for 8 min, and acetolysis for 2.5 min. Samples were not treated with hydrofluoric (HF) and hydrochloric (HCl) acids, although 10% HCl was used to dissolve tablets of Lycopodium spores for estimating microfossil concentrations. Residues were mounted on slides in 2000 cs silicone oil. Fresh peat samples (1–2 cm3) were collected from the same cores at the same depths subjected to these palynological preparations, providing 132 pairs of samples. These new peat samples were prepared using the wet-sieving extraction method that does not involve any chemical treatments (Booth et al., 2010). Peat samples were gently boiled for 10 minutes in distilled water, washed through 250 μm mesh to remove coarse material and then back-sieved through 15 μm mesh to remove the fine fraction. For both preparation methods, one tablet of Lycopodium spores (Batch 177745: 18,584 ± 829 spores) was added to each sample to calculate the concentrations of testate amoebae.
Testate amoebae were counted using a light microscope at 400× magnification. For the palynological samples, testate amoebae were counted until the pollen analysis was completed, which is common practice when non-pollen palynomorphs are identified at the same time as pollen and spores. For samples prepared by the wet-sieving method, we attempted to reach a minimum count of 100 tests per sample, but for some samples with low test concentrations (e.g. highly decomposed peat), a count of >50 tests was considered reliable (Payne and Mitchell, 2009). To evaluate if the use of a smaller sieve size in the palynological preparations compared to the wet-sieving method (150 vs 250 µm) affected apparent assemblage composition, we also counted the number of large tests (>150 µm on the short axis) in all wet-sieved samples.
Comparison of testate amoeba assemblages between the two methods
Differences in testate amoeba assemblages between the two methods were first assessed based on the concentrations (tests cm−3) and relative abundances (% of the total count) of taxa for the 132 pairs of samples analysed in the two peat cores. Test counts are generally much lower in palynological than in wet-sieved samples, which can significantly reduce the taxonomic diversity and richness of testate amoeba assemblages (Payne and Mitchell, 2009, Payne et al., 2012). Consequently, for further comparison of testate amoeba assemblages, we focussed on 30 pairs of samples for which at least 50 tests were counted in both methods. While identifying tests in the wet-sieved samples of these 30 pairs, we also recorded the assemblage composition (%) when the test count size was the same as that previously reached in the palynological samples. We used these assemblages when calculating taxa diversity and richness. This step was taken to ensure that the diversity and richness estimates for these 30 pairs were calculated using the same sample size for both methods. Taxonomic diversity was calculated for these assemblages using the Shannon Diversity Index (Shannon, 1948).
Quantitative reconstruction of water table depth
Water table depths (WTD) were reconstructed using a weighted averaging model with tolerance downweighting and inverse deshrinking (WA-Tol inv) with the transfer function of Amesbury et al. (2018), which includes 1730 modern testate amoeba samples from 126 peatlands throughout North America. The Amesbury et al. (2018) transfer function is based on 64 taxa, of which 48 occur at our two study sites, and performs reasonably well (r2 = 0.72, RMSEP = 7.42 cm, maximum bias = 13.87 cm). All testate amoeba taxa encountered in the two studied cores are included in the North American transfer function. Sample-specific standard errors on the inferred WTD values were estimated using bootstrapping (1000 cycles). WTD reconstructions were conducted on all testate amoeba assemblages from the two methods. High WTD values indicate drier surface conditions, whereas low WTD values indicate wetter conditions.
Multivariate analyses
In order to explore differences in testate amoeba assemblages between the two methods, non-metric multidimensional scaling (NMDS) analyses were conducted on the relative abundance data (%) using the Bray-Curtis dissimilarity index in CANOCO 5.1 software (ter Braak and Smilauer, 2012). NMDS analyses were performed on the entire dataset of samples analysed with the two methods. NMDS axis 1 scores were used to summarize the ecological information in testate amoebae communities and were plotted alongside the WTD reconstructions for comparison. The zonation of testate amoeba percentage data (%) was conducted using stratigraphically-constrained cluster analyses (CONISS) with the rioja package (Juggins, 2015) in R. The number of significant zones was assessed with a broken-stick model (Bennett, 1996).
Results
Testate amoeba taxa occurrence and concentration
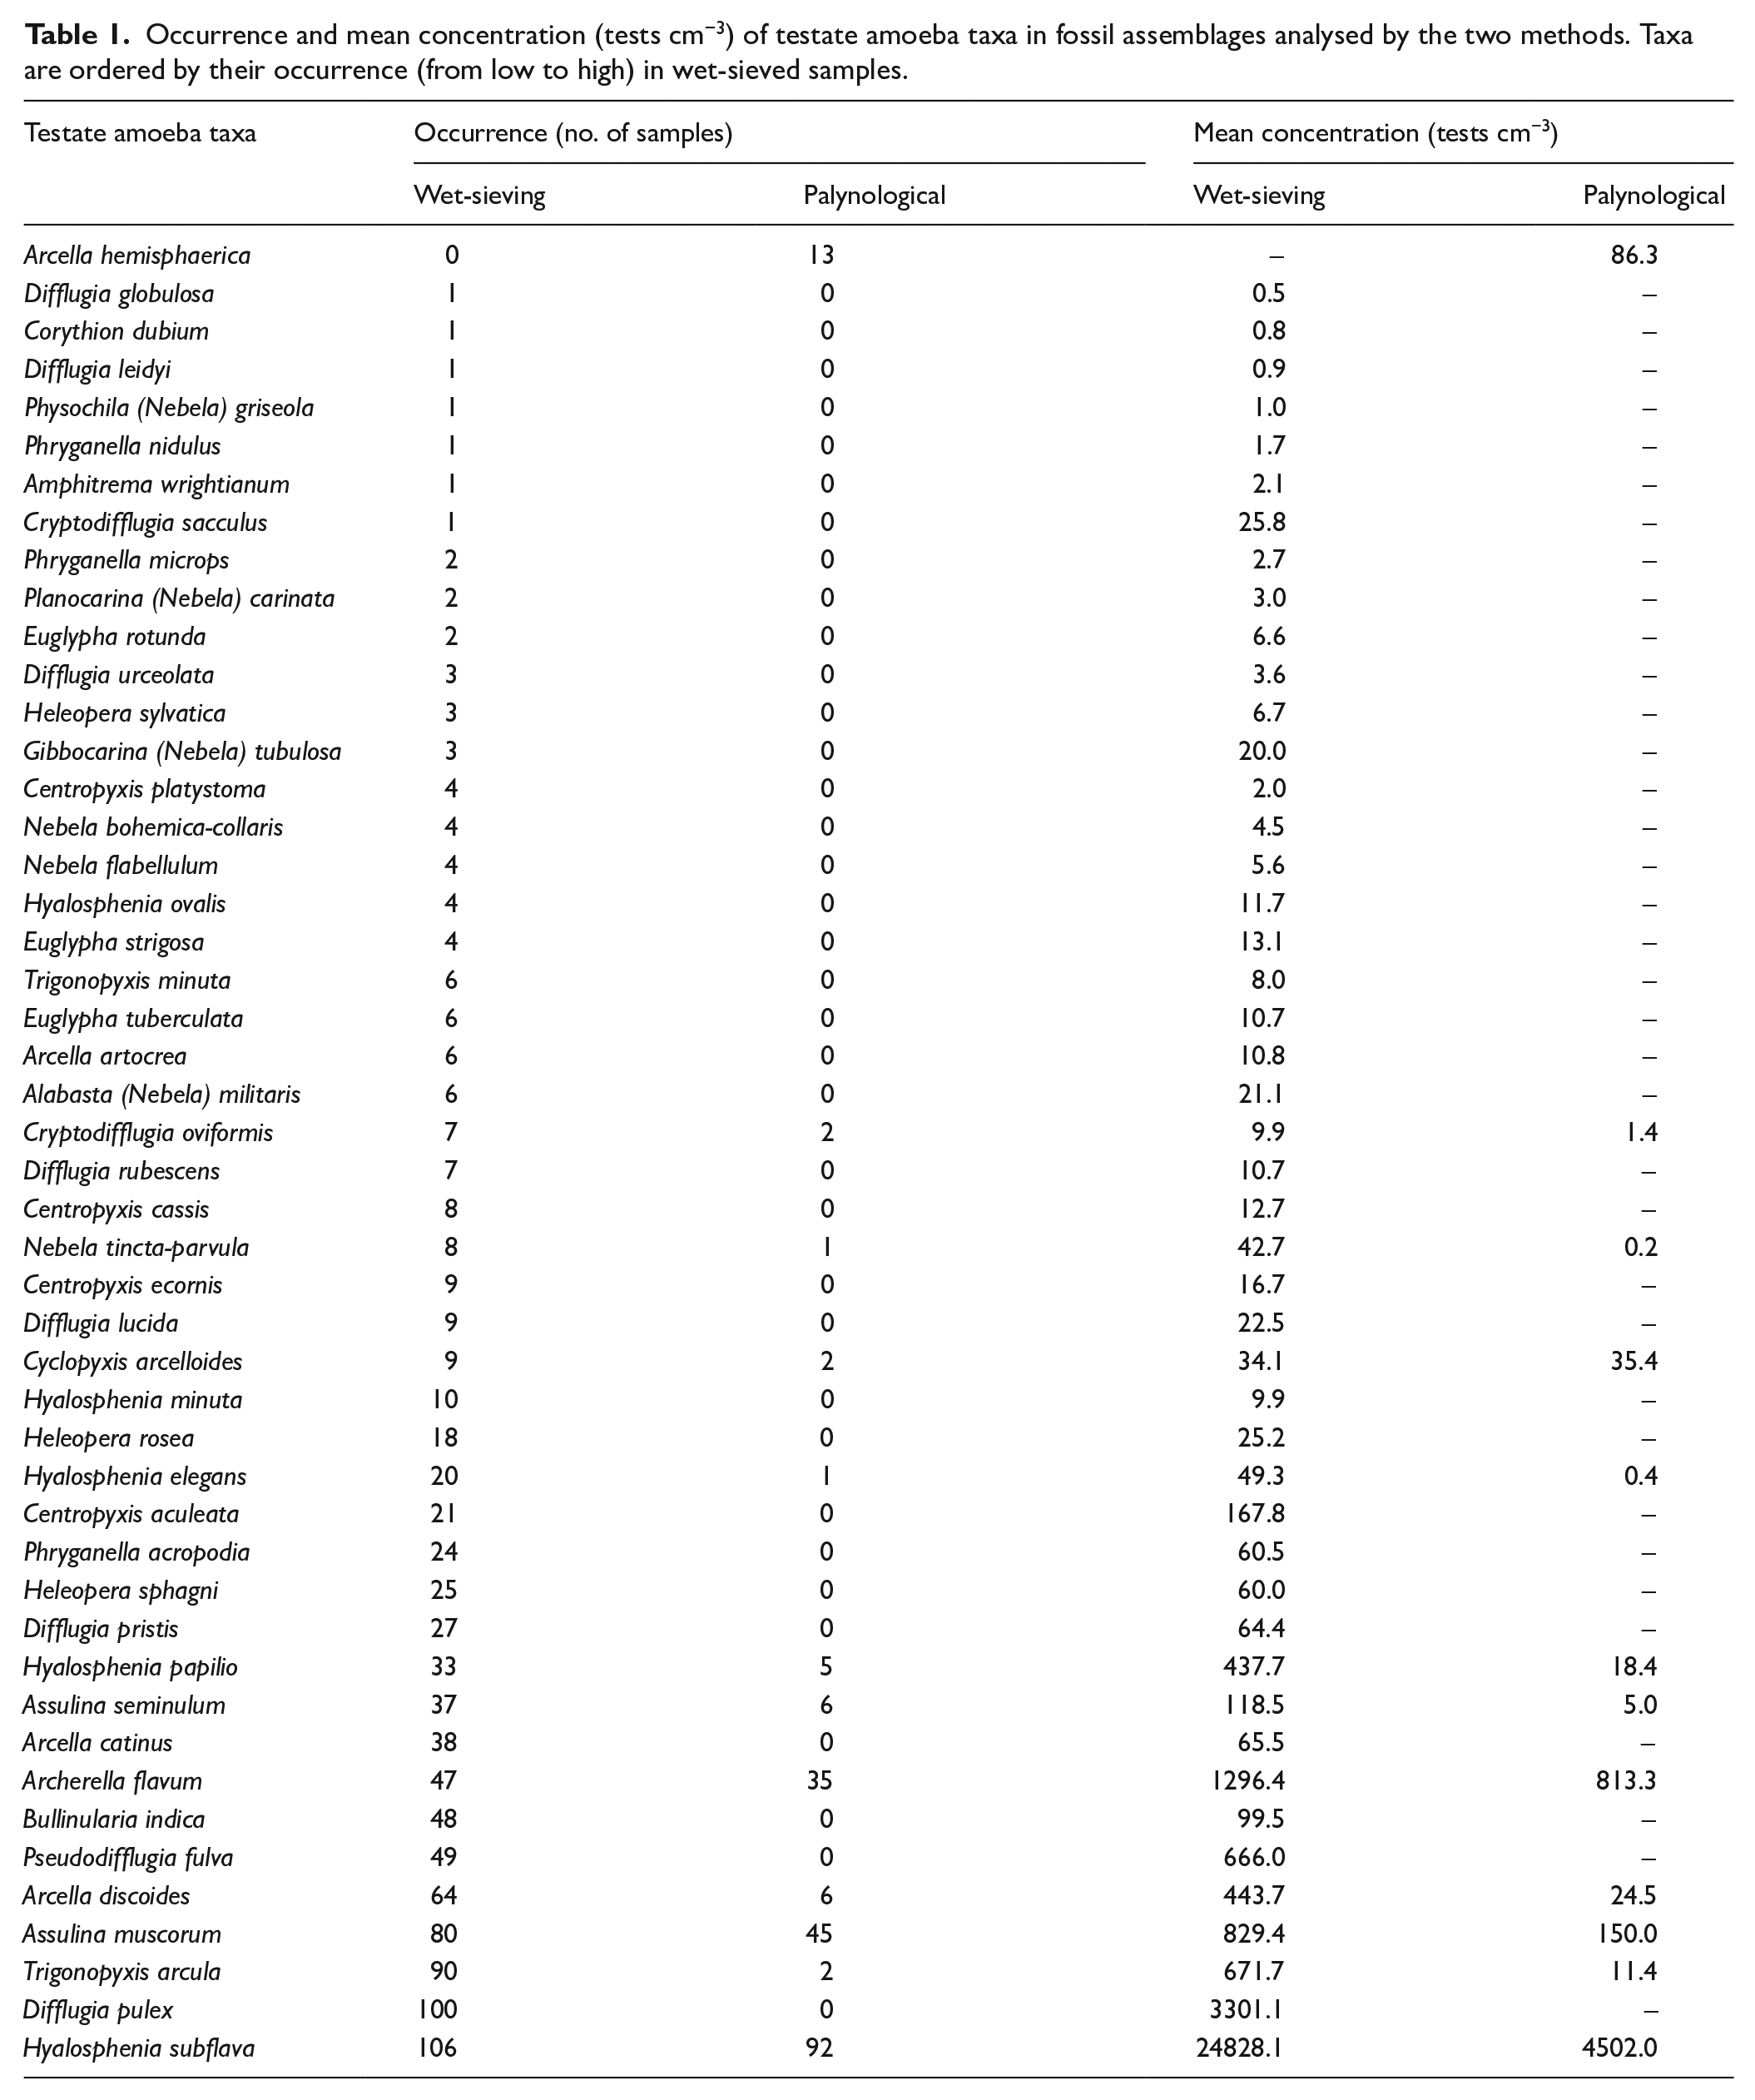
A total of 47 testate amoeba taxa were identified in the wet-sieved samples whereas only 12 different taxa were recorded in pollen samples (Table 1). The concentrations of testate amoebae were typically much higher in samples prepared using the wet-sieving method than in the pollen-slide sample. The differences in the mean concentration of each taxa between the two methods are shown in Table 1 and full concentration data for common taxa for the two peat records are provided in Supplemental Figure S1. Most of the abundant taxa in wet-sieved samples such as Hyalosphenia subflava, Archerella flavum and Assulina muscorum were also the most abundant taxa in the pollen-slide samples, but their concentrations were consistently lower and not always proportional between the two extraction methods. For instance, the mean concentration of Hyalosphenia subflava was more than 5× higher in wet-sieved than in palynological samples, while the concentration of Archerella flavum was more similar across the two methods. The concentration of Cyclopyxis arcelloides was very similar in both methods. However, many taxa had considerably lower concentrations in the pollen samples (e.g. Trigonopyxis arcula, Arcella discoides, Hyalosphenia papilio, Assulina seminulum, Hyalosphenia elegans and Nebela tincta), and two of the most abundant taxa in wet-sieved samples (Difflugia pulex, Pseudodifflugia fulva) were not encountered in any of pollen slides. Almost all taxa with low concentrations in wet-sieved samples (i.e. <100 tests cm−3) are absent in the pollen-slide dataset. Arcella hemisphaerica is the only species in the pollen-slide dataset (n = 13 samples) that was not encountered in any of the wet-sieved samples (Table 1 and Figure 1); however, in 7 of these 13 samples, less than 5 Arcella hemisphaerica tests were encountered on the pollen slides.
Occurrence and mean concentration (tests cm−3) of testate amoeba taxa in fossil assemblages analysed by the two methods. Taxa are ordered by their occurrence (from low to high) in wet-sieved samples.
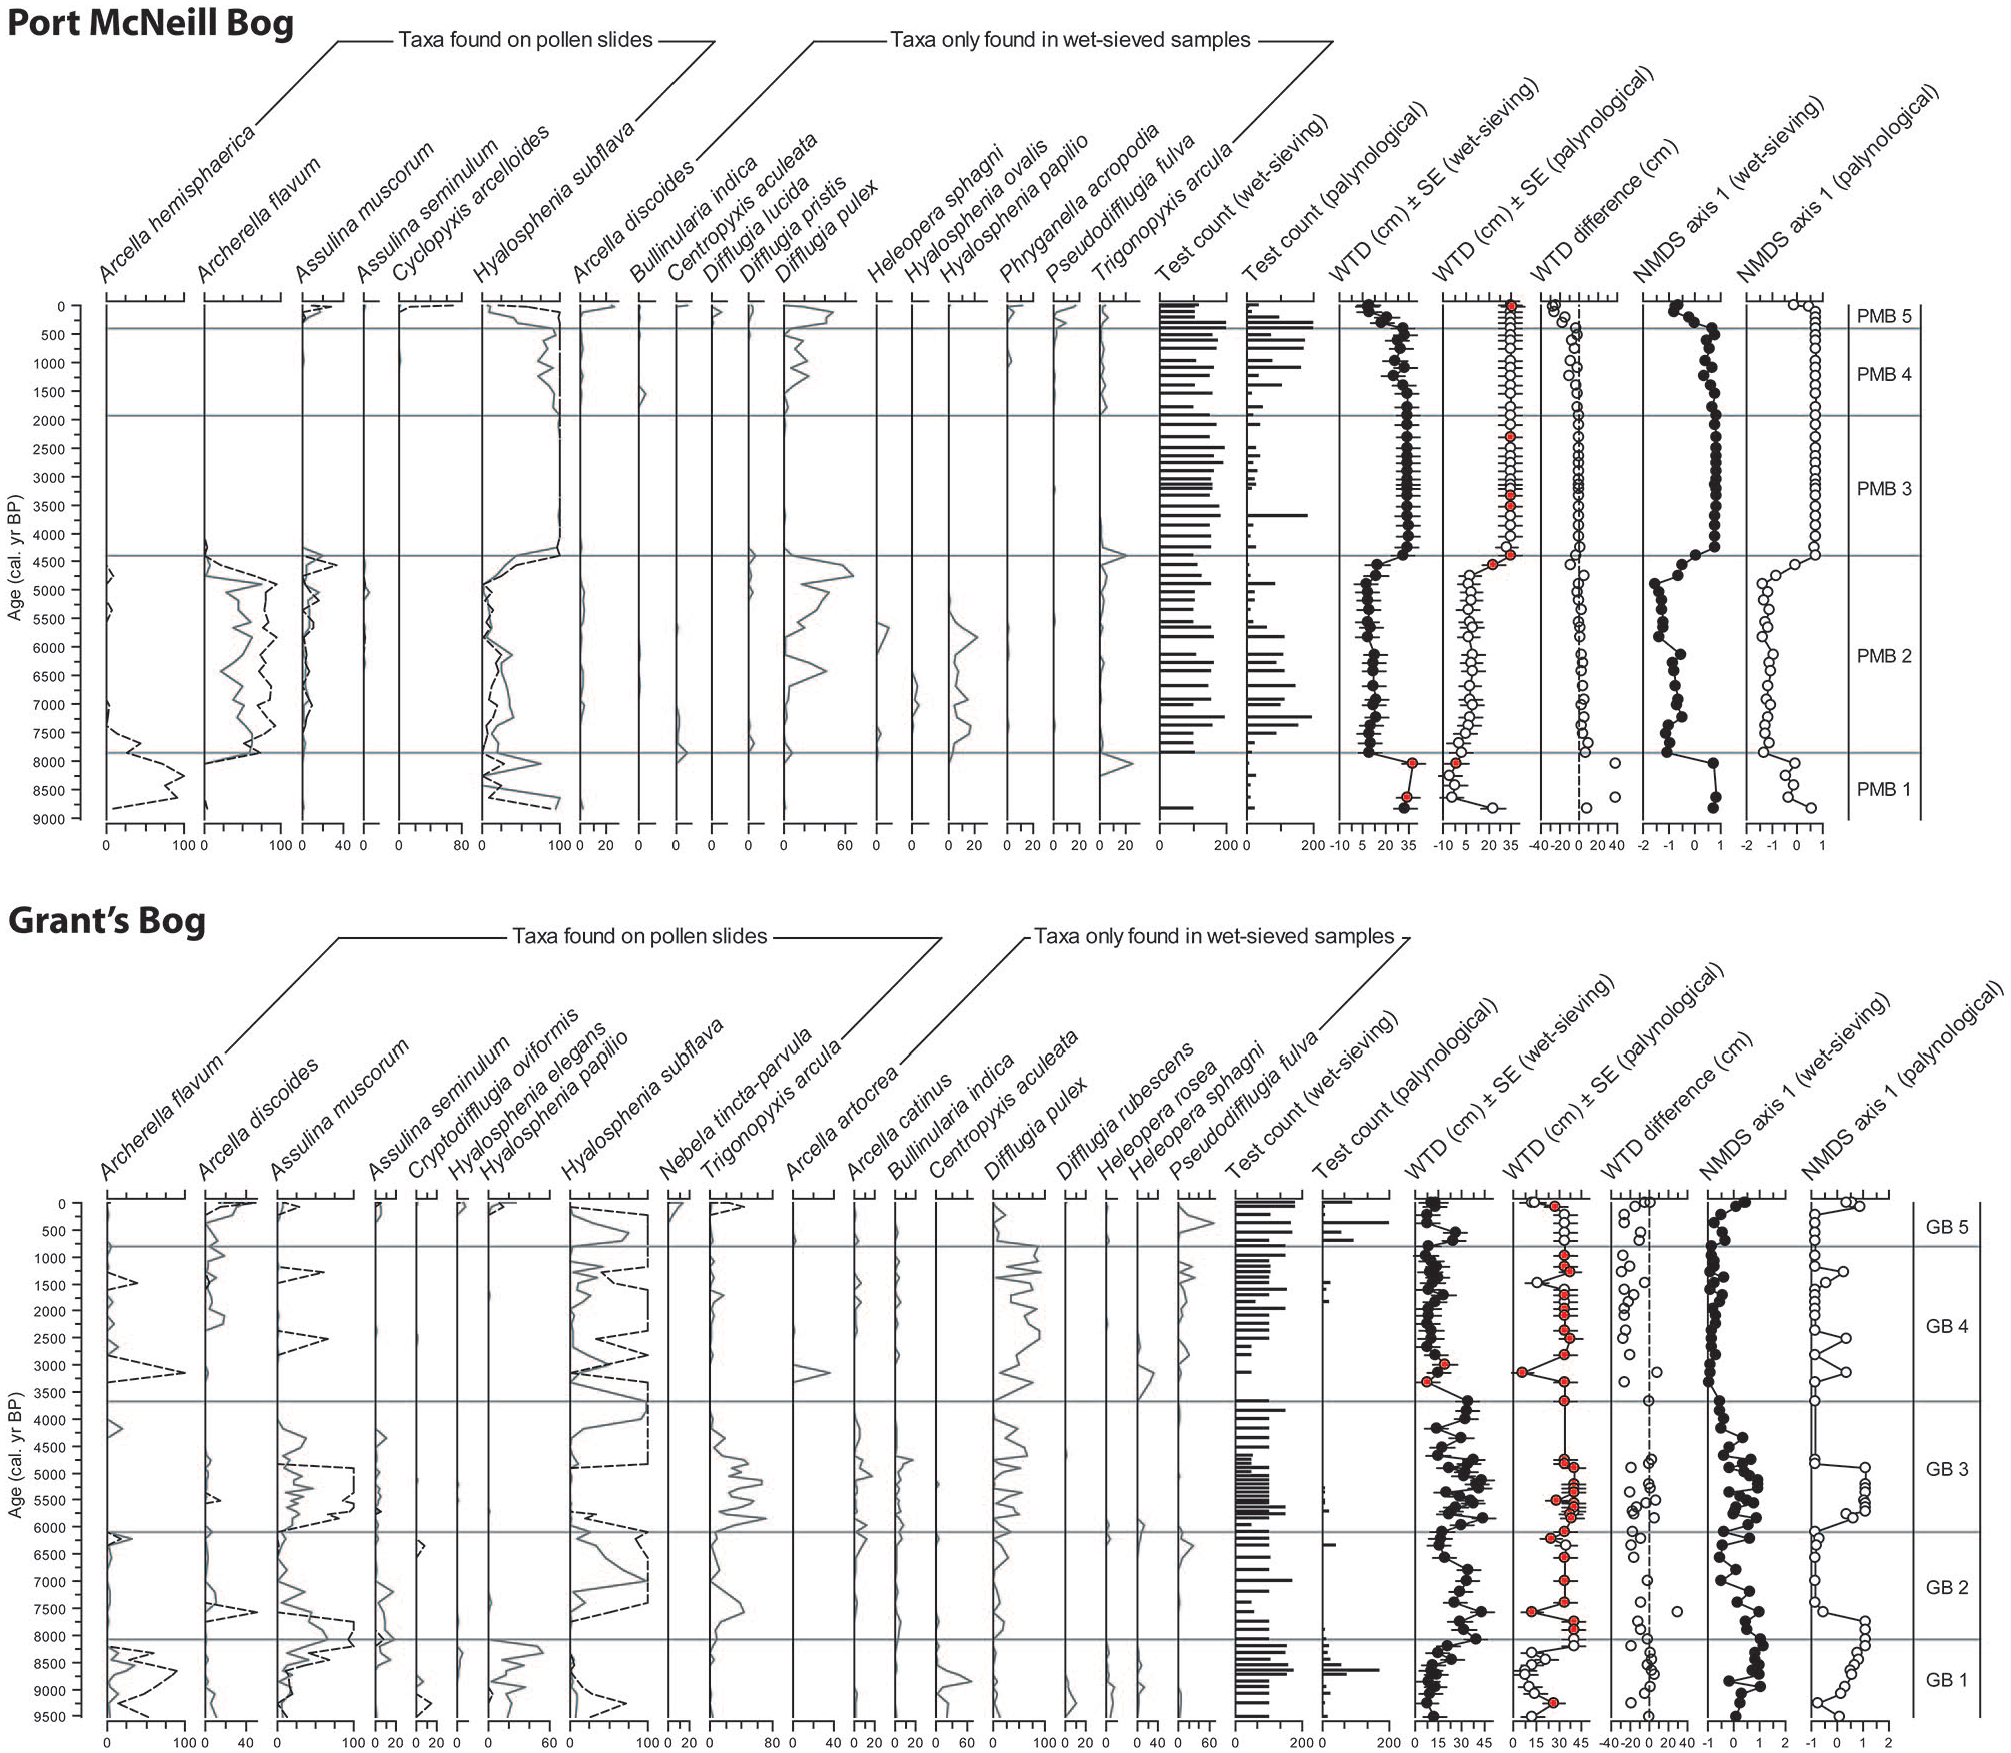
Relative abundances (%) of common testate amoebae and WTD reconstructions (cm) obtained by the wet-sieved (solid grey lines) and palynological (dashed black lines) assemblages for Port McNeill and Grant’s bog cores for the 132 paired samples. The x-axes for test counts in the two plots have been truncated at 200. Note that there are five samples that have test counts that exceed 200. The WTD values inferred from assemblages with low counts (<10 tests) are shown as red circles. WTD differences between the two methods (wet-sieved minus palynological samples) and NMDS axis one sample scores are also shown. Zonation is based on CONISS of the testate amoebae relative abundance (%) of wet-sieved samples.
Testate amoeba relative abundances and inferred WTD
In the lower section (zone 1) of the Port McNeill Bog (PMB) core, the pollen-slide assemblages are dominated by Arcella hemisphaerica, but this wet-indicating taxon was not found in any of the wet-sieved samples (Figures 1 and S1). The wet-sieved samples in zone 1 are dominated by Hyalosphenia subflava (an indicator of dry conditions in oligotrophic peatlands) or had very low concentrations. As a result, the inferred WTD values in zone 1 are quite different for the two methods (Figure 1). In PMB zone 2, the assemblages of both records are mainly dominated by Archerella flavum and the WTD inferred by the two methods is relatively similar. However, Difflugia pulex and Hyalosphenia papilio are common in zone 2 with the wet-sieving method, but absent in the palynological data. Both datasets indicate a lowering of the water table about 4500 cal. yr BP, as the assemblages became almost entirely dominated by Hyalosphenia subflava (zones 3 and 4). A recent rise of the water table (zone 5) is inferred by the wet-sieved samples, but not the pollen-slide data as the hydrophilous taxa Arcella discoides, Phryganella acropodia and Pseudodifflugia fulva are lacking in the latter. In general, the two methods result in similar WTD estimates for most of the 9000 yr record from Port McNeill Bog.
In the peat core from Grant’s Bog (GB), test counts on pollen slides were low in general and no testate amoebae were encountered in 28% of palynological samples. Moreover, many taxa in the wet-sieved samples are absent or rare in the pollen samples (Figure 1). In the first zone (GB1), Archerella flavum and Hyalosphenia subflava appear overrepresented in pollen assemblages whereas Hyalosphenia papilio is underrepresented. Centropyxis aculeata, which is relatively abundant in wet-sieved samples, is absent in the pollen-slide dataset, as are a number of more infrequent taxa. Despite these differences, WTD inferred by the two methods are relatively similar in zone 1, suggesting wet conditions, and both methods indicate a shift to drier conditions in zone 2. Two taxa (Difflugia pulex and Trigonopyxis arcula) that are common in the wet-sieved samples of zones 2 and 3 were not encountered in the palynological samples but the generally dry conditions are revealed by the WTD records of both methods due to the high abundance of two xerophilous species (Assulina muscorum and Hyalosphenia subflava). A shift to wetter conditions in zones 4 and 5 is suggested by the wet-sieved samples, but not the palynological samples, which are mostly dominated by Hyalosphenia subflava and many hydrophilous species (e.g. Arcella discoides and Pseudodifflugia fulva) are rare or absent. In general, the WTD estimates from the pollen-slide samples at Grant’s Bog are larger than those from the wet-sieved samples that is, the pollen-slide dataset tends to infer drier conditions overall (Figure 1).
Influence of sieve size on testate amoeba assemblages
Of all tests counted in the wet-sieved samples, only 2.7% were larger than 150 µm that is, the sieve size used for palynological samples. However, a substantial proportion of tests of some taxa were larger than 150 µm (Supplemental Table S1, available online), especially Bullinularia indica (85%), Hyalosphenia papilio (28%) and Trigonopyxis arcula (25%). In a few instances, taxa with many large tests were abundant in specific sections of the peat cores, such as T. arcula in zone 3 of Grant’s Bog and H. papilio in zone 2 of Port McNeill Bog (Figure 2).
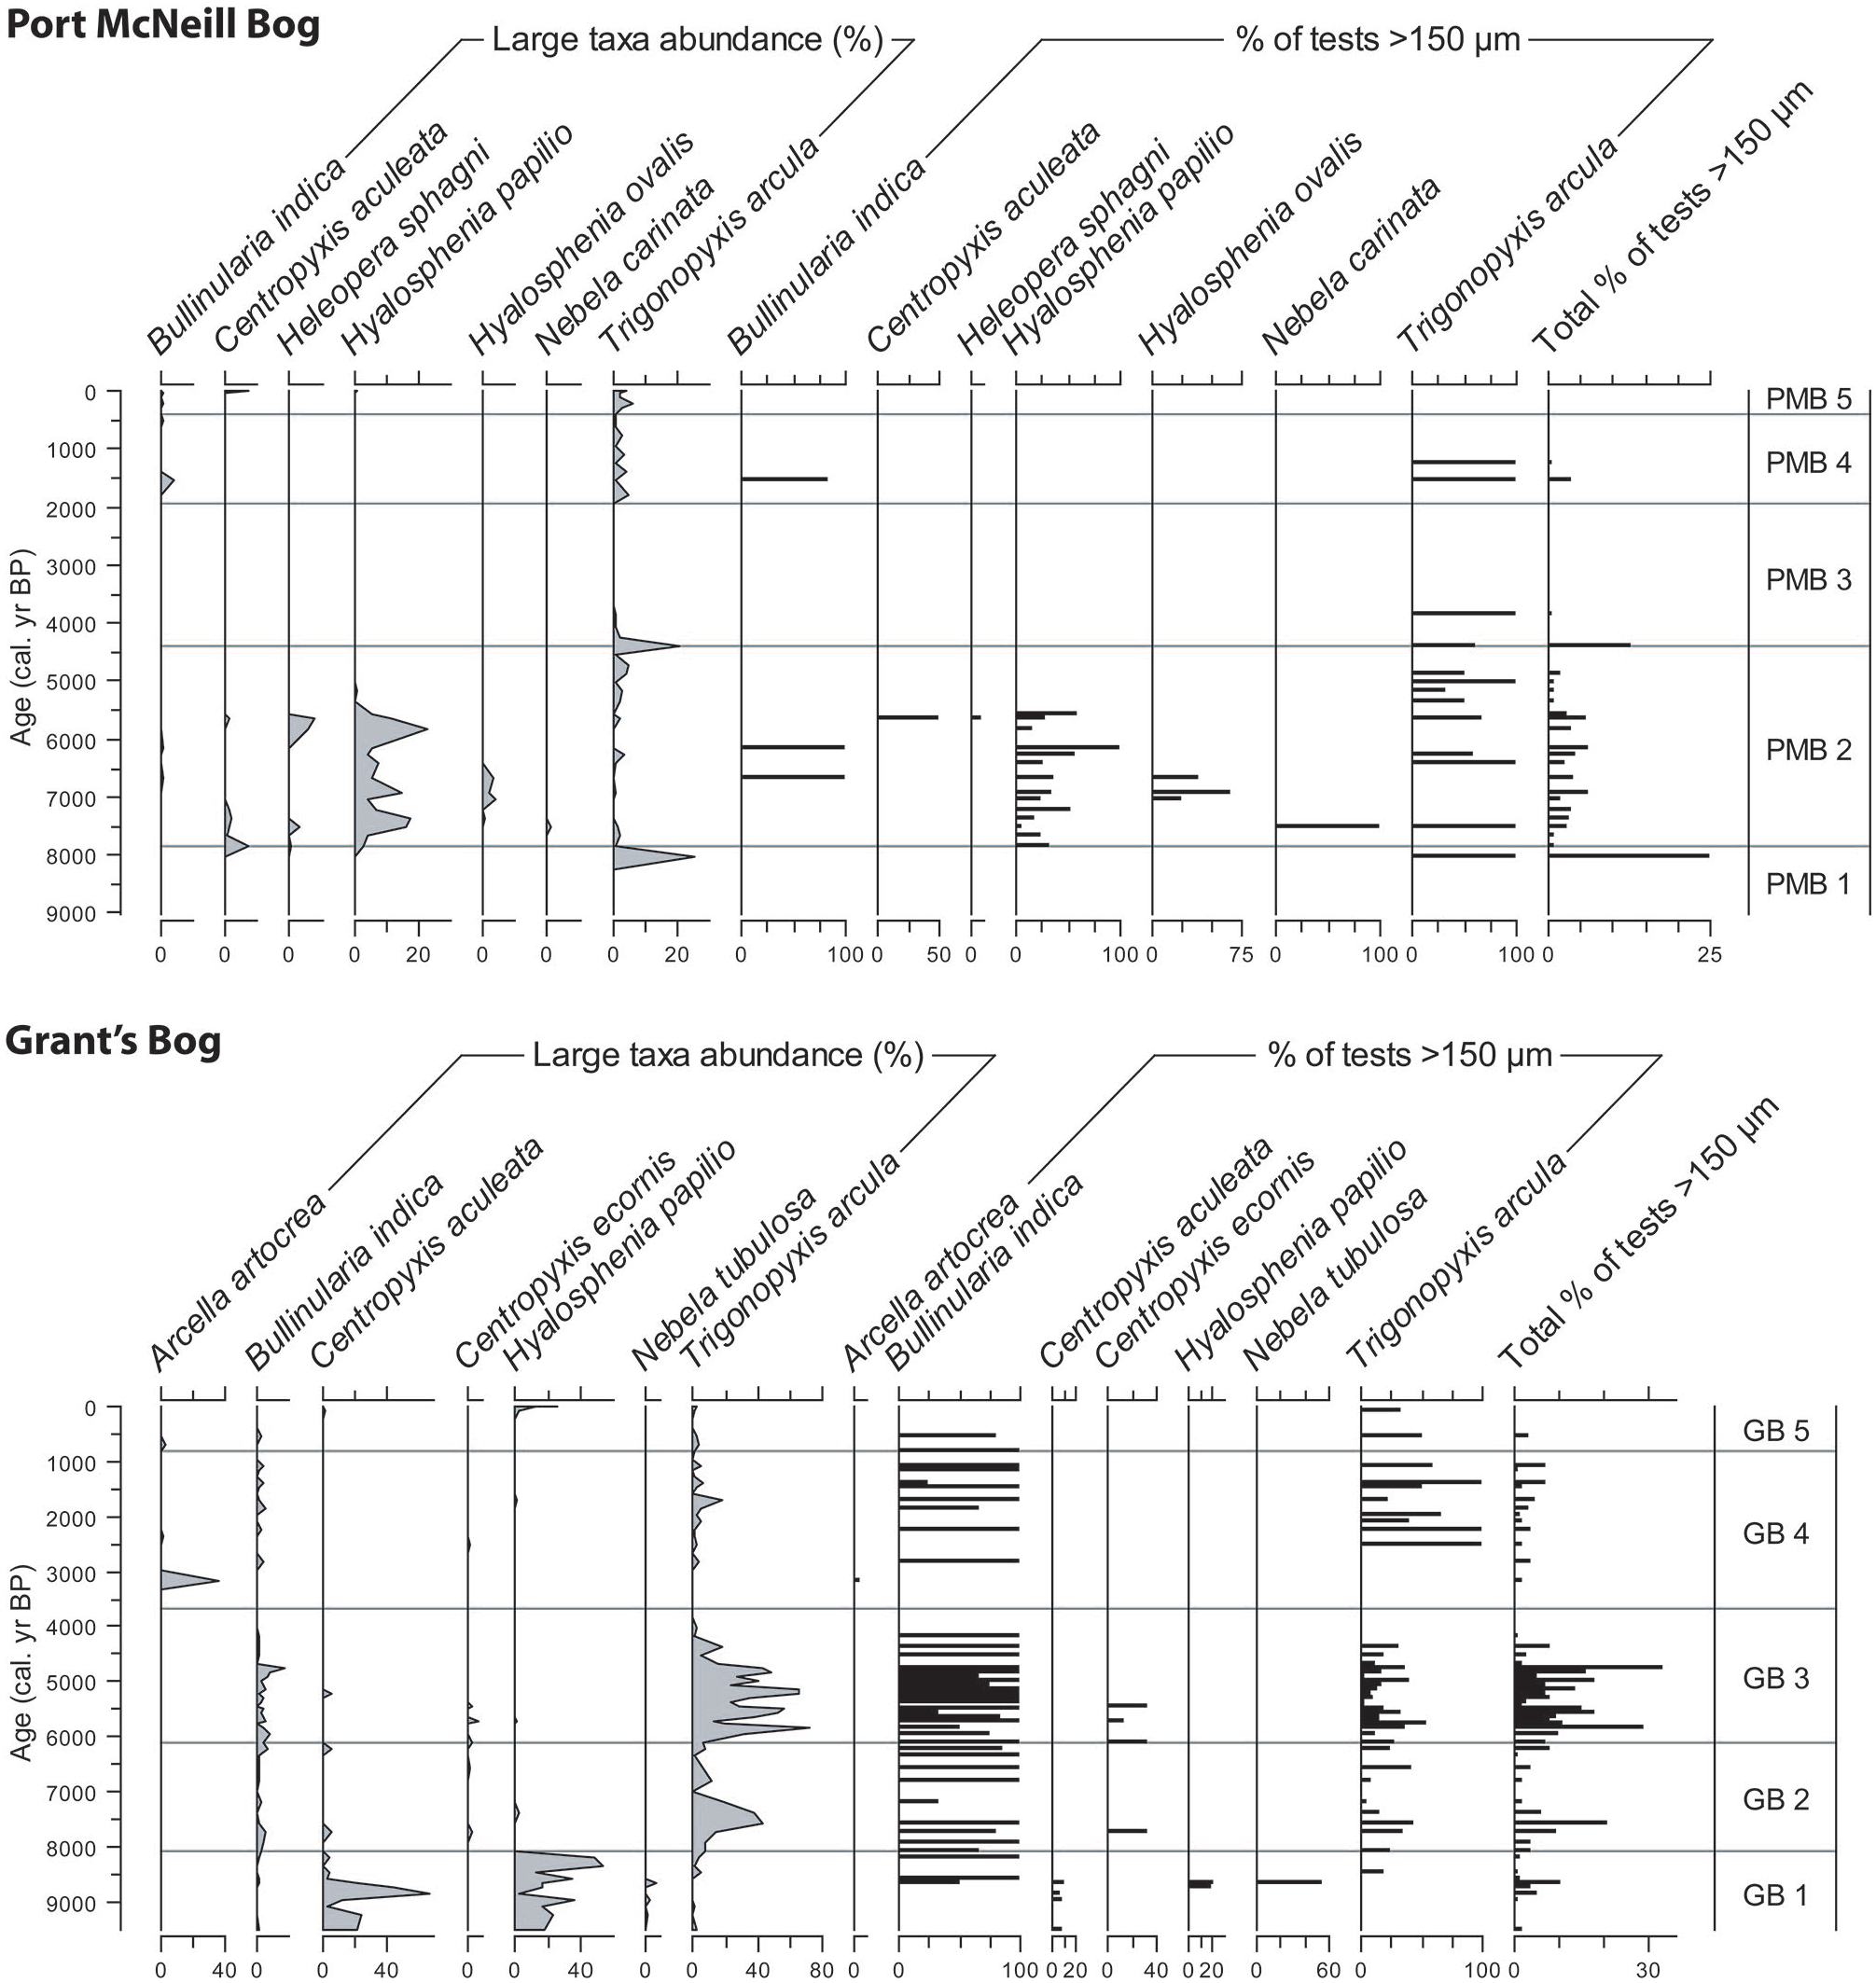
Relative abundances of large testate amoebae taxa in the wet-sieved samples (as in Figure 1) and the percentage of these tests that are larger than 150 µm.
Ordination
The NMDS ordination summarises the main differences in the structure of testate amoeba communities from the two methods (Figure 3). In the PMB record, the two most common taxa (Hyalosphenia subflava and Archerella flavum) occupy similar positions at opposite ends of the main axis of variation in assemblages from both methods. In the GB record, two of the most abundant taxa (Hyalosphenia subflava and Assulina muscorum) are also found in similar positions on opposite ends of axis 1, but the absence of Difflugia pulex in palynological samples, which is abundant in wet-sieved samples, has a strong influence on the community structure. Overall, the sample scores on NMDS axis 1 show similar overall trends between the two methods (Figure 1). Moreover, the NMDS axis 1 scores reflect relatively well the main shifts between wet and dry conditions as shown by the WTD reconstructions, except for the sections with low test counts in the pollen-slide samples especially at Grant’s Bog (Figure 1).

NMDS ordination biplots of Port McNeill Bog and Grant’s Bog testate amoeba percentage data (taxa and samples) from (a) wet-sieved assemblages and (b) palynological assemblages for the 132 paired samples. Only the common taxa are shown for the wet-sieved samples. The arrows of taxa with scores lower than 0.25 are not shown to reduce cluster. Full taxa names: AART, Arcella artocrea; ACAT, Arcella catinus; ADIS, Arcella discoides; AHEM, Arcella hemisphaerica; AFLA, Archerella flavum; AMUS, Assulina muscorum; ASEM, Assulina seminulum; BIND, Bullinularia indica; CACU, Centropyxis aculeata; COVI, Cryptodifflugia oviformis; CARC, Cyclopyxis arcelloides; DLUC, Difflugia lucida; DPRI, Difflugia pristis; DPUL, Difflugia pulex; DRUB, Difflugia rubescens; HROS, Heleopera rosea; HSPH, Heleopera sphagni; HELE, Hyalosphenia elegans; HOVA, Hyalosphenia ovalis; HPAP, Hyalosphenia papilio; HSUB, Hyalosphenia subflava; NMIL, Alabasta (Nebela) militaris; NTIN, Nebela tincta-parvula; PACR, Phryganella acropodia; PFUL, Pseudodifflugia fulva; TARC, Trigonopyxis arcula, TMIN, Trigonopyxis minuta.
Comparison of WTD reconstructions from the two methods
The WTD reconstructions from the two methods show important disagreement in some sections of the records, especially in the GB core (Figure 1). However, there is a moderate positive correlation (Spearman’s rank correlation, rs = 0.50, p < 0.0001, n = 106) in inferred WTD values between the two methods for all pairs of samples (Figure 4a). The WTD inferred from palynological samples with counts of >50 tests are well correlated with those inferred by the wet-sieving method (rs = 0.77, p < 0.0001, n = 30). The differences in inferred WTD values between the two methods are highest for samples with low counts (<10 tests) on pollen slides, and generally decrease with higher testate amoebae counts on pollen slides (Figure 4b).
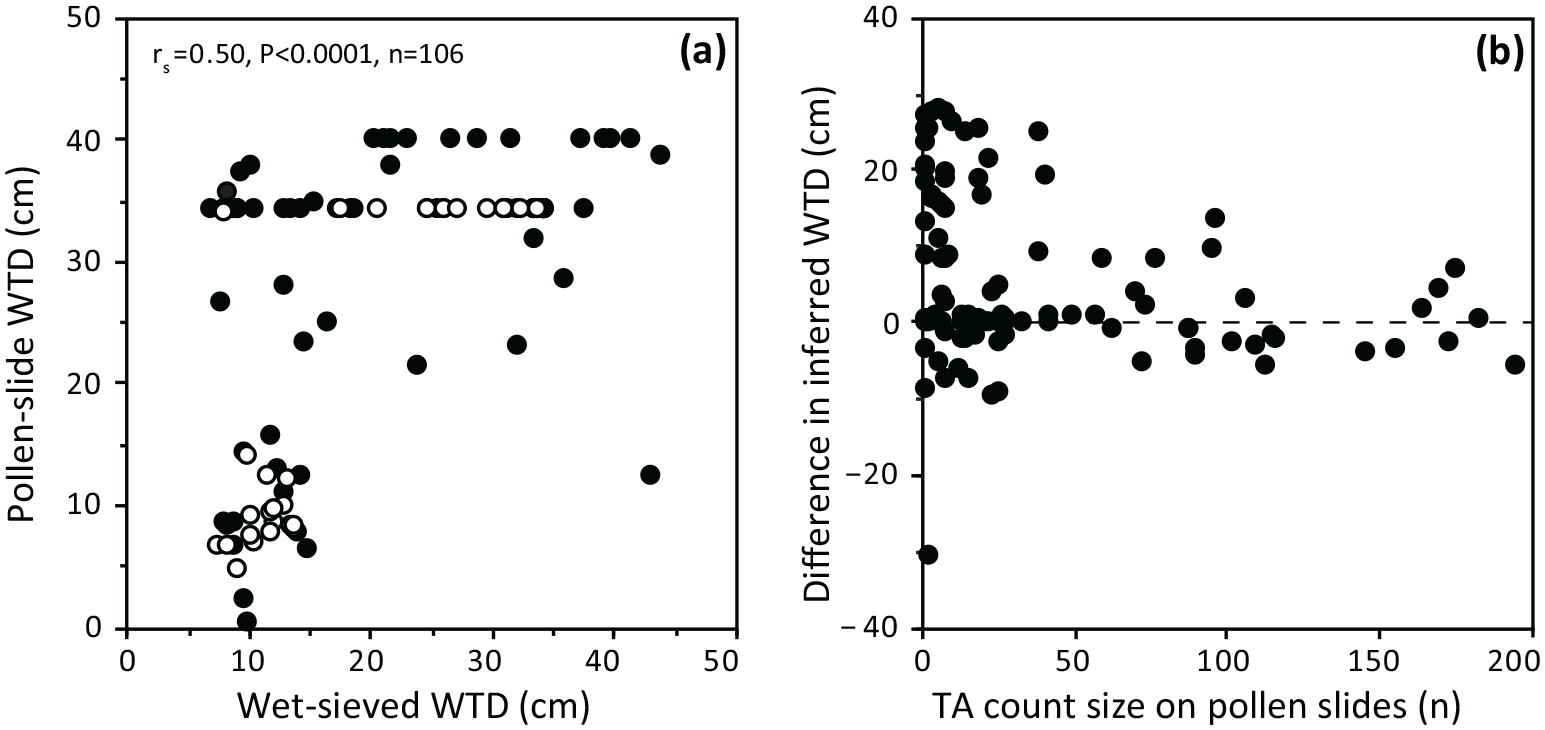
(a) Comparison of water table depths (WTD) inferred from testate amoeba assemblages based on the two methods. Open circles are WTD estimates based on counts of >50 tests in both methods. (b) Relationship between testate amoeba (TA) count sizes on pollen slides and differences in inferred WTD between the two methods. Note that three samples with high test counts (>300) on the pollen slides are not plotted in (b).
Differences in assemblage composition and diversity of samples with >50 tests
The comparison of assemblage composition (relative abundance %) for the 30 pairs of samples with >50 tests identified in both methods is shown in Figure 5. The mean relative abundance of the two most dominant taxa are higher in pollen-slide samples. The mean abundance of Archerella flavum is considerably higher in pollen samples (41% vs 22%) whereas the abundance of Hyalosphenia subflava is slightly higher (48% vs 41%).
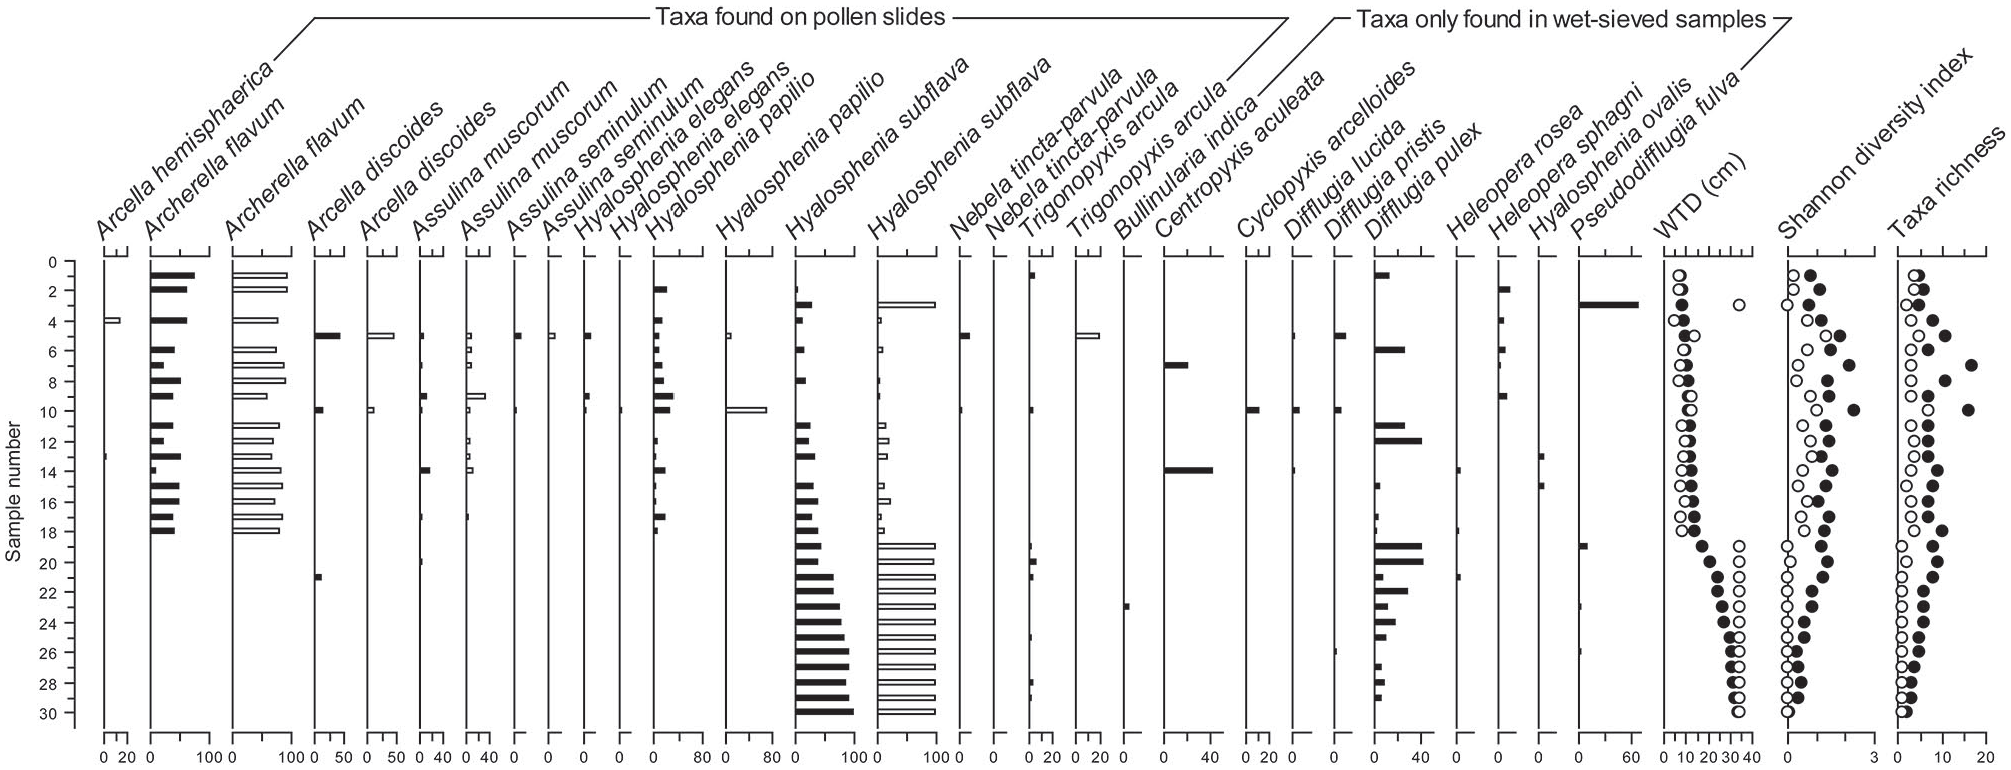
Relative abundances (%) of common testate amoebae, inferred WTD values, taxa diversity and richness for the 30 pairs of samples from the two peat cores with counts of >50 tests. The composition of wet-sieved assemblages was estimated when the number of tests counted was the same as that previously reached in palynological samples. Palynological samples are shown as white bars or circles, whereas wet-sieved samples are shown as black bars or circles. Samples are ordered by the inferred WTD values of wet-sieved samples from low to high values (i.e. wet to dry).
Taxonomic richness and diversity are both significantly lower (z = 5.48, p < 0.0001) in the palynological samples; on average, richness is 4.8 taxa lower and diversity is 0.76 lower in the pollen-slide samples compared to the wet-sieved samples. The number of taxa is ⩾6 in 74% of wet-sieved assemblages, whereas 77% of pollen-slide assemblages were composed of less than 4 different taxa. Taxa diversity is >1 in 63% of wet-sieved samples, whereas 93% of palynological samples are characterised by very low taxonomic diversity (Shannon index <1). However, there are significant positive correlations in testate amoeba richness (rs = 0.55, p < 0.002, n = 30) and diversity (rs = 0.75, p < 0.0001, n = 30) between the two methods for the 30 pairs of samples with >50 tests (Figure 6).
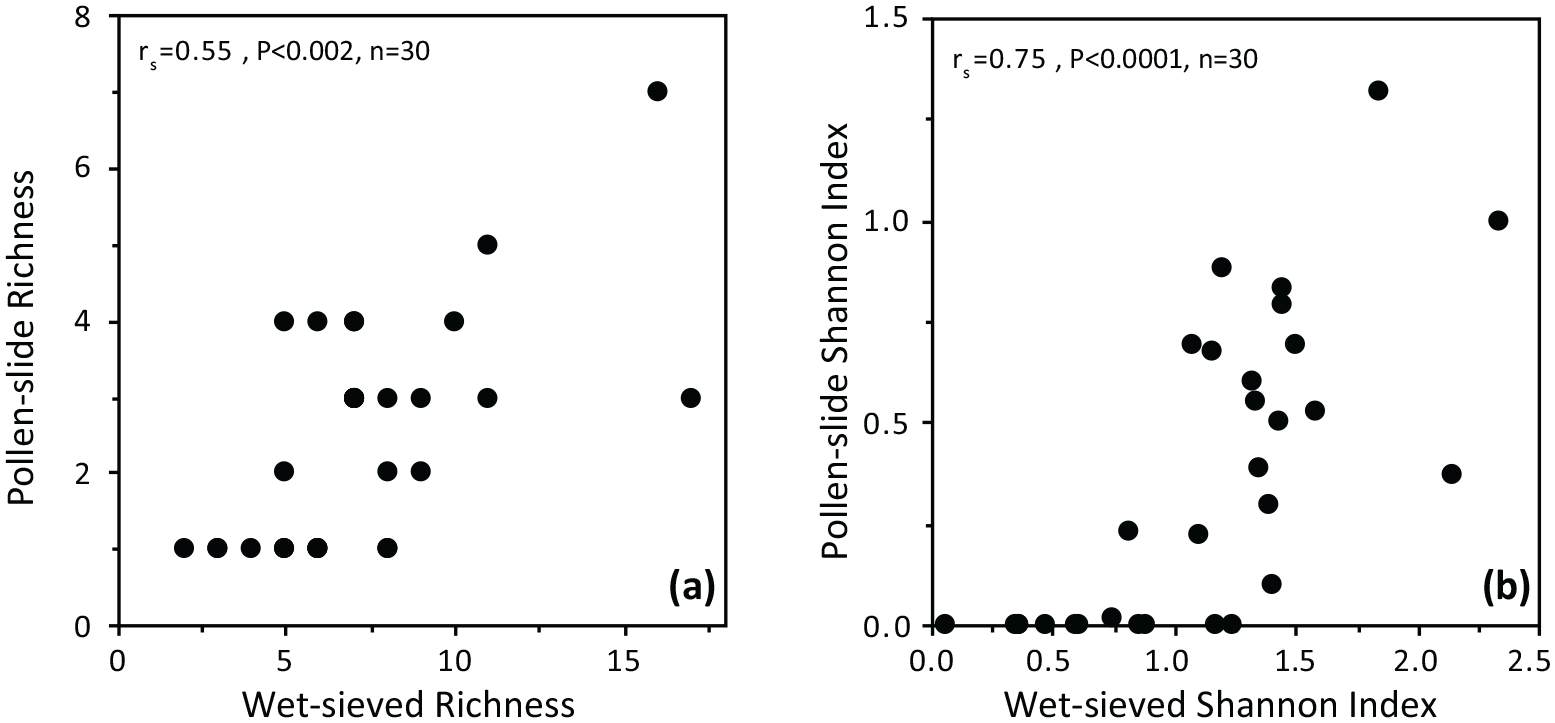
Correlation of (a) taxonomic richness and (b) Shannon diversity index in testate assemblages obtained by the two methods for 30 pairs of samples with >50 tests, using the same total counts in wet-sieved samples than those previously achieved in palynological samples.
Discussion
Our comparison of testate amoeba assemblages from pollen-slide and wet-sieved samples shows a number of important differences in the testate amoeba data that are generated from the two methods. Testate concentrations are much lower in the pollen-slide samples, suggesting that the chemical treatment used to remove organic material and isolate pollen grains from peat may significantly reduce testate concentrations. Acetolysis was previously shown to be the most destructive treatment, while the use of KOH (10%) can also cause significant damage to tests (Hendon and Charman, 1997). In this study, the testate amoebae that are the most prevalent in palynological samples (i.e. Hyalosphenia subflava, Archerella flavum and Assulina muscorum) are among the most commonly encountered in palynological studies (Payne et al., 2012). These taxa are among the least prone to dissolution in acidic conditions (Payne, 2007; Swindles and Roe, 2007) and the most robust to the acetolysis treatment (Hendon and Charman, 1997). Archerella flavum and Hyalosphenia subflava produce tests composed of self-secreted proteinaceous material while the tests of Assulina muscorum are constructed of siliceous plates (idiosomes). These taxa producing autogenous shells seem to have an inherent resistance to chemical treatment. In contrast, most agglutinated tests (Centropyxis aculeata, Bullinularia indica, Phryganella acropodia, Difflugia pulex and Pseudodifflugia fulva) seem to be particularly sensitive to chemical treatments and are absent in the pollen-slide datasets (Table 1 and Figure 1). Many of these agglutinated tests are built from mineral particles resistant to the acetolysis treatment, but they can still be destroyed if the secreted cement that binds the particles or plates together is dissolved. Finally, it is likely that damage to testate amoebae caused by the palynological treatment is more pronounced in fossil assemblages that are already more poorly preserved (e.g. highly humified peat).
Although test concentrations for most taxa are lower in the pollen-slide samples, our results suggest that the KOH and acetolysis treatments used to prepare pollen samples can help concentrate tests in humified and/or herb-dominated peat by destroying part of the fine organic fraction that is retained on the 15 μm sieve and dilutes their concentrations in wet-sieved samples (Zheng et al., 2019). Previous studies showed that using 5% KOH in the preparation of testate amoebae helped concentrate tests in wet-sieved samples from highly humified salt-marsh peat by eliminating unwanted organic detritus (Barnett et al., 2013; Charman et al., 2010). For instance, in our study, tests were virtually absent in wet-sieved samples from the highly-decayed herbaceous peat at the bottom of the PMB core (zone 1), and more abundant in the pollen slide data from this interval (Figures 1, Supplemental Figure S1 and S2, available online). We attribute this difference to the concentrating effects of the chemical treatments used in palynological preparation, as suggested by Hendon and Charman (1997). Because there was a large amount of organic detritus in these wet-sieved samples, it was difficult to reach reasonable count sizes in a few of the wet-sieved samples from herb-dominated portions of both peat cores (Supplemental Figure S2, available online). In these cases, the pollen-slide samples were as or more successful, because the palynological treatments removed the organic detritus that can hide tests and/or reduce their apparent concentrations in wet-sieved samples.
Factors other than the chemical treatments may also explain dissimilarities in the assemblages recorded by the two methods. The use of a smaller sieve size in the palynological treatment (i.e. 150 μm) reduced the abundance of some large testate amoeba taxa on pollen slides (Figure 2). Although sieving at 150 µm would have removed only a small fraction of the total tests (2.7%) in the pollen-slide samples, this step in the preparation process is likely to introduce an important species-specific bias in assemblage composition by removing some taxa more than others. Depending on the abundance and indicator value of the taxa that are removed, this could seriously affect paleohydrological inferences including quantitative reconstruction of WTD.
Many of the observed differences in assemblage composition between the two methods are due to the low test counts on pollen slides that are typical of this method (Figure 1). These low sample sizes resulted in testate amoeba assemblages that failed to accurately represent the relatively high taxonomic diversity and richness shown by the wet-sieved samples. Even in the 30 pairs of samples with a minimum test count of >50, diversity and richness were underestimated in the pollen-slide samples. The absence of many taxa in the pollen-slide datasets inflates the relative abundance (%) of the remaining dominant taxa such as Archerella flavum and Hyalosphenia subflava (Figure 5). Although diversity and richness were much lower in the pollen-slide samples, these metrics increased in concert with those of the wet-sieved samples, resulting in positive correlations between the two datasets (Figure 6). Thus, it is possible that using large sample sizes in pollen-slide samples could result in more accurate estimates of diversity and richness. Because the most dominant hydrophilous and xerophilous taxa were relatively well represented in the pollen-slide samples (Figure 1), most of the main paleohydrological information was retained in pollen-slide assemblages. In spite of major dissimilarities in community composition shown by the NMDS ordinations (Figure 3), the main hydrological information from wet to dry conditions reflected by the position of samples along the main axis of variability is retained in testate amoeba assemblages from pollen slides even when test counts are low. Payne et al. (2012) also showed that the main pattern of ecological information is more or less retained when tests are counted on pollen slides as opposed to wet-sieved samples. Ordination scores of fossil testate amoeba assemblages could be an alternative way to represent paleohydrological changes in palynological studies.
Given the underestimation of test concentrations, diversity and richness in palynological samples, we were surprised by similarities between the two methods in inferred water table depths. WTD values from the pollen-slide assemblages were significantly correlated with those inferred from the wet-sieving method (Figure 4) and the two methods identified coincident changes in WTD, at least for some sections of the studied peat cores (Figures 1 and 5). This is especially true at Port McNeill Bog, where the two methods yield similar WTD estimates for most of the 9000 yr record. However, the paleohydrological reconstructions show substantial disagreement when taxa that were abundant in wet-sieved samples were absent in the pollen-slide datasets (e.g. zones 4 and 5 at Grant’s Bog). We attribute these important WTD differences at Grant’s Bog to the low test counts of many of the pollen-slide samples as well as preferential destruction of some taxa (e.g. Difflugia pulex, Pseudodifflugia fulva) in association with palynological treatments, which together resulted in biased assemblages in some instances (Figure 1). The PMB core shows more similar WTD estimates between the two methods than the GB core, which is likely due to two main factors. The test counts on pollen slides were generally higher in the PMB core than the GB core, resulting in more representative samples of the assemblages at that site. In addition, the testate amoeba assemblages in the PMB core are dominated by a few dominant taxa that are resistant to the palynological treatment, whereas the GB core contains more diverse assemblages.
The differences between the paleohydrological records from the two methods are particularly apparent in the herb-dominated sections of the peat cores (Figures 1 and Supplemental Figure S2, available online). For instance, in the Port McNeill core, Arcella hemisphaerica dominates most of the pollen samples of zone PMB 1, but this species was not found in any of the wet-sieved samples due to the high abundance of organic detritus that resulted in low test counts, as described above. Given this species’ clear preference for high water tables (Amesbury et al., 2018), most of the pollen-slide samples at the base of the PMB record return water table estimates of −5 to 0 cm indicative of waterlogged conditions (Figures 1 and Supplemental Figure S2, available online), which is consistent with other paleohydrological proxies during this interval of herb-dominated peat. For example, this section of the PMB peat core is characterized by low C:N and relatively high nitrogen, and contains abundant remains of Nuphar polysepala, an obligate aquatic plant that indicates the presence of standing water (Lacourse and Davies, 2015). In contrast, inferred WTD from the wet-sieving method (i.e. ~35 cm) suggest dry surface conditions in a few levels during this interval notably due to the presence of Hyalosphenia subflava (Figure 1). This species has been also observed in basal fen peat in previous studies (Elliott et al., 2012) and it is likely that its ecological preference is different in waterlogged minerotrophic conditions than in bogs. Moreover, test counts were very low in most wet-sieved samples in zone PMB 1 and no tests were found in two levels of this section. It was therefore difficult to obtain reliable WTD estimates from the wet-sieved samples in this basal section of highly humified peat. Using multiproxy data from pollen analysis (including tests), combined with plant macrofossil data, can assess paleohydrological conditions in those peat stages where testate amoeba taxa are missing or under-represented in wet-sieved samples, or where their auto-ecological preferences are ambiguous.
In the Grant’s Bog core, there is also disagreement between the two methods in the late Holocene portion of record (i.e. ~3000–1000 cal. yr BP of zone GB4), where the peat is composed primarily of herbaceous remains (Supplemental Figure S2, available online) as opposed to Sphagnum (Lacourse et al., 2019). In this section, the pollen-slide samples suggest a water table depth of ~35 cm, in contrast with the relatively wet surface conditions (~10 cm) inferred by the wet-sieved samples (Figures 1 and Supplemental Figure S2, available online). However, it is difficult to have confidence in the pollen-slide WTD estimates for zone GB4 as they are based on low test counts. Other studies have also shown that inferring WTD from testate amoeba assemblages is more problematic in sedge-dominated fen peat than in Sphagnum peat (Kurina et al., 2020; Payne, 2011). This also underscores the value of using a multi-proxy approach when reconstructing past changes in paleohydrological conditions, instead of relying solely on one proxy.
Our results suggest that the assemblages with counts of <10 tests provide poor paleohydrological records, but that palynological assemblages with counts of >50 tests could potentially be used to provide quantitative WTD reconstructions similar to those obtained by the wet-sieved samples (Figures 4 and 5). A count size of over 50 tests is also considered a minimum to obtain reliable paleohydrological reconstructions from wet-sieved peat samples (Payne and Mitchell, 2009). These results are in line with the study of Mitchell et al. (2008b) suggesting that testate amoeba transfer functions are quite robust to even relatively large changes in community composition due to differential preservation of tests in peatlands. The number of tests counted on pollen slides is often too low to provide representative assemblages that can be used to produce reliable WTD records using transfer functions (Payne et al., 2012). In this study, 46% of the pollen-slide samples had counts <10 tests and in 16% of the samples, the pollen sum was reached before any testate amoebae were encountered on the slides. This issue could be addressed by counting more testate amoebae on pollen slides, but this can be very time consuming especially if test concentrations are low.
Conclusion and recommendations
In this study, we compared 132 pairs of testate amoeba samples analysed by palynological and conventional wet-sieving methods along two Holocene peat records. Our analyses showed that testate amoeba concentrations, diversity and richness are typically much lower in pollen-slide samples. However, testate amoeba data from pollen slides can provide useful paleohydrological information. Major shifts between wet and dry conditions, as shown by the WTD reconstructions using wet-sieved samples, were relatively well captured by the palynological datasets in most instances. Even though pollen samples with >50 identified tests had lower taxonomic diversity and richness, the WTD estimates based on these samples were relatively similar to those obtained from wet-sieved samples.
Nonetheless, if the ultimate goal is to generate quantitative estimates of paleohydrological conditions, we recommend that testate amoeba analyses be conducted using the wet-sieving method. Available transfer functions for inferring WTD have been built using wet-sieved samples and it is unclear whether they can be appropriately applied to pollen-slide samples. Moreover, the number of tests counted on pollen slides is often too low to provide representative assemblages for reliable WTD records using transfer functions. In studies where testate amoeba are counted on pollen slides along with other non-pollen palynomorphs, we recommend using a large sieve size (e.g. 250 µm) and counts of ⩾50 tests, as is the case for the wet-sieving method. If tests are to be counted on pollen slides, we also recommend preparing those samples using a weaker concentration of KOH (e.g. 5%) than is typically used in pollen studies, as this will cause less damage to tests and other non-pollen palynomorphs. Although testate amoebae from pollen slides can provide useful paleohydrological records in peatlands, this may only be true in peat sequences dominated by taxa that can withstand the chemical treatments used in palynological preparations, as was generally the case here. Palynological samples from peat records dominated by taxa sensitive to palynological treatments are likely to produce unreliable quantitative reconstructions. Future palynological studies should acknowledge that key indicator taxa may be missing in pollen slides, which could have major implications for paleohydrological interpretations.
Supplemental Material
Supplemental_Material_Magnan_et_al._Revised – Supplemental material for A comparison of Holocene testate amoeba assemblages and paleohydrological records from pollen slides and wet-sieved peat
Supplemental material, Supplemental_Material_Magnan_et_al._Revised for A comparison of Holocene testate amoeba assemblages and paleohydrological records from pollen slides and wet-sieved peat by Gabriel Magnan, Terri Lacourse and Michelle Garneau in The Holocene
Footnotes
Acknowledgements
We thank M. Davies, M. Adeleye, K. Beer and J. Maillé-Bizier for help in the lab, and J. Beaulne for fruitful discussions. We would like to thank the two anonymous reviewers for their thoughtful comments on the manuscript.
Funding
The author(s) disclosed receipt of the following financial support for the research, authorship, and/or publication of this article: This research was supported by research grants to Terri Lacourse from the National Sciences and Engineering Research Council of Canada (342003) and Canada Foundation for Innovation (17214).
Supplemental material
Supplemental material for this article is available online.
References
Supplementary Material
Please find the following supplemental material available below.
For Open Access articles published under a Creative Commons License, all supplemental material carries the same license as the article it is associated with.
For non-Open Access articles published, all supplemental material carries a non-exclusive license, and permission requests for re-use of supplemental material or any part of supplemental material shall be sent directly to the copyright owner as specified in the copyright notice associated with the article.