
Abstract
A 3300 year-long reconstruction of paleoenvironmental moisture conditions was constructed from a sediment core from North Gate Bog (NGB) in the northern section of Range Creek Canyon within the Colorado Plateau. The methods used to analyze the record include loss on ignition (LOI), magnetic susceptibility (MS), elemental analysis with X-ray fluorescence (XRF), charcoal influx, isotopic analysis, elemental ratios and pollen percentages, influx, and ratios. This study adds two new insights to the paleoenvironmental record of the northern section of the Colorado Plateau. First, four climatic zones were established. Zone 1 (3300–2750 cal yr BP) had 100-year wet to dry variations with droughts recorded from 3300–3200, 3000–2900, and 2800–2700 cal yr BP. Zone 2 (2750–1600 cal yr BP) had an overall dry period with an 800-year transition to increased warmth and winter moisture. Zone 3 (1600–850 cal yr BP) had an overall warm, wet, summer precipitation climate conducive to the establishment of Zea Mays and Pinus edulis, two staple foods of the Fremont culture. The Medieval Climate Anomaly (MCA) registered warm and wet in this part of the Colorado Plateau. Zone 4 (850–0 cal yr BP) had a sharp transition to a drier climate from 850 to 400 cal yr BP. During the Little Ice Age (LIA), wetter climate taxon increases such as Artemisia, Cyperaceae, and Pinus edulis. The second overall finding in this study was that NGB was a place of human activity including Fremont farming. The identification of a Zea mays pollen grain confirms the archeological presumptions that this higher elevation site was used to farm corn along with other sites in Range Creek Canyon (RCC). The post Fremont occupation period was marked by a sharp increase in organic material and a return of pinyon-juniper woodlands.
Keywords
Introduction
Spatial and temporal moisture variability on the Colorado Plateau from the late-Holocene to present affected the physical environment and regional socioeconomic systems. Societies like those of the Fremont and the Ancestral Puebloan people who inhabited the Colorado Plateau from ~1 to 1300 CE (Madsen and Simms, 1998; Massimo and Metcalfe, 1999) including the time of the Medieval Climate Anomaly (MCA) (dated approximately from 900 to 1300 CE (Benson, 2007a; Coltrain and Leavitt; 2002; Petersen 1994)) were affected by multi-decadal periods of drought. Within Range Creek Canyon (RCC), UT (Figure 1), a Fremont Archeological Complex was established from 900 to 1300 CE with peak occupation estimated at 1050 CE (Boomgarden et al., 2014). An increase in summer moisture during the MCA may have facilitated the Fremont people to harvest Zea mays (corn) in RCC, a crop that requires summer moisture (Benson, 2011). A shift in moisture availability to a dry climate and the peak in population at 1050 CE may have then required the Fremont to abandon RCC.
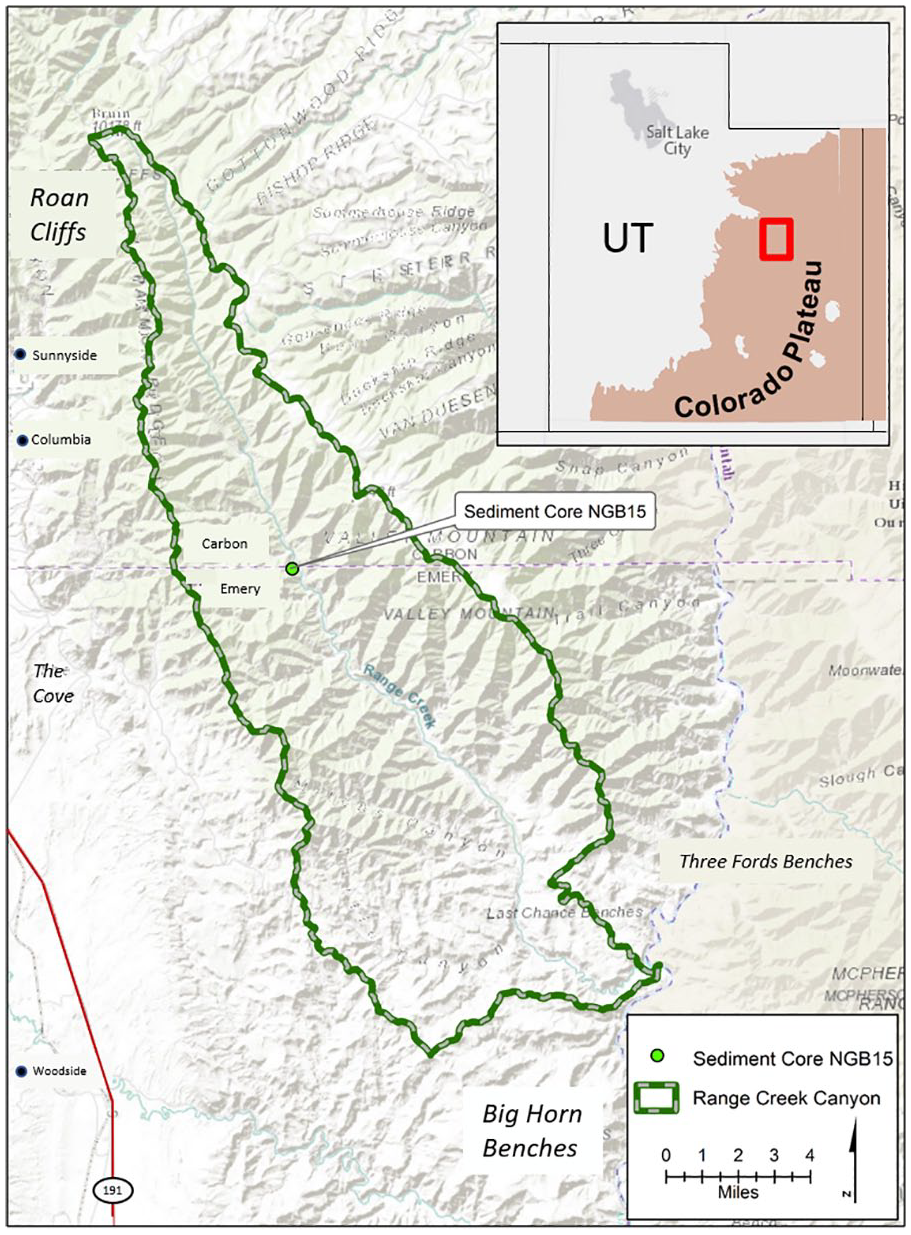
Location of North Gate Bog and Range Creek Canyon.
Recent temperature and moisture data, and future projections, suggest that the climate on the Colorado Plateau (210,000 km2) may be at a point of transition to drought able to be compared with multidecadal droughts in the historical and prehistorical record. Aridity may increase during the next two to three decades with particularly reduced winter rainfall (Abatzoglou and Parker, 2018; Cayan et al., 1999; Hereford et al., 2002; Meehl et al., 2007; Nijhuis, 2012). The recent quadrupling of the population in the last half century has raised concerns for the increasing need of water and food resources (Cehrs, 2013; Gober and Kirkwood, 2010; Hereford et al., 2002; Schwinning et al. 2008; Seager et al., 2007; Stocker et al., 2014). Long droughts reduce groundwater recharge, lower or deplete perennial stream flow, increase dust storms, and weaken the biological crust, which retains soil moisture and reduces erosion (Hereford et al., 2002; Schwinning et al., 2008). Multi-decadal droughts alter the structure and composition of ecosystems (Hereford et al., 2002). For example, tree mortality has been on the rise due to a longer wildfire season (Swetnam and Betancourt, 1998) and uncontrollable pest infestations (Miekle, 1950; Morris and Brunelle, 2012).
Here we use “multi-proxy” analyses of sediments to reconstruct changes in seasonal moisture and vegetation during the last 3300 years at North Gate Bog (NGB) (Figure 1) within RCC. We investigated sediment core North Gate Bog 2015 (NGB15) for seasonal paleoenvironmental changes and the presence of Zea mays during the Fremont occupation of RCC.
The importance of paleoenvironmental reconstructions in the northern portion of the Colorado plateau for the understanding of climate variations
Winter precipitation anomalies have been documented throughout the American Southwest (Cook and Seager, 2013; Mantua, 1997; Swetnam and Betancourt, 1998) with economic impacts estimated at $3 billion annually in cost and damages (Dettinger et al., 1998; Lott et al., 1997; Trout, 2012). Nearly 90% of the Colorado Plateau is used for ranching, a practice dependent on grasses and water availability to support livestock (Thurow and Taylor, 1999). After the 2002 drought, cattle numbers decreased from 733,000 to 498,000 according to the USDA National Agricultural Statistics Service (2018). Farming economies rely on government subsidies during times of drought (Schwinning et al., 2008) straining local and regional economies.
Drought on the Colorado Plateau can be an excursion from the normal precipitation (median precipitation 300 mm/yr (11.8 in/yr)) in the summer, the winter, or both (Dettinger et al., 1998; Hereford et al., 2002). Winter snowpack is important to support the establishment of perennial woody plant communities whose roots can reach deeper supplies of water (Ni et al., 2002; Weiss and Leake, 2006).
While paleoenvironmental reconstructions have added to the understanding of climate shifts in the southern portion of the Colorado Plateau (Davis, 1982; Dean, 1996; Maher, 1963, 1972; Mensing et al., 2008; Roy et al., 2012), and their effects on ancient cultures (Benson et al., 2007a, 2007b), the influence of pre-historic climate anomalies has received limited research attention around N 39° latitude where orographic lift depletes moisture from air masses. This northern part of the Colorado Plateau is influenced by two spatially separate moisture delivery systems. The westerlies that deliver available northern pacific winter moisture, and the North American Monsoon (NAM) that delivers available southern summer moisture. The climate modes of El Niño Southern Oscillation (ENSO), and the Pacific Decadal Oscillation (PDO) modulate the temporal variations of both. The response of subalpine forests, pinyon-juniper woodlands, riparian corridors, and grassy meadows to moisture boundary changes in the paleoecological record may provide information useable for future predictions of change in the area (Brown and Comrie, 2004; Cayan et al., 2010).
Since 2002, University of Utah researchers have been conducting archaeological, anthropological and paleoecological studies in RCC. Interdisciplinary research projects have contributed to environmental and ecological reconstruction of the canyon during the occupation of the Fremont people (Natural History Museum of Utah, 2014). Sediment cores from RCC have been extracted where rare springs create seeps in an otherwise dry landscape allowing for the extraction of sediment cores to add to the understanding of paleoenvironmental change in this arid environment.
Geologic, climatic, and ecological setting
Along the northwestern edge of the Colorado Plateau in east central Utah exists a system of canyons carved by millions of years of erosion of high subalpine plateaus to the desert valleys (Wannamaker et al., 2001). RCC is one of these naturally eroded pathways. The canyon is named after Range Creek, a tributary of the Green River. The bedrock of Range Creek Canyon is bordered by the western Book Cliffs a NNW-trending strata (composed of resistant Blackhawk Formation sandstone and an underlying Mancos shale) both dating to the Upper Cretaceous. The eastern Roan Cliffs are composed of inter-bedded sandstone and shales of the Colton Formation capped by mudstone, marlstone, oil-shale beds and thin sandstones of the lacustrine Green River Formation of the Eocene. Quartzite sandstone is interbedded with shale of the Colton Formation producing the steep benched slopes of the Tavaputs Plateau and the series of canyons by differential weathering. The valley floor gradually slopes from an elevation of 2010 m to 1600 m. At the southern section of the valley a portion of the Green River intersects the steep sandstone-wall-lined valley of RCC.
The study area lies in the northernmost reach of summer-dominant moisture delivered by the NAM and within the winter-dominant (Pacific) moisture regimes (Mitchell, 1976; Mock, 1996). It is also near the modern 42° N ENSO dipole boundary where computer modules show a lack of confidence in the effects of ENSO on climate (Heyer et al., 2017). The Colorado Plateau has been known to experience times of great drought (from multi-year to multi-decadal) due to changes in moisture delivery from variations of atmospheric and oceanic circulation patterns (Benson et al., 2007b; Dominguez et al., 2009; Metcalfe et al., 2010; Schafer, 1989; Schwinning et al., 2008).
Vegetation surveys of Range Creek Canyon revealed taxa of grass sedge meadow herb complexes (Ambrosia, Asteraceae spp., Brassicaceae spp., Carex nebrascensis, Phragmites austrialis, Typha spp., Poaceae spp., Solanaceae spp., Thalictrum spp., and Verbascum thapsus). Range Creek supplies water to a riparian corridor (Acer negundo, Ambrosia, Betula occidentalis, Fraxinus anomala, Populus spp. and Salix spp.), while the valley floor away from the riparian zone transitions from shrub (Artemisia tridentata, Ephedra nevadensis, Ephedra viridis, Prunus virginiana, Sambucus cerulea) to an expanse of regional conifer forests complex (Juniperus osteosperma, Juniperus scopulorum, Picea spp., Pinus edulis, Pseudotsuga menziesii, and Rosaceae spp.).
Methods
Site selection
North Gate Bog (NGB), so named because of its location within the northern boundary gate of to the University of Utah’s Range Creek field station (latitude 39.47004°, longitude –110.24095°, elevation 2019 m) was selected as a study site due to the occurrence of a riparian wetland. Vegetation changes quickly by elevation. The saturated sediments capture pollen from the surrounding forest (elevation 3104 m) on the Tavaputs Plateau, as well as from the eastern pinyon-juniper complexes intermixed with sagebrush-sedge meadow complexes to the riparian communities bordering Range Creek.
Field work
NGB15, a 4.28 m sedimentary core, was extracted in June of 2015 (latitude 39.407°, longitude - 110.181°, elevation 1756 m) using a 4-inch diameter vibracorer. The sediment core was then transported to the University of Utah where the lithology of the core was described at the Records of Environment and Disturbance (RED) lab upon opening. The core was then cut in half and photographed. One half of the core was archived (wrapped in plastic and aluminum). The other half of the core was partitioned into 1 cm sections, placed in sterile whirl packs, stored and refrigerated at ~1°C at the RED lab.
Lab work
Chronology
This sedimentary record is one of several obtained since 2005 within RCC. Old carbon contamination by lithological deposits has been a challenge when radiocarbon dating sedimentary deposits delaying the publication of the records extracted within the University of Utah’s study site. Because of this, part of the chronology for NGB15 (Figure 2) was established using single-grain quartz optically stimulated luminescence (OSL) dates to avoid misinterpretation of dates from the previously mentioned hydrocarbon contamination common in this area of the plateau (Rittenour et al., 2015). OSL dating consists of determining an age estimate for the last time the sediment was exposed to light. Unstable “electron traps” accumulate charge over time at the rate determined by the amount of background radiation at the location where the sediment was buried. Stimulating mineral grains using blue or green light causes a luminescence signal to be emitted as the stored unstable electron energy is released (Huntley et al., 1985). Three samples collected at 82 cm, 243 cm, and 430 cm were analyzed at the Utah State University (USU) Luminescence Laboratory and processed under the methods discussed in Rittenour et al. (2015).

NGB15 age model. Age analysis using the single-aliquot regenerative-dose procedure of Murray and Wintle (2003) on 1–2 mm small-aliquots of quartz sand. Number of aliquots used in age calculation and number of aliquots analyzed in parentheses. Equivalent dose (DE) calculated using the central age model (CAM) of Galbraith and Roberts (2012), unless otherwise noted. Overdispersion (OD) represents variance in DE data beyond measurement uncertainties, OD > 20% may indicate significant scatter due to depositional or post-depositional processes. DE calculated using the minimum age model (MAM) of Galbraith and Roberts. Zea mays pollen from NGB15 was given the date of 900 cal years BP (the height of Fremont occupation at Range Creek).
The presence of a clearly identifiable Zea mays pollen grain in the sediment core was marked with a date of 1050 CE (900 cal years BP) correlating with the height of the occupation of the Fremont culture in this area, (Boomgarden et al., 2014), a time when agriculture would support the largest population size as recorded in the amount of building structures.
The age model was established using CLAM 2.3.1 with the age-depth model set as a smoothing spline with a smoother of 0.4 (Blaauw, 2010) (Figure 2).
Loss on ignition and magnetic susceptibility
Loss on ignition (LOI) and Magnetic Susceptibility (MS) can reflect the changes in a depositional environment providing information of disturbance and stability possibly attributed to shifts in temperature, precipitation, vegetative land cover, rates of geomorphic weathering, and anthropogenic influences (Brett, 2014). LOI measures include the percent of organic content and the % CaCO3 in the sediment. An increase in the % CaCO3 in a wet meadow environment is highly correlated and thus a good indicator of increased aridity when carbonates are precipitated during times of higher evaporation (caliche formation). The sediment from NGB15 was sampled in 4 cm increments for LOI throughout the core following the methods of Dean (1974).
MS measurements (reported in SI units) were conducted at 1 cm intervals using a Bartington ring sensor equipped with a 75 mm aperture. The magnetic susceptibility was measured to identify the relative concentration of ferrimagnetic material. A highly positive MS measurement can indicate sediment with freshly eroded rock containing more terrestrial, iron-bearing minerals in the sediment or minerals often spontaneously magnetized after a fire. A low MS reading indicates that the composition of the sediments is high in organics (Gedye et al., 2000; Reynolds et al. 2001).
X-ray fluorescence
In the last 15 years, XRF has been applied to paleoenvironmental studies to detect the elemental composition of detrital sediment in a catchment area. Researchers have used the elemental composition of a sediment core to reconstruct the erosional processes through time (Boyle, 2000; Potts and West, 2008). XRF elemental analysis was conducted at the University of Utah’s RED lab. The entire 4.28 m of NGB15 was scanned using a portable Bruker III-SD series p XRF tracer. The current was set at 15 keV, 25 µ with a time - span of 30 s per trial. Major elements analyzed by weight % in this study included aluminum (Al), titanium (Ti), iron (Fe), silicon (Si), and calcium (Ca).
The ratio of Ca/(Ti + Fe + Al) (Figure 3) was created as an index to determine authigenic carbonate. As the Ca ratio increases it is assumed that detrital material was not introduced into the sediment and therefore Ca was locally precipitated. An increase in summer aridity can be inferred from several proxy records including an increase in % CaCO3 (formed during evaporation and drier/warmer times). Ti and Si represent bedrock weathering (Figure 4) and have proven to be high-resolution proxies for precipitation and erosion when compared to fluctuations in historical records (Metcalfe et al., 2010). Fe was used as a proxy for erosional events following a fire (Kylander et al., 2011).
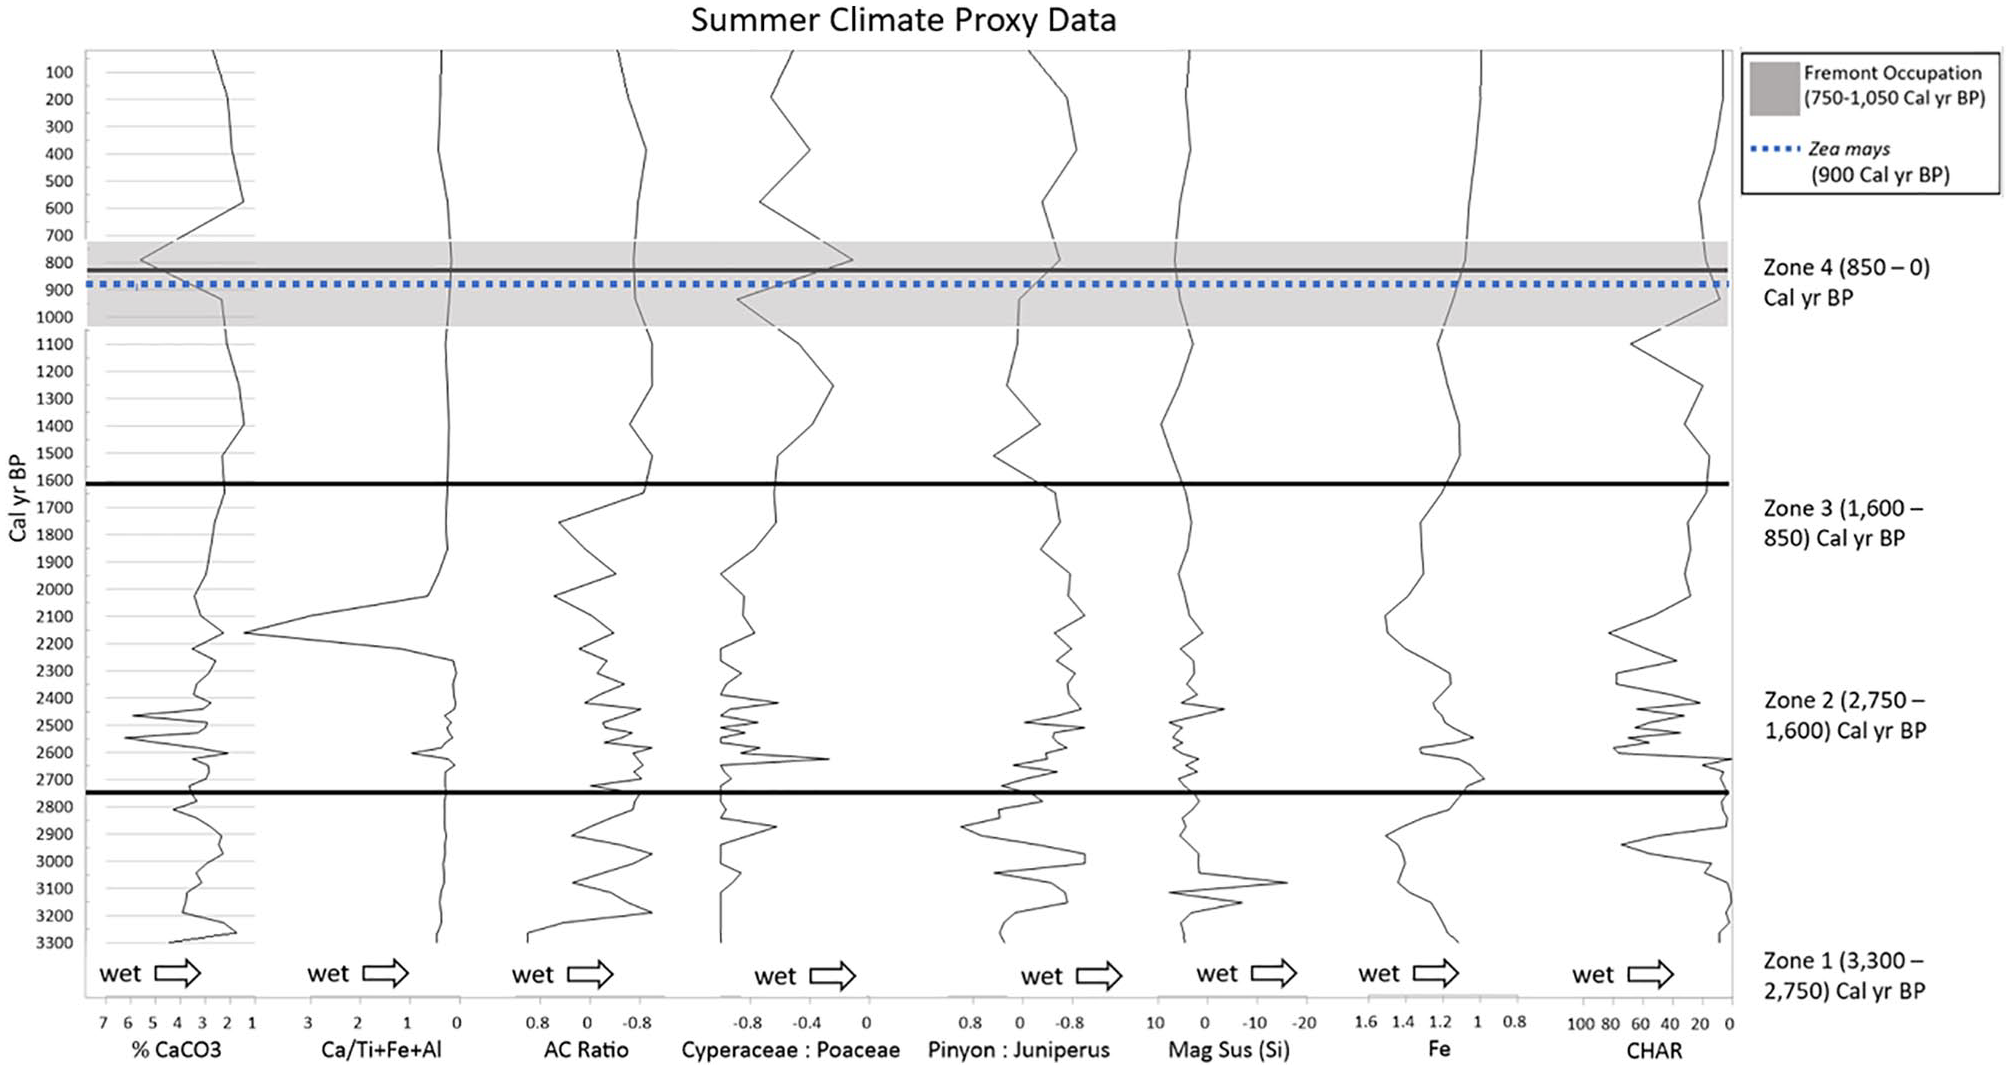
The results of eight summer moisture climate proxies, % CaCO3 graphed descending to more easily see moisture increases, Ca/Ti + Fe + Al showing local calcium formation, AC ratio an index of Artemisia: Chenopodiaceae + Sarcobataceae, Cyperaceae:Poaceae showing increases in wet meadow complexes during times of increased moisture, Pinus edulis to Juniperus (P:J). Pinus edulis is used as a proxy for increases in the strength of the NAM. MS, Fe, and CHAR are graphed descending to show times of decreased fire activity inferred during times of possible increased moisture.

The results of seven winter moisture climate proxies, % Pinus (not including Pinus edulis), % Picea, % Populus, % Ephedra, and the index of Artemisia:Ambrosia all winter moisture favoring taxa. The elements Ti and Si (% weight) were used as a measure of physical weathering most likely to occur from freeze/thaw activity.
Pollen analysis
The percentage of various taxa (Figures 4 and 5) on the landscape captures the interrelatedness of the taxa and the vegetation composition (Morris et al., 2010). An increase in mesic taxa would support the interpretation of increased precipitation. Changes in the vegetation composition through time should also demonstrate climate variability as moisture specific taxa increase or decrease.
Taxa abundance is best represented using calculations of pollen influx in a lake environment, however, in a high elevation meadow the deposition rate can be highly variable. In the NGB environment, influx may be interpreted as a reflection of varying degrees of detrital dilution. Pollen influx was calculated and grouped by taxa type (Figure 6).
Pollen samples (1 cc) were processed at 8 cm intervals from 1 cm to 420 cm using the methods established by Faegri and Iversen (1989). Lycopodium, an exotic spore, was used as a tracer and added to each pollen sample during processing. Pollen samples were examined using light microscopy at 500× magnification and counted to a minimum of 300 grains of terrestrial pollen or Lycopodium. A North American Southwest reference collection and dichotomous keys were used for identification of pollen (e.g. Erdtman, 1931; Kapp, 2000). Pollen records in this study are shown in percent, influx, and ratios (using percentages). A stratified constrained cluster analysis was conducted using CONISS in the program Tilia to identify times of stratigraphic vegetation change (Grimm, 1987). The zones were labeled Zone 1 to Zone 4.
Ratio values of pollen taxa percentages were used to estimate seasonality of precipitation. Pollen indices were calculated with the formula (a − b)/(a + b) (Maher, 1963, 1972), to look at individual taxon against another single taxon and were used to assess paleoenvironmental change on the landscape from disturbance or climate change (Mensing et al., 2008). A higher number of taxa that favors winter moisture would represent an increase in snowpack, for example, Artemisia:Ambrosia (Art:Am) (Artemisia = winter wet). The particular indices used to assess summer-climate conditions (wet:dry) include a ratio of Artemisia:Amaranthaceae + Sarcobatus (AC index) (Ward et al., 2016), Cyperaceae:Poaceae (C:P), and Pinus edulis:Juniperus (P:J) (Pinus edulis = summer wet) (Petersen, 1994)). A scan for Zea mays was conducted every 8 cm at 10× magnification for the entire length of the core to determine its reliability as a chronological determinant.
Stable carbon isotope analysis
For this study the first 100 cm of the sediment core were sampled at intervals of every other centimeter and sent to the University of Wyoming’s stable isotope facility to measure the ratio of stable carbon isotope (13C/12C) using a Costech 410 Elemental Analyzer coupled to a Thermo Delta Plus XP IRMS. Terrestrial plants use one of three metabolic pathways (C3, C4, CAM). Carbon isotope fractionation depends upon which of the three photosynthetic pathways is used to metabolize atmospheric CO2. Most plants, including cool season grasses, trees and shrubs use the C3 pathway which preferentially utilizes 12C over 13C during photosynthesis (Coltrain et al., 2007). Mean delta values of 13C/12C of sediment can reveal the relative abundance of C3 or C4 metabolic pathway plants. Values of −26.7 ± 2.7 per mil are the norm for sediment with the presence of plants employing the C3 pathway (Webb et al., 2007). Few flowering plants and all warm-season grasses, including Zea mays, use the C4 metabolic pathway and δ 13C/12C values usually register around −10.1 ± 0.7 per mil (Cerling et al., 1998; Coltrain and Leavitt, 2002; Smiley and Robins, 1997). The reason for running this analysis for this sediment was to establish the isotopic signature of Zea mays to mark agriculture during the Fremont occupation.
Charcoal analysis
Samples of 1 cc/cm of sediment for charcoal analysis were collected and analyzed the entire length of NGB15 core and were prepared following Whitlock and Millspaugh (1996). Retrieved charcoal materials were sieved at >250 microns and >125 microns then placed on gridded petri dishes and counted using light microscopy at 40×.
Results
The results presented below are organized into the paleoecological zones. The zones are then further divided by proxies indicative of an increase in summer versus winter precipitation. A final section is included analyzing overall vegetative changes within each zone.
Zone 1 (3300–2750 cal yr BP) 100 year climate shifts
Summer-climate proxy data
Geochemical moisture proxies for this period indicate a highly variable time (Figure 3). For example, % CaCO3, and the index of Ca/Ti + Fe + Al (proxies for aridity) decrease. The AC index, the C:P index, and the P:J index show centennial variability and an increase in summer moisture at 3300, 3100 and 2900 cal yr BP (with a slightly lagged response in the C:P index). MS results also indicate centennial changes in Zone 1 (Figure 3). MS (which detects ferromagnetic material produced during fires and often linked to an increase in aridity) decreases at 3100 and 2900 cal yr BP. Fe and charcoal influx (CHAR) decrease at 2900 cal yr BP (indicating less fire activity) (Figure 3).
Winter-climate proxy data
Winter-climate geochemical and pollen proxy data also indicate a highly variable climate from 3300 cal yr BP to 2750 cal yr BP. Most winter proxy data (Figure 4) show an increase in winter moisture at 3100 cal yr BP including the visible increase in the pollen percentage data of Pinus, a small increase in Picea, Populus, and Ephedra. The values of Ti and Si rise at 3100 cal yr BP. From there every 75–100 years climate proxies indicate a shift in moisture from winter dry to winter wet. Winter moisture significantly increases at 2900 cal yr BP and 2750 cal yr BP.
General vegetation change
Changes in the percent of pollen vegetation types can reveal a changing environment (Figure 5). During the Zone 1 interval, conifer pollen is dominant according to the fossil pollen percentages. Shrub pollen such as Rosaceae increases from 2400 cal yr BP to 1700 cal yr BP. The percent of Poaceae pollen, the most prevalent herb, is consistently above 25 throughout the record. However, during Zone 1, Poaceae has frequent peaks. In general pollen influx during Zone 1 is dominated by conifer pollen (Figure 6).
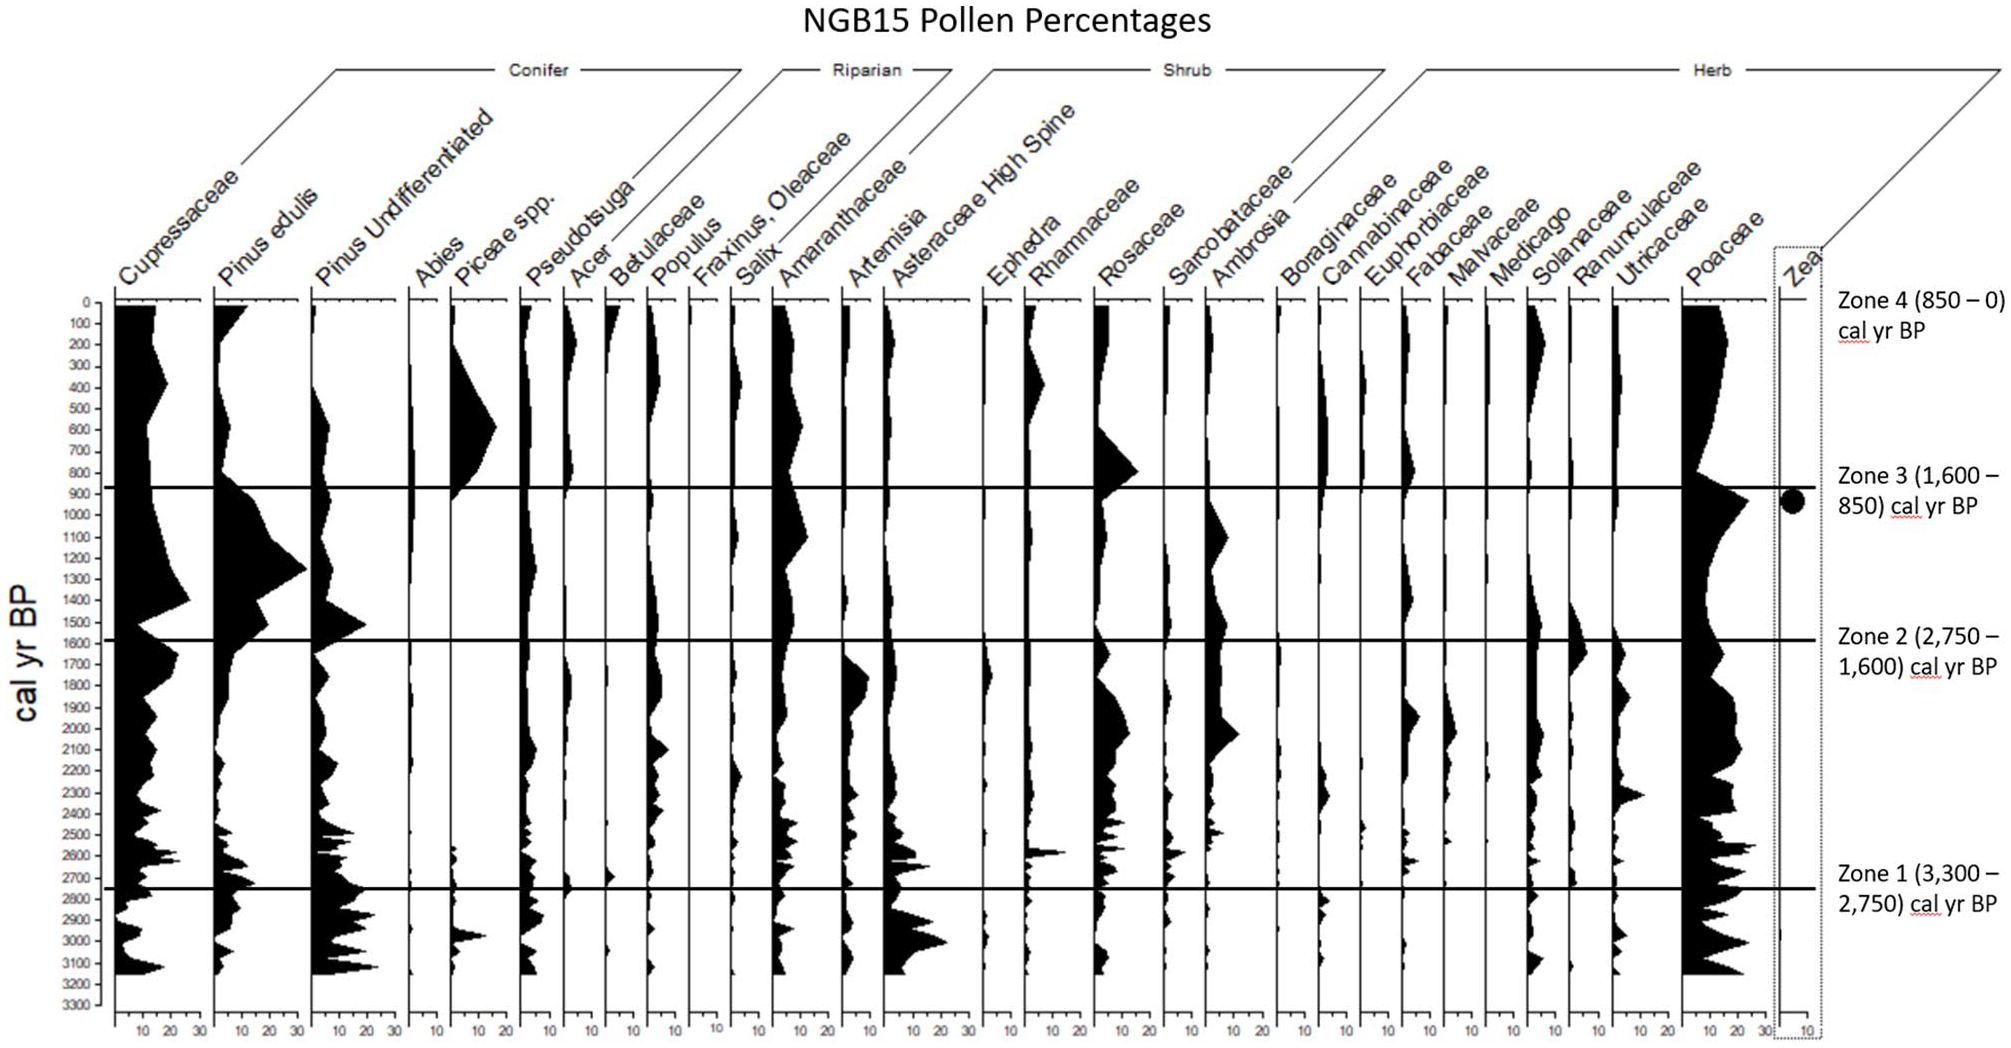
Percentage of taxa identified in NGB15 grouped by vegetation type (conifer, riparian, shrub, and herb). Coniss analysis defined four major zones based on changes in taxa.
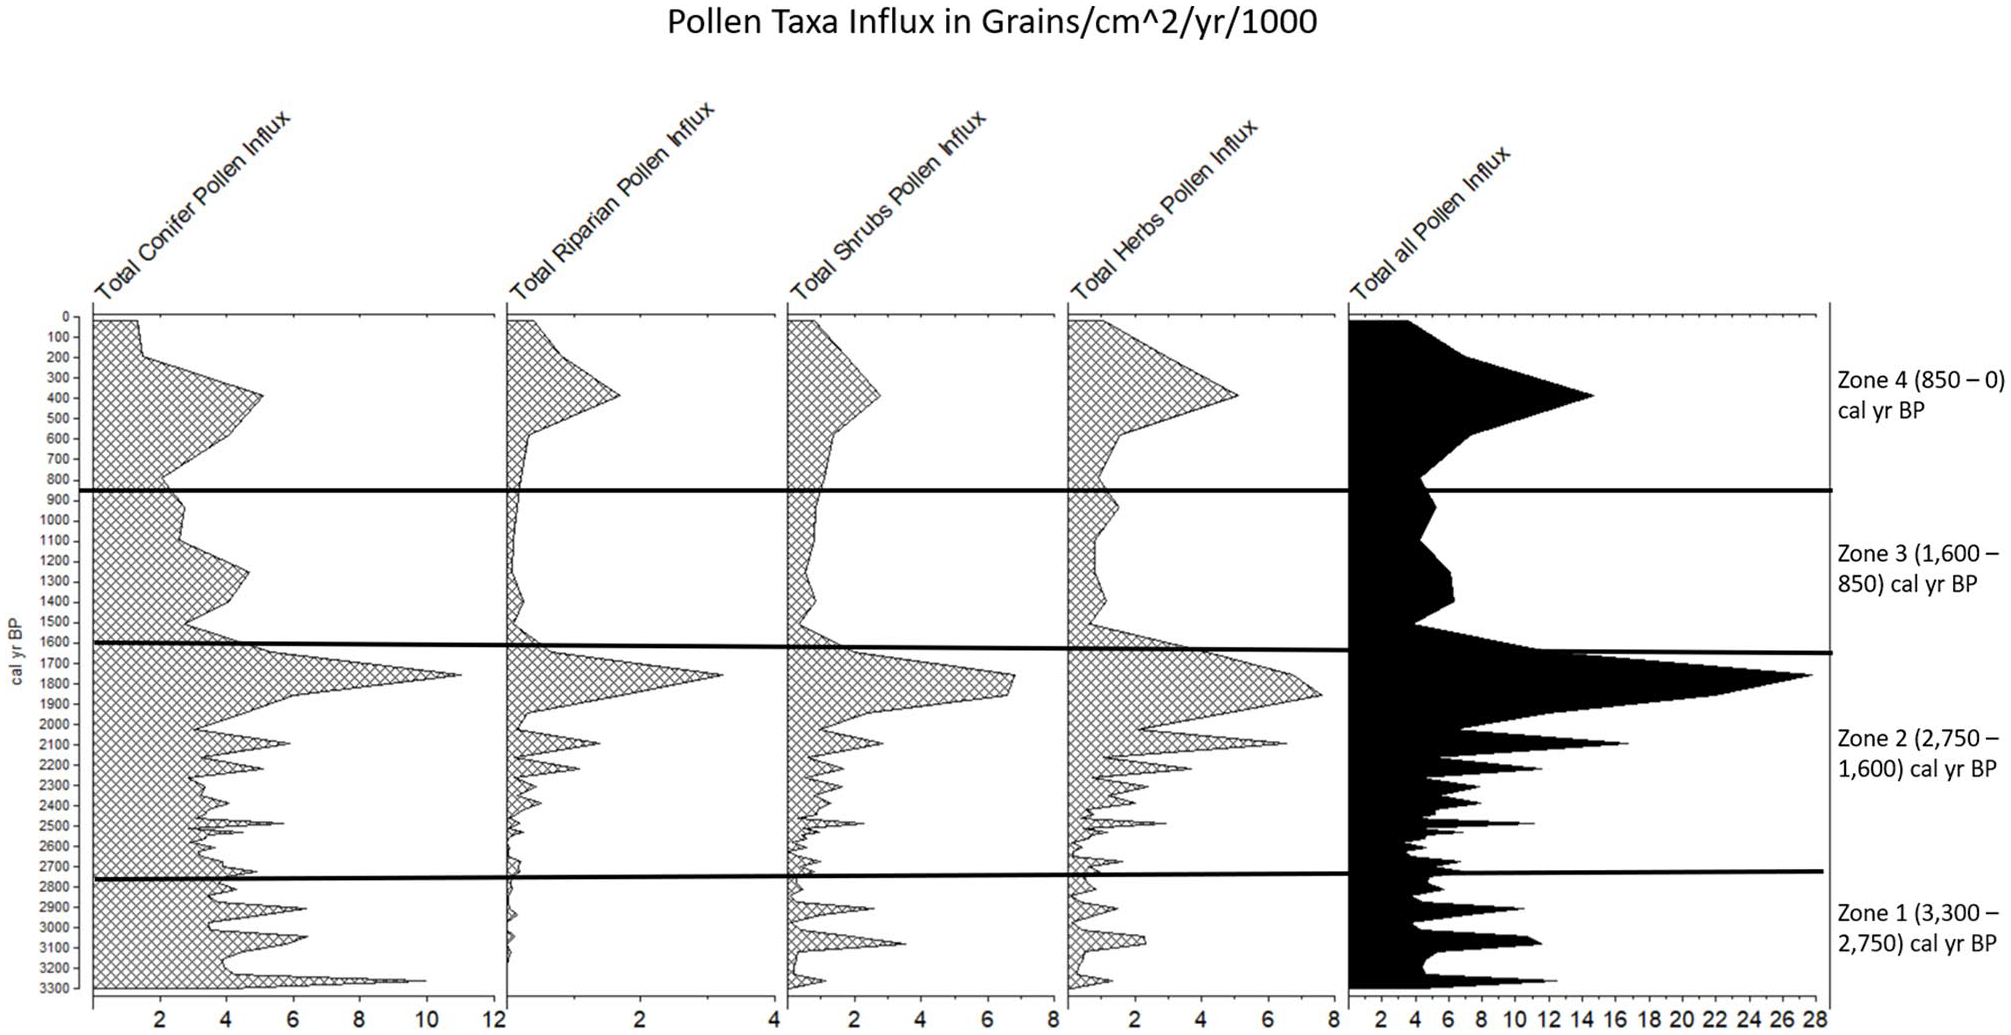
NGB15 pollen influx values by taxa type. Influx values show a large number of conifers on the landscape early in the record up to 2000 cal yr BP. All taxa increase dramatically ~1800 cal yr BP and ~500 cal yr BP.
Zone 2 (2750–1600 cal yr BP)
Summer-climate proxy data
Summer moisture proxy data (Figure 3) show less variability within Zone 2 in general. At the beginning of Zone 2 (~2750 cal yr BP to 2550 cal yr BP) LOI measurements indicate % CaCO3 decreases, indices including the Ca/Ti + Fe + Al, AC ratio, and P:J, decrease. MS, Fe, and CHAR show a slight increase (Figure 3). A decrease in % CaCO3, Ca/Ti + Fe + Al, AC, and P:J can be seen at 2200 cal yr BP where one can infer an increase in aridity. Also, at 2200 cal yr BP, Pinus edulis, a proxy for the NAM (Petersen, 1994), strength declines (Figure 5). No Picea was present in the fossil pollen. After 2200 cal yr BP riparian taxa including (Acer, Betulaceae, Fraxinus, Populus, and Salix) gradually begin to increase. Total PAR increases as well (Figure 6).
At the end of Zone 2 (1800–1600 cal yr BP), % CaCO3, and elemental ratios do not fluctuate more than 1.5%. However, at 1750 cal year BP a brief change in direction of summer proxy data signifies an increase in summer aridity. Pollen influx data (Figure 6) show a decrease in all groups at 1750 cal yr BP. In addition, at 1750 cal yr BP, shrubs and grasses begin to increase. Shrub pollen identified includes Amaranthaceae, Artemisia, Asteraceae, Ephedra, Rhamnaceae, Rosaceae, and Sarcobataceae and percentage levels of Asteraceae dominate the record at this time. Artemisia and Rosaceae are dominant for a 200-year period from 1800 to 1600 cal yr BP.
Winter-climate proxy data
Winter-climate proxy data also show 50 to 100-year variability early in Zone 2 from ~2750 cal yr BP to ~2400 cal yr BP (Figure 4). A peak in winter-wet-climate proxy data can be seen shortly after 2500 cal yr BP where pollen percentage data show an increase in Pinus, Populus, Ephedra, and Artemisia. Ti and Si also increase post 2500 cal yr BP. At 2100 cal yr BP, the pollen percentage of Populous, Ephedra, Ti, and Si, begin to decrease showing a turn towards a dry winter-climate. 1750 cal yr BP shows a peak in winter moisture proxy data followed by a sharp decline.
General vegetation change
Zone 2 begins with an increase in winter moisture ~2400 cal yr BP. The increase in winter moisture is followed by an increase in all taxa types as indicated by the overall increase in the influx of pollen after 2200 cal yr BP (especially coniferous and herbaceous taxa (Figure 6). In particular, Cupressaceae, Pseudotsuga, Poaceae, Fabaceae, and Ambrosia increase. Riparian taxa fossil pollen such as Populus and Rosaceae also rise in percentage (Figure 5).
Zone 3 (1600–850 cal yr BP) before and during Fremont occupation
Summer-climate proxy data
Zone 3 shows little fluctuation in % CaCO3 between 1600 and 1300 cal yr BP with no more than 1.5% variability. An increase in summer moisture proxy including the indices of Cyperaceae:Poaceae, P:J, and a decrease in values of MS, and CHAR is noted at ~1200 cal yr BP. An increase in riparian taxa can also be seen ~1250 cal yr BP (Figure 6) followed by a decrease in CHAR until 1000 cal yr BP. However, a sharp increase in CHAR is noted ~1100 cal yr BP that then declines to a low point ~910 cal yr BP a few years before the peak of Fremont occupation in RCC. Figure 5 shows an increase in Rosaceae fossil pollen ~950 cal yr BP. An increase in the influx of shrubs is noted at 950 as well (Figure 6). Zea mays is identified and marked at 900 cal yr BP. After the peak of the Fremont occupation period, summer moisture proxies show an increase in summer aridity (e.g. % CaCO3 increase, and the indices of C:P and P:J decrease).
Winter-climate proxy data
Winter moisture proxy data indicate increased winter wet including a decrease in % CaCO3, an increase in the pollen percentages of Populus, and a slight increase in the Ti and Si at 1500 cal yr BP only to decrease until ~1100 cal yr BP. The peak of winter moisture proxy data is near the peak of the Fremont occupation period at 900 cal yr BP (Figure 4). Winter proxy data values decline post 900 cal yr BP.
General vegetation change
Zone 3 shows a decrease in all taxa pollen influx (Figure 6). A slight increase in fossil pollen percentages (Figure 5) of Pinus edulis from 1300 to 1100 cal yr BP is noted. Amaranthaceae, Ambrosia and Poaceae increase from 1200 cal yr BP to 850 cal yr BP.
Zone 4 (850–0 cal yr BP) post Fremont to European settlement
Summer-climate proxy data
Following a period marked by increased aridity (latter part of Zone 3), summer-climate proxy data (Figure 3) show an increase in % CaCO3 from 800 cal yr BP to 600 cal yr BP. During the same time-interval, P:J increases, while C:P decreases. It is not until 600 cal yr BP that C:P increases again peaking at 400 cal yr BP. Charcoal influx during Zone 4 (Figure 4) decreases from 250 particles/cm2/yr to less than 10 particles/cm2/yr at 0 cal yr BP. A small increase is seen ~150 cal yr BP. Climate proxy data indicate an increase in summer moisture from ~200 cal yr BP to 0 cal yr BP.
Winter-climate proxy data
Winter-climate proxy data indicate an increase in winter moisture peaking at 600 cal yr BP with a steady increase of the pollen percentage of Pinus, Picea, and increases in the index of Artemisia:Ambrosia. Ti and Si increase from 800 cal yr until 0 cal yr BP (Figure 4).
General vegetation change
Solanaceae, whose pollen percentages were steady until Zone 4, increase at100 cal yr BP (Figure 5). Rosaceae and other shrubs show a steady rise from 500 cal yr BP to present. Poaceae steadily increases from 750 cal yr BP to present. Pollen influx (Figure 6) calculations show an increase in all taxa at 500 cal yr BP. The AC ratio shows little change until ~400 cal yr BP when it indicates an increase in the influx of Artemisia.
Isotopic analysis
Isotopic analysis results showed no evidence of C4 plants on the landscape. The δ13C values were all in the range of −26.2 to −27.7. This is evidence of C3 plants which do not include the tropical grasses such as Zea mays.
Discussion
The objectives of this research were to assess variations in seasonal moisture variability during the past 3300 years at RCC and to examine these variations in the context of human occupation including an assessment of climatic conditions during the Fremont Occupation. Several proxies were used to determine seasonal variations including geochemical and ecological indicators that increase during climate periods dominated by summer-wet regimes (Figure 3) versus winter-wet regimes (Figure 4). Sedimentary proxies were compared to evaluate potential signals of moisture variability.
Special consideration to paleoenvironmental change was given to the Fremont Occupation period (~900 cal years BP) to determine the feasibility of agriculture. The finding of Zea mays would indicate a climate warm and wet enough to facilitate agriculture at NGB and in the vicinity.
Late-Holocene climate (3000–0 cal yr BP)
The late-Holocene has been of interest to climate scientists and anthropologists because it is marked by short periods of increased moisture allowing for migration and settlement of ancient cultures followed by a time of increased aridity associated with pre-historic cultural diasporas (Axtell et al., 2002; Benson et al., 2007a, 2007b; Nelson and Schachner, 2002), vegetative stress (Davis, 1982), and dietary changes of ancient cultures (Coltrain and Leavitt, 2002).
Late-Holocene climate research on the Colorado Plateau has traditionally been conducted in the southern plateau where a rich collection of archaeological records from early Puebloan societies, including the Anasazi, have been the focus (Benson et al., 2007a, 2007b; Powell and Smiley, 2002). The research suggests that after 300 years of population increases, some societies such as those at Long House Valley and Black Mesa saw a period of low population growth for ~200 years followed by a sudden collapse by 650 cal years BP (1300 AD) (Axtell et al., 2002; Smiley and Robins, 1997). The Medieval Climate Anomaly (MCA) 1000–700 cal yr BP (950–1250 AD) is associated with several megadroughts. Cook et al. (2004) established droughts in the western U.S. from 1050 to 650 cal yr BP and decadal droughts centered on the years 1015, 915, 800, and 695 cal yr BP. The last megadrought, peaking at 700 cal yr BP (1253 CE), has been proposed to have been the reason for the collapse of the Puebloan culture on the Colorado Plateau (Cook et al., 2007). Other cultures of the Colorado Plateau appear to have had similar decreases in population during the MCA when agriculture failed (Benson et al., 2007a, 2007b). Vegetation also responded to drought conditions (Miller and Wigand, 1994). In the late-Holocene, for example, changes in moisture governed the expansion and retraction of mid-elevation pinyon-juniper (PJ) woodlands (Betancourt and Van Devender, 1981; Breshears et al., 2005; Miller and Wigand, 1994) and timberline fluctuations (Anderson et al., 2000; Petersen and Mehringer, 1976).
The discussion here will focus on the shifts in climatic/moisture patterns within a northern section of the Colorado Plateau revealed through the proxy data. The possible influence of climate on the Fremont culture occupation as well as the environmental changes which may have in-turn influenced the Fremont will also be discussed.
Zone 1 (3300–2750 cal yr BP) 100-Year Climate Shifts; Overall Wet
Variable climate characterizes Zone 1. Significant climate fluctuations occur on 100-year time scales. Evidence of three periods of summer moisture increases occur at 3300 cal yr BP, 3100 cal yr BP, and 2900 cal yr BP. Winter precipitation appears to fluctuate synchronously with summer moisture increases and at the same temporal scales coinciding with moisture increases at 3100 cal yr BP and 2900 cal yr BP. According to pollen percentages, peaks in summer moisture are followed by increases in members of the Asteraceae family and Ambrosia, however riparian taxa decline. The addition of an increase in conifer pollen influx and percentage supports the continued winter moisture of Zone 1. The overall trend, indicated by the particular presence of certain taxa, suggests a time of cool wet winters and cool dry summers. For example, Picea is abundant indicating cool summers and wet winters. Ambrosia is absent which indicates cool summers and more snow than rain on the landscape.
Erosion increases at this time as seen in the increase of detrital material (Ti). An increasing signal for Ti indicates times of increasing detrital material or physical weathering as opposed to chemical weathering (Figure 4) in the sediment of Zone 1. This is interpreted as a period of increased freeze/thaw activity driven by increased winter moisture.
Charcoal influx begins to increase ~3100 cal yr BP and continues to increase at 2900 cal yr BP perhaps due to the increase of fuel connectivity from the increased summer and winter precipitation (Figure 3) as well as overall increased fuel availability as seen in the pollen influx data (Figure 6). Although this is the only large peak in fire activity in Zone 1, time between fires appears to range from every 10 to 25 years as seen in the CHAR record (Figure 3). This suggest that fire frequency increased but with limited severity to the vegetation (Mueller et al., 2014).
Zone 2 (2750–1600 cal yr BP) transition to summer aridity to wet post 2500 cal yr BP
Zone 2 captures a transition from a highly variable, predominantly wet summer-climate, to a less variable more arid summer-climate after ~2600 cal yr BP. Geochemical proxies captured the transition from an erosion-prone environment (unstable vegetation cover from increased fire activity or less vegetation over soil) to a more stable meadow complex as Si and Ti decrease after 2500 cal yr BP (Figure 4). From 2800 cal yr BP to 2600 cal yr BP the frequency of fires appears to increase, inferred from values of CHAR continuously ⩾100 particles/cm2/yr. CHAR peaks in the early part of Zone 1 reflecting high fuel loads and hot dry summers (Figure 3).
The fossil pollen record indicates a warm and very dry summer early in the record. This linked with increases in CHAR indicate heightened aridity leading to an increase in fire events and erosion. After 2500 cal yr BP NGB transitions from a conifer woodland to a high elevation meadow conducive to herbaceous taxa. Grasses and riparian taxa expand on the landscape with substantial increases towards the end of Zone 2. Especially wet episodes include 2600 cal yr BP and 2400 cal yr BP as Artemisia, Cyperaceae, Pinus edulis, and Ambrosia all increase depicting an increase in overall moisture especially summer precipitation. Riparian taxa, shrubs, and herbs all increase on the landscape post 2500 cal yr BP. This could have been due to an increase in the NAM.
Summer-wet indices in Zone 2 such as C:P and P:J show an initial summer-wet climate at 2700 cal yr BP transitioning to an increase in aridity ~2200 cal yr BP. After 2200 cal yr BP, C:P and P:J indicate a time when summer moisture does not largely fluctuate. A decrease in the AC ratio, C:P ratio, and the P:J ratio indicates an increase in summer ~1950 cal yr BP.
The continuous amount of charcoal entering the basin starting ~2200 cal yr BP may be due to small summer-season fires or background fires. From 2000 cal yr BP fire looks to be continuously on the landscape. The 1949 cal yr BP drought captured in the dendrochronology record nearby by Knight et al. (2010) is seen in the Range Creek Record as the pollen percentage of Amaranthaceae, Poaceae, and authigenic Ca increases as seen in the Ca/(Ti + Fe + Al) index. Authegenic Ca increases during times of dryness suggesting increased evaporation.
Zone 3 (1600–750 cal yr BP) before and during Fremont occupation, warm, summer wet
The arrival of the Fremont culture from 1050 to 750 cal yr BP is encapsulated within the latter part of Zone 3. This time also captures the MCA (1000–700 cal yr BP), a time usually associated with increases in temperatures and aridity in the American Southwest. The paleoenvironmental changes as seen at RCC before and during these events are discussed below.
Before the arrival of the Fremont, or the MCA, MS results between 1900 cal yr BP and 1500 cal yr BP (pre-Fremont) indicate high amounts of erosion in and around the wetland environment. Exposed soils may have caused higher sedimentation rates and higher rates of slope erosion. These changes could be linked to increased fire activity inferred from the CHAR data (Figure 3), beginning ~1450 cal yr BP. Charcoal influx shows a large magnitude peak (250 particles/cm2/yr) at ~1500 cal yr BP. The large peak may be due to an increase in fire activity or one large fire event after a drop in winter moisture indicated by the drop in the pollen percentage of Pinus, Ephedra, and Artemisia (Figure 4) around this time period. Fuel may have been increasingly dry leading to a substantial fire episode. The large CHAR peak is followed by a decrease in influx of charcoal until 1000 cal yr BP. The decrease may be linked to the maintenance of the landscape by people of the Fremont culture harvesting firewood and continuously clearing the land with small fires (Morris, 2010).
Pollen influx values (Figure 6) steeply decline in all taxa ~1500 cal yr BP. The lack of vegetation may be due to fire depleting the landscape of all plant communities including Juniperus. The low Pinus pollen at this time whose pollen is transported to far distances also indicates a large scale event depleting Pinus in the vicinity. At 1500 cal yr BP, a small increase in CHAR may be linked to a large decrease in overall vegetation cover. One possible explanation is regional fires may not be recorded in the local record of NGB. A rise is seen in disturbance taxa such as Ambrosia, Boraginaceae, and Urticaceae (Figure 5) indicating the first step in vegetative succession after fire and or erosion (McAuliffe et al., 2006). Migrating people may have found NGB ready for cultivation after the large fire and may have then encouraged the settlement shortly after. PAR rebounds ~1250 cal yr BP.
The time period from 1050 cal yr BP to 750 cal yr BP marks not only the MCA but the time of Fremont occupation at RCC. Summer-climate proxies during the MCA show more available summer moisture until ~850 cal yr BP. The winter-climate during the MCA at RCC showed an increase in moisture from 1050 cal yr BP until 900 cal yr BP at which point PAR data (Figure 6) support a shift towards aridity. Taxa percentages represent wet and warm summers with a rise in Pinus edulis, an increase in Ambrosia and low percentages of Artemisia fossil pollen. Picea is not represented in the pollen record yet Amaranthaceae, Ambrosia, and Sarcobatus dominate indicating dry and warm winters (low Artemisia, low Picea) or perhaps warm wet winters with most of the precipitation falling as rain instead of snow.
Pollen percent and influx data (Figures 5 and 6) supports the occupation of the Fremont during 1050 cal yr BP to 750 cal yr BP. A decrease in conifer pollen influx is observed just before the Fremont period. Conifers, in particular, decline (Figure 5) perhaps due to recruitment of the wood for fuel and structures. The key pollen taxa marking the occupation of the Fremont was the identification of a Zea mays pollen grain at 900 cal yr BP. Zea mays (corn) is a type of Poaceae that cannot grow without cultivation and has been found in several granaries throughout the canyon (Boomgarden, 2015; Metcalfe, 2008). The presence of Zea mays at NGB supports the use of this location in the canyon for agriculture which had not been established until this study. The availability of enough summer moisture to grow corn at NGB is supported by the increase in Pinus edulis and Ambrosia, both summer moisture requiring taxa. Picea also requires summer moisture and can be seen in the NGB15 record during the height of the Fremont occupation (900 cal yr BP). The percent of % CaCO3 and MS results for NGB15 support changes in the vegetative structure of the canyon coinciding with the height of the Fremont occupation perhaps from clearing and agriculture. High rates of erosion indicate agricultural development and resource exploitation (Drever, 2005).
The low MS results from 700 cal yr BP to present supports the proposed Fremont abandonment period. Elemental results (Ti and Si) from this period indicate decreased rates of erosion which suggest structural stabilization of the canyon due to lack of land cultivation and recovery of native vegetation due to lack of periodic burning and/or resource exploitation by human inhabitants (Morris, 2010). After 1000 cal yr BP charcoal influx drops significantly to less than 20 particles/cm2/year. Elemental analysis results that could be linked to the Fremont departure include the decrease in Ti values post 1000 cal yr BP. During the Little Ice Age (LIA), winter-wet climate taxa increase at NGB such as Artemisia, Picea, and Cyperaceae. Summers may have been drier than previous summers as seen in the decrease of Ambrosia and Pinus edulis.
Zone 4 (750–0 cal yr BP) post Fremont to European settlement summer wet regime
Zone 4, from 750 cal yr BP to present, captures the post-Fremont period as well as the arrival of European settlers who introduced ranching practices to RCC in the mid-1800s. At ~750 cal yr BP, the record indicates a drastic shift to a drier than previous climate as suggested by the increase of Amaranthaceae and Poaceae (Figure 5). Without essential moisture in the northern section of the Colorado Plateau the Fremont culture may have been forced to exit the canyon. An interesting marker of this time is the rise in pollen influx of all taxa (Figure 6) during the time frame of 800–400 cal yr BP which during Zone 4, had previously shown little fluctuation. The sharp increase in overall vegetation post-Fremont occupation perhaps shows the unmanaged growth of North Gate Bog after cultivation ceased (Figures 5 and 6). A disturbance such as a flash flood may have caused high rates of organic material deposition into the wetland environment directly after the departure of the Fremont culture and may mark a time of a successive recovery of the vegetation at this site.
After the abandonment of the canyon ~750 cal yr BP, a transition ~600 cal yr BP occurs as both summers and winters appear to have increases in moisture. Summer wet taxa such as Pinus edulis and Ambrosia increase as do winter wet taxa such as Artemisia. Cyperaceae also increases ~600 cal yr BP also showing a shift to a more meadow like environment. CHAR during Zone 4 (Figure 4) decreases from 250 particles/cm2/yr to less than 10 particles/cm2/yr at 0 cal yr BP. A small increase is seen ~150 cal yr BP. This increase may be due to the arrival of European settlers who arrived around this time to RCC. The ranchers introduced grazing which reduced the fuel load for fires.
Conclusion
This study provides evidence of climatic variability during 3000 years of record presented in the sediment core of NGB15. It also verifies the cultivation of Zea mays and related agricultural practices at NGB. A summary of paleoenvironmental shifts is offered in Table 1. The record represents a new and critical contribution to Colorado Plateau paleoecological and archaeological history.
Summary of inferences from proxy data obtained from NGB15 and the relationship of NGB15 data to the regional conclusions of climate changes during the same period.
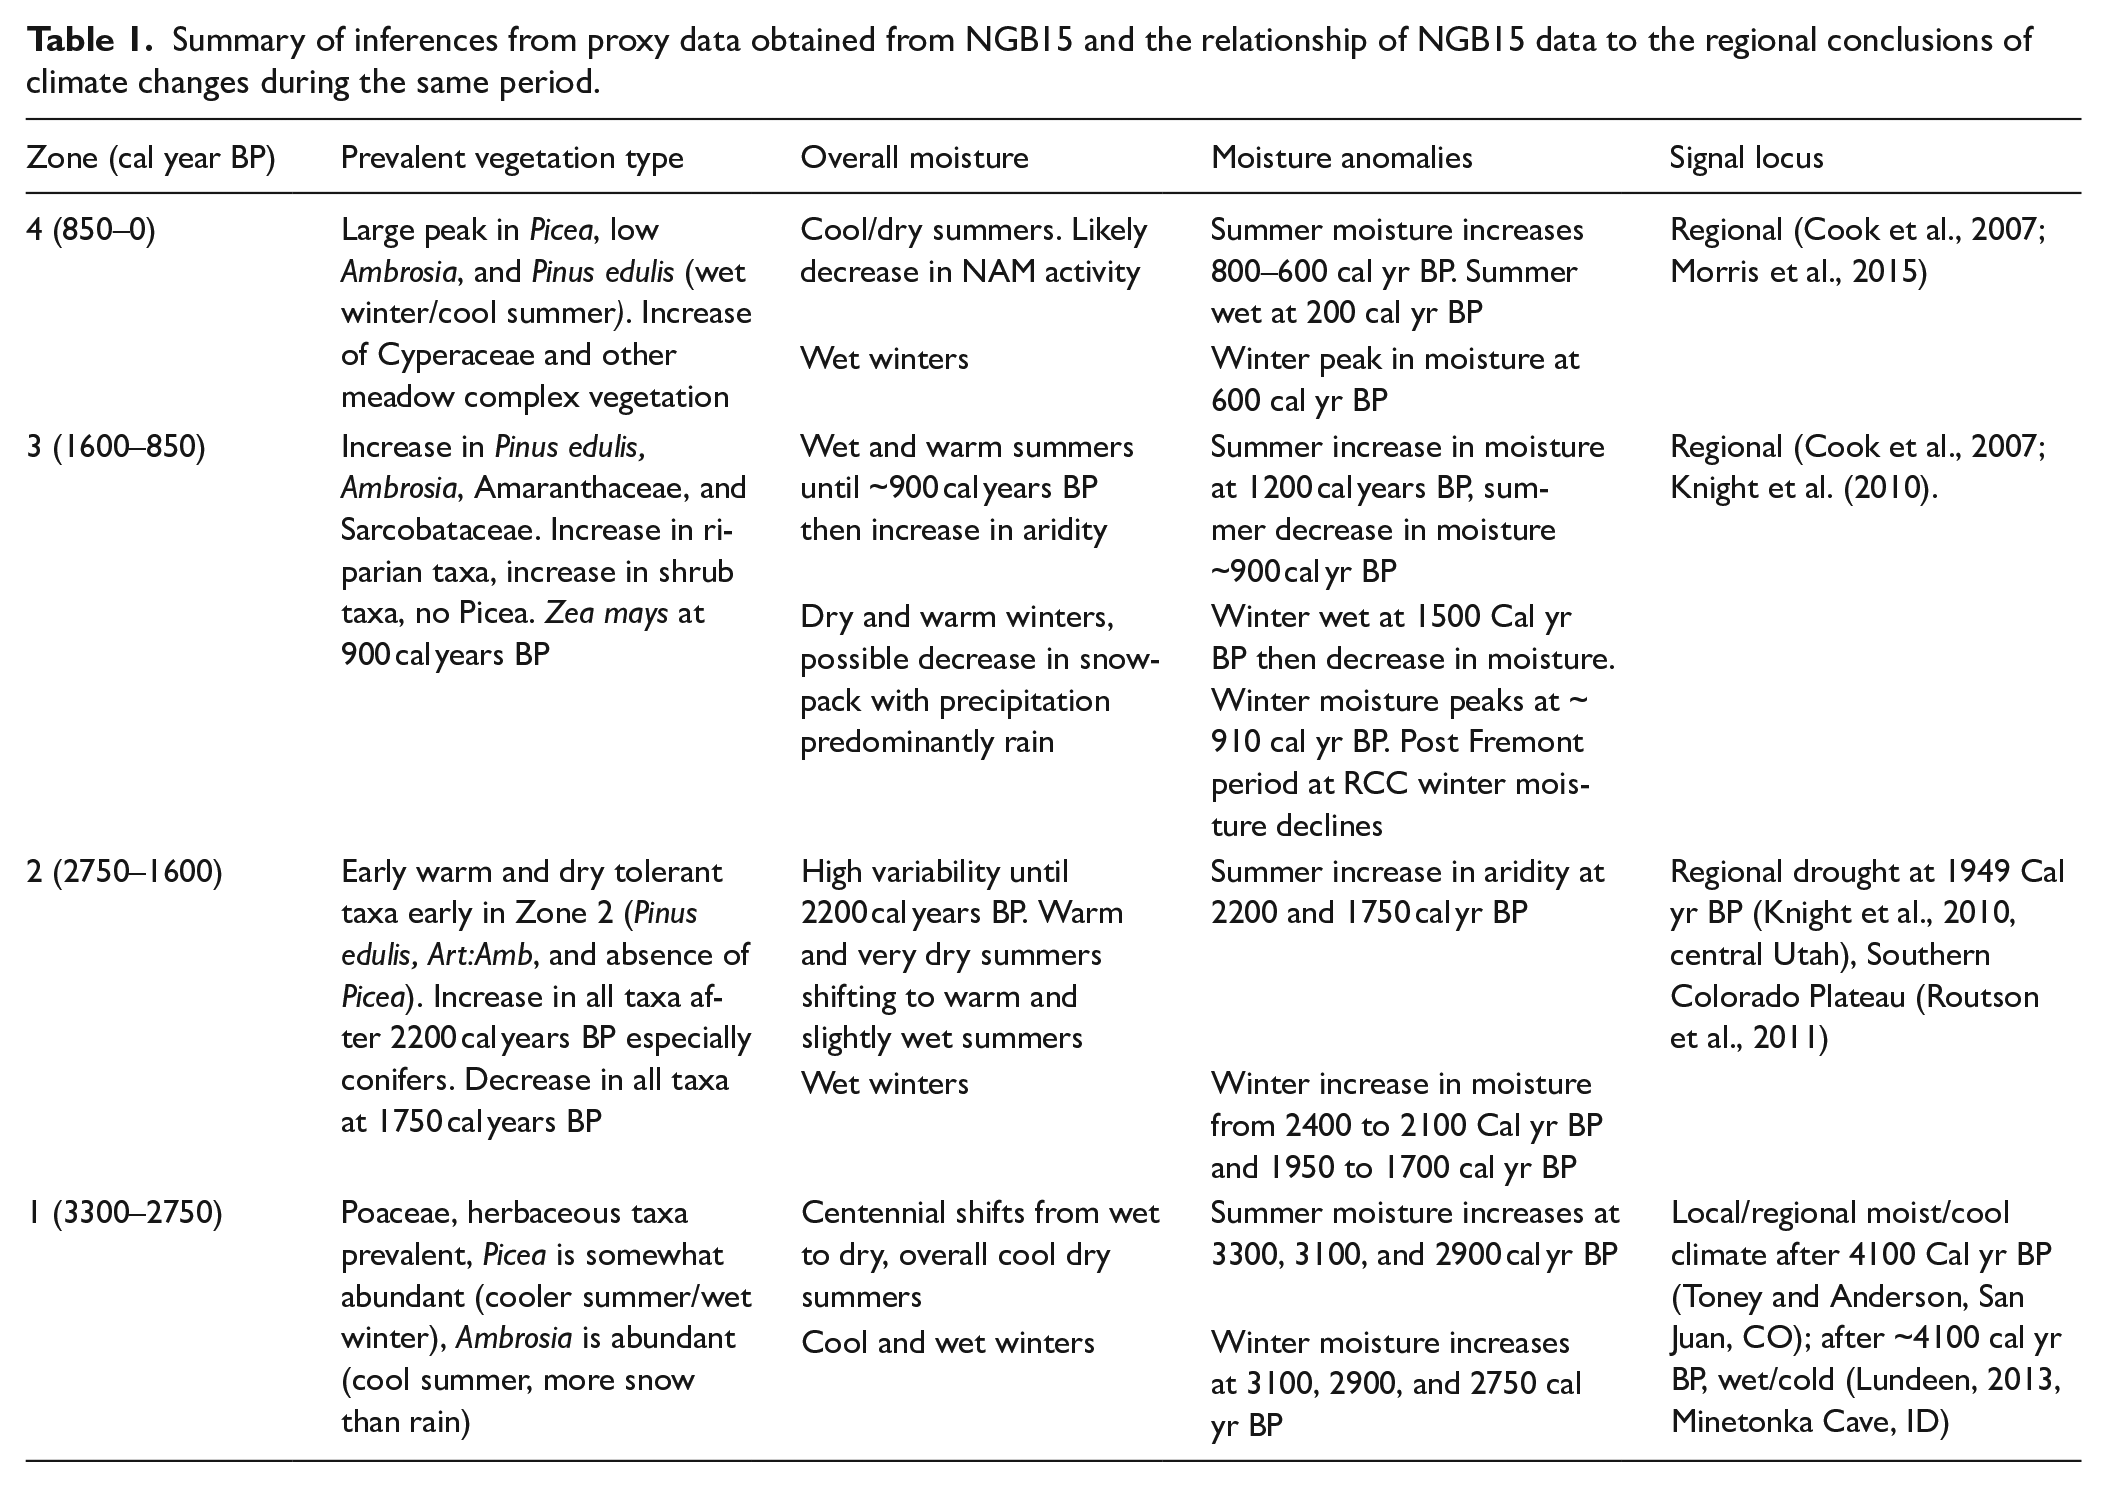
The NGB paleoenvironmental record as revealed by several proxy studies from NGB15 sediment core suggest some key insights into the RCC region that should be considered when assessing current and future changes driven by seasonal climate variability. Moisture regimes such as those seen in the early record from this study show that the vegetation at NGB responds to variability in the delivery of seasonal moisture. Four zones were established. The vegetational changes suggested climate and seasonal moisture variability. Zone 1 is a zone of 100-year moisture-to drought variations with an overall trend of cool wet winters and cool dry summers. Zone 2 is inferred to have been a time of warm and very dry summers early on with a shift to warm and slightly wet summers by the end of the zone. Zone 3 captures an overall warm, wet, summer precipitation climate conducive to the establishment of Zea mays and Pinus edulis, two staple foods of the Fremont culture. The MCA looks to have been a transition from wet to dry in this part of the Colorado Plateau. Zone 4 encapsulates a sharp transition to wet winters and cool dry summers from 850 cal yr BP to 400 cal yr BP. During the LIA, wet climate taxa increase at NGB such as Artemisia, Cyperaceae, and Pinus edulis. Ambrosia declines supporting the transition to cool dry summers.
The understanding of changes in seasonal moisture delivery lead to better management decisions for the conservation of water in the northern section of the Colorado Plateau whose snowpack levels are of major importance (Pederson et al., 2011). In this study an increase in summer moisture was often followed by an increase in fire activity. A decline in winter precipitation was followed by a decline in riparian taxa which may indicate desiccation of ephemeral streams including Range Creek. Winter moisture decline was also evident during the times of the MCA.
This study captures the effects of anthropogenic influence as seen in the introduction of disturbance taxa such as Urticaceae. The identification of Zea mays adds to the understanding of areas where the Fremont dry farmed within RCC which had not been established to have occurred at NGB until this study. It also shows the link between the vulnerability level of climate variability and specific taxa. It is however, difficulty to tease out the causes of disturbance on the landscape during the MCA since times of increased aridity coincided with the Fremont occupation. However, a decline in winter moisture in regional paleoecological records may be indicative of climate driven disturbance.
Footnotes
Acknowledgements
Special thanks to Duncan Metcalfe, Shannon A. Boomgarden, and Corinne Springer of the Natural History Museum of Utah for their continued support for this research. Special thanks also to Isaac Hart and Larry Coats, Stacy Morris for their sharing their expertise of Range Creek Canyon. Thank you to Tammy Rittenour and her staff at the Utah State University OSL Lab, and the University of Wyoming Isotope Lab.
Funding
The author(s) disclosed receipt of the following financial support for the research, authorship, and/or publication of this article: Funding for this study was made possible with funding from the Natural History Museum of Utah and the Donald R. Currey Scholarship.