
Abstract
Peat cores from boreal bog and fen sites in the Hudson Bay Lowlands of Northern Ontario, Canada, were analysed to calculate Holocene carbon accumulation rates, and to show how testate amoeba taxonomic assemblages, inferred depths to water table, and four morpho-traits that may be linked to function (mixotrophy, aperture size, aperture position, and biovolume) changed since peatland initiation. Carbon accumulation rates were on average higher for the Holocene in the fen record (19.4 g C m−2 yr−1) in comparison with the bog record (15.7 g C m−2 yr−1), which underwent a fen-to-bog transition around 6900 cal yr BP. Changes in rates of carbon accumulation were most strongly driven by changes in rates of peat vertical accretion, with more rapid rates in the fen record. Carbon accumulation rates were highest following peatland initiation when reconstructed water tables were highest, and in the late Holocene, when water table positions were variable. Taxa with larger biovolumes and apertures were generally more abundant when reconstructed water tables were higher, most notably following peatland initiation. Mixotrophic taxa were more prevalent in drier conditions and in the bog record. Changing frequencies of morpho-traits suggest that testate amoebae may occupy a higher trophic position in the microbial food web during wetter periods, signaling the possibility of internal feedbacks between peatland ecohydrology and critical ecosystem functions including long-term carbon accumulation.
Introduction
Northern peatlands are a significant carbon pool in the terrestrial environment, storing at least 500–1000 Pg C (Nichols and Peteet, 2019; Yu et al., 2010). The accumulation of carbon in these ecosystems is variable through space and time, responding to factors such as hydrology, climate, and wetland type (Bunbury et al., 2012; Loisel et al., 2014; Roulet et al., 2007). Understanding the mechanisms that controlled carbon accumulation in the past is critical to understanding the response of northern peatlands to current and future climate change, as well as evaluating these ecosystems as future sources or sinks of carbon.
The Hudson Bay Lowlands Ecozone (HBL) is the largest wetland complex in Canada, covering >372,000 km2 across the northern parts of the three Canadian provinces Manitoba, Ontario and Québec (Martini, 2006; Riley, 2011) (Figure 1). The HBL has accumulated approximately 30 Pg carbon in the form of peat over the Holocene (Packalen et al., 2014). As the HBL is a mosaic of mostly bogs and fens, with more limited extents of swamp and marsh (Riley, 2011), understanding how these different peatland types accumulate carbon is at the forefront of furthering understanding of the variability of ecosystem carbon storage across physical gradients (Packalen et al., 2016). Further, as the magnitude of environmental change and associated change in ecosystem function in northern regions of Canada is expected to be substantial (Bush and Lemmen, 2019), quantifying the roles of these factors is essential to predicting future net carbon balances.
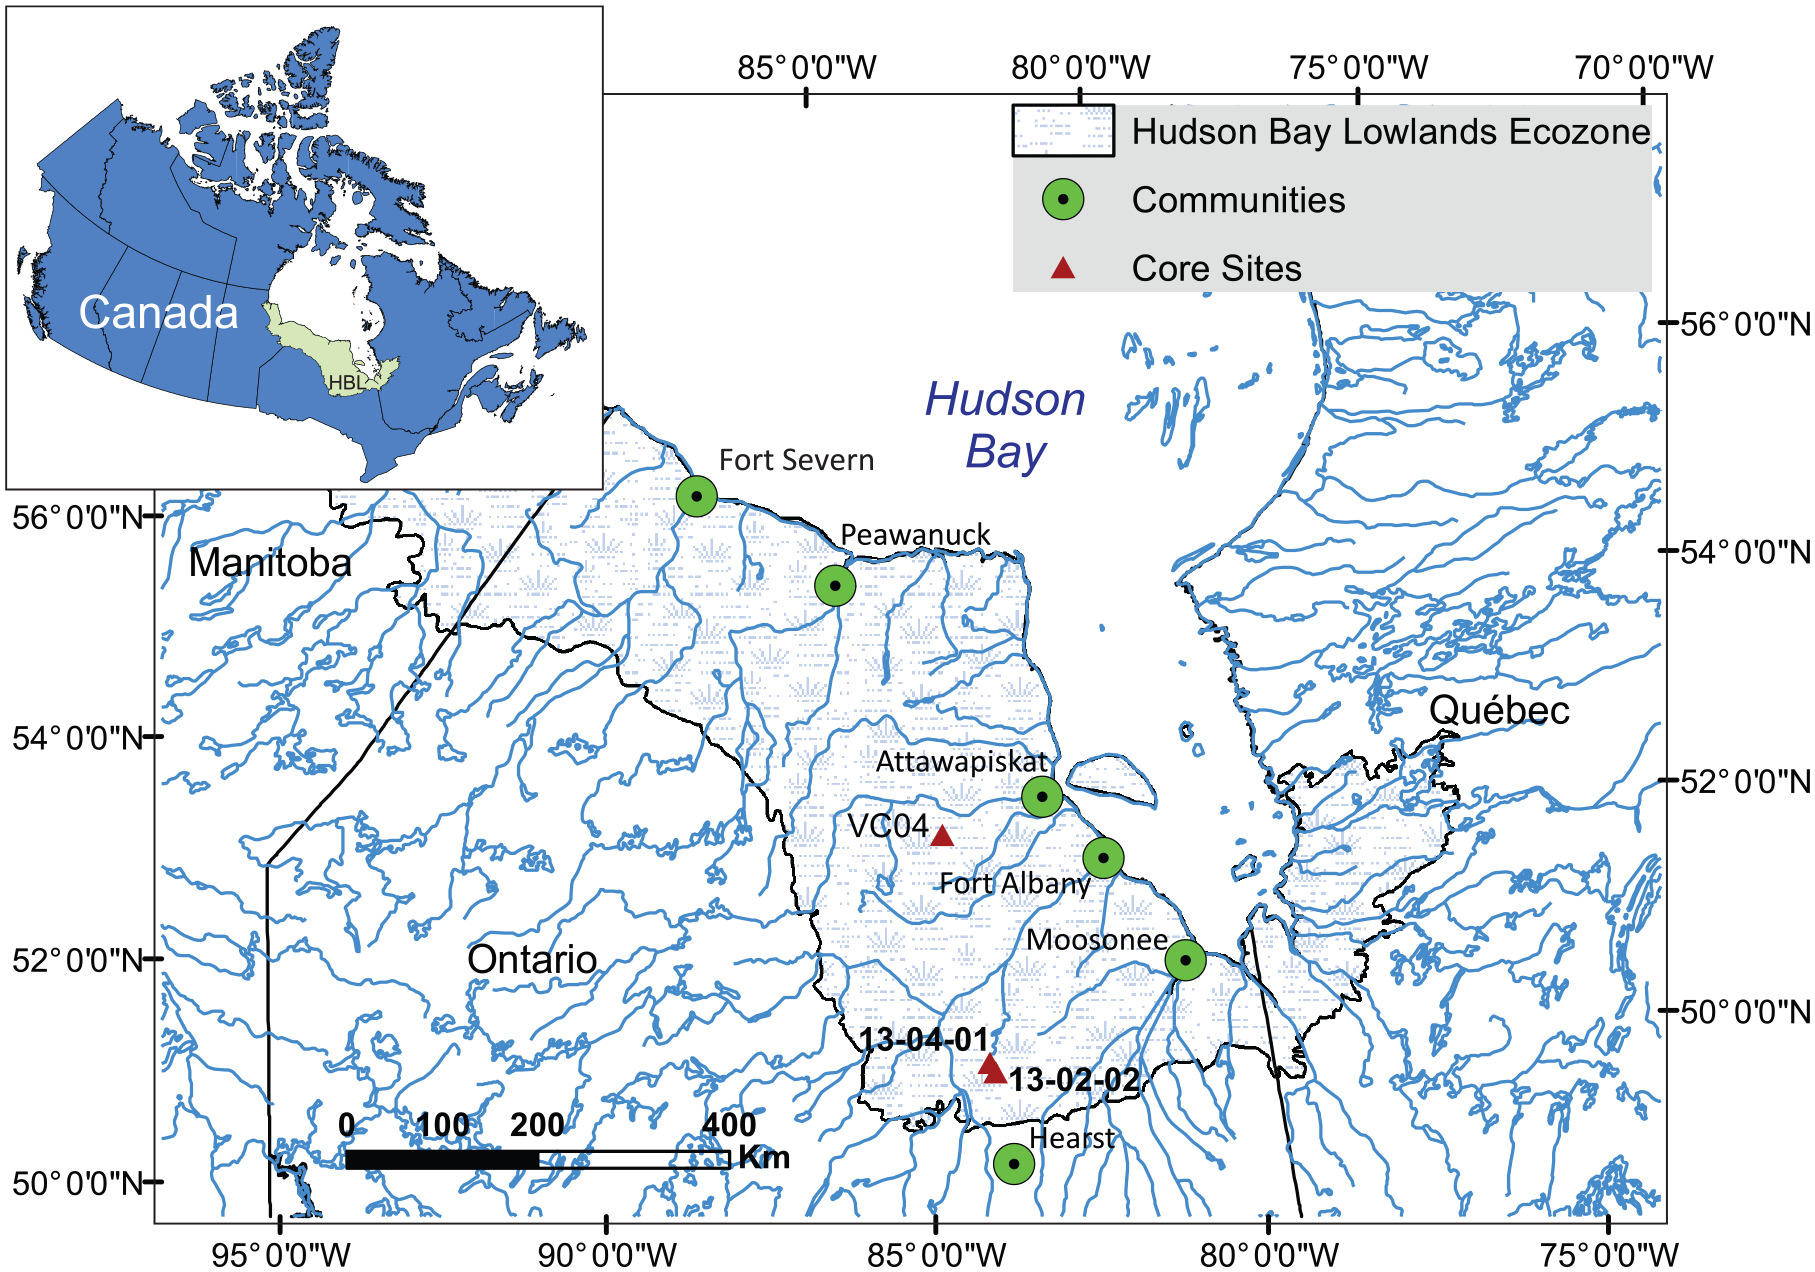
Map showing locations of the bog core (13-02-02), fen core (13-04-01) and VC04 bog site (Bunbury et al., 2012) in the Hudson Bay Lowlands Ecozone, Canada.
Fen peatlands in the HBL are minerotrophic, with a water table more consistently at or close to the surface, circum-neutral pH and the vegetation is dominated by sedges, grasses and bryophytes which may or may not include Sphagnum moss (Hargan et al., 2015; Riley, 2011). Bog peatlands in the HBL are generally nutrient poor and while there is often considerable heterogeneity across the bog surface, on average they have a greater depth to water table (DWT) than fen peatlands. Further, bog peatlands are characterized by more acidic porewater pH and vegetation dominated by Sphagnum species (Riley, 2011). These differences in vegetation, hydrology and topography impact ecosystem function through differences in organic matter quality, microbial communities and photosynthetic capacity, with associated impacts on carbon accumulation rates (CAR) (Bunbury et al., 2012; Loisel et al., 2014; O’Reilly et al., 2014; Roulet et al., 2007). Typically, higher water tables and more groundwater influence in fens can promote higher carbon densities and thus, CAR in fen sites can exceed that of bog sites (Bunbury et al., 2012; Loisel et al., 2014; O’Reilly et al., 2014). However, greater recalcitrance of Sphagnum-dominated peat and sometimes greater peat depths in bogs can result in higher carbon masses per unit land area for bogs than fens (Packalen et al., 2016). Furthermore, fen to bog transitions in many bog records complicate the comparisons (Loisel et al., 2014). In the present study, cores from one bog and one fen site in the HBL are analysed to compare the effects of peatland type and ecohydrological change on carbon accumulation.
Testate amoebae are cosmopolitan protists residing in water films on peatland plants and soils and have been widely used as proxies for paleohydrology (Booth et al., 2010; Charman et al., 2000; Fournier et al., 2015; Mitchell et al., 2008). Transfer functions are used to produce quantitative reconstructions of changes in DWT over decadal to millennial timescales (Amesbury et al., 2018; Booth, 2007; Booth et al., 2010; Lamarre et al., 2013; Mitchell et al., 2008). In addition to paleohydrological reconstructions by transfer function, analysis of testate amoebae preserved in peat cores also permits identification of shifts in the frequencies of taxa with particular morpho-traits that may be linked to ecosystem function, including carbon and nutrient cycling (Fournier et al., 2015; Jassey et al., 2013, 2015; Koenig et al., 2017, 2018). Analysis of morpho-traits is emerging as a complementary approach to transfer functions, as it can provide insights on changes to light availability, dust flux, nutrient and wetness gradients, and can be readily linked to ecosystem function (Koenig et al., 2018; Lamentowicz et al., 2020; Payne et al., 2016; Van Bellen et al., 2018). As a result, developing paleohydrological transfer functions concurrently with analysis of morpho-traits of testate amoebae can provide insights into the mechanisms linking ecohydrological changes to observed changes in ecosystem function. In this study, the morpho-traits of aperture size, aperture position, test biovolume and percentage of mixotrophic individuals are evaluated.
These morpho-traits are likely related in some way to the trophic position of testate amoebae in the microbial food web, and thus may be linked to nutrient cycling (Koenig et al., 2017, 2018; Lamentowicz et al., 2020; Payne et al., 2016). While there are some exceptions, drier, oligotrophic and more shaded conditions are often correlated with greater abundances of smaller taxa with smaller cryptic or ventral apertures (Koenig et al., 2017, 2018). Similarly, wetter, nutrient rich and more open conditions often correlate with larger taxa with larger terminal or central apertures (Koenig et al., 2017, 2018). As larger apertures typically reflect the ability of testate amoebae to consume larger prey (Koenig et al., 2018), this may signify that testate amoebae with larger apertures can occupy a higher trophic position in wetter peatlands. The trophic position of testate amoebae is important with regards to nutrient cycling as it can dictate the predation pressure put on decomposer organisms such as bacteria or fungi, as larger taxa are typically associated with eukaryvory and smaller taxa with bacterivory (Koenig et al., 2017; Payne et al., 2016). As fens are generally wetter and more nutrient rich than bogs, testate amoeba taxa common in fens may possess functional traits adaptive in those conditions such as larger biovolumes and larger, more terminal, or central apertures. Fen to bog transitions may be associated with decreases in the frequencies of these morpho-traits, and increases in mixotrophic taxa (Koenig et al., 2018), as DWTs can increase across those transitions and nutrient availability declines. These hypotheses have been difficult to evaluate to date due in part to a relative lack of testate amoeba records from minerotrophic fen contexts.
Mixotrophy is a physiological trait that directly impacts the function of testate amoebae and their role in peatland nutrient cycling (Jassey et al., 2015). Mixotrophy occurs in testate amoebae when there is abundant light availability and colonization by symbiotic zoochlorellae algae permits occupation of highly oligotrophic environments (Jassey et al., 2015; Koenig et al., 2018; Lamentowicz et al., 2020). Mixotrophic taxa them to be more abundant in drier, oligotrophic and open conditions due to the lack of available prey for heterotrophic taxa, and the abundance of available light for photosynthesis (Koenig et al., 2017, 2018; Lamentowicz et al., 2020; Payne et al., 2016; Van Bellen et al., 2018). Mixotrophic taxa have the potential to contribute to peatland carbon cycling directly through carbon fixation and indirectly as predators of decomposers (Jassey et al., 2015; Koenig et al., 2018). As a result, shifts in proportions of mixotrophic taxa could impact peatland carbon and nutrient cycling as mixotrophic taxa often make up a significant proportion of the overall testate amoeba assemblage, particularly in bogs where most testate amoeba paleoecological records have been produced (Creevy et al., 2017; Jassey et al., 2013, 2015). Ultimately, the ratio of mixotrophic to heterotrophic tests may contribute to the mechanisms behind the variability in the strength of a peatland’s carbon sink although these questions have been poorly explored, again in part because there are fewer available testate amoeba records from fens and few studies considering the functional role of testate amoebae in Holocene peatlands.
Through estimates of Holocene carbon accumulation rates at a fen and a bog site, paleohydrological reconstructions and analysis of testate amoebae assemblages and frequencies of morpho-traits, this study aims to (1) reconstruct DWT since peatland initiation at these sites using a testate amoeba-based transfer function, (2) compare rates of carbon accumulation in the fen and bog sites in the context of other regional records, and (3) consider how the abundance of mixotrophic taxa and testate amoeba morpho-traits co-vary with paleohydrology and relate to ecosystem function.
Methods
Study site and core chronology
This study compares peat cores collected from a present-day bog (Core 13-02-02; (50.6269°N, −83.8933°W; 138 m asl) and a present-day fen (Core 13-04-01; 50.5923°N; −83.8645°W; 148 m asl), located ~4 km apart within the Hudson Bay Lowlands Ecozone (Figure 1). Cores were collected using a Russian peat corer with a 50-cm barrel. The core from the bog site (13-02-02) was 169 cm in total length, with peat-inorganic contact at a depth of 154 cm. The presence of basal inorganic sediments indicates that the core captured post-glacial peatland initiation. The bog site had a depth-to-water-table (DWT) of 25 cm below the surface on the date of sampling (30 July 2013), and the pH of surficial porewaters was 4.2 as measured by a hand-held meter. The fen core (13-04-01) length was 250 cm, with the contact between peat and basal inorganics at a depth of 221 cm. The DWT at the fen site was 7 cm on the date of sampling (30 July 2013), and surficial porewaters had a pH of 7.0.
The peat cores were radiocarbon dated by extracting remains of Sphagnum mosses and herbaceous (cf. Cyperaceae) plants where possible; in some cases, wood pieces were dated. A blade was used to remove the outer layer from the wood samples. Samples were washed with reverse-osmosis water through a 300-µm sieve then dried at 60°C for 48 h. For Sphagnum and herbaceous plant samples, material for dating was examined using a stereomicroscope and hand-picked to fill a micro-centrifuge tube. To reach sufficient quantity, thicknesses of samples used for dating averaged 2.5 cm and ranged from 1 to 5 cm (Table 1). Samples for dating were assigned to the categories “Sphagnum,” “Herbaceous” or “Wood” using descriptions and photographs available in Lévesque et al. (1988). Some samples were dated at the A.E. Lalonde AMS Laboratory in Ottawa, Canada (UOC-series), and others at the Illinois State Geological Survey (A-series) radiocarbon facility (Table 1). Bayesian age-depth models were developed using the rbacon (Bacon) package (v2.3.9.1) for R (v3.6.1) (Blaauw and Christen, 2011). For both cores, the prior for accumulation rate (acc.mean) was changed from the default of 10 year/cm to 50 year/cm following output of initial “ballpark” estimates. Radiocarbon dates were calibrated using the IntCal13 Northern hemisphere calibration curve (Reimer et al., 2013). The mean reported age for each interval was used for plotting.
Radiocarbon dates used for age-depth modelling of the bog (13-02-02) and fen core (13-04-01).
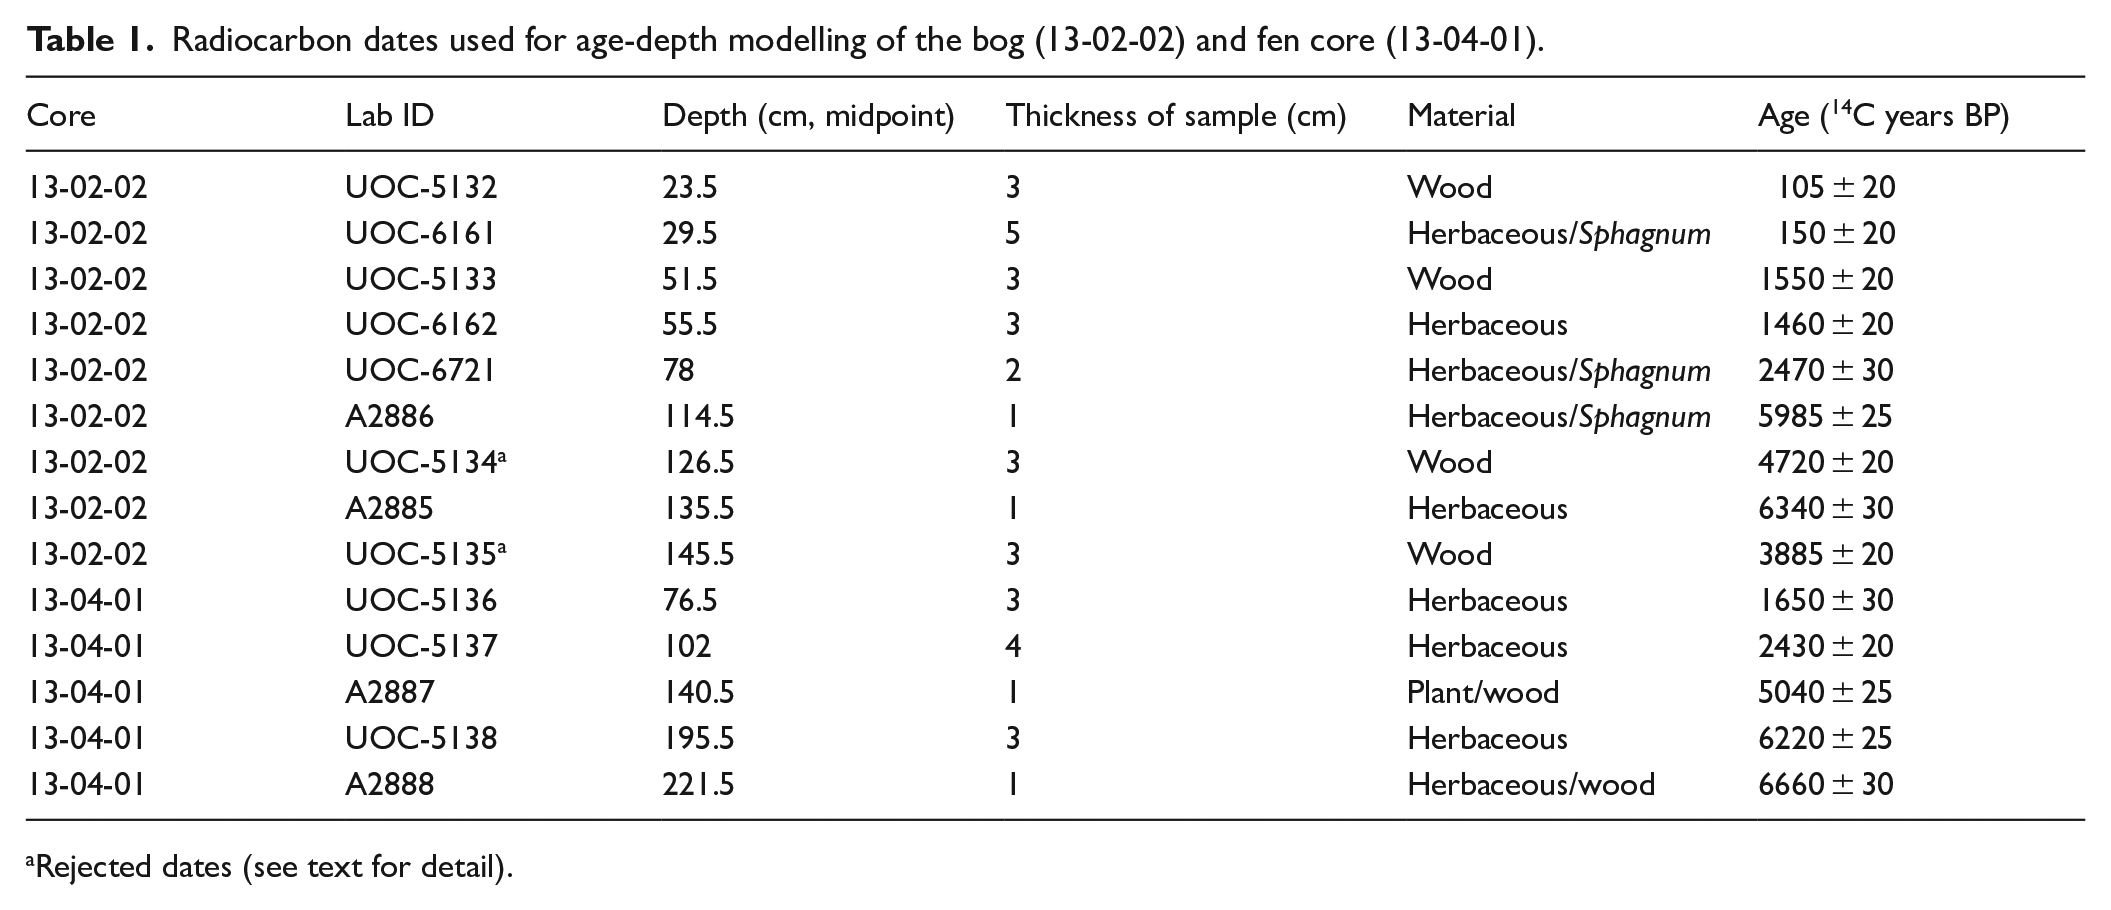
Rejected dates (see text for detail).
Testate amoeba processing and depth to water table transfer function
The bog and fen cores were sub-sampled for testate amoebae at 2- or 3-cm intervals, except for the top 50 cm of the fen core where insufficient sample quantity resulted in only five samples processed for this section. Tests were extracted according to the methods of Booth et al. (2010). Testate amoebae were identified and enumerated using light microscopy at 400× magnification; 100 or more tests were counted per sample. Testate amoebae were identified following the keys, taxon descriptions and taxonomic nomenclature of Booth et al. (2010), Charman et al. (2000), Lamarre et al. (2013) and Amesbury et al. (2018). The full list of taxa recorded is provided in Table S1. Test concentration was determined by adding a known number of Lycopodium spores as exotic markers to sub-samples of known volume. Statistically significant biostratigraphic zones were established from the testate amoeba assemblages using stratigraphically constrained cluster analysis (CONISS; Grimm, 1987) and a broken stick model (Bennett, 1996) implemented in the rioja package for R (Juggins, 2015). The first two principal components were also plotted for each depth interval to summarize the variability in testate amoeba assemblages; the Principal Components Analysis (PCA) was conducted using C2 (Juggins, 2003).
The modern training set of Amesbury et al. (2018) was used for DWT reconstructions by transfer function. This dataset for North American peatlands consists of 1696 samples from 126 peatlands. The transfer function was developed using a weighted-average model with tolerance down-weighting and inverse deshrinking (WA-Tol (inv)). The reconstruction was implemented in the rioja package for R (Juggins, 2015) using the code provided by Amesbury et al. (2018). Model statistics are provided in Table 4 of the original publication (Amesbury et al., 2018). All taxa in the fossil sequences were found in the modern dataset and could be readily assigned to a matching taxon in the modern dataset. In a few cases, taxa were amalgamated, following Amesbury et al. (2018). These amalgamations are (i) Hyalosphenia ovalis and Nebela collaris type combined into Nebela collaris type; (ii) Arcella arenaria type and Arcella catinus type combined into Arcella catinus type; (iii) Trigonopyxis minuta and Trigonopyxis arcula type combined into Trigonopyxis arcula type; (iv) Nebela bohemica, Nebela parvula and Nebela tincta type combined into Nebela tincta type. Given the potential uncertainties of absolute values for reconstructed DWTs (Swindles et al., 2015), they are shown as z-scores in the main text, calculated using the R.basic package for R. Reconstructed DWTs showing absolute values are provided in Figure S3.
Testate amoeba morpho-traits
Classification of taxa as mixotrophs and values for the morpho-traits of aperture size and position, and biovolume, for all fossil taxa were taken from Fournier et al. (2015). Mixotrophy is reported as a ratio of the number of mixotrophic tests to heterotrophic tests at a given depth. Aperture size and biovolume are presented in µm and µm3 respectively; aperture position is classified on a 1–4 scale where 1 represents a terminal aperture and four represents a completely cryptic aperture (Fournier et al., 2015). Community weighted means (CWMs) were calculated for each morpho-trait for each depth using this equation (Fournier et al., 2015):
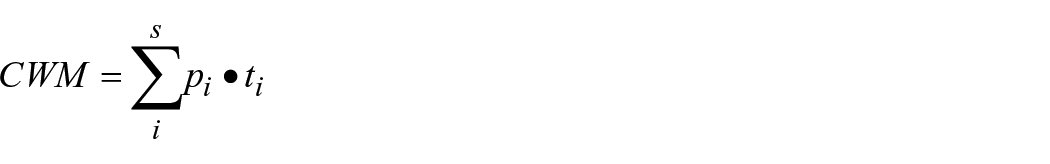
where s is the total number of taxa at each sampling interval, p is the relative abundance of the taxon at that depth, t is the taxon-specific trait value and i is the index of summation representing the initial value (Fournier et al., 2015).
Peat properties and carbon accumulation rates
Bulk density and loss-on-ignition (LOI) were measured using methods presented in Bunbury et al. (2012) and O’Reilly et al. (2014) and followed the standard approach of Chambers et al. (2011). These data along with an organic matter to carbon conversion factor of 51% for the core 13-04-01 (present day fen) and 49% for the core 13-02-02 (present day bog, but underwent a fen to bog transition), and rates of peat vertical accretion obtained from the age-depth models were used to calculate carbon accumulation rates.
Results
Peat stratigraphies, chronologies and carbon accumulation rates
Fen core (13-04-01)
Radiocarbon dates summarized in Table 1 were used to generate age depth models for each core (Supplemental Figures S1 and S2). The lowermost 29 cm of the fen core (13-04-01) consisted of a light gray silty clay with low organic matter, and were not included in the age-depth model. Peat initiation is recorded at a depth of 221 cm in the fen core, dated by a basal radiocarbon age to 7500 cal yr BP. Five radiocarbon dates plus the modern surface were used to generate an age-depth model; the rate of peat accretion varied through the record, with more rapid rates between initiation and ~5800 cal yr BP, and over the most recent 1500 years (Figure 2). Bulk density and organic matter as assessed by LOI varied little through the peat portion of the record (means of 0.11 g cm−3 and 90% of dry mass) (Figure 2). The uppermost sample recorded lower bulk density (Figure 2), suggesting an acrotelm-catotelm transition within the upper 6 cm of the profile, consistent with the measurement of the depth to water table on the day of sampling (7 cm).
Bulk density, organic matter (OM) content, ash content, peat vertical accretion, carbon accumulation rate and depth to water table (DWT) z-scores as reconstructed by testate amoeba transfer function (Amesbury et al., 2018) for the fen core (13-04-01). More negative values indicate lower DWTs (i.e. higher water tables and wetter conditions) and more positive values indicate greater DWTs (i.e. lower water tables and drier conditions). Zone numbers refer to statistically significant biostratigraphic zones (see text for details).
The trends in carbon accumulation rates for the fen core very closely mirror the trends in rate of peat vertical accretion (Figure 2). The highest rates of carbon accumulation are recorded immediately following peat initiation to about 5800 cal yr BP; rates generally exceeded 20 g C m−2 yr−1 through that section with the lowermost samples peaking at 47 g C m−2 yr−1. CAR dropped through the middle portion of the record, with minimum values between 3 and 5 g C m−2 year−1 between 5400 and 3300 cal yr BP. CAR then increased again, more rapidly over the last 1600 years, with values generally exceeding 25 g C m−2 yr−1. These increases took place well before the acrotelm-catotelm transition, dated to within the last century.
Bog core (13-02-02)
The lowermost 15 cm of the bog core (13-02-02) consisted of light grey silty clay with low organic matter; this section was not included in the age depth model. The initiation of peat accumulation is recorded at a depth of 154 cm. The lowermost date available was at a depth of 135 cm (7300 cal yr BP), so extrapolated ages between 135 and 154 cm are treated with caution (Supplemental Figure S2). The extrapolated basal age is ~8200 cal yr BP, which is broadly consistent with regional timing for uplift from the marine inundation driven by glacial isostasy (Andrews and Peltier, 1989); thus, despite the uncertainty in the age of the peat older than the lowermost radiocarbon date of 7300 cal yr BP, the results indicate that the peat core covers the post-glacial Holocene peat accumulation for this site. The bog core was shorter than the fen core, but likely has a somewhat older initiation age (Table 1; Supplemental Figures S1 and S2), indicating both a more rapid accrual of more peat over less time, and a lag in the initiation of peat accumulation at the fen site. Seven radiocarbon ages and the modern surface were used to generate an age depth model for the bog core; the model displays similar trends in Holocene rates of peat accretion as seen in the fen core, with slower rates in the middle portion of the record (Figure 3). Two radiocarbon dates were rejected as too young based on reversals in the profile and known ages for emergence.
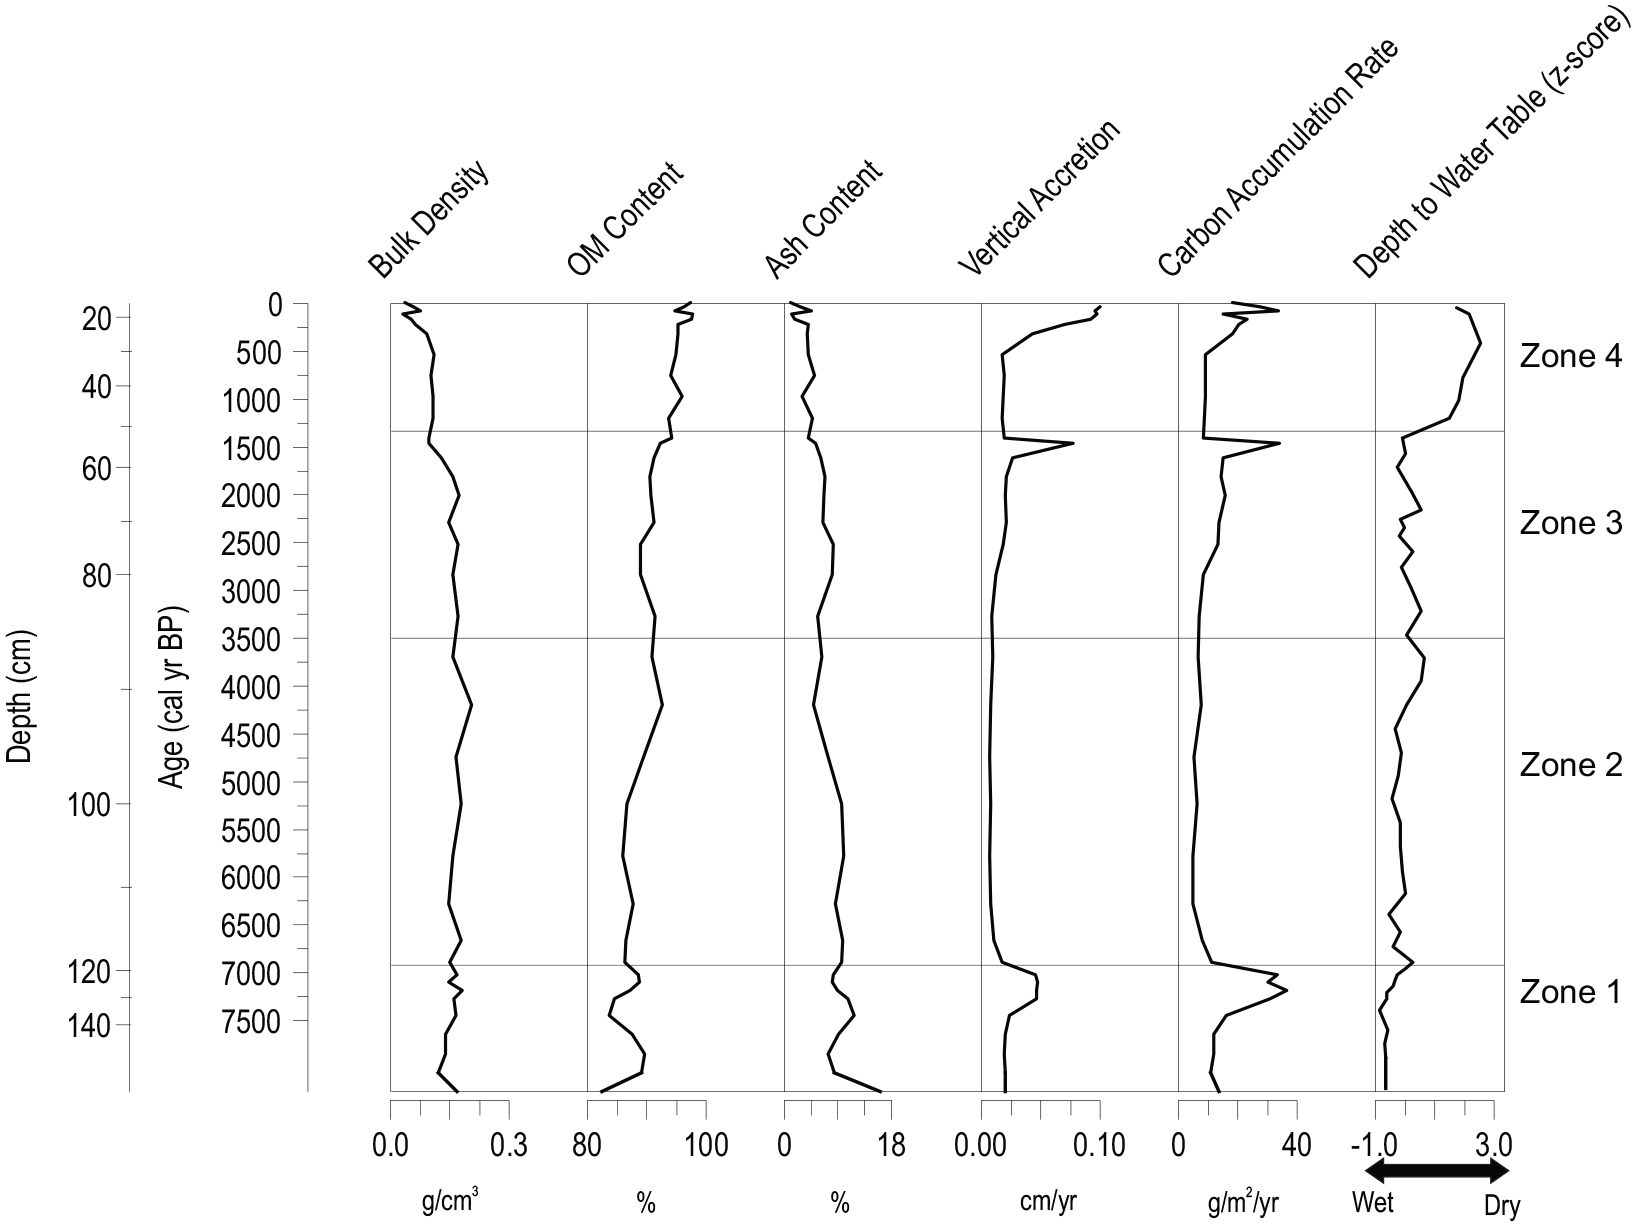
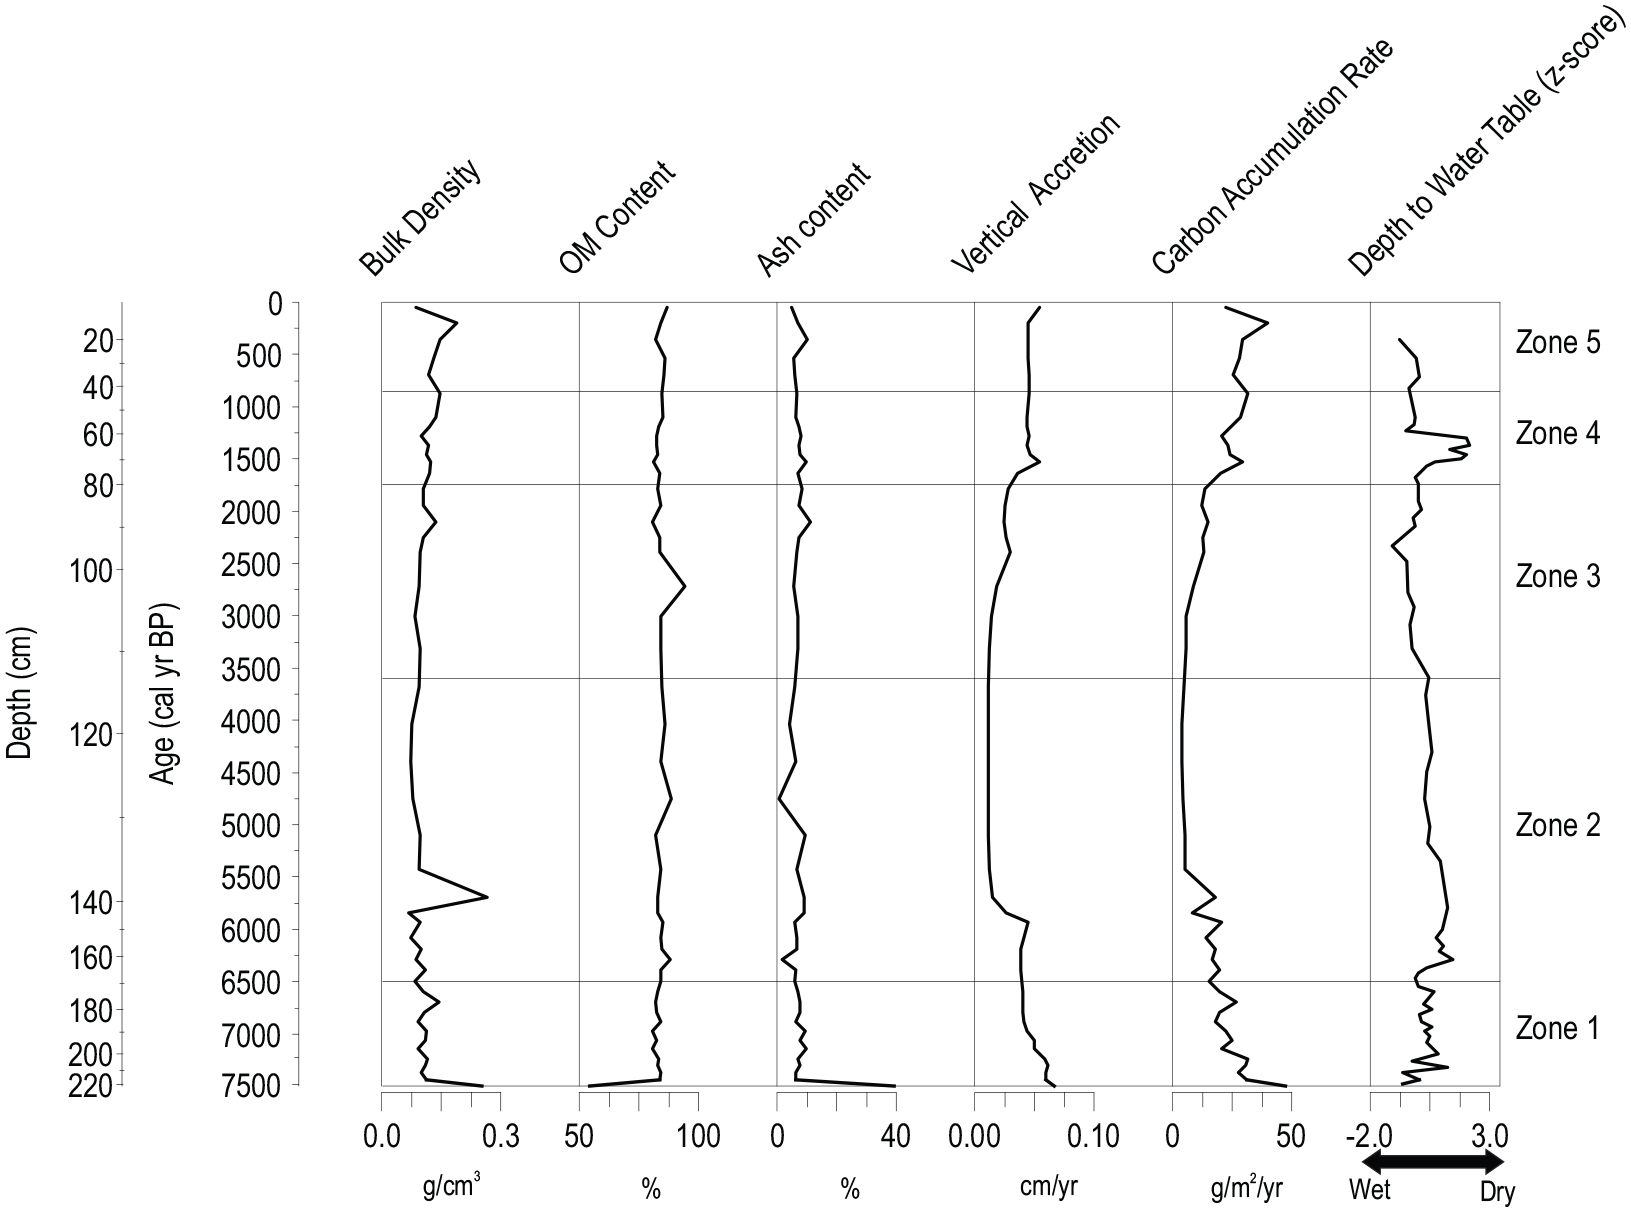
Bulk density, organic matter (OM) content, ash content, peat vertical accretion, carbon accumulation rate and depth to water table (DWT) z-scores as reconstructed by testate amoeba transfer function (Amesbury et al., 2018) for the bog core (13-02-02). More negative values indicate lower DWTs (i.e. higher water tables and wetter conditions) and more positive values indicate greater DWTs (i.e. lower water tables and drier conditions). Zone numbers refer to statistically significant biostratigraphic zones (see text for details).
The acrotelm-catotelm boundary was placed at a depth of ~ 25 cm (~180 cal yr BP) on the bases of the transition from low-density live or minimally decomposed Sphagnum moss to more compact, humified peat, lower bulk densities in the upper-most samples, and the position of the water table at 25 cm below surface on the day of sampling. Visual inspection indicated that the profile below this inferred acrotelm-catotelm transition consisted of a mix of Sphagnum and peat derived from herbaceous plants, with first appearance of Sphagnum macro-remains around ~6900 cal yr BP. Mean bulk density in the bog core (0.13 g cm−3) was similar to the fen core, and declined upwards to the core surface (Figure 3). Organic matter as estimated by LOI was also similar to that of the fen core, but increased to a greater degree up-core (mean = 90%; Figure 3).
CAR also closely follows the variability in rate of peat vertical accretion in the bog record (Figure 3). Higher values are also recorded in the oldest samples, with a notable peak between 7000 and 7300 cal yr BP when CAR varies between 30 and 36 g C m−2 year−1. CAR generally remains below 15 g C m−2 yr−1 through the middle portion of the record, then begins a slow rise after 3000 cal yr BP. CAR rises more significantly above 20 g C m−2 year−1 in the uppermost samples above 25 cm (~180 cal yr BP), coinciding with the acrotelm-catotelm transition. A single high value of CAR (34 g C m−2 yr−1) is shown at 1450 cal yr BP however this single-point peak likely reflects artefacts of the age depth model as it is found where two radiocarbon ages separated by 4 cm show a reversal or a near overlap in calibrated ages (Table 1). Mean CAR in the fen core (19.4 g C m−2 yr−1) exceeded that of the bog core (15.7 g C m−2 yr−1).
Testate amoeba assemblages, functional traits and reconstructed DWT
Fen core (13-04-01)
The total number of taxa identified in the fen core (49 taxa) was higher than the bog core (40 taxa) (Table S1). Test concentrations were low initially, and increase up-core, with marked increases within the last 1500 years. Five statistically significant biostratigraphic zones were identified (Figure 4).
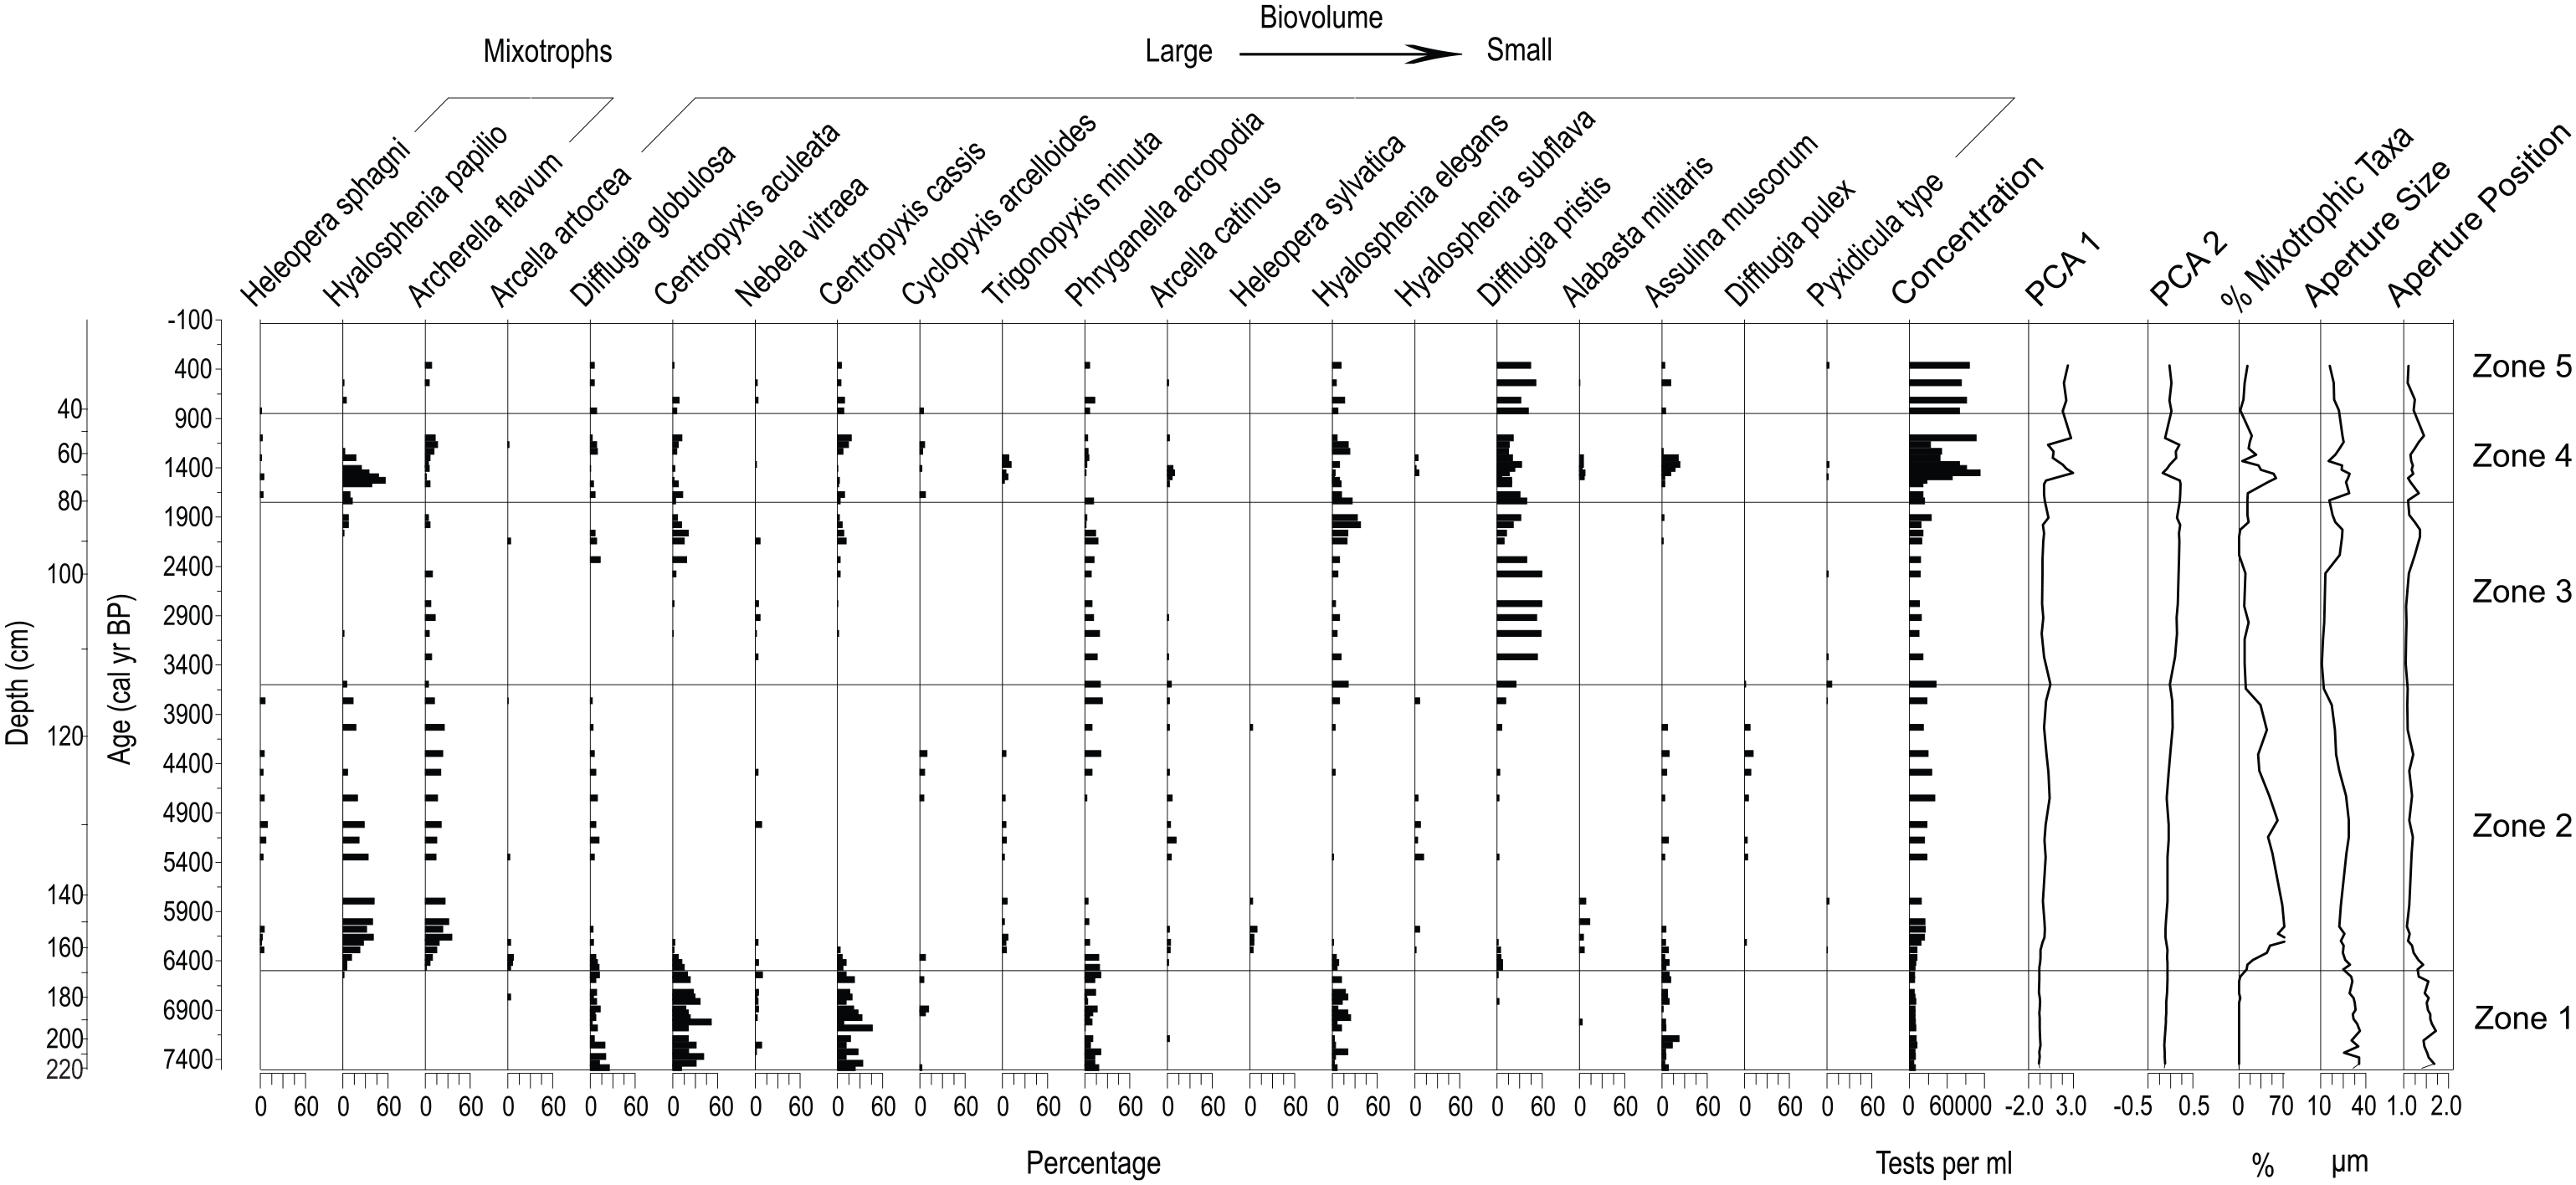
Testate amoebae assemblages for the fen core (13-04-01) are shown through time and depth. Community weighted mean (CWM) values for testate amoebae aperture size and aperture position, the percentage of individuals from mixotrophic taxa and the biovolume of the taxa present are shown. Mixotrophic taxa are sorted largest to smallest based on test biovolume. Trait values follow Fournier et al. (2015). Statistically significant biostratigraphic zones were established from the testate amoeba assemblages.
ZONE 1: 7500–6500 cal yr BP
Testate amoebae were recorded at low concentration. Wet indicator taxa such as Difflugia globulosa and Phryganella acropodia were common following peatland initiation, and the presence of these taxa result in relatively wetter reconstructed DWT conditions (high water table; Figure 2). Mixotrophic taxa are absent, aperture size and position index are high, and the taxa present mainly have high biovolumes (Figure 4). Centropyxis aculeata, a minerotrophic taxon (Kurina et al., 2020), is abundant in this zone.
ZONE 2: 6500–3600 cal yr BP
ZONE 2 marks the increase of mixotrophic Hyalosphenia papilio and Archerella flavum; these taxa are prominent in this zone with abundances of up to 40% and 30% respectively (Figure 4). Percentages of individuals of mixotrophic taxa peak in this zone, with a mean of 43% of individual tests. The mean aperture size and position index decrease relative to ZONE 1, and taxa in ZONE 2 tend to have smaller biovolumes due to the decrease in larger minerotrophic taxa and a shift to taxa present in both ombrotrophic and minerotrophic conditions such as Assulina muscorum and Hyalosphenia papilio. Reconstructed DWT z-scores indicate drier conditions in ZONE 2 in comparison with ZONE 1 (Figure 2).
ZONE 3: 3600–1750 cal yr BP
ZONE 3 is marked by the abrupt decline and near disappearance of mixotrophs Heleopera sphagni and Hyalosphenia papilio (Figure 4). Difflugia pristis, a taxon with a wide DWT tolerance (Lamarre et al., 2013), increases markedly, and dominates Zone 3 with abundances >60%. An increase in mean aperture size and position value are recorded in the upper part of the zone, related to the increase in large-biovolume taxa such as Centropyxis aculeata. Reconstructed DWT z-scores in ZONE 3 decreased (wetter) relative to ZONE 2 until ~2250 cal yr BP and then increased (drier) to the upper bound of ZONE 3.
ZONE 4: 1750–850 cal yr BP
ZONE 4 is characterized by the re-emergence of mixotrophic Hyalosphenia papilio as a dominant taxon with abundances up to 60% (Figure 4). Difflugia pristis, due to the wide hydrological tolerance of the taxon (Kurina et al., 2020), continues to be abundant, but declines relative to ZONE 3. Testate amoebae concentrations increase markedly in ZONE 4, and the shifts in PCA1 and 2 scores indicate the most significant taxonomic changes in the profile. The mean percentage of tests from mixotrophic taxa was higher than in ZONE 3 at 29.5%. Aperture size, biovolume and aperture position index also increase relative to the previous zone, peaking between 1300 and 1700 cal yr BP (Figure 4). An increase in DWT z-scores between 1250 and 1600 cal yr BP marks the driest conditions in the paleohydrological record for the fen.
ZONE 5: 850 cal yr BP to present
ZONE 5 records the continued dominance of Difflugia pristis which was close to 60% of the assemblage; mixotrophy, aperture size, biovolume and aperture position index decline in this zone (Figure 4). Reconstructed DWT z-scores values imply relatively wet conditions for ZONE 5, similar to ZONE 3.
Bog core (13-02-02)
Testate amoebae were present throughout the core although at low concentration in the lowermost zone (Figure 5). Four statistically significant biostratigraphic zones were identified in the bog core and are discussed below.
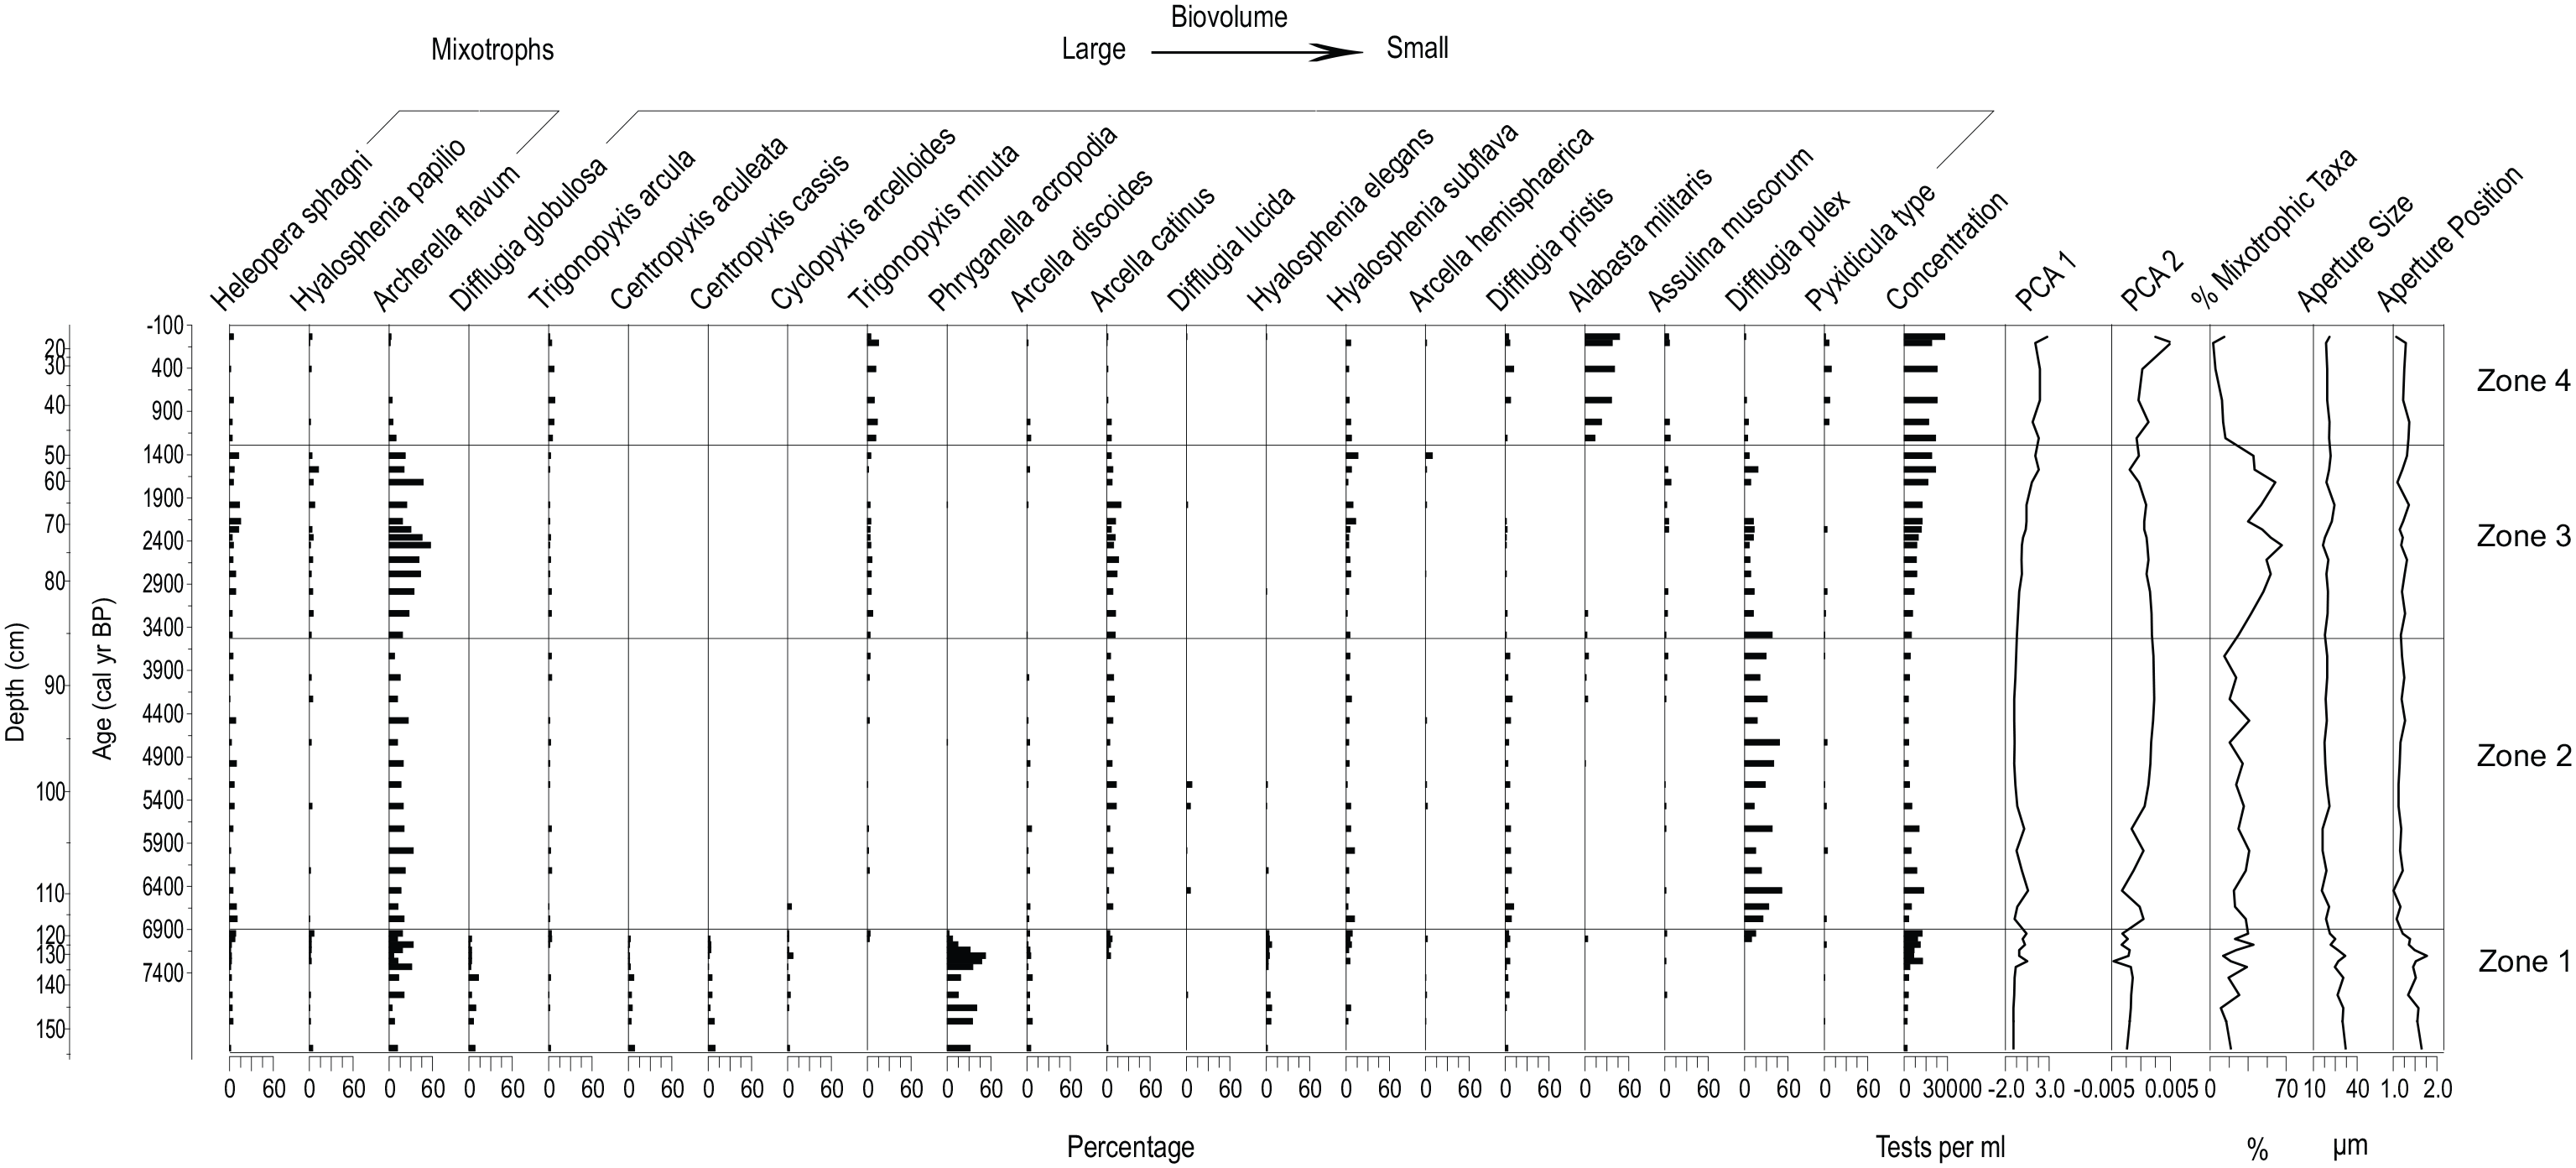
Testate amoebae assemblages for the bog core (13-02-02) are shown through time and depth. Community weighted mean (CWM) values for testate amoebae aperture size and aperture position, the percentage of individual mixotrophic taxa and the biovolume of the taxa present are shown. Mixotrophic taxa are sorted largest to smallest based on test biovolume. Trait values follow Fournier et al. (2015). Statistically significant biostratigraphic zones were established from the testate amoeba assemblages.
ZONE 1: 8240–6900 cal yr BP
ZONE 1 is characterized by the emergence and dominance of taxa such as Phryganella acropodia that thrive in wetter conditions following peatland initiation. The abundance of tests from mixotrophic taxa is variable and increases from the bottom of the zone to the top (Figure 5). Aperture size and test biovolume are the largest during this zone for the entire bog core. Aperture position is the most central in comparison with other zones in the bog core. DWT z-scores are low in ZONE 1 indicating relatively wet conditions (Figure 3). The top of ZONE 1 coincides with the fen-to-bog transition as inferred from the decline in minerotrophic taxa such as Centropyxis aculeata and Cyclopyxis arcelloides and wet indicator taxa such as Phryganella acropodia (Figure 5).
ZONE 2: 6900–3500 cal yr BP
The fen-to-bog transition is highlighted by the shift to dominance by Difflugia pulex, a taxon that thrives in ombrotrophic conditions (Charman et al., 2000; Lamarre et al., 2013), and is absent from the fen core record. Mixotrophic Archerella flavum, another taxon often present in ombrotrophic conditions (Kurina et al., 2020), is also relatively abundant. The mean value for mixotrophy percentage in ZONE 2 was slightly higher than ZONE 1 (Figure 5). Mean aperture size and biovolume declined relative to ZONE 1, as conditions became drier as inferred from the DWT z-scores (Figure 3). Aperture position index values declined in this zone, indicating a shift to more terminal apertures.
ZONE 3: 3500–1300 cal yr BP
ZONE 3 records an upward shift in PCA1 sample scores, a decline in Difflugia pulex, and an increase in Archerella flavum, which drives an increase in mixotrophy (Figure 5) indicating potential declines in nutrient availability (Koenig et al., 2018). Aperture size and aperture position, as well as biovolume, remained similar to ZONE 2. DWT slightly increased from the bottom of the zone to the top (Figure 3), indicating that the drying trend recorded in ZONE 2 continued.
ZONE 4: 1300 cal yr BP to present
Alabasta militaris, a species commonly found in ombrotrophic bogs and with Sphagnum mosses (Charman et al., 2000), is the dominant taxon in this zone (Figure 5). The abundance of the mixotroph Archerella flavum abruptly declines from ZONE 3. This zone is characterized by predominantly dry indicators such as Trigonopyxis arcula, T. minuta and Hyalosphenia subflava (Lamarre et al., 2013) that are commonly found in living Sphagnum vegetation. ZONE 4 had the highest testate amoebae concentration of any zone in the bog record (Figure 5). Aperture size and position were consistent with ZONE 3, but biovolume was larger than ZONES 2 and 3 (Figure 5) likely due to increases in Trigonopyxis arcula and T. minuta. An increase in reconstructed DWT occurred following the onset of ZONE 4, around 1000 cal yr BP (Figure 3).
Discussion
Paleohydrology and succession in bog and fen records
The presence of more wet-indicating testate amoeba taxa through the fen record confirms that it was characterized by higher water tables than the bog site through the Holocene. The higher water tables through the fen record are also supported by the higher absolute values for reconstructed DWTs (Supplemental Figure S3). However, following peatland initiation at both sites, wet indicators are abundant in ZONE 1 of both records, and reconstructed DWT z-scores indicate relatively highest water table positions (Figures 2 and 3). These inferred high water tables at both sites following peatland initiation reflect conditions following isostatically induced emergence from a marine incursion (Riley, 2011). Elevation above sea level was very low, and given the low relief and impermeable underlying substrates, poor drainage resulted in widespread peatland initiation. Peat initiation at the bog site likely took place very soon after emergence given the inferred basal peat age of ~8200 cal yr BP, which corresponds closely to the timing of regional uplift (Andrews and Peltier, 1989). The initial peatland at the bog site was a fen, as suggested by minerotrophic testate amoeba taxa. Despite the close proximity of the two sites (<4 km apart), the initiation of peat accumulation took place considerably later at the fen site (~7500 cal yr BP). Non-peaty wetland sediments present in the fen sequence below 7500 cal yr BP capture initial wetlands such as marshes that were not peat accumulating, perhaps due to the presence of flow channels (Riley, 2011). This discrepancy highlights the role of highly localized topography and hydrology in explaining styles of wetland initiation in this region (Glaser et al., 2004).
Reconstructed paleohydrology at the fen and bog sites diverge following ZONE 1. At the bog site, reconstructed DWT values began to increase, and shifts in testate amoeba assemblages from minerotrophic taxa such as Centropyxis aculeata and Centropyxis cassis (Kurina et al., 2020) to taxa closely associated with Sphagnum peat such as Difflugia pulex (Charman et al., 2000) suggest a fen-to-bog transition around 6900 cal yr BP. While this transition could reflect classic hydrosere successional processes whereby accumulation of organic matter eventually leads to a separation of the vegetation from the water table (Hargan et al., 2015; Klinger, 1996), because of relatively short interval between peat initiation and the fen to bog transition, it more likely relates to hydrological change associated with rapid isostatic uplift (Glaser et al., 2004). Following the fen-to-bog transition, reconstructed DWT continued to slowly increase through the Holocene at the bog site, with a marked further increase taking place around 1300 cal yr BP (Figure 5). This shift in the reconstruction is largely driven by increases in Alabasta militaris, Trigonopyxis arcula and T. minuta, which have all been shown to prefer drier conditions and Sphagnum moss (Charman et al., 2000; Lamarre et al., 2013). The timing approximately coincides with the onset of the Medieval Climate Anomaly (MCA) (Mann et al., 2009); warmer temperatures during the MCA have been linked to changes in hydrology and carbon accumulation in other northern peatlands (Charman et al., 2013; Garneau et al., 2014; Magnan and Garneau, 2014).
At the fen site, the relatively stable DWT z-scores through much of ZONE 2 and ZONE 3 indicate persistently high water tables. This trend is interrupted by an increase in DWT, indicating drying conditions, inferred to have taken place between 1500 and 1250 cal yr BP, driven by increases in Assulina muscorum and Hyalosphenia papilio. H. papilio is a mixotrophic taxon often found in Sphagnum moss (Charman et al., 2000) and Assulina muscorum is able to thrive in both ombrotrophic and minerotrophic conditions (Kurina et al., 2020). Taken together, these changes indicate a shift to more bog-like Sphagnum dominated conditions and a potential decline in nutrient availability (Koenig et al., 2017, 2018). This increase in DWT predates, but overlaps with the large increase in DWT seen in the bog record around the start of the MCA (Mann et al., 2009). The comparison of two nearby records showing offsets in timing of water table changes suggests a more limited role for regional climatic forcing, and again highlights the importance of considering localized microtopographic or hydrological factors.
While the DWT reconstructions derived from the transfer function provide error-bounded estimates of the paleohydrology of the bog and fen sites, we acknowledge the limitations of the approach (Juggins, 2013). To mitigate some of these limitations, a training set containing data from a range of locations across North America, including the HBL (Amesbury et al., 2018), was used. The impact of confounding variables can also influence the reliability of transfer function based reconstructions (Juggins, 2013). Previous studies have shown DWT to be a controlling factor on testate amoebae assemblages (Booth, 2001; Charman et al., 2007; Fournier et al., 2015; Lamarre et al., 2013; Zhang et al., 2017), but data from the HBL also suggest that pH is an important factor in explaining species distributions (Lamarre et al., 2013). For these reasons, DWTs are plotted and mainly interpreted as z-scores, as opposed to absolute values (Swindles et al., 2015).
Bog and fen carbon accumulation
CAR was high following peatland initiation at both sites and this has also been recorded at other HBL peatlands (Bunbury et al., 2012; Garneau et al., 2014; Loisel et al., 2014; O’Reilly et al., 2014). These high rates may be explained by warmer temperatures associated with the Holocene Thermal Maximum, wetter conditions following peatland initiation, and the prevalence of fens in the centuries and, in some cases, millennia following initiation (Packalen et al., 2014). CARs were lowest for both the bog and fen sites during the Mid- to late Holocene (Figures 2 and 3). This coincides with increasingly drier conditions in the bog record as seen in ZONES 2–4, and periods of somewhat drier conditions in the fen record in ZONES 2 and 4. A subsequent increase in CAR during the late Holocene is also noted in other regional studies (Bunbury et al., 2012; Garneau et al., 2014; Loisel et al., 2014; O’Reilly et al., 2014). Available Holocene paleoclimate records derived from lacustrine pollen records in the HBL indicate wetter and cooler conditions after 3000 cal yr BP (Hargan et al., 2020; McAndrews et al., 1982). These conditions may have enhanced carbon accumulation by reducing rates of peat decomposition. The fen record had a higher mean CAR in comparison to the bog record; this result was also found in another comparative analysis of fen and bog records from the VC04 site (location shown in Figure 1) within the Attawapiskat watershed in the HBL (Bunbury et al., 2012; O’Reilly et al., 2014). In the current study, peat bulk densities and organic matter content varied little between the fen and bog sites, but peat initiation took place later at the fen site, and the ensuing rates of vertical peat accretion were higher. Given the low variability in bulk density and organic matter, the records presented here emphasize the importance of the peat accretion term in the calculation of CAR, and the importance of robust age models for capturing the trends and drivers of Holocene CAR.
Linking morpho-traits and function in testate amoeba records
Reconstructed DWTs and presentation of changing abundances of testate amoeba morpho-traits allow for some exploration of possible relationships between paleoenvironmental conditions and ecological processes in microbial food webs. The values for morpho-traits were derived from means for each taxon provided by Fournier et al. (2015). Because of intraspecific morphological variability in testate amoeba tests which was not captured here, we focus our interpretation on trends and qualitative differences between taxa in terms of these key traits. In the records presented here, taxa with larger and more central apertures, such as Phryganella acropodia, in conjunction with taxa with larger biovolumes, such as Difflugia globulosa, are more abundant in wetter conditions, such as following peatland initiation. These traits would permit the ingestion of larger prey, and this has been suggested elsewhere as evidence that these taxa occupy a higher trophic position in the microbial food web than taxa with smaller body size and apertures (Koenig et al., 2017, 2018). Further, the occurrence of these taxa is coupled with lower abundances of mixotrophic taxa during wetter periods such as following peatland initiation and in ZONES 3 and 5 in the fen core. Reduced abundance of mixotrophs during wetter conditions could be due to shifts in light availability as a result of encroaching vegetation and changes in the openness of the local habitat (Lamentowicz et al., 2020; Payne et al., 2016). Additionally, as both prey abundance and size as well as nutrient availability are both likely higher during wetter conditions, heterotrophy appears to become a more advantageous foraging strategy (Koenig et al., 2018). Larger biovolume is one possible, and seemingly common, adaptation to wetter environments although not the only strategy as some smaller Archerela and Amphitrema spp. are found in wetter conditions (e.g. Booth, 2001).
In comparison to the wetter conditions, analysis of the frequency of testate amoeba morpho-traits through drier conditions, such as ZONE 2 for the fen record and ZONES 2–4 for the bog record, shows increases in taxa with reduced aperture sizes, and a shift to taxa with more terminal apertures and lower biovolumes (Figures 4 and 5). This finding suggests that in drier conditions testate amoebae may occupy a lower trophic position in the microbial food web (Koenig et al., 2017), as the corresponding morpho-traits signal a decline in the prey size that these taxa are able to consume (Koenig et al., 2017, 2018). The shifts seen in both cores in the transitions from ZONE 1 to ZONE 2 indicate such a transition, with an increase in taxa more indicative of lower trophic positions or increased bacterivory (Jassey et al., 2013; Koenig et al., 2018). This change in testate amoeba community composition is accompanied by increases in mixotrophy. As drier conditions often lead to a more oligotrophic environment (Riley, 2011), mixotrophy becomes a more advantageous foraging strategy over heterotrophy as prey abundance and size tends to decrease (Creevy et al., 2017; Koenig et al., 2017, 2018; Payne et al., 2016). Additionally, mixotrophic taxa may be more abundant in drier conditions as lowered water tables may also be associated with a shift to a more open environment with increased light availability for photosynthesis (Lamentowicz et al., 2020; Payne et al., 2016). These factors may explain why higher ratios of mixotrophy were recorded in the bog record in comparison to the fen record, and why mixotrophy co-varies closely with reconstructed DWT. The modern datasets show close control by DWT on testate amoeba distributions (Amesbury et al., 2018), and some of those taxa with optima and tolerance for low WTD (drier conditions) are mixotrophs. Thus, mixotrophy is likely one of multiple adaptations allowing some taxa to colonize drier habitats.
Conclusion
The use of testate amoebae as a paleoecological proxy in conjunction with rates of carbon accumulation provide a means of evaluating relationships between ecological communities and a key ecosystem function over the Holocene. Bogs and fens dominate the HBL today in approximate equal proportions (Riley, 2011). The comparison of the Holocene histories of a bog and a fen site show distinct ecological trajectories with implications for understanding drivers of carbon accumulation. Testate amoeba assemblages confirm that the fen site remained wetter than the bog site through the Holocene, which may have contributed to an overall more rapid rate of carbon accumulation. When conditions were wetter at both sites, taxa occupying higher trophic positions, as inferred by morpho-traits linked to foraging strategy, were dominant. Drier conditions tended to be associated with testate amoebae with traits such as smaller apertures, suggesting lower trophic position. Mixotrophic taxa were also more abundant when conditions were drier and potentially more oligotrophic, as mixotrophy becomes a more advantageous foraging strategy. As a result, mixotrophic taxa are seen in higher abundances in the bog in comparison with the fen. The changing frequencies of morpho-traits provide insights into the ecological processes resulting from paleohydrological and successional change. Further, the comparisons of paleohydrological reconstructions with frequencies of morpho-traits contributes to ongoing work seeking to test hypotheses on the functional roles of morpho-traits and how they might be adaptive under different ecological conditions.
Supplemental Material
sj-pdf-1-hol-10.1177_0959683620972792 – Supplemental material for Linking testate amoeba assemblages to paleohydrology and ecosystem function in Holocene peat records from the Hudson Bay Lowlands, Ontario, Canada
Supplemental material, sj-pdf-1-hol-10.1177_0959683620972792 for Linking testate amoeba assemblages to paleohydrology and ecosystem function in Holocene peat records from the Hudson Bay Lowlands, Ontario, Canada by David Bysouth and Sarah A Finkelstein in The Holocene
Footnotes
Acknowledgements
The authors thank Peter Barnett for mentorship on field work and assisting with site selection, April Dalton and Maurice Nguyen for assisting with core collection, Julia Palozzi for contributing to laboratory analyses, Marissa Davies for advice on testate amoeba taxonomy, as well as Matt Amesbury, Graeme Swindles and an anonymous reviewer for helpful comments.
Data availability
All testate amoeba data and radiocarbon dates have been archived in the Neotoma Paleoecology Database.
Funding
The author(s) disclosed receipt of the following financial support for the research, authorship, and/or publication of this article: This research was funded by grants to SAF from the Natural Sciences and Engineering Research Council of Canada (NSERC), Ontario Ministry of Natural Resources and Forestry (MNRF), Ontario Ministry of Northern Development and Mines (MNDM), and a Queen Elizabeth II Graduate Scholarship in Science and Technology to DS.
Supplemental material
Supplemental material for this article is available online.
References
Supplementary Material
Please find the following supplemental material available below.
For Open Access articles published under a Creative Commons License, all supplemental material carries the same license as the article it is associated with.
For non-Open Access articles published, all supplemental material carries a non-exclusive license, and permission requests for re-use of supplemental material or any part of supplemental material shall be sent directly to the copyright owner as specified in the copyright notice associated with the article.