
Abstract
This study illustrates the influences of sea-level on the depositional process during the last 1000 years of the southwestern delta, Bangladesh. Sediments of eight litho-sections from landward in upper delta plain to seaward in lower delta plain along the Rupsa-Pasur river were studied. Sedimentary facies, total organic carbon, total nitrogen, δ13C value, diatom assemblages, and radiocarbon dating of deposits were carried out to determine the paleoenvironments that were influenced by the relative sea-level (RSL) change over time. During the 850–1300 AD, RSL was reached up to +80 cm higher than the present level where tidal-influenced bioturbated light yellow to gray mud deposited in the upper delta plain area. RSL was dropped up to −110 cm during 1300–1850 AD, organic-rich bluish-gray mud, mangrove peat, and terrestrial influenced yellowish-gray mud were deposited successively in the lower delta plain area, and the terrace was formed at landward due to the lowering of the base level. RSL started to rise after the period 1850 AD where tidal-influenced sediments gradually increased and deposited in the upper part at seaward and terrestrial flood sediment deposited over the erosional surface at the landward part. The estimated average sedimentation rate (1.96–2.89 mm/year) is not enough to offset the effect of subsidence and present sea-level rise over the study area. The rising trend of the sea creates inundation in the lower delta plain area, also hinders upstream water flow. For that, terrestrial flood sediments settle over the erosional surface in landward, and tidal-influenced sediment gradually onlap upon it from seaward.
Introduction
The Ganges-Brahmaputra-Meghna (GBM) rivers coalescing in the Bengal Basin and form the world’s largest delta system with numerous sub deltas. The delta is situated mainly in Bangladesh and partially in West Bengal of India, covering approximately 1 × 10⁵ km2 of low elevated deltaic flood plain areas that have around 380 km long delta front (Figure 1a; Allison, 1998; Mukherjee et al., 2009; Umitsu, 1993). The delta surface is susceptible to both the long-term natural (tectonic subsidence or upliftment, compaction of sediment, and sedimentation) and anthropogenic activities (drainage, embankment construction, and sediment extraction), which lead to fluctuation of relative sea-level (Auerbach et al., 2015; Brown and Nicholls, 2015; Grall et al., 2018; Hanebuth et al., 2013; Hoque and Alam, 1997; Syvitski et al., 2009). The sea level influences sedimentation (depending on the fluvial sediment supply rate and ability of delta to keep that sediment) and delta development processes that, in turn, affect coastal morphology (Darby et al., 2016; Dunn et al., 2018; Syvitski and Kettner, 2011). The coastal region of Bangladesh is highly vulnerable to subsidence, coastal erosion, and storm surge (Brammer, 2014; Nicholls et al., 2016). The net erosion of the southwestern delta coast is of ~170 km2 in the last 37 years (1973–2010) due to sea-level rise, insufficient sediment delivery and coastal erosion during storm surges; and an average annual erosion could be up to 20 mm/year (1989–2009) particularly during extreme events (Figure 1a; Allison, 1998; Brown and Nicholls, 2015; Rahman et al., 2011).
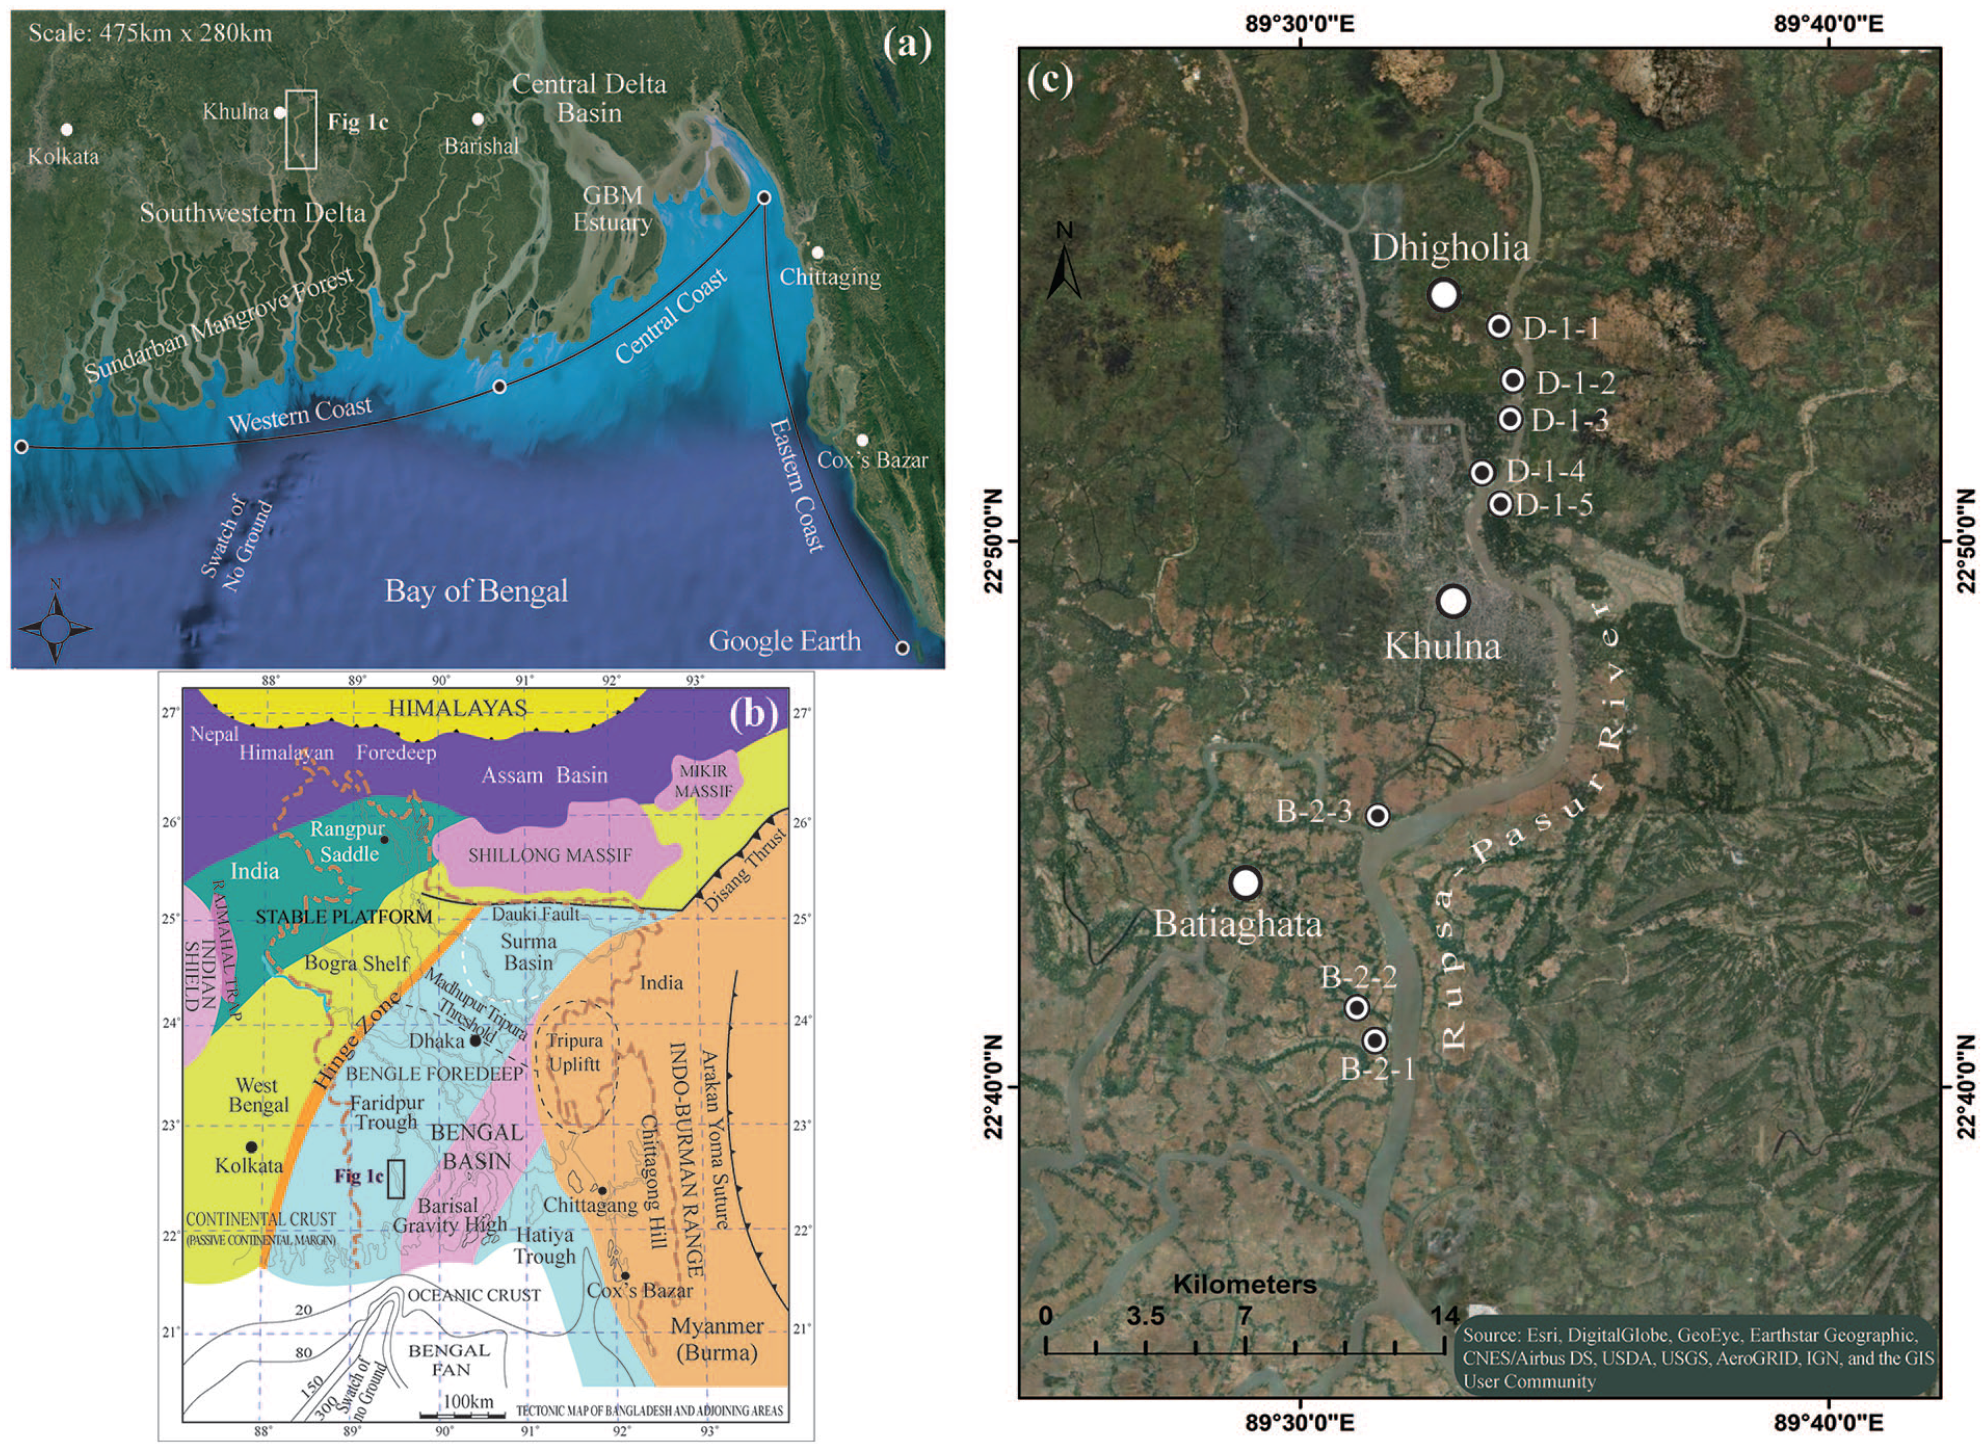
(a) Satellite image of the Sundarbans and its surrounding delta basin. (b) Tectonic settings of Bangladesh and its surrounding area (Alam et al., 1990, 2003; Uddin and Lundberg, 1999). (c) Location map of the study area showing the sampling sites.
Large river deltas and their adjacent ocean margins have provided a significant terrestrial-aquatic interface, where rivers transfer and discharge a huge amount of particulate and dissolve materials from terrestrial sources to the oceans (Milliman and Farnsworth, 2013). Variation of the organic matter composition in sediment is strongly influenced by river discharge and inflow of seawater. The geochemical transformation of organic matter and diatom assemblages enable to recognize the changes in the coastal depositional environment (Gao et al., 2012; Prasad et al., 2010, 2017; Ray and Shahraki, 2016; Ray et al., 2015).
Many authors have discussed the development and classification of the GBM delta landform, timings and development phases of the Brahmaputra-Ganges river systems as well as GBM Delta (Akter et al., 2016; Chamberlain et al., 2017; Goodbred and Kuehl, 1999; Goodbred et al., 2000a, 2000b, 2003, 2014; Islam and Tooley, 1999; Neidhardt et al., 2013; Pickering et al., 2018; Sarkar et al., 2009; Umitsu, 1993; Wilson and Goodbred, 2015). According to Allison et al. (2003) and Islam and Tooley (1999), the modern GBM delta has developed in five successive transgression phases during the Holocene and evolution started during the Last Glacial Maximum (~18 ka) when the sea level was around 120 m lower than today (Grall et al., 2018; Umitsu, 1993). Goodbred et al. (2014), Allison et al. (2003), Goodbred and Kuehl (2000b), Allison (1998), and Umitsu (1993) reported that the main channel of the Ganges River started draining the western part of the basin from 3050 BC and that result continues to develop the present-day configuration of delta around 1550 to 1050 BC. The fluctuation of sea-level has been recorded in the last 1000 years of the Holocene (Grinsted et al., 2010; Mann et al., 2009; Nunn, 1998; Ota et al., 1990), and the depositional process of the low-lying deltaic plain is highly influenced by the relative sea-level (RSL) change. Several kinds of indicators can be used to reconstruct the paleoenvironment and the Holocene sea-level change, but geochemical analyses of organic matter of sediments are considered to illustrate the effect of the RSL change on the depositional process in the late-Holocene over the study area. The analyses of sedimentary facies, total organic carbon (TOC), total nitrogen (TN), δ13C value, diatom assemblages, and radiocarbon (14C) age of the sediments have been carried out to gain a better understanding of changes in the sedimentary environment (lateral and vertical) due to fluctuation of sea level during the last 1000 years, which could be helpful to understand the future delta development process in the area.
Regional settings
The GBM delta of Bengal Basin lies in front of the Himalaya foredeep where deltaic sediment has been protruding since the Miocene from a northeast-trending hinge line (Figure 1b; Goodbred and Kuehl, 2000b). Present-day the GBM river systems deliver more than 1 × 10⁹ t/year of sediment through the estuary, where 30% accumulates in the subaerial delta, and the rest is discharged through the estuary of submarine delta and Bengal Fan (Goodbred and Kuehl, 1999; Kuehl et al., 2005; Mouyen et al., 2018; Rahman et al., 2018). The natural mangrove forest Sundarbans is the part of the southern central delta where tidal ranges reached up to 2–4 m (Figure 1a; Climate Change Cell [CCC], 2016). Tectonically, the study area falls in the eastern side of the Faridpur Trough at the Bengal Foredeep (Figure 1b; Alam, 1996; Alam et al., 1990, 2003; Uddin and Lundberg, 1999); and tectonic activities, particularly in the Faridpur Trough are the main sources of subsidence in the delta plain with geological time rather than the compaction (Goodbred and Kuehl, 2000a; Hoque and Alam, 1997). The area is subsiding due to its position at the eastern edge of the northeastward drifting of Indian Plate as described by Steckler et al. (2008), and the sediments that are carrying from uplifted Himalaya deposited in the subsiding delta basin of the area (Curray, 1994). According to Goodbred and Kuehl (1999, 2000a, 2000b) and Umitsu (1993), the Holocene strata of the study area are 10–45 m thick and have been classified into five units by the difference in lithology, which defines different depositional environments. The thick Holocene fine-grained sediments compacted due to overburden pressure have made some subsidence over time (Karpytchev et al., 2018; Steckler et al., 2010). The subaerial delta morphology, particularly the lower delta plain is sensitive to change in the balance of hydrodynamics, riverine input, and RSL change. Considering the geomorphology and elevation, the study area is suitable to interpret the terrestrial and marine influences on the depositional environment over the last 1000 years of Holocene. Here, the sediments were collected along the N (landward)-S (seaward) direction of the Rupsa-Pasur river (Figure 1c) and analyzed accordingly which could help to provide a better understanding of the vertical and lateral changes in the depositional features that reflect different environments in relation to interpret the effect of RSL of the region.
Methodology
Field investigation and grain size analysis
A detailed lithofacies have been carried out during sample collection from two locations along with N-S direction – Dhigholia (landward) and Batiaghata (seaward) of Khulna district, Bangladesh (Figures 2 and 3). The samples were collected from the exposed riverbank and pits at Dhigholia in the upper delta plain, and a gouge sampler was used at Batiaghata in the lower delta plain area. The altitudes of the sites were measured by leveling, based on the reference datums situated near the study sites. The collected sediment samples were treated with a 10% hydrogen peroxide (H2O2) solution for few hours at room temperature to dissolve organic matter for the grain size analysis, which was carried out using the laser diffraction grain size analyzer of Counter LS 13 320 (Beckman Coulter Co. Ltd). The range of grain size was determined by the machine between 0.04 and 2000 µm.

Vertical distribution of lithology, grain size, TOC, TOC/TN, and δ13C value in the sedimentary successions of Dhigholia and Batiaghata site.

(a) Immature soil horizon overlain by coarsening upward sequence of fine to medium grained sandstone with erosional contact at D-1-2 sampling site indicating flood deposit. (b) Massive to coarsening upward sequence of fine-grained sediment overlain a pottery sequence at D-1-5 sampling site indicating a major flood event deposit (possible flood event of 1998) in the sampling area at Dhigholia (length of steel tape is 80 cm).
Geochemical analyses
Geochemical proxies including the ratio of total organic carbon and total nitrogen (TOC/TN) and stable carbon isotope ratio (δ13C value) have been used to recognize the sources of organic matter of the sediment. TOC/TN of the terrestrial sediment is above 15 and the marine sediment is 3–10 (Meyers, 1997; Watson and Whitefield, 1985), whereas the δ13C values of terrestrial sediment range between −25 and −28‰ and marine sediment range between −18 and −22‰ (Deines, 1980; Jasper and Gagosian, 1990; Prasad et al., 2017; Ray and Shahraki, 2016; Sarkar et al., 2009). For geochemical analyses, the samples were taken in a glass bottle (the weight of the samples was less than 1 g) and treated with 1 N HCl to remove inorganic carbon. These bottled samples were then warmed on a hot plate (temperature in between 50 and 60°C) for 14 days and distilled water was poured into them so that these samples were not completely dry on it. These prepared samples had been used for the analysis of TOC and TN by using the Flash 2000 (Thermo Fisher Scientific Co. Ltd.). A standard of antipyrine was used (C: 70.19%; N: 14.88%) and the analytical prerecession was ±0.03%. δ13C analysis had been carried out using an elemental analyzer (Flash EA1122, Thermo Fisher Scientific Co. Ltd.) and a mass spectrometer (Delta V Advantage, Thermo Fisher Scientific Co. Ltd.) at the laboratory of Faculty of Science of Shinshu University. A few milligrams of prepared samples were taken in tin capsule and heated to 1000°C in the furnace of the elemental analyzer, and the resulting purified CO2 and N2 gas were fed directly into the mass spectrometer using the pure helium carrier gas. The results of δ13C value were expressed as per mil (‰) relative to the Vienna Peedee Belemnite (V-PDB) standard. It has been measured against working standard (Atropine; δ13C = −20.8‰) with every eight samples and the precision was ±0.13‰ for δ13C. The vertical distribution of geochemical analyses is shown in Figure 2.
Diatom analysis
The sediment samples of two cores (D-1-5 and B-2-3) were used for diatom analysis. These samples were taken (~1 g) into 200 ml beakers with 30 ml of 30% H2O2 and warmed on the hot plate (temperature ~80–90°C) for 15–20 min until the release of all effervescence. 20–30 ml of 10% HCl was added to the residue. The samples were warmed on the hot plate again and flooded with distilled water. The acid was removed by a top-up test tube with distilled water and centrifuged for 4 min at 1700 rpm (at least three times). Clay mineral was dispersed and removed by using 0.01 N sodium pyrophosphate solution for 5 h (at least four times). Sodium pyrophosphate was then removed by using a centrifuge (4 min; 1700 rpm at least three times). The slides were prepared on 18 × 18 mm cover glass and mounted in Pleurax on a glass slide. The diatoms were identified from the slide using a 1000× magnification Olympus Microscope and diatom identifications were referred to Patrick and Reimer (1966, 1975), Krammer (2000, 2002, 2003), Lange-Bertolt (2000, 2001), and Levkov (2009). Diatom assemblages represent as a percentage of the total count of diatoms and their ecological groups, namely fresh, brackish and marine water habitat according to Round et al. (1990), and Jones (2007). The distribution of the abundance of diatoms in different ecological groups with depth is shown in Figure 4.
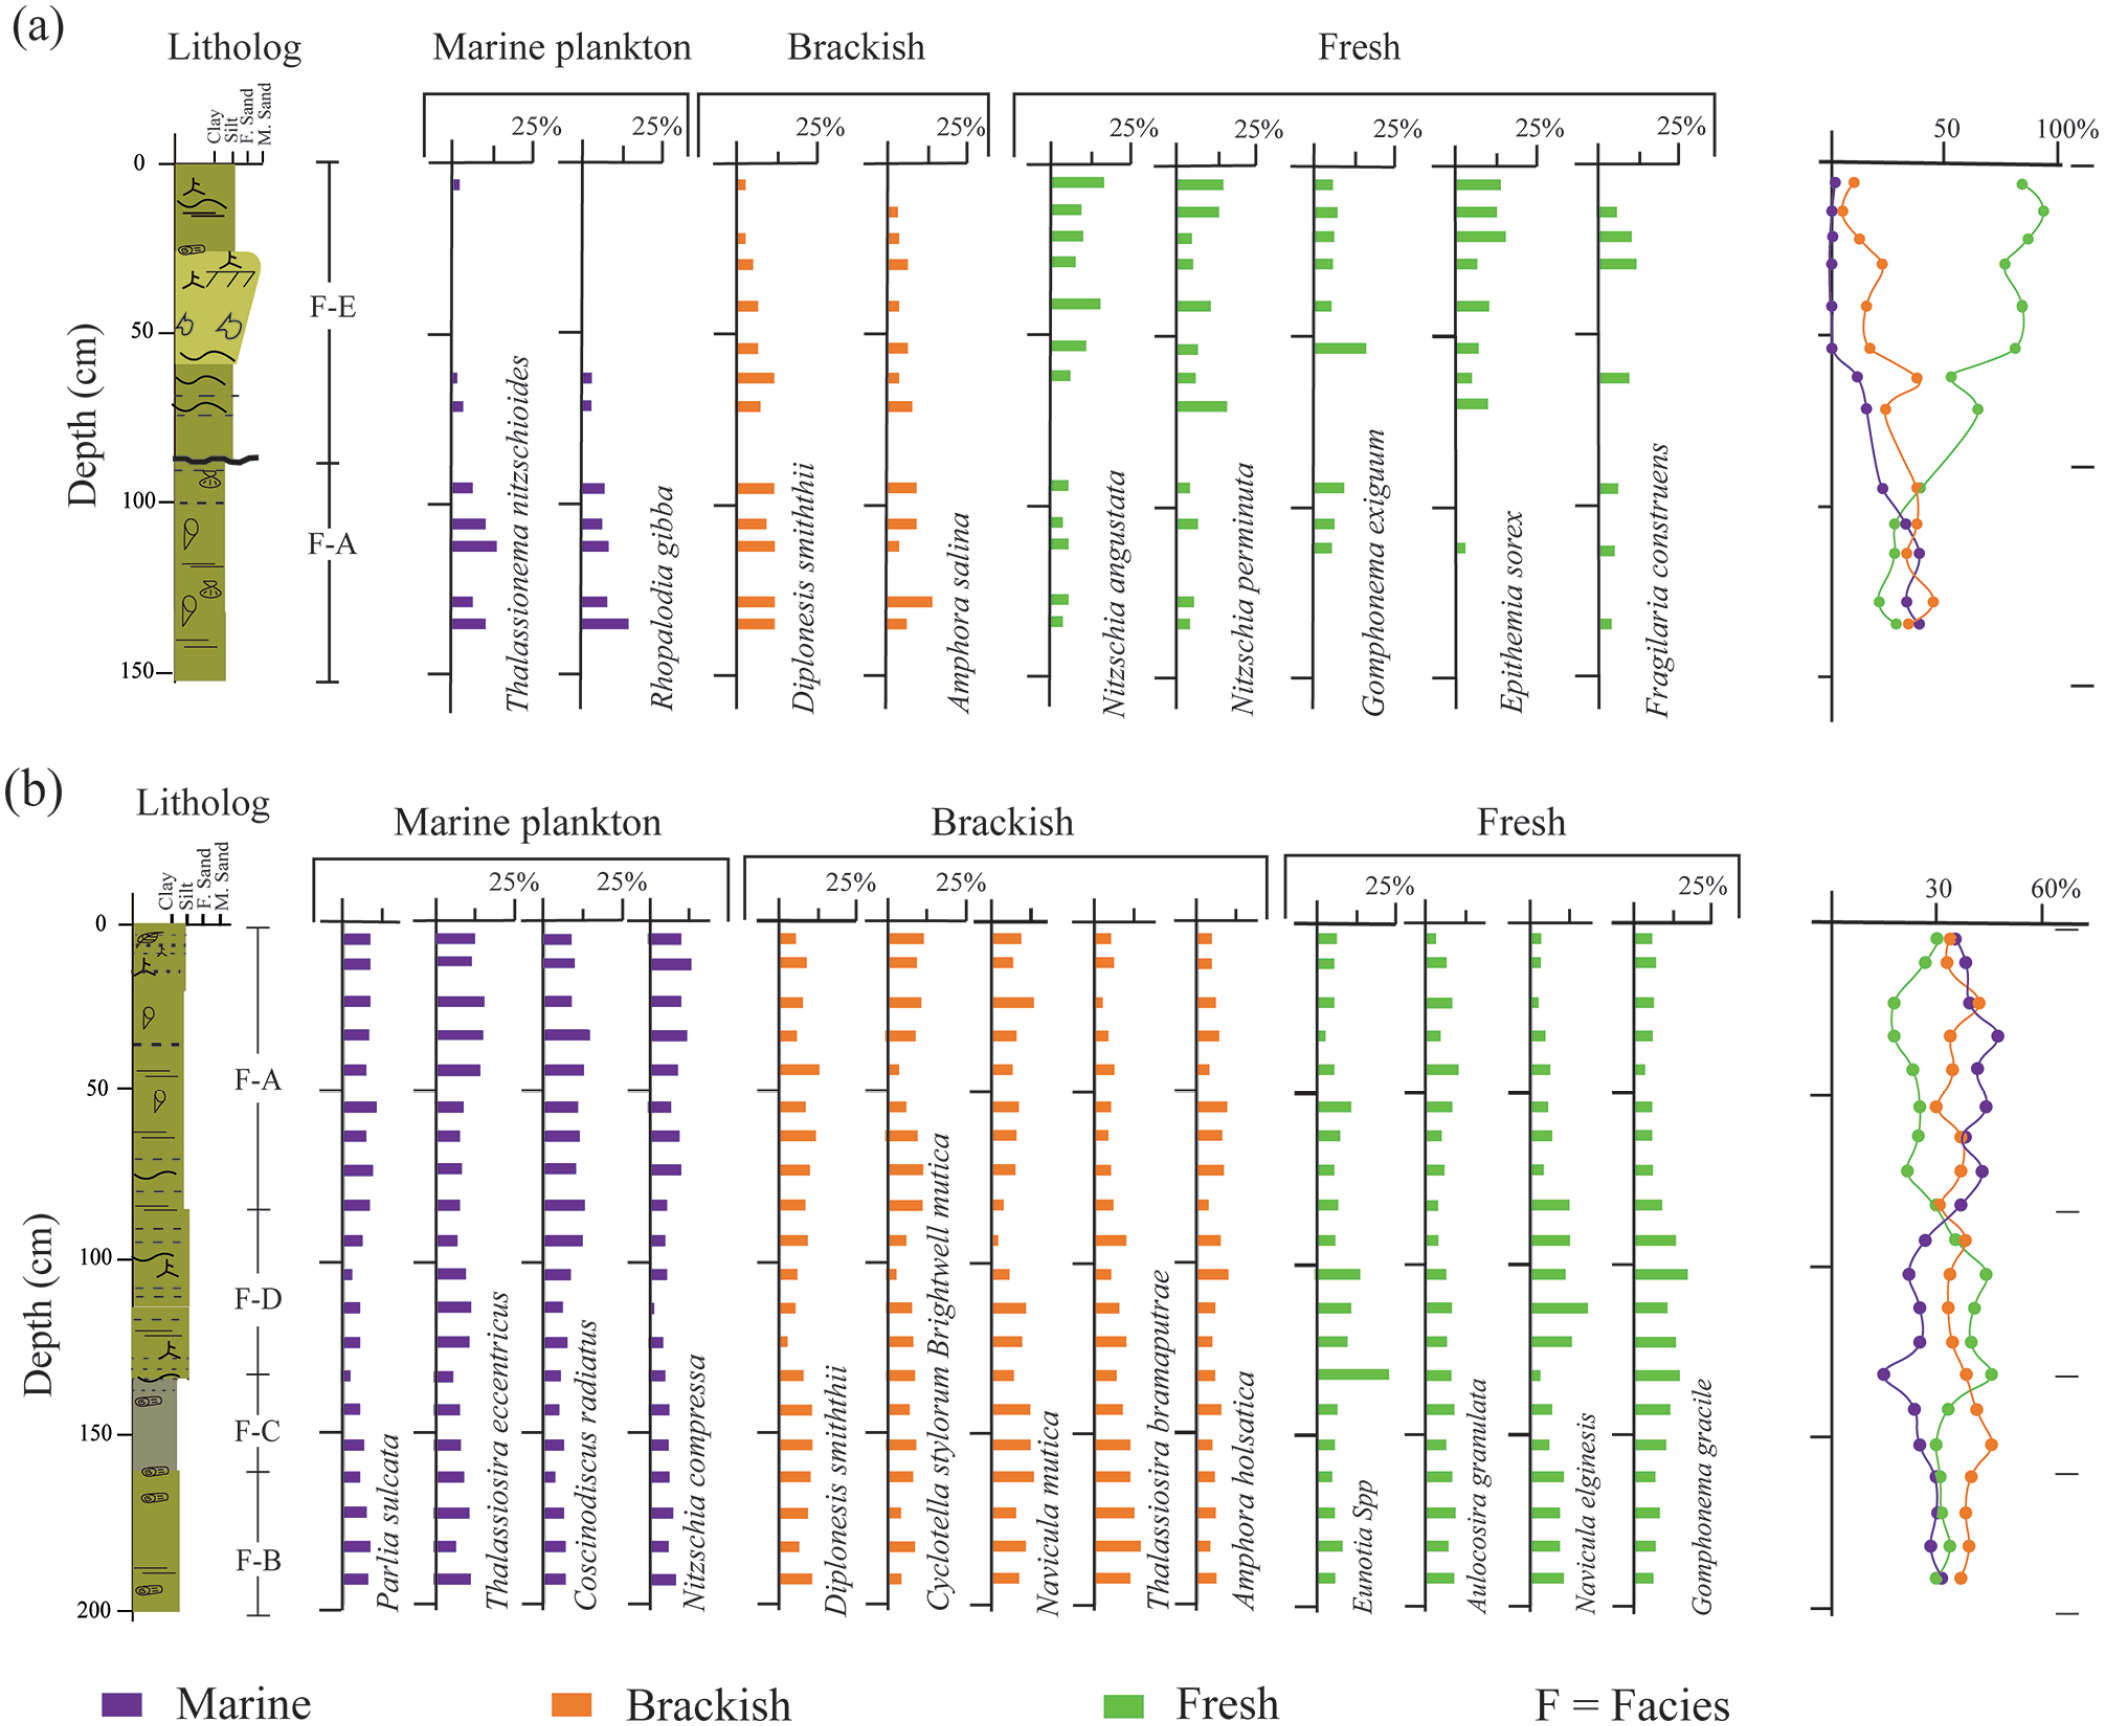
Variations of diatom assemblages of two sedimentary successions (a) D-1-5 and (b) B-2-3 located at Dhigholia and Batiaghata site of the study area.
Radiocarbon dating
The 14C age determination had been carried out on shell, peat, wood, and seed fragments using Accelerator Mass Spectrometer (AMS) at the Institute of Accelerator Analysis Ltd at Fukushima, Japan. The 14C age of shell and wood of B-2-1 sedimentary core at depth of 93 cm has been calculated to understand the reservoir effect on the sampling area. The samples show modern in their age (Table 1) and reflected no reservoir effect to measure the radiocarbon age at Batiaghata. Umitsu (1993) measured the 14C age of wood and shell fragment (Neritiolae neritina; a tidal environment in the mangrove zone) at depth 34 m and 35 m of the Dewlatpur sedimentary core of Khulna in the upper delta plain in his study and showed the age of 8890 ± 150 year BP and 8910 ± 150 year BP, respectively. The same type of shell species of D-1-1 succession has been considered to determine the 14C age of the study. For that, the reservoir effect is not considered to the calibration of 14C age of shell collected from Dhigholia of the study. Allison and Kepple (2001), Stanley and Hait (2000), and Umitsu (1993) were not considered reservoir effects and/or not calibrated to measure the age of shell samples collected from the GBM delta plain area of their study. The 14C age was converted into a calibrated calendar age with an error of 2σ using OxCal v4.3 with the IntCal13 database (Ramsey, 2009; Reimer et al., 2013). The calibrated results of measured 14C age and sedimentation rates are summarized in Table 1.
Radiocarbon age and sedimentation rate of the study area.

The sedimentation rates have been calculated considering higher percentage of probability of calibrated age and sedimentation up to 2018.
Sedimentary facies and depositional environment
Based on the lithology, grain size distribution, sedimentary structure, and composition of sediment, five sedimentary facies were identified in the sections (Figures 2 and 3). Sedimentary facies with elemental geochemistry (TOC, TOC/TN), stable carbon isotope ratio (δ13C value), and diatom assemblages have been used to characterize the origin of organic matter and describe the depositional environment of the study area (Bouillon et al., 2003; Breithaupt et al., 2014; Graham et al., 2001; Kristensen et al., 2008; Lamb et al., 2006; Meyers, 1994, 1997; Omura and Hoyanagi, 2004; Omura et al., 2006; Prasad and Ramanathan, 2009; Saintilan et al., 2013). The TOC/TN vs δ13C values diagram has been used to identify the sources of organic matter in sediments (Figure 5; Blair and Carter, 1991; Hoefs, 2009; Lamb et al., 2006; Marchand et al., 2005; Sarkar et al., 2009). Diatom assemblages help to distinguish the ecology of the environment during the deposition of the sediments (Jones, 2007; Round et al., 1990). The description and depositional environment of sedimentary facies are followed.
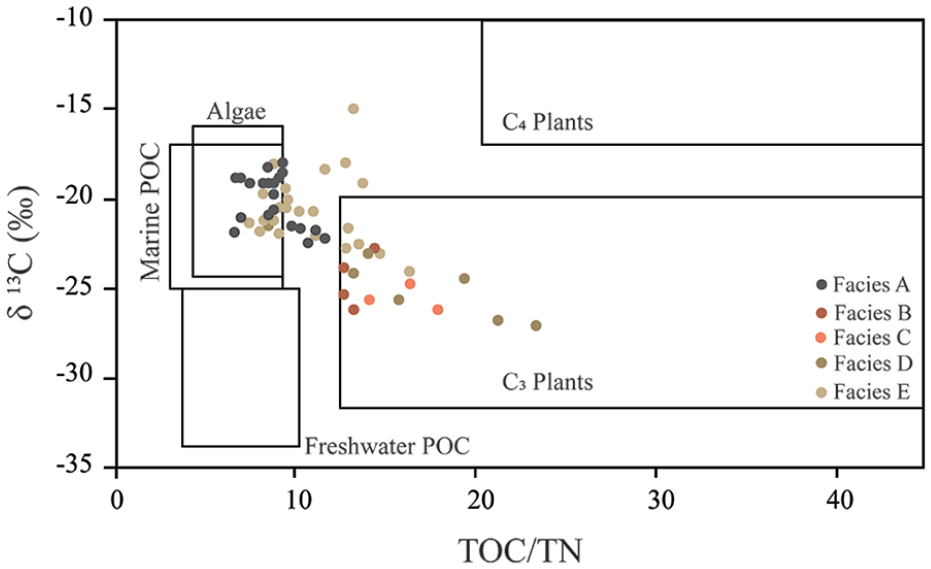
TOC/TN and δ13C values of organic matter to characterize the ranges for different sources of organic matter of the sediments (after Blair and Carter, 1991; Hoefs, 2009; Lamb et al., 2006; Marchand et al., 2005; Sarkar et al., 2009) of the study area.
Facies A (bioturbated light yellow to gray mud)
Light yellow to gray mud is found in the lower part at Dhigholia and upper part at Batiaghata successions (Figure 2). Parallel to wavy laminated gray to pale-yellow fine-grained sand with shell fragments and burrows have been found in these mud layers. The TOC, TOC/TN, and δ13C values of the sediments are 0.16–0.91%, 7.16–11.4, and −18.09 to −22.31‰, respectively (Figure 2). The brackish to marine diatom species are abundant in these facies (Figure 4).
Interpretation
Facies A is composed of mainly mud containing significant traces of the burrows and shell fragments with parallel to wavy laminated fine-grained sand that reflects the signature of a tidal flat or tide influenced environment (Daidu, 2013). TOC/TN and δ13C values indicate a marine-influenced sedimentary source (Deines, 1980; Jasper and Gagosian, 1990; Meyers, 1997; Prasad et al., 2017; Ray and Shahraki, 2016; Sarkar et al., 2009; Watson and Whitefield, 1985). The plotting of TOC/TN and δ13C values indicates that the marine/tidal water column has a major contribution of organic matter of the facies (Figure 5). Diatom assemblages suggest a strong tidal influence during the deposition of the sediments of Facies A (Figure 4).
Facies B (bluish-gray mud)
The lower part of the sedimentary successions of B-2-2 and B-2-3 at Batiaghata are composed of the facies (Figure 2). Bluish gray carbonaceous rich mud laminated with parallel and cross-laminated white to grayish-white colored silty sand (Figure 2). The TOC, TOC/TN, and δ13C values of the sediment range from 2.20–5.31%, 12.63–13.91, and −22.72 to −22.31‰, respectively (Figure 2). The brackish diatom species are significantly found in the facies (Figure 4b).
Interpretation
The bluish-gray mud facies containing very fine parallel to cross sand laminae and grain size can be interpreted as a low energy environment. The TOC/TN and δ13C values indicate a transitional brackish environment where brackish water habitat diatom species are found in the deposits of the facies. The facies contain a high concentration of organic mud with plants or root traces and have parallel and cross silty sand laminae which indicate a lower delta mud plain environment (Howa and Stanley, 1991; Rossi et al., 2019).
Facies C (dark gray to black peat with peaty mud)
The dark gray to black peat facies are documented in the B-2-3 (130–155 cm), B-2-2 (83–108 cm) successions at Batiaghata, and peaty mud is found over the peat layer and in the bottom of the B-2-1 (165–170 cm). Highly carbonaceous organic-rich dark gray to black peaty mud containing wood and plant fragments, and interbedded with silty sand has been found over the peat layer. The facies are containing a large quantity of organic matter (TOC up to 13.39%). The TOC/TN of these facies zones reach up to 23.11, and the δ13C value is −26.83‰ (Figure 2). Brackish to freshwater habitat diatoms are dominantly found in the facies (Figure 4b).
Interpretations
The peat layer was formed under brackish to freshwater swamp environment and deposited during the regression of the sea (Mukherjee, 1972; Rashid et al., 2013). It is observed that the δ13C values and TOC/TN of the peat layer are more comparable with the value of the sediments of the mangrove forest of Sundarbans (Prasad and Ramathan, 2009; Ranjan et al., 2011; Ray et al., 2015; Sarkar et al., 2009) and also comparable with a global range of mangrove of the coastal areas (Gonneea et al., 2004; He et al., 2010; Hoefs, 2009; Ray and Shahraki, 2016; Thimdee et al., 2003). The TOC/TN vs. δ13C value shows that terrestrial influenced C3 plants are the dominant source of organic matter in this sedimentary Facies C (Figure 5). The lithology, geochemical analyses, and diatom assemblages indicate that the mangrove organic matter sources during the deposition of the sediments.
Facies D (yellowish-gray mud)
Yellowish-gray mud is observed over the peaty mud at Batiaghata successions (Figure 2). Parallel to wavy laminated olive-gray to pale yellow fine sand with rootlets, and plant fragments have been found in these layers. The facies contain organic matter (TOC ~2%), TOC/TN is above 15 and δ13C value is below −25‰ (Figure 2). Freshwater habitat diatom species are observed in the facies (Figure 4b).
Interpretation
Existence of rootles and high concentration of TOC, TOC/TN, and lower values of δ13C indicate a terrestrial influenced environment and the TOC/TN versus δ13C value diagram shown that C3 plants are the dominant source of organic matter in the facies (Figure 5). Diatoms analysis represents the increase of freshwater influences during deposits of sediments.
Facies E (laminated silty sand)
The facies is underlined by an erosional surface that lies over the upper part of tidal influenced Facies A at Dhigholia (Figure 2). Parallel to wavy laminated medium to fine-grained sand is overlaid by 2–8 cm thick mud layer common at the Dhigholia site (Figure 3a). Bidirectional to unidirectional ripple, horizontal laminated light gray to pale yellow silty sand has alteration with thinly laminated olive black mud. The mud contains root trace and shell fragments. A depositional sequence over the 20–65 cm thick with pottery noted in the upper part of the D-1-5 succession, has laminated silty sand facies with ill-sorted medium to fine-grained sand with abundant rootlet (Figures 2 and 3b). The successions were exposed due to riverbank erosion and shown coarsening upward medium to fine-grained sand over the sampling point of the pottery.
The TOC/TN is low (8–10) in the lower part of the facies and the value gradually increases in the upper part; and shown higher (up to 17.97) at D-1-5 succession (Figure 2). The average δ13C values are relatively low in these successions (−22.55‰ at D-1-1 and −24.18‰ at D-1-5) whereas higher values are observed in the topmost part of D-1-2, D-1-3, and D-1-4 sedimentary successions (Figure 2). A total of 12 species of diatoms are identified in the facies that represent the freshwater habitat diatoms abundance in the facies as shown in Figure 4a.
Interpretation
The lithology, grain size, and their characteristic features indicate that the sediments could be deposited during the terrestrial river avulsions/flood event over the present level of flood plain or valley flat (Howard et al., 1968). The transitional to terrestrial influence has been observed in the upper part of these sections where the TOC/TN reaches up to 17.97 and relatively lower δ13C ~−24.18‰ in the D-1-5 succession (Figure 2). It has been noted that the δ13C value is shown lower at the bottom of D-1-2, D-1-3, and D-1-4, and shows higher at the top of the successions due to the growth of sugar cane and paddy field which mostly belong to C4 Plants (C4 plant; δ13C value −17 to −9‰; Deines, 1980) over the sampling areas. Diatom assemblages suggest the terrestrial freshwater influences in the sedimentary succession of D-1-5 (Figure 4a). Figure 5 shows that the terrestrial plant originated organic matter input, particularly the C3 plant is observed in the upper part of the sedimentary sequence at Dhigholia.
Discussion
The altitudes of every sampling point and radiocarbon dating have been considered to illustrate the lateral variation of sedimentary facies and the effect of RSL change on depositional environment of the study area (Figures 6 and 7). Two facies A and E are identified at Dhigholia whereas four facies B, C, D, and A are found at Batiaghata site (Figure 6). The time stratigraphy diagram of Wheeler (1964) has been used to illustrate the effect of the RSL on the depositional process of the study area. The 14C age and geometric position have been considered to reconstruct the diagram of RSL and sedimentary environmental changes over the study area (Figure 7). Facies A of Dhigholia is shown older in radiocarbon age and deposited before 1300 AD whereas pottery and flood sediment of modern age lies over it (Figure 6). Facies C shows the age of 1490 ± 35 AD, Facies D 1782 ± 19 AD, and modern aged samples of Facies A successively found at Batiaghata (Figure 6). The depositional environment of the sediment, chronology and record of global sea-level change have been considered to understanding the effect of sea level on depositional process over the study area. Considering these analyses, the sediments were deposited in three stages: Stage I (850–1300 AD), Stage II (1300–1850 AD), and Stage III (1850 AD –Recent) that show a noticeable effect of RSL on the depositional environment change in the low-lying southwestern delta basin during the last 1000 years. The descriptions of the stages are followed.
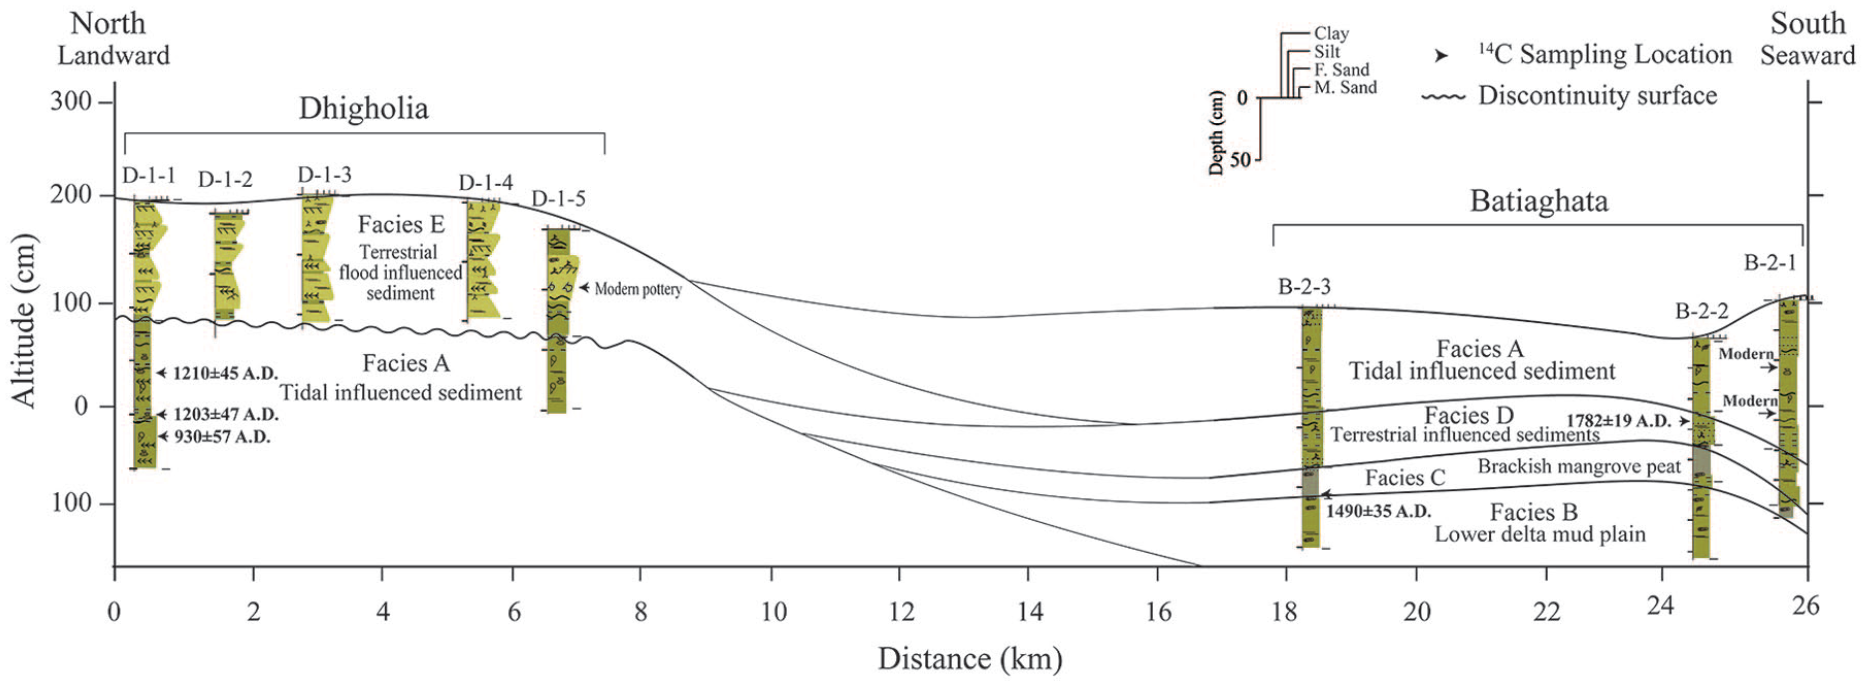
Stratigraphic sections showing the vertical and later changes of sedimentary facies, depositional environment along the N-S direction from Dhigholia to Batiaghata sites of the study area.
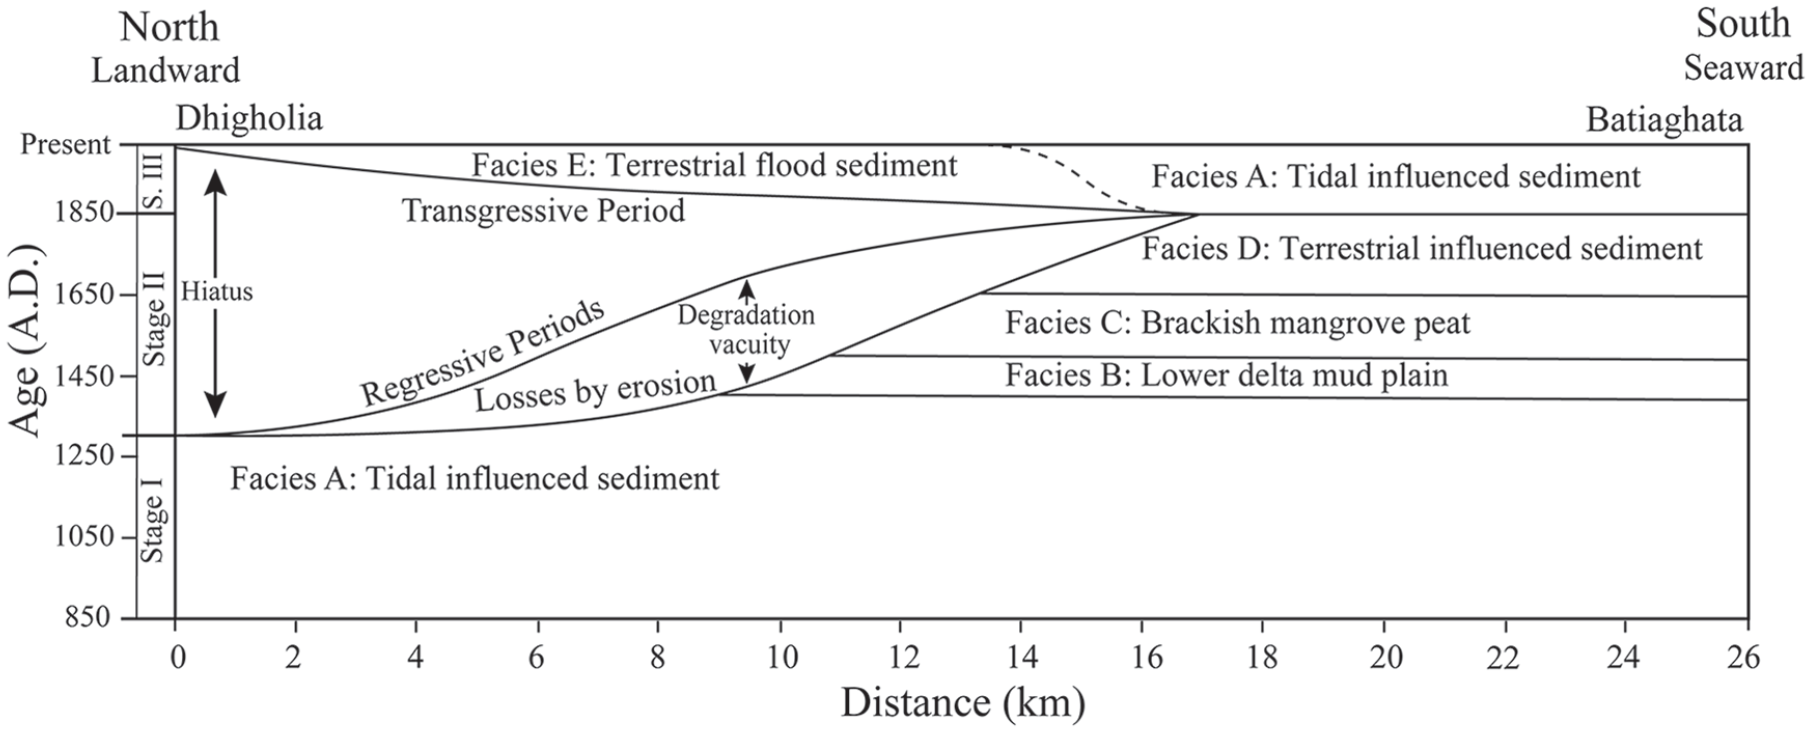
Schematic illustration of the depositional environment, time stratigraphy, and relative sea movement in and around the study sites (after Wheeler, 1964).
Stage I (850–1300 AD)
The tidal influenced Facies A of Dhigholia was deposited in this stage (Figure 7). The shells were found in Facies A at depth 220 cm, 200 cm, and 159 cm at D-1-1 and dated by 14C methods showing the age of 930 ± 57 AD, 1203 ± 47 AD, and 1210 ± 45 AD respectively (Table 1; Figure 6). The sea level (and ground temperature) was comparatively higher than the present level in and around 1250 AD (Grinsted et al., 2010; Mann et al., 2009; Warrick and Ahmed, 1996) and it was 90 cm above the present level in the Pacific (Nunn, 1998; Ota et al., 1990). The sediments of Facies A were deposited in the landward upper delta plain at Dhigholia where RSL was higher than the present level (up to +80 cm) over the study area (Figure 6).
Stage II (1300–1850 AD)
The lower delta mud plain Facies B, brackish mangrove peat of Facies C, and terrestrial influenced Facies D were deposited successively at Batiaghata during the stage (Figure 7). The peat and seed fragment found at B-1-3 and B-1-2 successions showing the age of 1490 ± 35 AD and 1782 ± 21 AD, respectively (Table 1; Figure 6). The ground temperature fell rapidly after 1300 AD towards the Little Ice Age and the level dropped up to 90 cm below the present level measured in the Pacific in 1750 AD (Nunn, 1998; Ota et al., 1990). The mangrove peat has been applied as an indicator of the former sea level (Cohen et al., 2005; Woodroffe et al., 1985) and RSL fell up to 110 cm below the present level (Figure 6). The rate of fall of sea level was faster than the subsidence rate and the mangrove ecosystem was replaced by the freshwater habitat ecosystem in the upper part of the sediment (Facies D). Due to the dropped of RSL, upstream water was discharged through the channel causing a down-cut of the river valley and/or increase of riverbed gradient and formed a new base level (Duff, 1993). The terrace and/or non-depositional or erosional surfaces were formed at Dhigholia due to regression and fell of the base level (Figure 7).
Stage III (1850 AD –Recent)
The tidal influenced sediment of Facies A was deposited over the Facies D at Batiaghata, where the modern aged shell and wood fragments have been found at depth of 57 cm and 93 cm in B-2-1 (Table 1), and terrestrial flood sediment of Facies E have been deposited over the Facies A in landward, where modern pottery was found at Dhigholia during this stage (Figures 6 and 7). The sea level and the ground temperature rose after around 1750 AD and reached the present level (Abu-Zied and Bantan, 2015; Grinsted et al., 2010; Mann et al., 2009; Nunn, 1998; Warrick and Ahmed, 1996). The average rate of mean sea-level rise ranges from 1.1 to 1.7 mm/year in the last century (Hay et al., 2015; Intergovernmental Panel on Climate Change [IPCC], 2007) and the rising trend of tidal river water level was 3–5 mm/year for the last 30 years (1981–2013) recorded in the study area (CCC, 2016).
The rise of global temperature has increased the water volume in the ocean influencing the tidal limit, as well as sea level in an area. It also affects the flooding intensities in the coastal region. The net subsidence is attributed to sedimentation, tectonics, compaction; and RSL changes that have triggered the gradual shifting of the coastal environment (Brown and Nicholls, 2015). Due to the shifting of the Ganges estuary from the Khulna region to the east after 1.8 ka (Allison et al., 2003), the major sediment and flow are now passing through the present GBM estuary and the sedimentation rate has gradually decreased in the southwestern delta basin compare to central estuary delta (Figure 1a). The estimated average sedimentation rate of the study is 1.96–2.89 mm/year of the last 1000 years (Table 1) – that is calculated by using depth to 14C age of organic matter – is also comparable to the average sedimentation rate of the Holocene 2–5 mm/year over the southwestern Bengal delta (Allison et al., 2003; Islam and Tooley, 1999; Stanley and Hait, 2000), and modern 137Cs based sediment accumulation rate ranging from 0 to 11.3 mm/year with an average of 3.7 mm/year in the lower delta plain areas. (Allison and Kepple, 2001). The sediment of southwestern lower delta plain has been supplied by GBM estuary, carried westward by coastal current, and deposited inland by cyclone event and monsoonal coastal setup (Figure 1a). For that, the sedimentation rate shows higher in the outer delta compare to the upper delta plain (Allison and Kepple, 2001; Goodbred et al., 2014; Willson and Goodbred, 2015). The subsidence over the area ranges from 1.5 to 2.0 mm/year (Krien et al., 2019) whereas it is 2.8 mm/year reported for the Sundarbans (Brown and Nicholls, 2015; Karpytchev et al., 2018) and subsidence reached up to 5.2 mm/year in the outer delta of the region (Hanebuth et al., 2013). The elevation of Sundarbans varies from 0.9 to 2.11 m above sea level (Ghosh et al., 2015, 2016; Spalding, 2010). The sedimentation, subsidence, and RSL change play an important role in shifting the depositional environment over the study area. The average sedimentation rate of Holocene is insufficient to offset the effect of subsidence and the rising trend of present sea-level (Hanebuth et al., 2013; Willson and Goodbred, 2015). Due to the rising trend of the sea as well as the base level, the influences both the terrestrial and coastal flood have increased and created a new area of inundation that also increases the sedimentation over the area (Alongi, 2015; Griffiths et al., 2019; Nicholls and Wilson, 2001; Pickering et al., 2017; Takagi et al., 2016). For this, upstream water is hindered while flowing through the channel increasing the terrestrial flood-influenced sediment deposits over the erosional surface towards the land, tidal influenced sediment from the coast deposited upon it (Figure 7).
Conclusion
The study interprets the depositional environment and their relation to the relative sea-level change in southwestern Bengal delta, Bangladesh. Five facies have been identified with the sedimentary successions. The geochemical proxies and diatom assemblages have been used to characterize the organic matter and reconstruct the depositional environment of the sediment. Tidal influenced Facies A is identified in the lower part at Dhigholia site (landward) that was deposited during 850–1300 AD when sea level reached higher than the present. The sea level fell after around 1300 AD and lower delta mud plain Facies B, brackish mangrove peat of Facies C (1490 ± 35 AD), and terrestrial influenced Facies D (1782 ± 19 AD) were deposited successively at Batiaghata toward the sea. These sediments were deposited during the regression of the period 1300–1850 AD and the terrace was formed at Dhigholia due to the lowering of the base level. Tidal influenced Facies A gradually thickened at lower delta plain Batiaghata where a new level of inundation occurred due to the rising trend of the sea after 1850 AD along the study area. It also hinders upstream water flow through the channel increasing flood intensities and the terrestrial flood deposits of Facies E are deposited over the erosional surface at the upper delta plain of Dhigholia site. The depositional process of the low-lying southwestern Bengal delta has been controlled by the sea level; the intensities of the terrestrial flood sediment deposits in landward and tidal influenced sediment from sea gradually deposit upon it due to the rising trend of the present sea level. The findings of the study will contribute to understanding the effect of sea-level on depositional environment change in the last 1000 years, particularly for the coastal region.
Supplemental Material
sj-pdf-1-hol-10.1177_0959683621994671 – Supplemental material for Influences of sea level on depositional environment during the last 1000 years in the southwestern Bengal delta, Bangladesh
Supplemental material, sj-pdf-1-hol-10.1177_0959683621994671 for Influences of sea level on depositional environment during the last 1000 years in the southwestern Bengal delta, Bangladesh by Md. Masidul Haque and Koichi Hoyanagi in The Holocene
Supplemental Material
sj-xls-2-hol-10.1177_0959683621994671 – Supplemental material for Influences of sea level on depositional environment during the last 1000 years in the southwestern Bengal delta, Bangladesh
Supplemental material, sj-xls-2-hol-10.1177_0959683621994671 for Influences of sea level on depositional environment during the last 1000 years in the southwestern Bengal delta, Bangladesh by Md. Masidul Haque and Koichi Hoyanagi in The Holocene
Supplemental Material
sj-xls-3-hol-10.1177_0959683621994671 – Supplemental material for Influences of sea level on depositional environment during the last 1000 years in the southwestern Bengal delta, Bangladesh
Supplemental material, sj-xls-3-hol-10.1177_0959683621994671 for Influences of sea level on depositional environment during the last 1000 years in the southwestern Bengal delta, Bangladesh by Md. Masidul Haque and Koichi Hoyanagi in The Holocene
Footnotes
Acknowledgements
The primary author thanks Mitsubishi Corporation International Scholarship, Japan for giving financial support during the study in Japan. The authors are indebted to Dr. A.K.M. Khorshed Alam, Former Director General, Geological Survey of Bangladesh (GSB), Dhaka, Bangladesh for constructive discussions and suggestions during the research. The authors also gratefully thank Shiori Uchiyama and Hiromi Sashi, Graduate School of Science and Technology, Shinshu University, Japan for their cordial support during diatoms and geochemical analyses.
Funding
The author(s) disclosed receipt of the following financial support for the research, authorship, and/or publication of this article: The research was partly supported by Grants-in-Aid for scientific research (no. 18K03778 for KH) from the Japan Society for the Promotion of Science (JSPS).
Supplemental material
Supplemental material for this article is available online.
References
Supplementary Material
Please find the following supplemental material available below.
For Open Access articles published under a Creative Commons License, all supplemental material carries the same license as the article it is associated with.
For non-Open Access articles published, all supplemental material carries a non-exclusive license, and permission requests for re-use of supplemental material or any part of supplemental material shall be sent directly to the copyright owner as specified in the copyright notice associated with the article.