



Abstract
A morphodynamic approach to coastal evolution involves recognition of internal thresholds, feedbacks and boundary conditions and should underpin coastal management. The Holocene evolution of the Bega River estuary and Tathra Beach coastal barrier was examined integrating existing sediment cores and radiocarbon dating, airborne terrestrial and marine Lidar and OSL dating. Sediment coring reveals the Bega River estuary began infilling with fluvial sand once sea levels stabilised at or near their present elevation. Radiocarbon dating suggests a prograding fluvial delta reached the coast approximately 4000–2250 years BP. Barrier deposition commenced ~3200 years ago coinciding with the arrival of fluvial sand at the coast. Shoreline progradation of the Tathra barrier occurred at 0.15 m/year from ~3200 years to present forming a sequence of ~17 foredune ridges which were each active for an average of ~190 years. In the past ~500 years, a sand spit has restricted the entrance of the Bega River estuary to the northern end of the embayment. The infill of the Bega River estuary over the Holocene represents an internal morphodynamic threshold or tipping point, which then enabled coastal barrier deposition as fluvial sand reached the coast. The coastal system approaches another threshold as the Tathra embayment infills, and sediment may be transported northward out of the embayment. At Tathra Beach, the positive sediment budget which resulted in barrier progradation is approximately 0.55 m3/m/year. This signal is masked on the yearly to decadal scale by fluctuations in beach volume an order of magnitude greater (5–20 m3/m/year depending on the timeframe examined). Thus longer-term datasets of beach change or reconstructions from the geological record are needed to underpin management decisions which will impact shorelines decades or centuries into the future.
Introduction
Since a morphodynamic approach to coastal research was synthesised by Wright and Thom (1977), it has been applied by researchers to a range of individual landforms such as beaches (see Jackon and Short (2020) and references therein), dunes (e.g. Darke et al., 2016), estuaries (e.g. Haines et al., 2006; Harris et al., 2002; Zhou et al., 2017) and barriers (e.g. Hesp and Short (1999), see also McBride et al. (2022 and references therein). In the context of contemporary pressures on coastlines, the morphodynamic paradigm also enables consideration of the whole coastal system including the interactions of individual landforms over a range of spatial and temporal scales Cowell and Thom (1994). Coastal morphodynamics, combined with an understanding of coastal compartments and sediment budgets (Thom et al., 2018), is a powerful tool for conceptualising and quantifying coastal changes.
A morphodynamic approach has been applied to coastal barriers around the world (McBride et al., 2022). In Australia, studies of Holocene coastal barrier deposition have been a key contribution of Australian coastal geomorphologists to global scholarship. Starting in the late 1950s and 1960s were discussions on the genesis of beach ridges (see Oliver et al. (2017c) for review) which progressed to coastal barrier stratigraphy and chronology (Roy and Thom, 1981; Roy et al., 1980; Thom (1965), Thom (1978, 1984); Thom et al., 1981a, 1981b, 1981c). A resurgence of coastal barrier studies in Australia, and especially utilising coastal barriers as archives of palaeoenvironmental data in the last 20 years, has been supported by advances in chronology such as Optically Stimulated Luminescence (OSL) dating and geophysics such as Ground Penetrating Radar (GPR) (Brooke et al., 2008a, 2008b, 2019; Dillenburg et al., 2020; Forsyth et al., 2010, 2012; Kennedy et al., 2020; Murray-Wallace et al. 2002; Nott et al. (2009, 2015); Oliver et al. (2017a, 2018, 2020a, 2022); Tamura et al., 2018, 2019). Coastal barrier research New South Wales (NSW) coast in recent years has focused on revising the depositional history of prograded barriers and understanding sediment sources for barrier deposition (Carvalho et al., 2019; Goodwin et al., 2006; McBride et al., 2021; Oliver and Woodroffe, 2016; Oliver et al., 2015, 2017b, 2019, 2020b). New insights on beach and foredune morphodynamics and contemporary shoreline change supplementing local beach surveying efforts (Harley et al., 2017; McLean and Shen, 2006) have emerged utilising remote sensing methodologies and datasets such as airborne Lidar (Doyle et al., 2019), photogrammetry and structure from motion from drones (e.g. Carvalho et al., 2021), and satellite data archives (Bishop-Taylor et al., 2021; Nanson et al., 2022; Vos et al., 2023). These studies of sandy shoreline behaviour directly inform our understanding of longer-term coastal barrier formation and morphodynamics through reconstructing beach change and foredune formation which comprise barrier systems.
Similarly for estuaries, morphodynamic models have been used to unravel complex interactions between physical processes and biotic factors that shape estuarine environments. Estuaries are morphologically diverse and have been described by the degree of influence of tidal exchange, wave climate and catchment discharge (Woodroffe, 2003). These broad hydrodynamic influences have been recognised as a continuum and their interactions alter the shape and extent of sedimentary and biogeographical features over time and space.
Estuaries are sediment sinks and their evolution over the Holocene can be defined by the degree of sediment infill (Woodroffe, 2003). The rate of infill is dependent on both fluvial and marine sources of sediment, as well as geographic size of the estuary basin (Roy, 1984b), with the supply of fluvial sediment most important, as an estuary generally infills from landward to seaward (Kench, 1999). Younger systems (immature) have a larger proportion of open water, compared to more mature systems that comprise extensive intertidal zones (Allen, 2000; Pye and French, 1993; Roy, 1984b; Thom, 1982; Woodroffe, 1992). Sea-level change over the Quaternary, and particularly the Holocene, has influenced estuary formation, position, and evolution at the coast (Kench, 1999; Woodroffe, 2003).
In micro-tidal settings, so called ‘barrier estuaries’ are one type of wave-dominated estuary common throughout southern Australia where tidal exchange is partially restricted due to the occurrence of a sand barrier across the estuarine entrance (Hanslow et al., 2018; Roy et al., 2001). ‘Drowned river valley’ estuaries have more open entrances and are considered tide-dominated while residing in micro-tidal, wave-dominated settings (Roy et al., 2001). In these environments ocean tides may propagate far upstream and may be slightly amplified by the estuary shape (Roy et al., 2001). Four distinct sedimentary zones (marine flood-tidal delta, central mud basin, fluvial delta and riverine channel/alluvial plain) can be described for barrier estuaries in southeast Australia, where the relative extent of each zone changes with the degree of infilling (Kench, 1999; Roy, 1984b; Roy et al., 2001).
Recent studies of estuarine morphodynamics have utilised an array of technologies that capture spatial and/or temporal dynamics in estuarine processes. This includes high-temporal field observations (e.g. tidal dynamics, Harley and Kinsela, 2022; Kumbier et al., 2022), numerical modelling (Hughes et al., 2019; Kumbier et al., 2018a, 2018b), and remote sensing such as Lidar and Earth observation (Heimhuber et al., 2017; Mao et al., 2022; Mueller et al., 2016). Utilising these in combination can provide excellent tools, such as Inlet Tracker (Heimhuber et al., 2021), for analysing the morphological changes and their drivers over recent decades. Such tools provide a sound basis for evaluating both short and long term interventions of estuary entrances and their management implications (Hanslow et al., 2018; Khojasteh et al., 2021; Thom et al., 2020).
In this study we apply the morphodynamic framework beyond an individual component of the coastal system and consider interactions and sediment exchange between the estuary, beach, barrier and shoreface. Specifically, we aim to reconstruct the depositional history of the Bega River estuary and Tathra and Nelson coastal barrier systems and infer the driving processes and internal thresholds which cause system-wide change. In so doing, this study sheds light on the importance of understanding the longer-term tipping points and internal dynamics of coastal systems when considering management approaches to contemporary anthropogenic pressures.
Regional setting
Tathra Beach and the Bega River catchment and estuary system are located approximately 340 km SSW of Sydney on the NSW south coast. The Bega River catchment is ~1940 km2 and flows past the township of Bega (Figure 1) before reaching the Tasman Sea at the northern end of Tathra Beach. This is the second biggest river catchment south of Sydney after the Shoalhaven River (Carvalho et al., 2019).
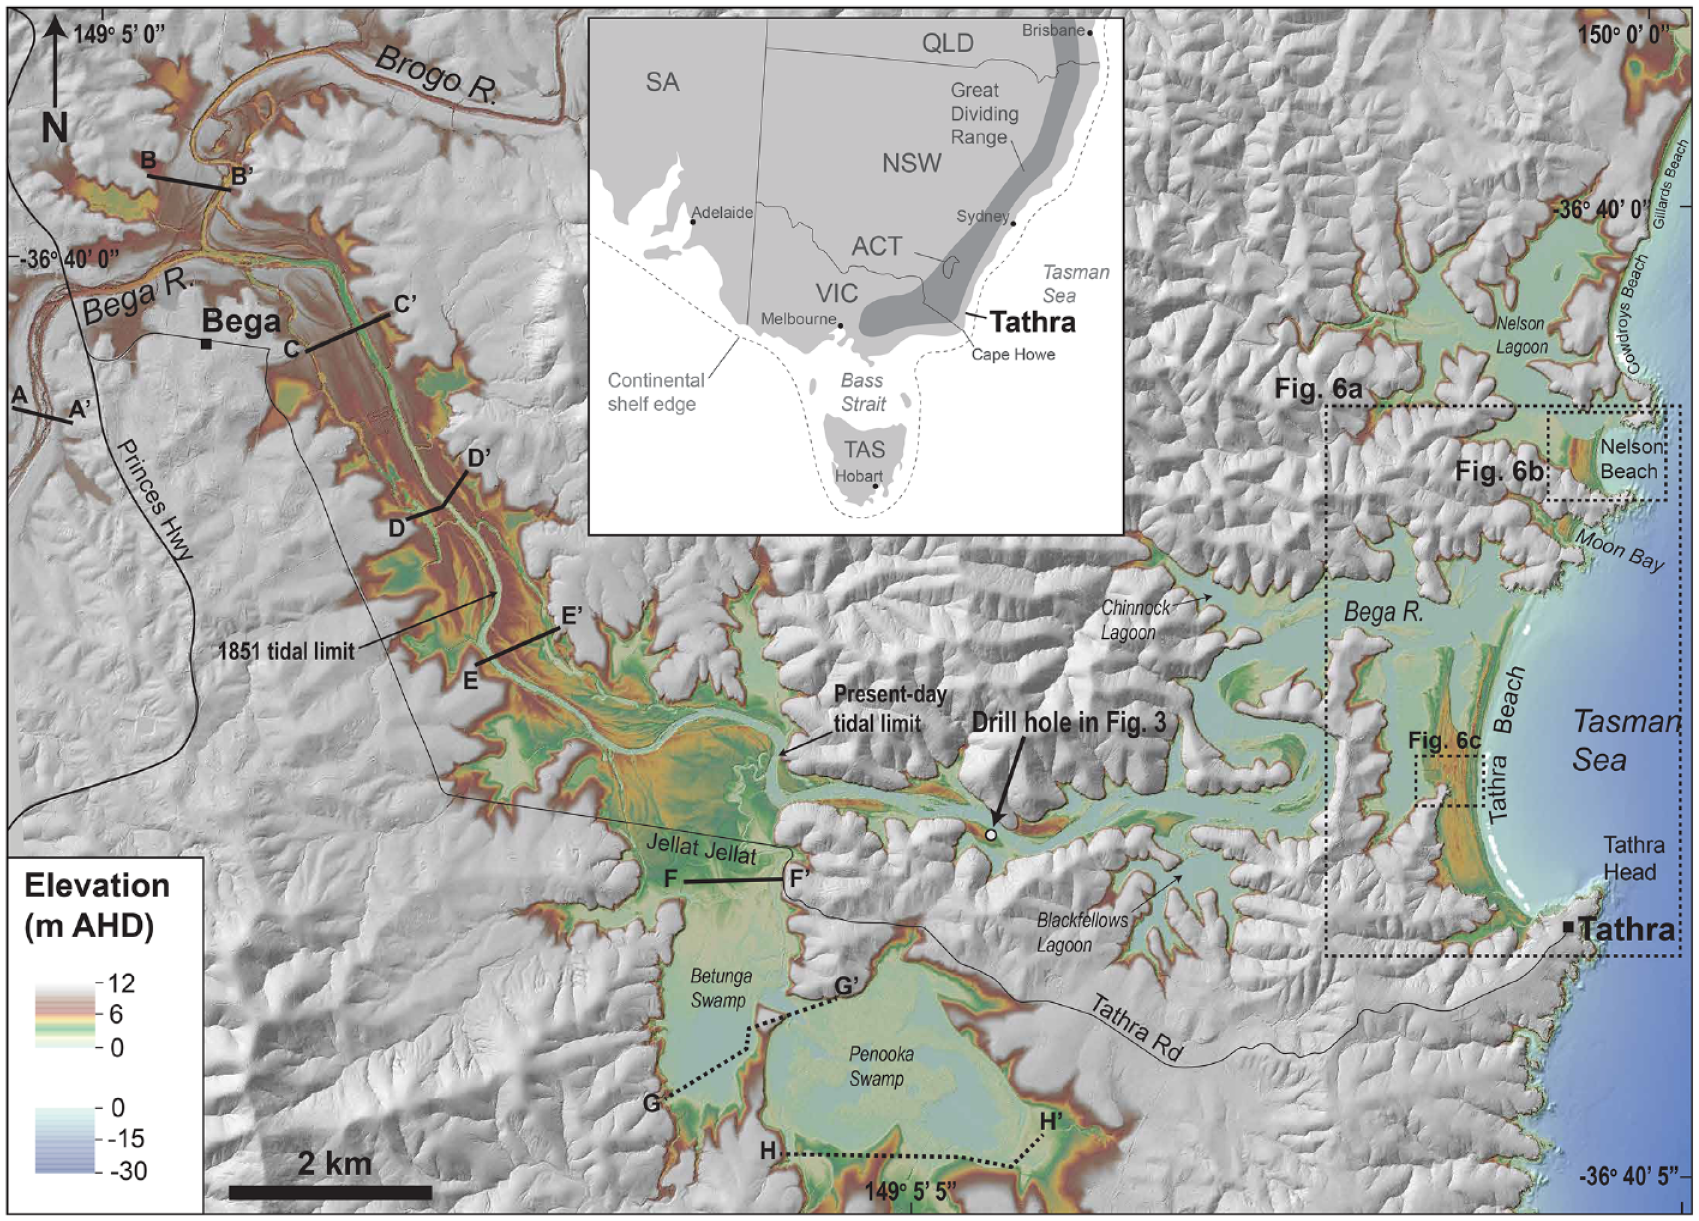
High-resolution elevation map of the lower Bega River and the Tathra Beach barrier system. Elevations references to the Australian Height Datum (AHD). Bold lines demark the location of geological cross sections based on drilling from Sundararamayya (1983) labelled A-A’ through to F-F’ (see Figure 2). Dotted lines indicate the location of geological cross sections G-G’ and H-H’ which are found in Supplemental Data.
The geology of the Bega River catchment is dominated by the Bega Batholith igneous suite and specifically the Bemboka Granodiorite which is early Devonian in age and is rich in plagioclase and K-feldspar, as well as quartz, biotite and amphibole (Lewis and Glen, 1995; Taunton et al., 2000). Below the township of Bega near the present-day tidal limit at Jellat Jellat (Figure 1), the river valley narrows markedly and fluvial deposits are much more limited in extent. The transition to this narrow gorge corresponds with a change in geology with this lower part of the palaeo river valley carved through the Adaminaby Superterrane which forms part of the Lachlan Fold Belt (Lewis and Glen, 1995). Tathra Head (Figure 1), which bounds Tathra Beach at its southern end, is composed of the Boyd Volcanic complex (Lewis and Glen, 1995) which forms a rugged and rocky coastline for ~8 km from Tathra Beach southward. Along this section of rocky coast the −20 m contour is <100–400 m from the shoreline compared with the Tathra embayment where it is >1000 m from the shoreline at its closest point. Northward longshore transport into the Tathra embayment thus impeded in contrast to several other beach-barrier systems along this coastline (Oliver et al., 2020b).
Holocene sea levels along the NSW coast attained present elevations between 7900 and 7500 years BP (Dougherty et al., 2019; Lewis et al., 2013; Sloss et al., 2007). A highstand of sea level has been inferred by Sloss et al. (2007) of +1 to +1.5 m above present persisting through the Mid-Holocene before a fall to present ~2000 years BP. Lewis et al. (2013) re-evaluated the evidence for this highstand pointing to several studies where stable sea level has been observed over the Mid-Holocene such as at Cudgen, NSW (Thom and Roy, 1985). The exact nature of Holocene sea-levels during the Mid- to Late-Holocene is still an open question. Note that ‘cal. yrs. BP’ is used when expressing radiocarbon ages with uncertainty margins, ‘years BP’ when expressing approximate times or intervals derived from radiocarbon dating, and ‘years ago’ when expressing luminescence ages.
The present tidal limit (above this point tidal influence is negligible) of the Bega River is ~11 km upstream of the river mouth (Figure 1) and the estuary channel is dominated by sandy sediments and shoals and fringed by mangroves in the lower reaches. The tidal limit in 1851 was ~4 km further upstream (Brooks and Brierley, 1997) (Figure 1). Several saline lagoons have been partially cut off from the main river channel by accumulations of fluvial sand. The spring tidal range along the NSW coast is ~1.6 m and the neap tidal range is ~0.7 m and have a mixed semi-diurnal pattern (Short, 2007). Tidal amplitude diminishes progressively along the Bega River from the mouth upstream to the tidal limit. During sustained periods of low river flows and quiescent wave conditions, the lower estuary closes to the ocean stabilising water levels in the lower estuary in the absence of tidal exchange. The sandy spit which builds up and seals off the estuary at certain times, often reopens during floods or storms and may persist as either open or closed for several months or years depending on the combination of rainfall and ocean wave patterns.
Deep water wave heights recorded by the Eden wave buoy (~100 m water depth) are from the S to SSE with an average significant wave height (Hsig) of 1.65 m. During storm events, Hsig values commonly peak above 5 m and this has occurred 64 times since measurements from this buoy commenced in 1978 with the highest Hsig value of 8.5 m occurring during the June 2016 storm accompanied by a maximum recorded wave height of 17.7 m. The modern Tathra Beach responds to fluctuations in wave energy oscillating seawards and landwards across a sweep zone of ~70–100 m. The beach is 3.3 km long in an intermediate state fluctuating between Rhythmic Bar and Beach and Transverse Bar and Rip depending on the wave conditions (Short, 2007).
Rainfall in the Bega River catchment ranges from 750 mm per year in the lowland areas to 1200 mm per year in the upper mountainous areas of the catchment (Brooks and Brierley, 1997). The average daily discharge for the Bega River upstream of the Bega township at the Kanoona gauging station is 319 ML/day (3.69 m3/s) for the period 1998–2022, however, this gauge is above the confluence of the Brogo River (Figure 1) so this value would increase further downstream. During floods, this gauge has recorded maximum discharge values >30,000 ML/day (347 m3/s) and maximum values exceeding 100,000 ML/day (1157 m3/s) occurred in June 2016 and March 2021 while maximum values exceeding 200,000 ML/day (2315 m3/s) occurred during the March 2011 floods. Suspended sediment concentrations for the Bega River are not readily available, however, Fryirs and Brierley (2001) have calculated bedload transport capacity for different magnitude discharge events and state that mean annual bedload transport for the tributaries of the Bega River catchment range from ~1800 to 27,000 m3.
Past studies
An extensive programme of drilling of the sedimentary successions in the Bega River valley was carried out by Sundararamayya (1983) for the purposes of determining available groundwater resources (Figures 1 and 2). In all drill holes crossing or adjacent to the main river valley (Figures 1 and 2) fluvial sand and silt 5–15 m thick was encountered representing sediment derived from the Bega River catchment. Beneath this fluvial sand and silt facies estuarine muds and silts rich in shells were present. These estuarine sediments occur upstream as far as the township of Bega and are present in cross-section B-B’ but absent in A-A’ (Figures 1 and 2). The estuarine sediments thicken downstream from ~10 m thick in C-C’ to ~20 m thick in D’D’, E-E’ and F-F’ (Figure 2). Sundararamayya (1983) state that ‘estuarine deposits probably extend half to one kilometre south of section F-F’ but beyond this, Tertiary deposits are thought to be present under a thin veneer of [Quaternary] alluvium’ (p. 19) represented in cross sections G-G’ and H-H’ (see Supplemental Data). No dating has been carried out on the shells from this coring work, however serval other studies and reports provide some chronological control on the Holocene history of the Bega River between the township of Bega and its entrance at the northern end of Tathra Beach.
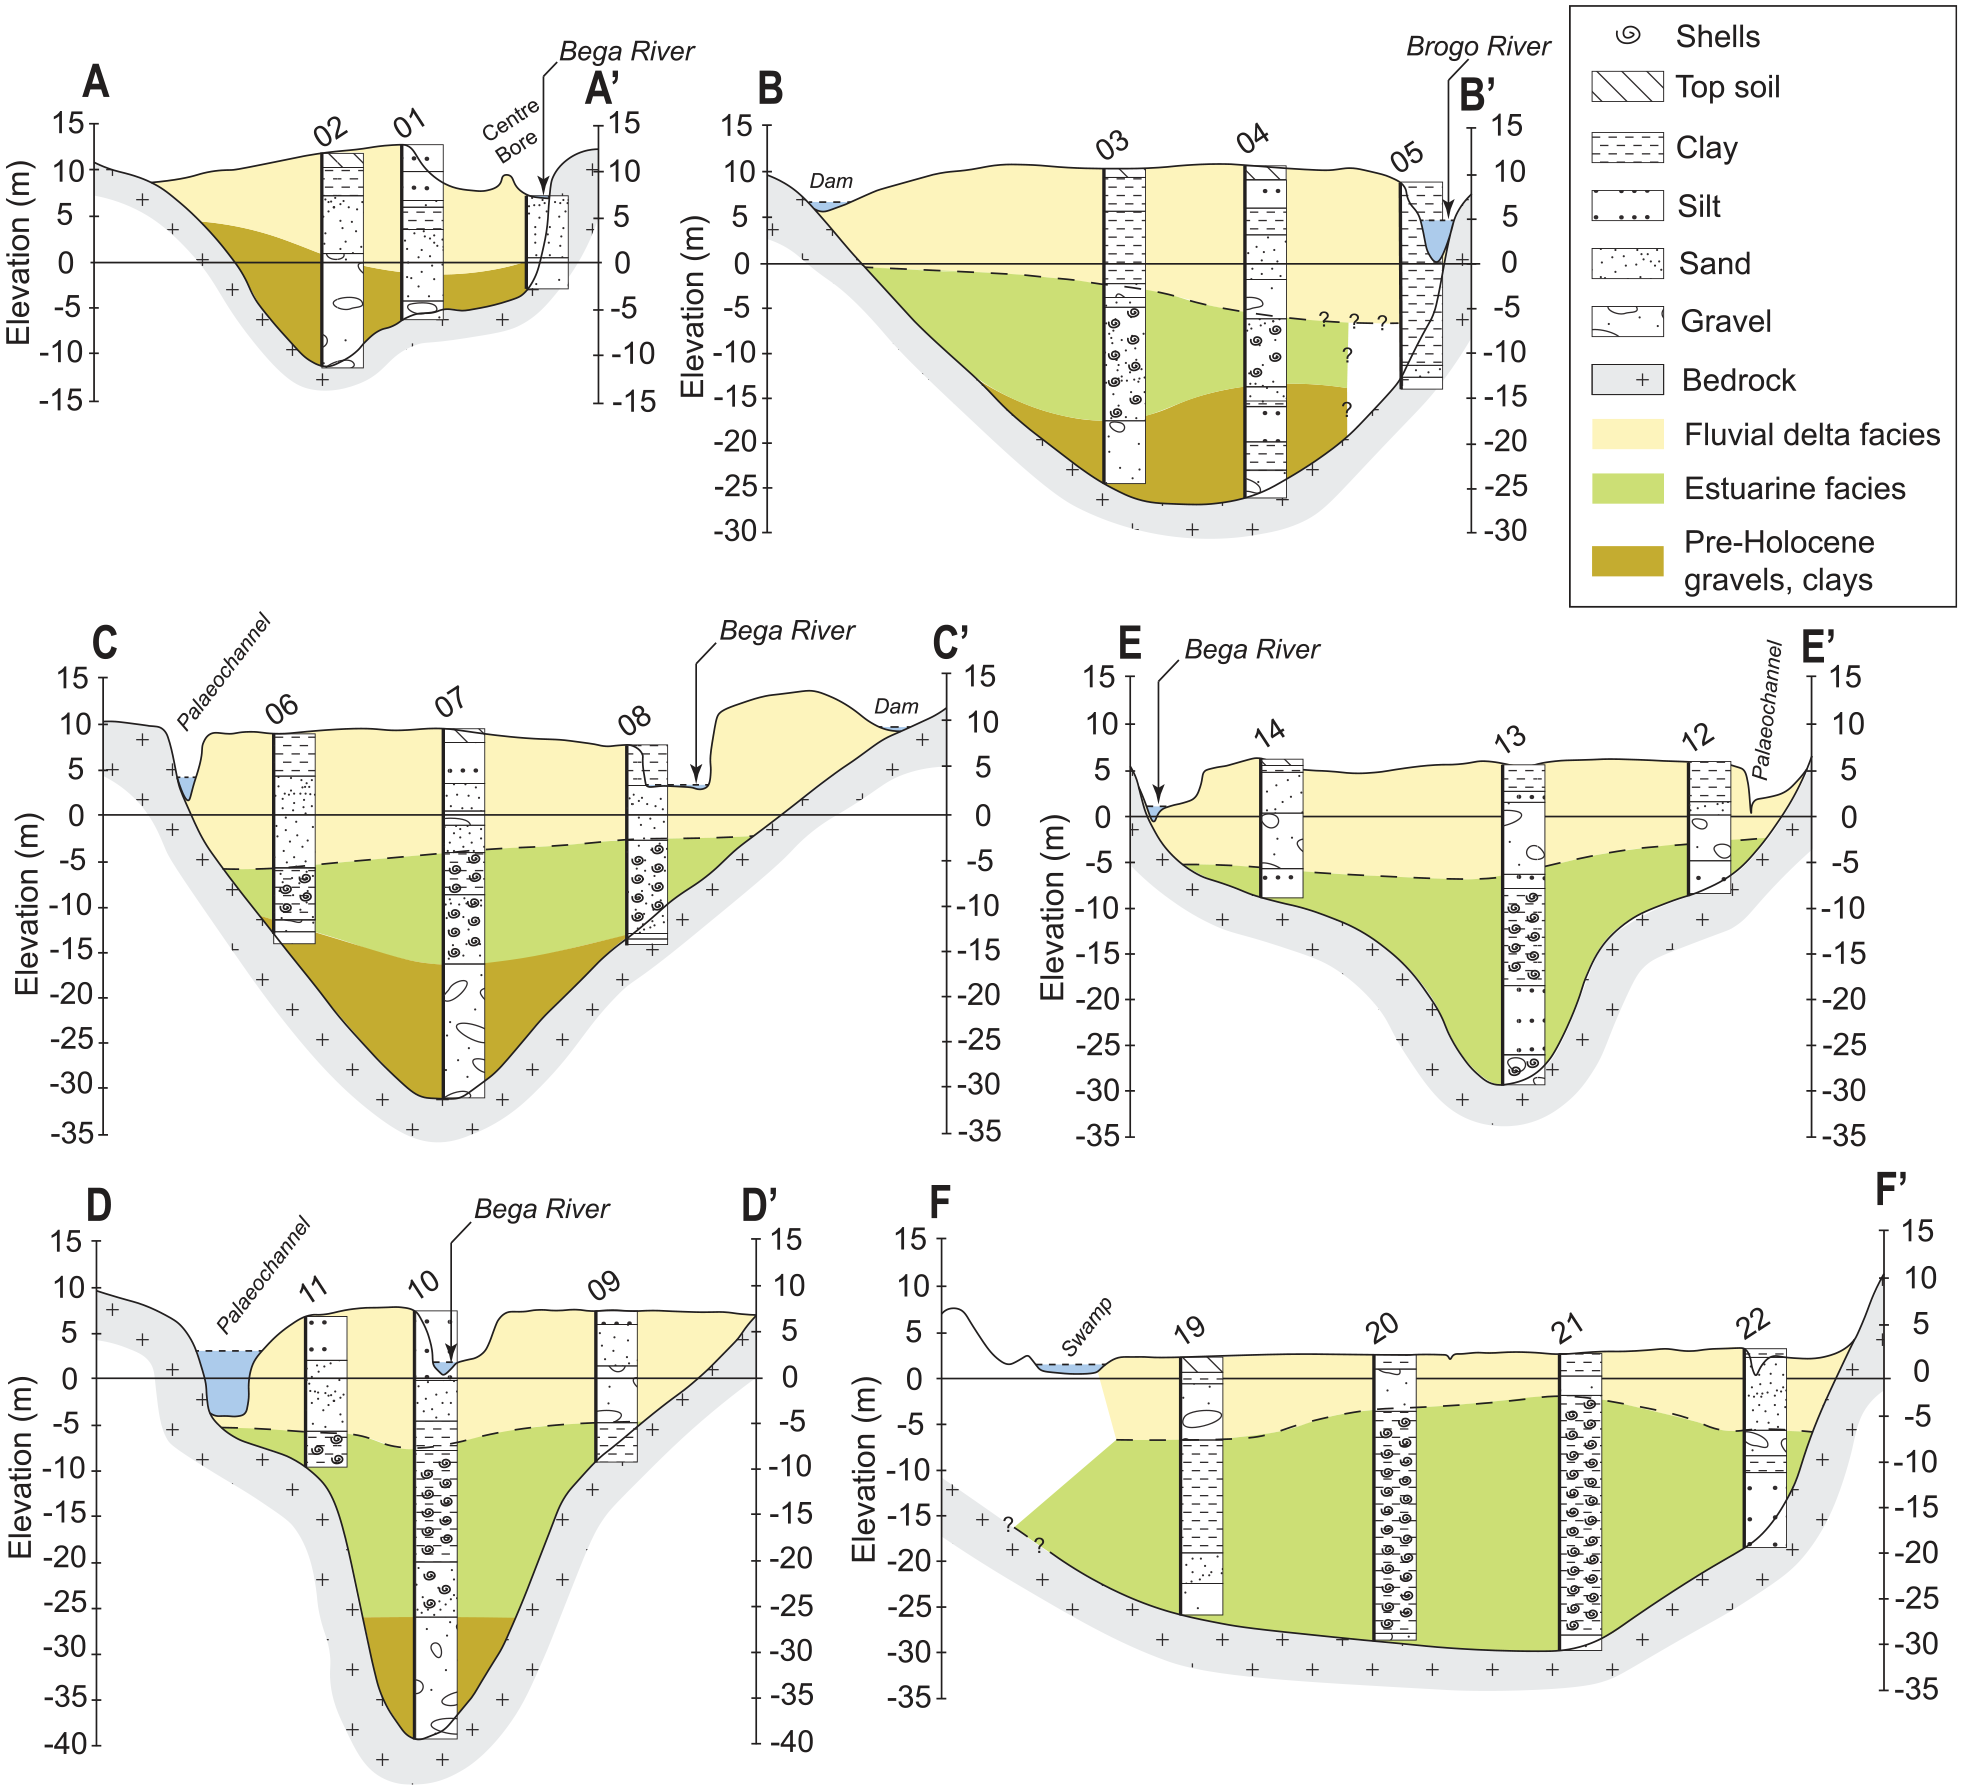
Cross sections redrawn from Sundararamayya (1983) based on drilling transects across the Bega River valley. Locations of transects are shown in Figure 1. Cross sections G and H are available as Supplemental Data. Elevation is in metres with respect to present-day sea level. Facies interpretations are also from Sundararamayya (1983). Channel depths are estimated.
Brooks and Brierley (1997) present a core from the Bega River just west of the township near A-A’ (Figure 1) which demonstrates that fluvial overbank deposits of silt and clay were accumulating at 0.75 mm/year prior to European settlement at 12.5 mm/year after European settlement with the post-European sediments noticeably coarser. The overbank facies overlies fluvial sand corroborated by the cross-section A-A’ of Sundararamayya (1983) (Figure 2). The base of the finer overbank material was dated by AMS radiocarbon to 4720 ± 95 cal. years. BP (Brooks and Brierley, 1997) implying the fluvial sand is older than this date.
A report on the Bega River estuary sediments (Coastal & Marine Geosciences, 2000) presents an important core taken within the bedrock-controlled section of the lower river within the present-day tidal limit shown in Figure 3 (see Figure 1 for core location). The core penetrated 20 m of levee and fluvial channel/ delta facies. Note that a fluvial delta represents a subaqueous and subaerial morphological feature comprising fluvial sand. Below this unit an organic-rich mud was encountered rich in whole and broken estuarine shell species and interpreted as a mud basin facies. This mud basin facies extended down to a depth of approximately −42 m (Figure 3) and was underlain by ~1.5 m of fluvial gravel. Radiocarbon ages from a total of seven samples of shell, charcoal and wood from this core were dated (Table 1). The sequence of ages generally youngs up core although the sample from the lowermost facies is stated as anomalously young due to contamination during drilling (Coastal & Marine Geosciences, 2000). These radiocarbon ages indicate that the estuarine mud basin facies was deposited from ~9000 to 4000 years BP and the overlying fluvial delta and channel facies was dated from ~4000 to 2000 years BP. This suggests that the estuarine deposits inland of this location in the cross sections of Sundararamayya (1983) (Figure 2) are older than ~4000 years BP and that the fluvial delta facies which overlies these estuarine deposits was prograding down the palaeo valley reaching the location of the core (Figures 1 and 3) by ~4000 years BP. After this time, fluvial sand continued to aggrade in the lower valley and the fluvial delta is likely to have reached the coast soon after ~4000 years ago completing the infill of the estuary and its transition from an immature drowned river valley system to a mature riverine estuary. This pattern of estuarine infill accords with the generalised model proposed by Roy (1984b) for drowned river valley estuaries where deep mud basins are infilled by fluvial deltas which prograde over the tidal delta as they reach the coast. Overbank floodplain deposits then accumulate overlying the fluvial delta as the upper reaches of the river transition to terrestrial environments.
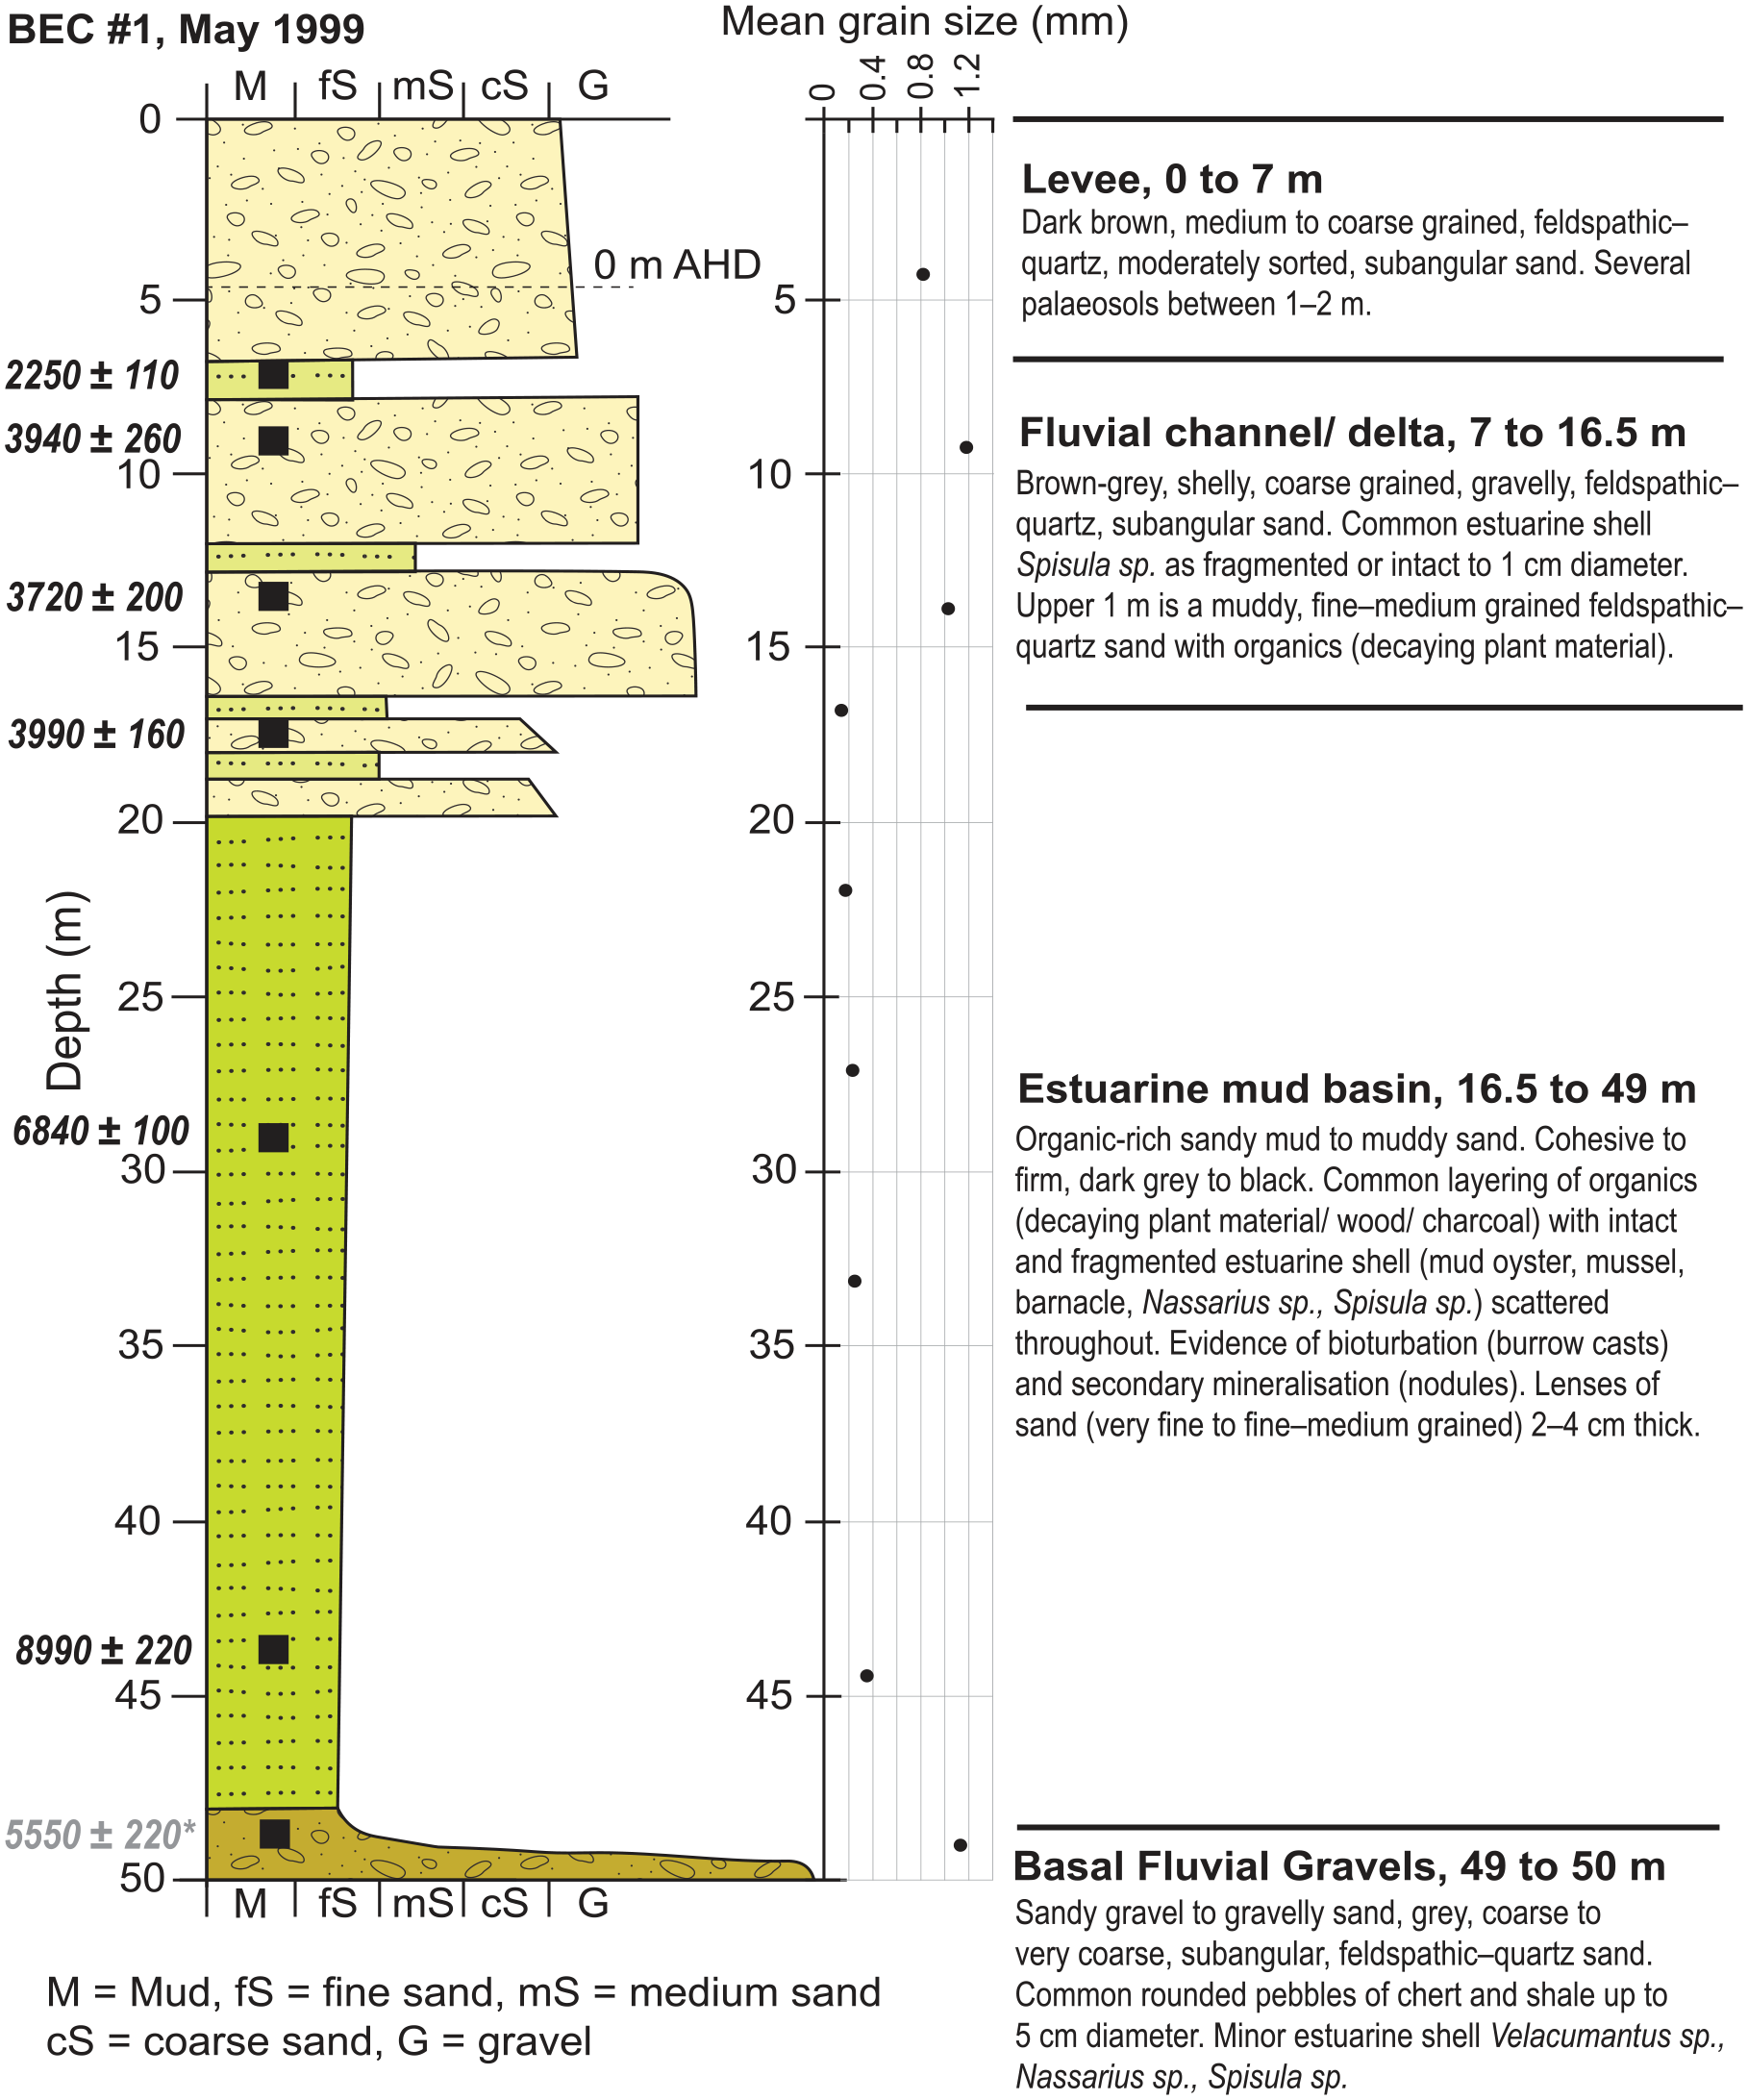
Log of drill hole located adjacent to the Bega River estuary (see Figure 1 for location) completed in 1999 redrawn from Coastal & Marine Geosciences (2000) report. Radiocarbon ages are in bold italic are expressed as cal. years. BP and were completed by University of Waikato Radiocarbon Dating Laboratory (for details see Table 1).
Radiocarbon samples from core shown in Figure 3 drilled by Coastal & Marine Geosciences (2000) recalibrated using Calib 8.1.0. Radiocarbon dating was completed by the University of Waikato Laboratory in New Zealand.
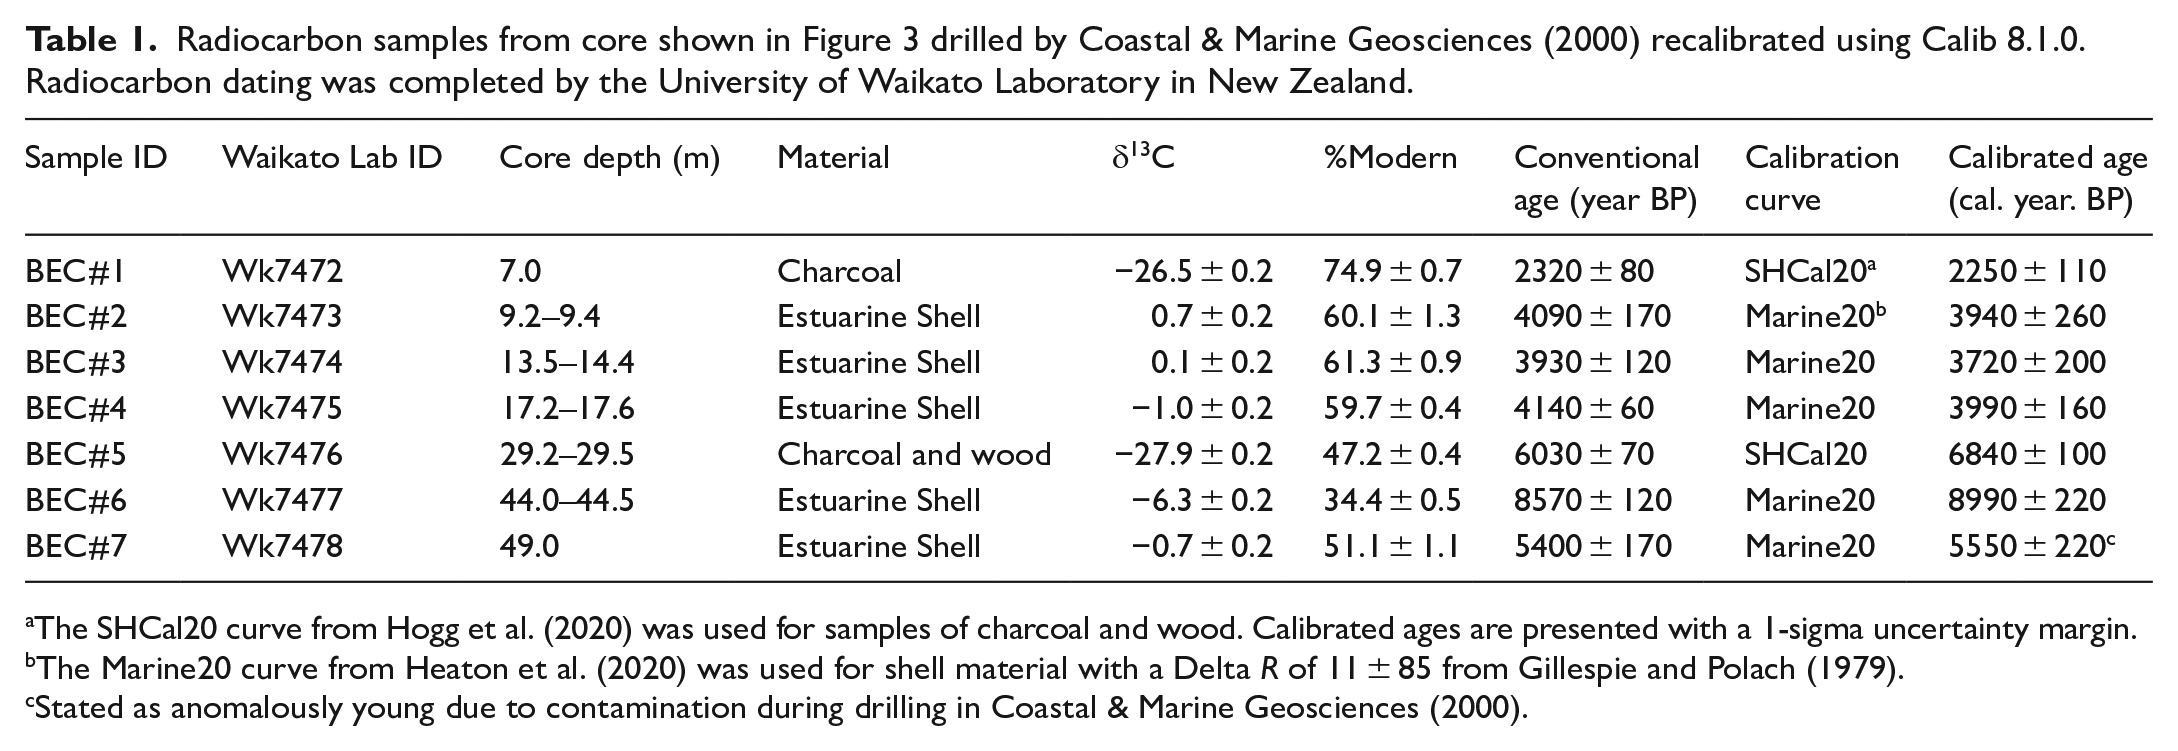
The SHCal20 curve from Hogg et al. (2020) was used for samples of charcoal and wood. Calibrated ages are presented with a 1-sigma uncertainty margin.
The Marine20 curve from Heaton et al. (2020) was used for shell material with a Delta R of 11 ± 85 from Gillespie and Polach (1979).
Stated as anomalously young due to contamination during drilling in Coastal & Marine Geosciences (2000).
Studies of the Tathra Beach and barrier system are limited. A Public Works Department (PWD, 1980) report collated existing data and collected additional field data, especially sediment samples from the nearshore zone. This is summarised in Figure 4 where fluvial sand from the Bega River has influenced the distribution of nearshore sediment facies. In particular, the boundary between the inner nearshore facies and the outer nearshore facies has been shifted seaward adjacent to the Bega River mouth (Figure 4) and at one point the inner nearshore facies transitions to the inner shelf sand. The nearshore (inner and outer) sand have a pronounced fluvial influence and comprise both angular feldspar and lithic grains mixed with the more typical ‘marine’ sand which is mature quartz-rich and sub-rounded sourced from the continental shelf (Oliver et al., 2020b). The sediments of the Tathra Beach barrier are also more angular and feldspathic than is typical for coastal prograded barrier systems of southern NSW which are typically dominated by sub-rounded lightly iron-stained quartz.
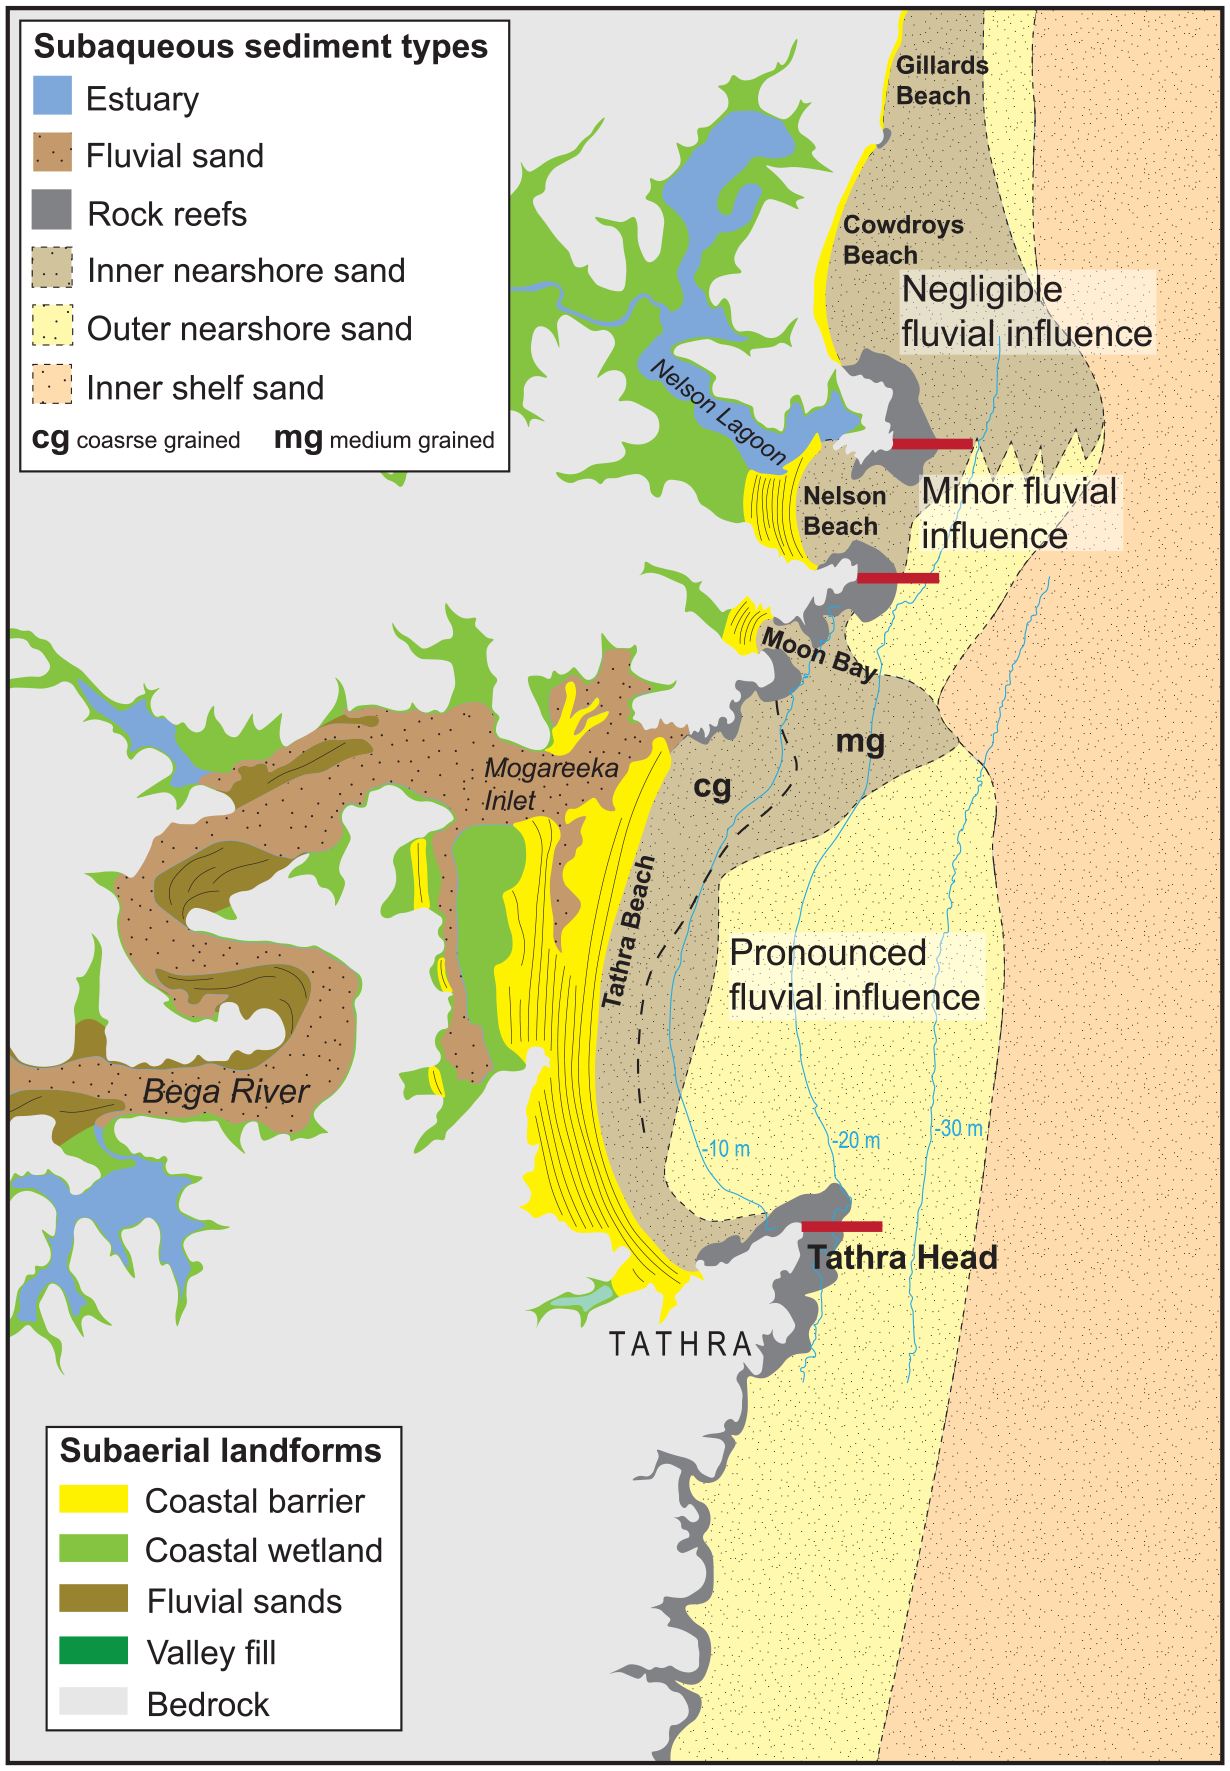
Sediment types in the Tathra region based on Public Works Department (1980) report. Note the red lines located at major headlands indicate the broad boundaries of influence of fluvial sediment from the Bega River on the composition of the nearshore (inner and outer) sand.
The influence of fluvial sand diminishes to the north of the Tathra embayment and is only a minor component of the Nelson Bay beach sand and largely absent from the sand comprising Cowdroys Beach (Figure 4). The addition of fluvial sand to the embayment is also reflected in the topography of the seabed with a distinctly convex profile out to approximately −12 m (Figure 5) indicating the accretion of a lobe of fluvial sand in this area. This profile contrasts with the central area of the beach where a more typical concave profile is evident.
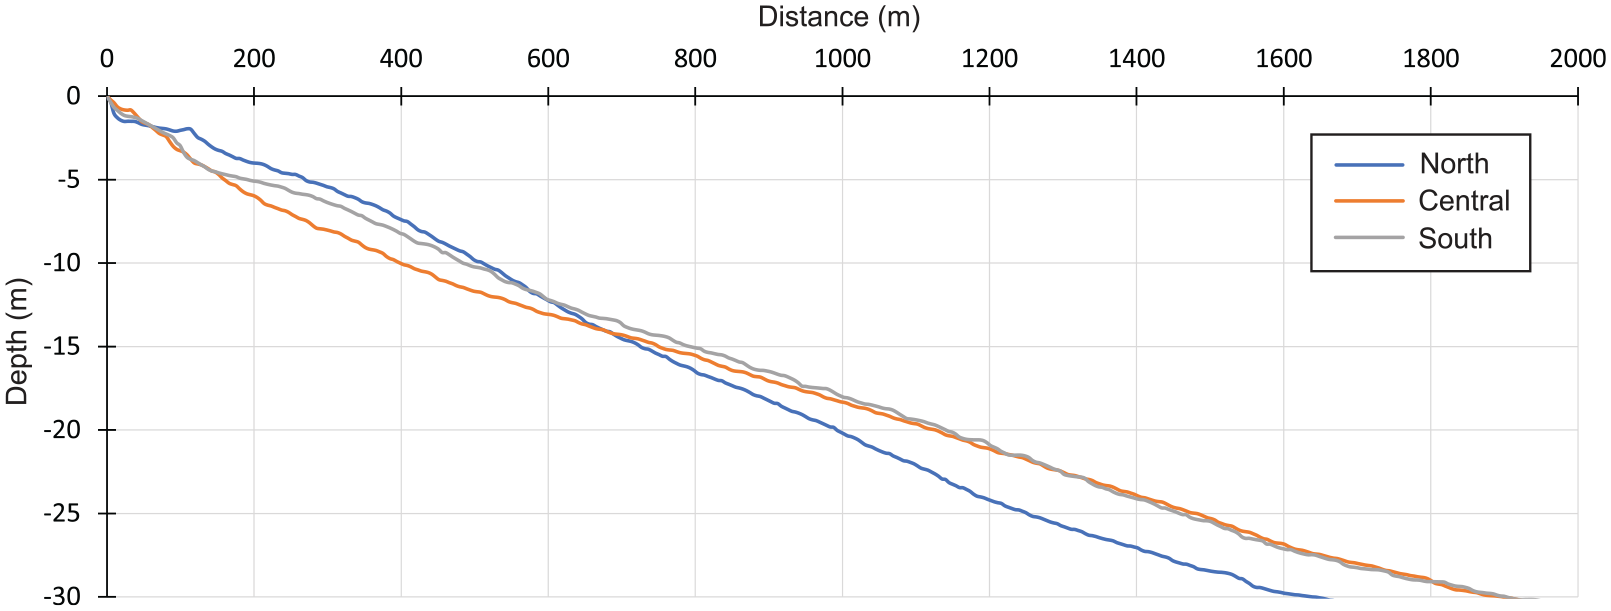
Bathymetric profiles of the shoreface seaward of Tathra Beach in the north (blue) central (orange) and south (grey). See Figure 6a for profile locations.
Methods
Spatial data acquisition and processing
Airborne terrestrial and marine Lidar datasets processed to 1 m × 1 m and 5 m × 5 m grids respectively were downloaded from the ‘Elevation and Depth – Foundation Spatial Data (ELVIS)’ Portal (https://elevation.fsdf.org.au/) as individual tiles. These tiles were mosaiced together to form continuous terrestrial and marine Digital Elevation Models (DEMs) which were used for the interpretation of subaerial and subaqueous landforms. These DEMs also enabled the drawing of topographic and bathymetric profiles across the foredune ridge sequence and seafloor and the calculation of barrier volumes as they capture the barrier morphology and extent. The airborne terrestrial Lidar dataset was captured in March 2013 and has a reported vertical uncertainty of ±0.3 m and a horizontal uncertainty of 0.8 m (95% confidence interval). Airborne marine Lidar was captured in 2018 and has an overall horizontal uncertainty of ±1.0 m and a vertical precision to the standard of International Hydrographic Order (IHO) 1B. Both terrestrial and marine DEMs were referenced to the projected coordinate system MGA GDA 94 Zone 55 and to the Australian Height Datum (AHD) where 0 m AHD approximates mean sea level (MSL) around Australia. In this region of NSW there is less than 10 cm offset between MSL as recorded by local tide gauges and 0 m AHD. For each DEM a hillshade model was generated using ArcGIS 10.7.1 and a colour stretch was applied to the DEM which was overlain transparently on the hillshade.
OSL dating
Samples for OSL dating were collected from prominent features of the Tathra Beach and Nelson Beach barrier system in 2021 informed by the high-resolution DEM derived from airborne Lidar. Sixteen samples from Tathra Beach and five samples from Nelson Beach were extracted from the base of an auger hole at depths of 0.95–1.1 m (Table 2) using a stainless-steel sampling barrel. This sampling barrel was sub-sampled with a smaller diameter light-proof sample tube which was capped, taped, and labelled. Under subdued red-light conditions, sample tubes were opened and the outer 20–25 mm of the sample from each end of the tube was set aside and used for measurement of dosimetry and water content. The environmental dose rate was determined using the DRAC programme of Durcan et al. (2015). A sample of the light-exposed sediments from the ends of the sample tube was sent to Intertek Genalysis where it was crushed and concentrations of potassium, and uranium and thorium, were quantified by inductively coupled plasma optical emission spectrometry and inductively coupled plasma mass spectrometry, respectively. These values were converted to a dose rate by applying the conversion factors of Guérin et al. (2011). The attenuation factor used for beta ray was based on Mejdahl (1979). An internal-dose-rate contribution of 0.03 ± 0.01 Gy/kyr was assumed based on measurements made on Australian quartz (Bowler et al., 2003). The cosmic contribution to the overall dose rate was estimated based on the method of Prescott and Hutton (1994). Past changes in moisture content are unknown, so an uncertainty margin of 5% was applied to the measured moisture content values.
OSL sampling locations, depths and results relevant to the calculation of environmental dose rate.
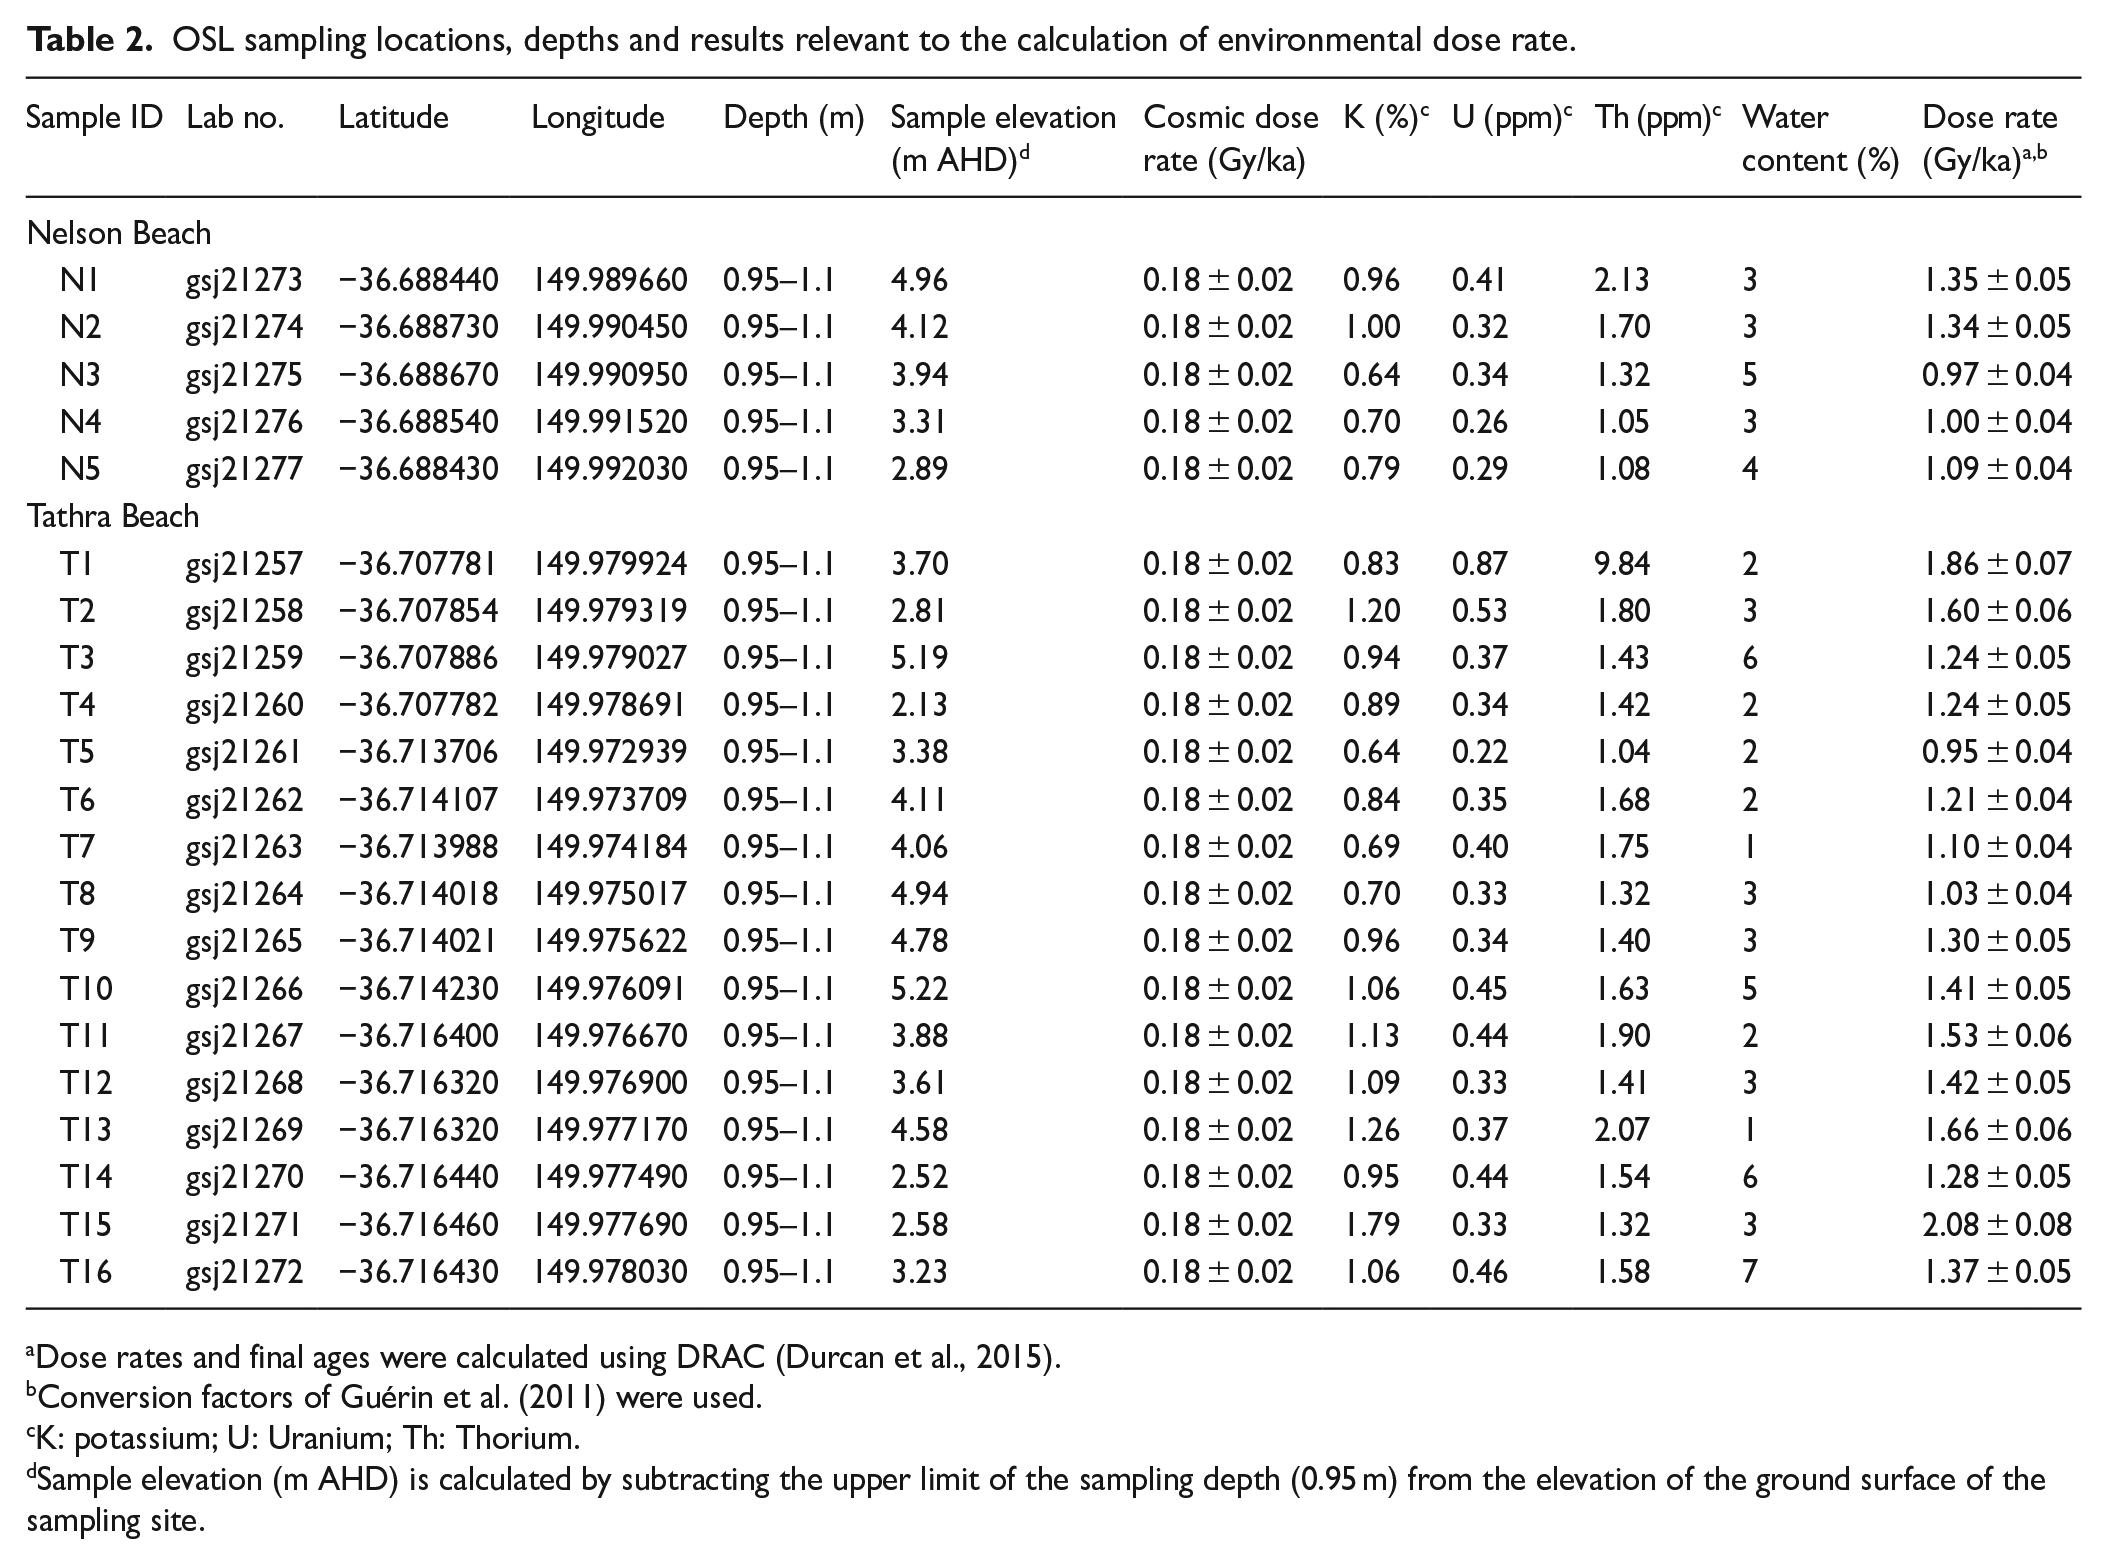
Dose rates and final ages were calculated using DRAC (Durcan et al., 2015).
Conversion factors of Guérin et al. (2011) were used.
K: potassium; U: Uranium; Th: Thorium.
Sample elevation (m AHD) is calculated by subtracting the upper limit of the sampling depth (0.95 m) from the elevation of the ground surface of the sampling site.
Preparation and measurement of light-safe quartz grains from each sample for OSL dating were completed at the Geological Survey of Japan as reported in Oliver et al. (2020, 2022). The single-aliquot regenerative-dose (SAR) protocol was employed to determine the equivalent dose using the OSL signal response to a test dose to monitor and correct for sensitivity changes (Murray and Wintle, 2000). Sample testing resulted in the adoption of a preheat/cutheat temperature combination of 180°C/ 160°C for the OSL measurements. Twenty replicates per sample were measured. Data from each aliquot was rejected if recycling ratios were beyond 1.0 ± 0.1. The final equivalent dose value was determined by applying the Central Age Model Galbraith et al. (1999) to accepted aliquots for each individual sample. The equivalent dose was then divided by each sample’s environmental dose rate to obtain OSL ages. OSL ages older than 100 years were rounded to the nearest 10 years, and those younger than 100 years were reported to the nearest year and are reported as ‘years ago’ with respect to sample collection in 2021 CE.
Results and interpretation
Coastal barrier morphology and chronology
The Tathra Beach and Nelson Beach barrier systems have a morphology typical of prograded barriers of this region where a sequence of foredune ridges representing past shoreline positions is preserved infilling irregular bedrock embayments and impounding estuaries and/or small saline lagoons and creeks. The foredune ridges are composed of swash-accumulated beach sand capped with wind-blown deposits of aeolian sand and are naturally vegetated with tall established forest transitioning in a seaward direction to lower coastal banksia forest to coastal scrub and then low ground cover dominated by Spinifex sericeus.
The Nelson Beach prograded barrier system comprises ~10 ridges which increase in length from ~270 m for the landwardmost to ~500 m for the seaward most. The barrier system partially infills a small (620 m wide) embayment (Figure 6b). At the northern end of the barrier is a tidal inlet connecting to Nelson lagoon. The landwardmost ridge is dated to 6000 ± 220 years while the next ridge seawards is 2430 ± 90 years representing a substantial time period (>3500 years) when no progradation occurred (Figure 6b). The ridges then young steadily seawards from 2430 through to near present indicating shoreline progradation at a rate of 0.06 m/year. The elevation of the crest of the landwardmost ridge dated ~6000 years is ~6.2 m AHD and there is a steady fall in elevation in a seaward direction such that the ridge dated 850 ± 40 years has a crest elevation of ~5.1 m AHD.
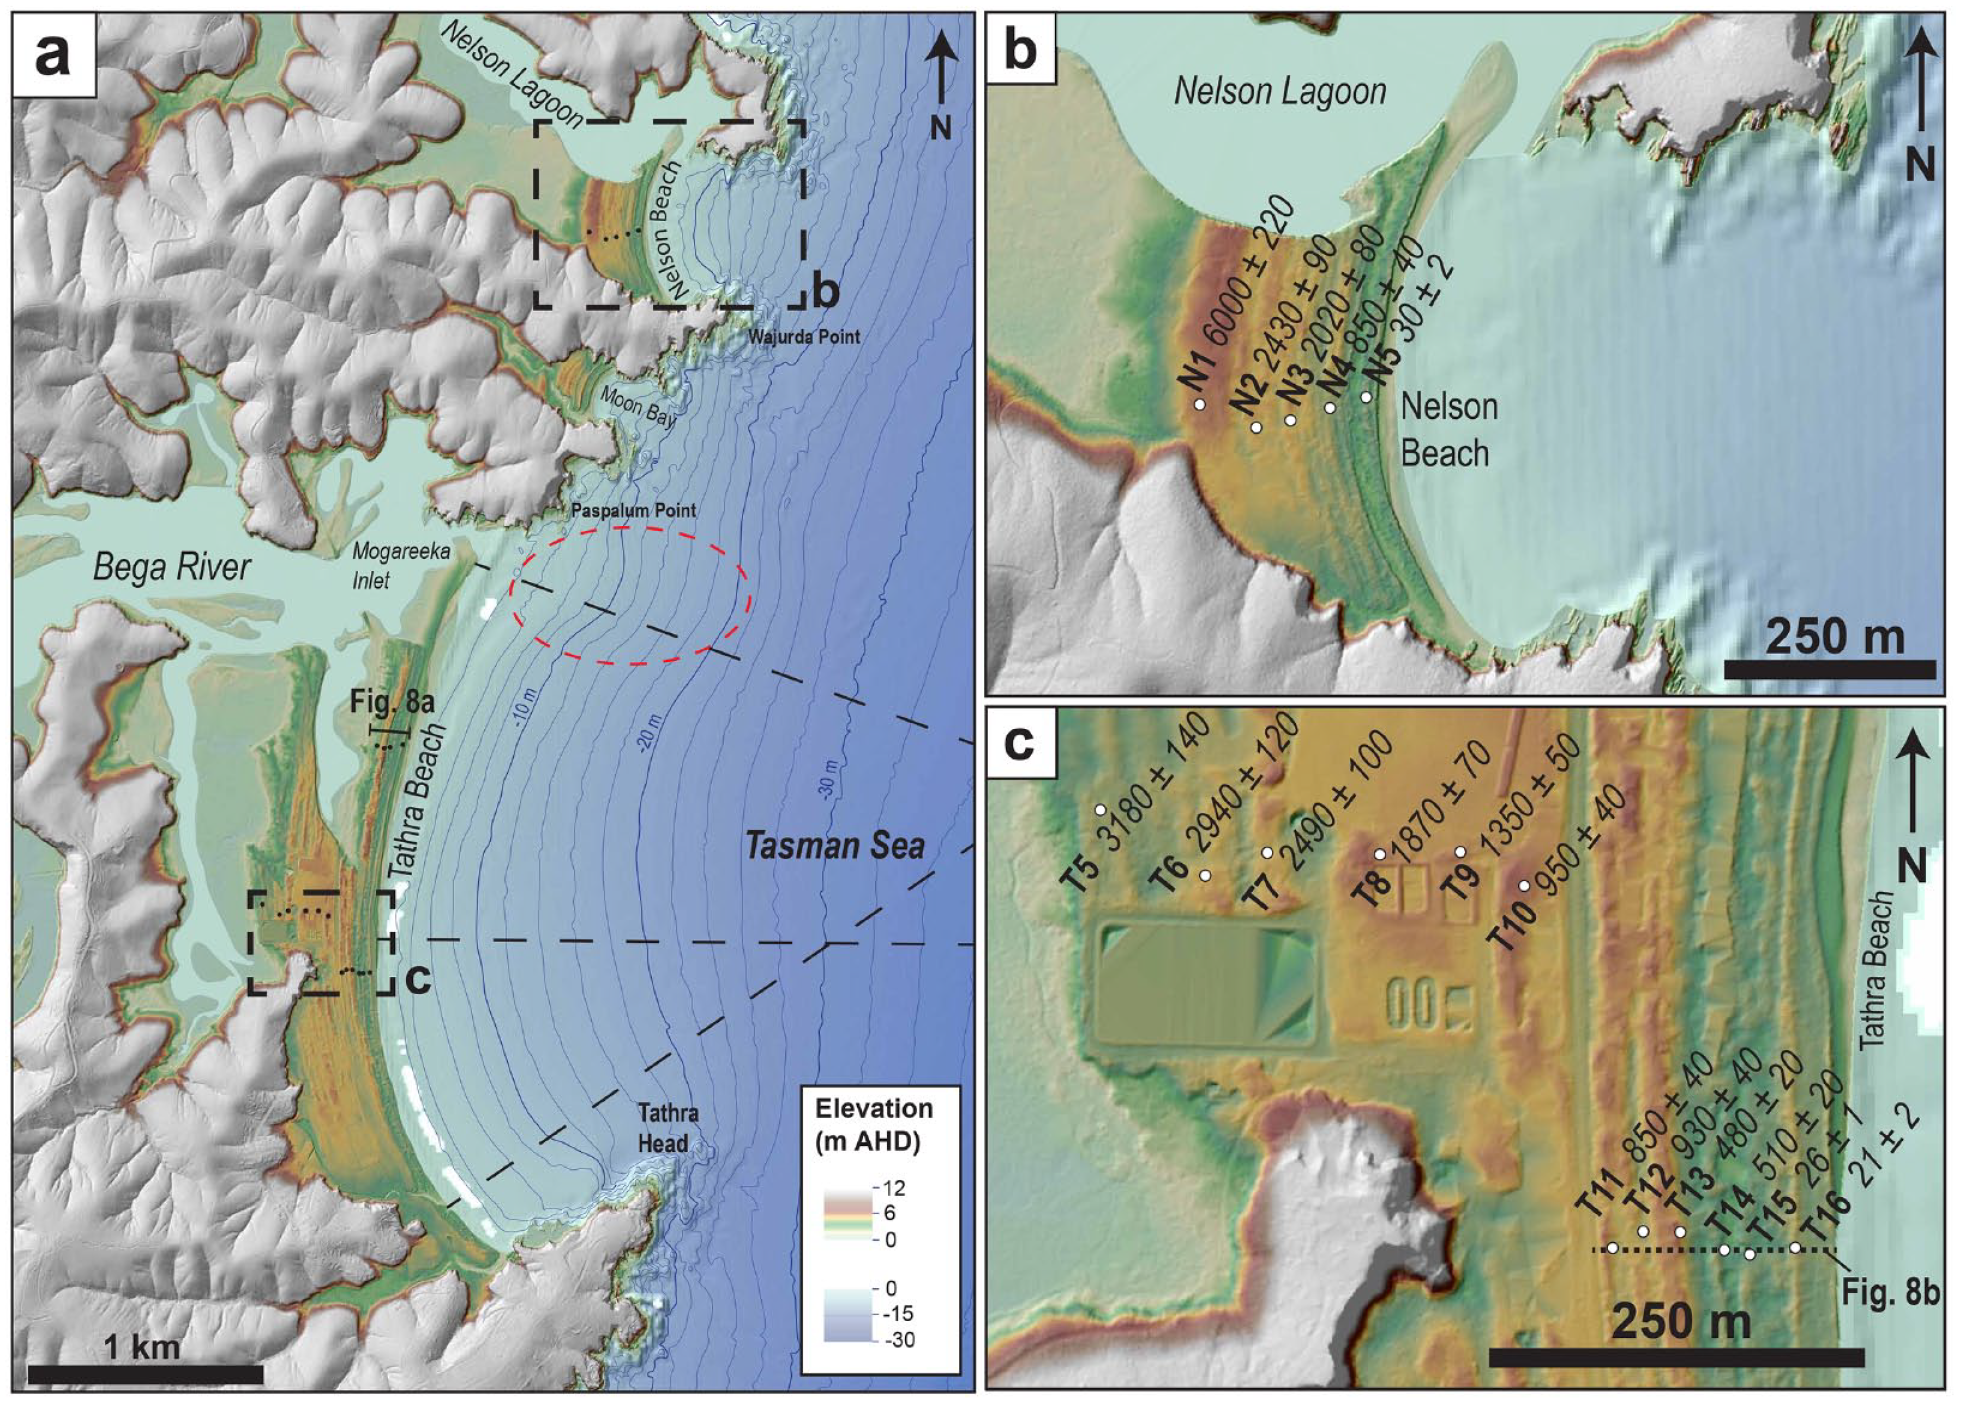
High-resolution DEM derived from airborne marine and terrestrial Lidar of the (a) Tathra and Nelson barrier systems, (b) the Nelson prograded barrier system and (c) a section of the Tathra prograded barrier system. OSL ages are notated in their sampling positions in (b and c) with sample codes in reference to Tables 2 and 3. The dotted red oval on (a) indicates a noticeably shallow area corresponding to inner nearshore sand of fluvial origin in Figure 4 and black dotted lines indicate the position of bathymetric profiles in Figure 5.
OSL dating results from Nelson and Tathra Beach, NSW, Australia.
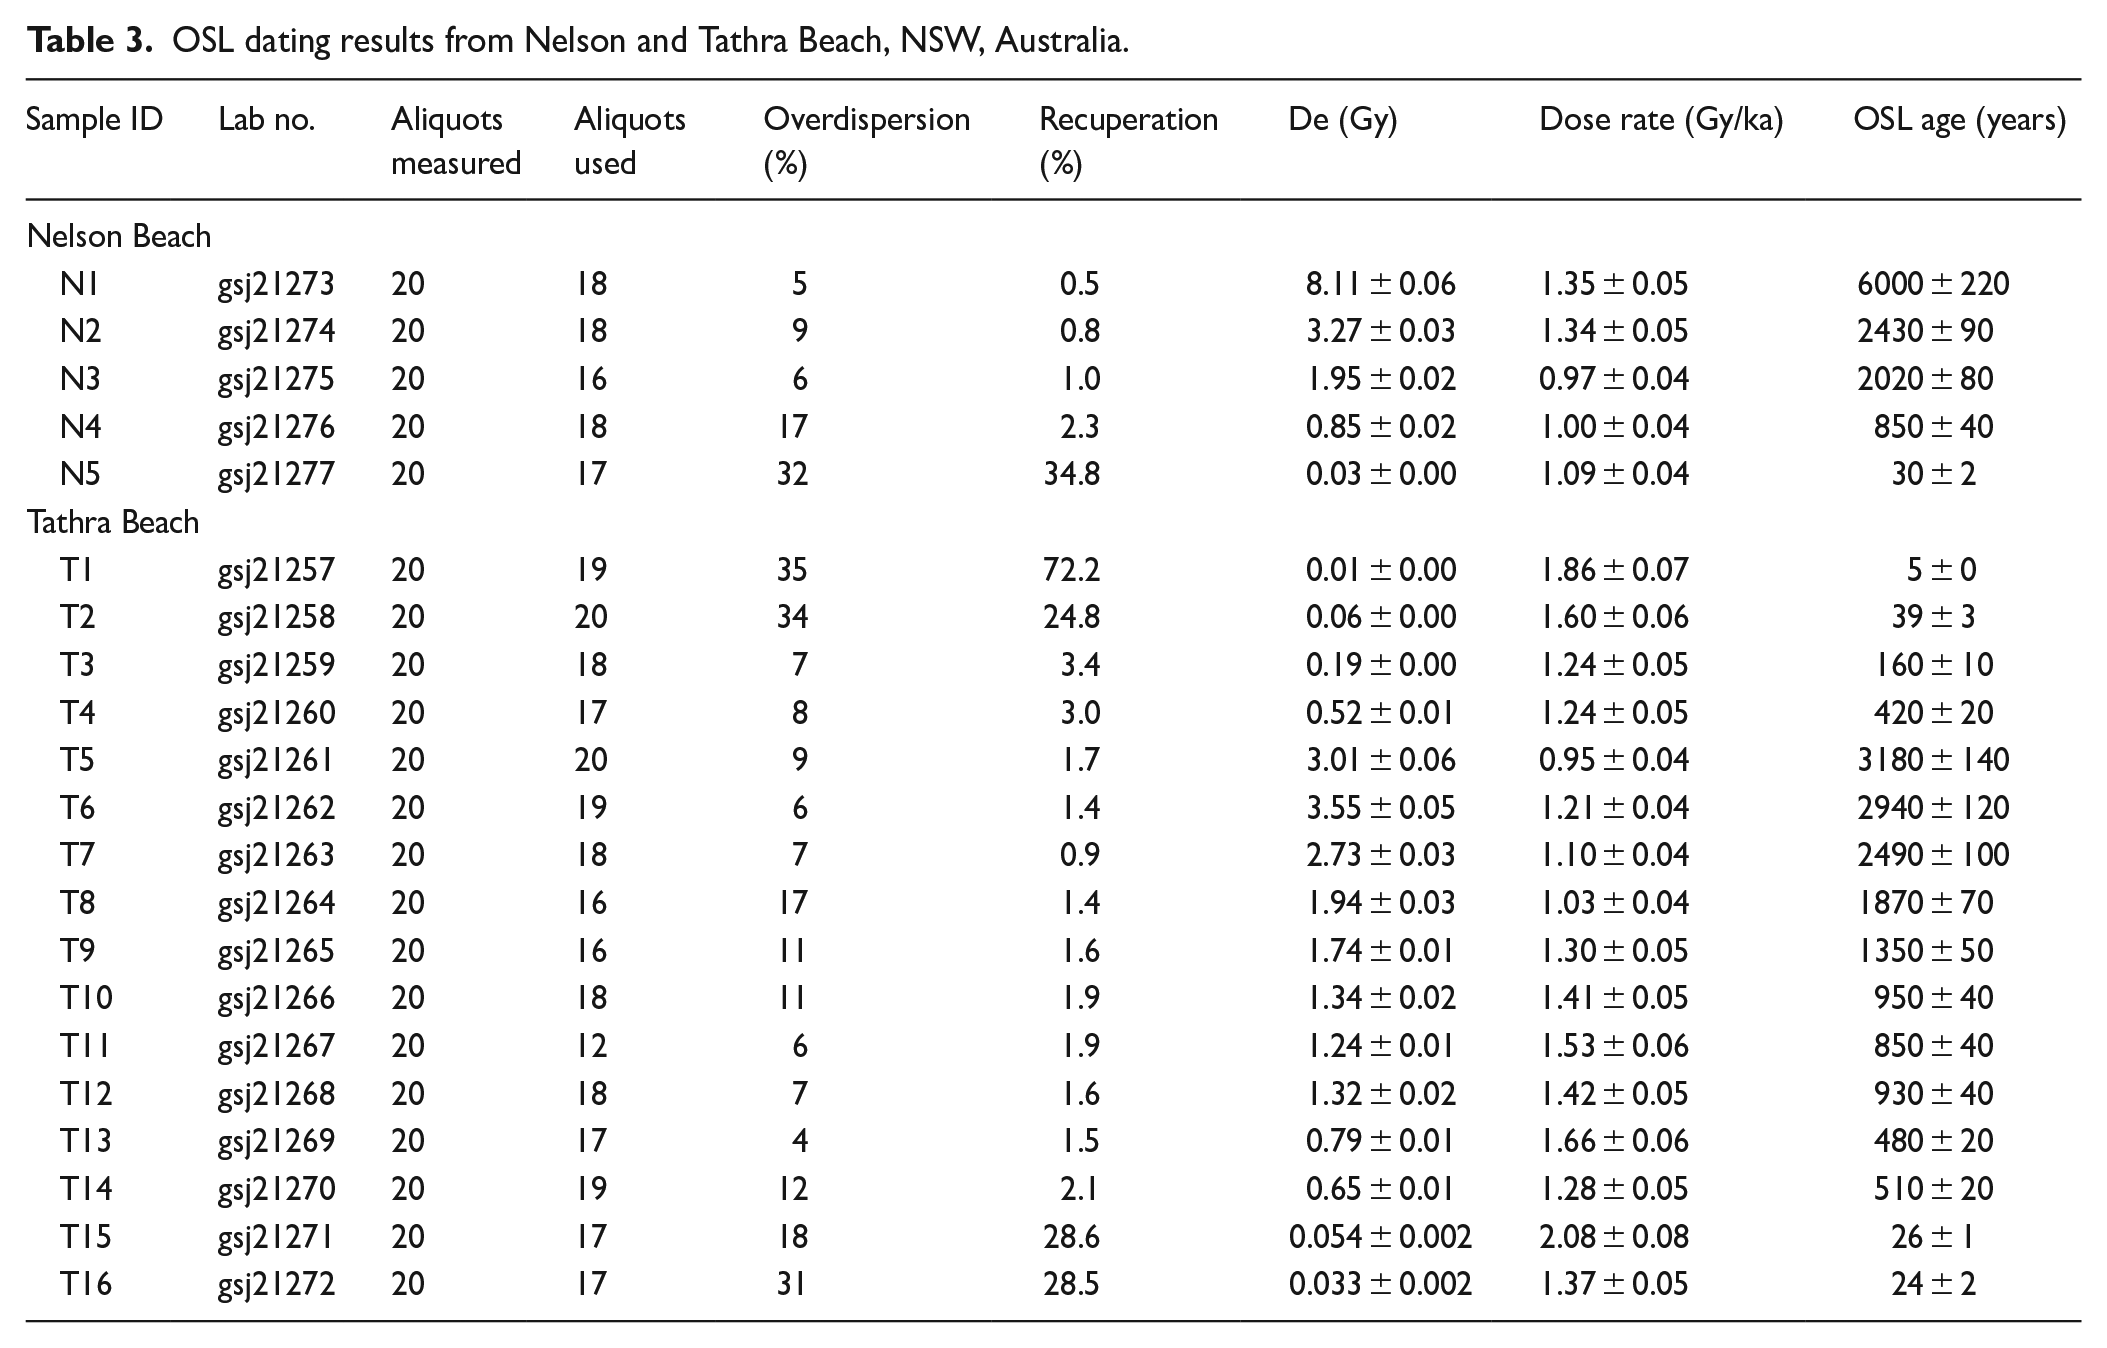
The Tathra Beach prograded barrier comprises ~17 ridges at its widest point which infill an irregular embayment with a promontory of bedrock bisecting the older ridges (Figure 6a). The current shoreline is 2.8 km long, not including the unvegetated ephemeral spit partially impounding the Bega River estuary mouth. The ridge crests are between 4.5 and 6.0 m AHD and the ridges, once exceeding the central dividing headland, recurve in an orientation similar to the present shoreline. The oldest ridge is also the most landward in the sequence and is dated 3180 ± 140 years and the ridges young steadily seaward towards the present shoreline (Figure 6c). The rate of progradation since ~3200 years is 0.15 m/year and a roughly linear trend of progradation is evident when ages are plotted against percentage barrier width (Figure 7). There is a notable erosional scarp along the northern boundary of many of the ridges which indicates a diversion of the Bega River estuary entrance to the south and closer to the centre of the embayment. A new spit has developed in the last 500 years (Figures 6a and 8a) redirecting the estuary entrance back to the northern end of the embayment such that the ridges deposited since this time are of similar length to the older counterparts further inland. Several minor age reversals are evident in the younger (<1000 years) ridges of the Tathra Beach barrier (Figures 7 and 8b) and several of the most seaward foredune ridges with lower crest elevations (4–5 m AHD) have been deposited since the notable 1974 and 1978 storms (Figures 6–8) (see McLean and Shen, 2006; PWD, 1980).
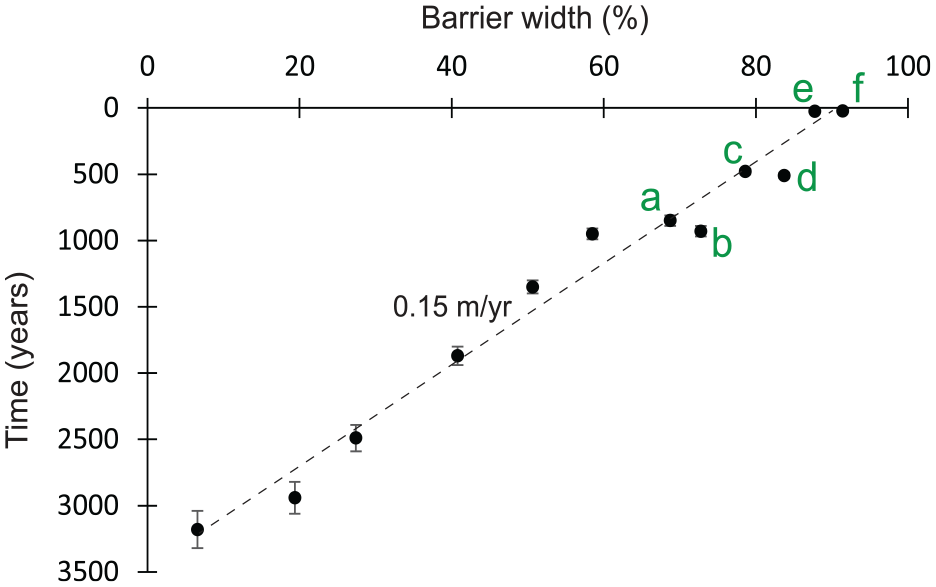
OSL ages plotted with respect to barrier width as a percentage noting that barrier deposition commences at ~3180 years ago and continues at a steady rate of 0.15 m/year through to present. Green letters refer to ages notated in Figure 8b.
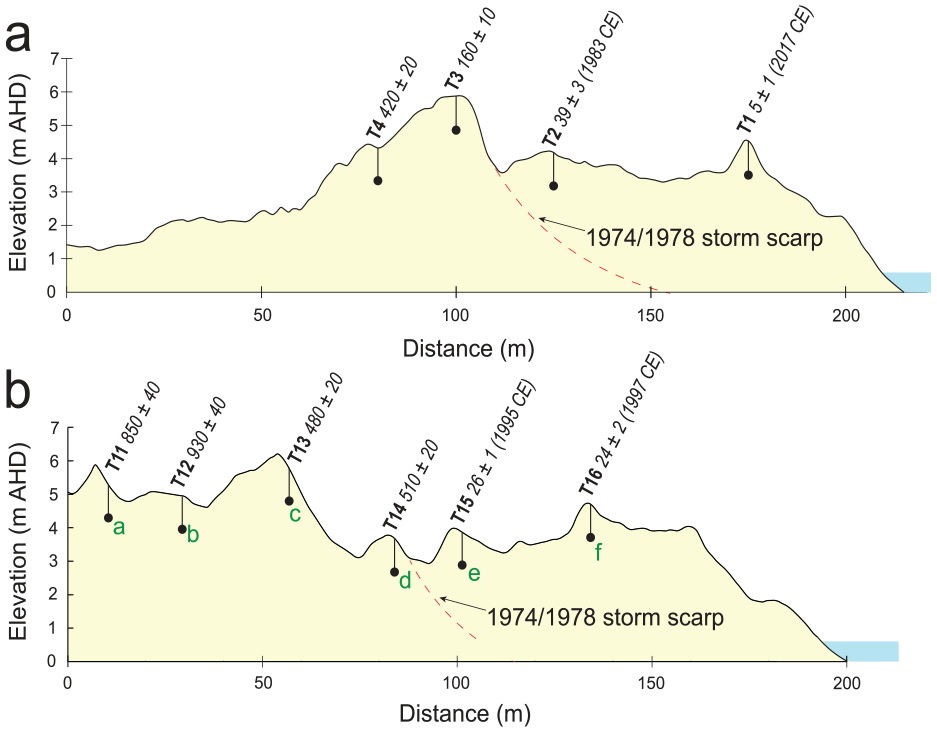
Topographic profiles of the seaward ~200 m of Tathra beach in (a) the northern spit enclosing the Bega River estuary, and (b) the centre of the barrier. OSL ages are notated in their sampling position and depth with sample codes in reference to Table 3. The 1974–78 storm scape is positioned with reference to the OSL dating and inspection of the high resolution DEM in Figure 4. Green letters in (b) refer to ages plotted in Figure 7.
Tathra Beach and barrier volumes
The overall rate of barrier accretion over the Mid- to Late-Holocene is 0.55 m3/m/year (total barrier volume above MSL of 4,914,840 m3 divided by 3180 years and 2800 m for the current shoreline). The average ridge ‘lifetime’ or period of activity before a ridge is stranded behind a new foredune, is ~190 years. On more recent timescales, approximately 745,000 m3 of sand (not including the ephemeral entrance spit) has been deposited between the historic storms of the 1970s–2013 (year of terrestrial Lidar capture), which for the current shoreline length of 2.8 km, equates to 7.6 m3/m/year of sand deposited above MSL. However, photogrammetry from historical air photos reveals that from 1944 to 1969 there was substantial accretion of the beach >500,000 m3 until the storms during the mid to late 1970s removed >1,000,000 m3 of sand (PWD, 1980). Thus, the deposition of ~745,000 m3 since the 1970s actually represents a return to pre-accretion volumes of the late 1940s and 1950s. The ephemeral entrance spit alone contains >100,000 m3 of sand (above MSL). These total beach volumes indicate changes per metre of beach in the order of 180–350 m3/m or 5–20 m3/m/year occurring over several decades.
Discussion
Estuarine deposition <8000 years ago
This study presents evidence of estuarine activity occurring prior to 8000 years ago in the lower Bega River estuary where mud basin facies with estuarine shells was accumulating. The estuarine shell dated 8990 ± 220 cal. years. BP (Figure 3, Table 1) at a depth of −40 m below present MSL represents estuarine deposition occurring when sea levels were -10 m below present according to the sea-level curve of Sloss et al. (2007). The base of the estuarine facies in Figure 2 progressively shallows inland from -30 m upstream of the core location (see Figure 1), to −15 m near the Bega township. With a sea level of −10 m at 9000 years, these paleo valley areas are already flooded and have transitioned from fluvial to estuarine depositional environments. Continued sea-level rise to present, which was attained between 7500 and 8000 years ago, would have progressively expanded the estuarine basin laterally and inland as indicated by the cross sections of the river valley (Figure 2). By 8000 years ago, a large expanse of mud basin environments is likely to have existed (Figure 9a). During this final phase of sea-level rise to present, the narrow bedrock-restricted portion of the lower Bega River valley may have had quite energetic tidal currents and possibly some tidal amplification due to the slight funnel shape of the valley in planform. However, there is no evidence of a flood-tide delta sand sheet in the core recovered from this lower section of the river (Figure 3) which suggests that flood and ebb tide deltas were probably restricted to the region closer to the present-day estuary entrance (Figure 9a).
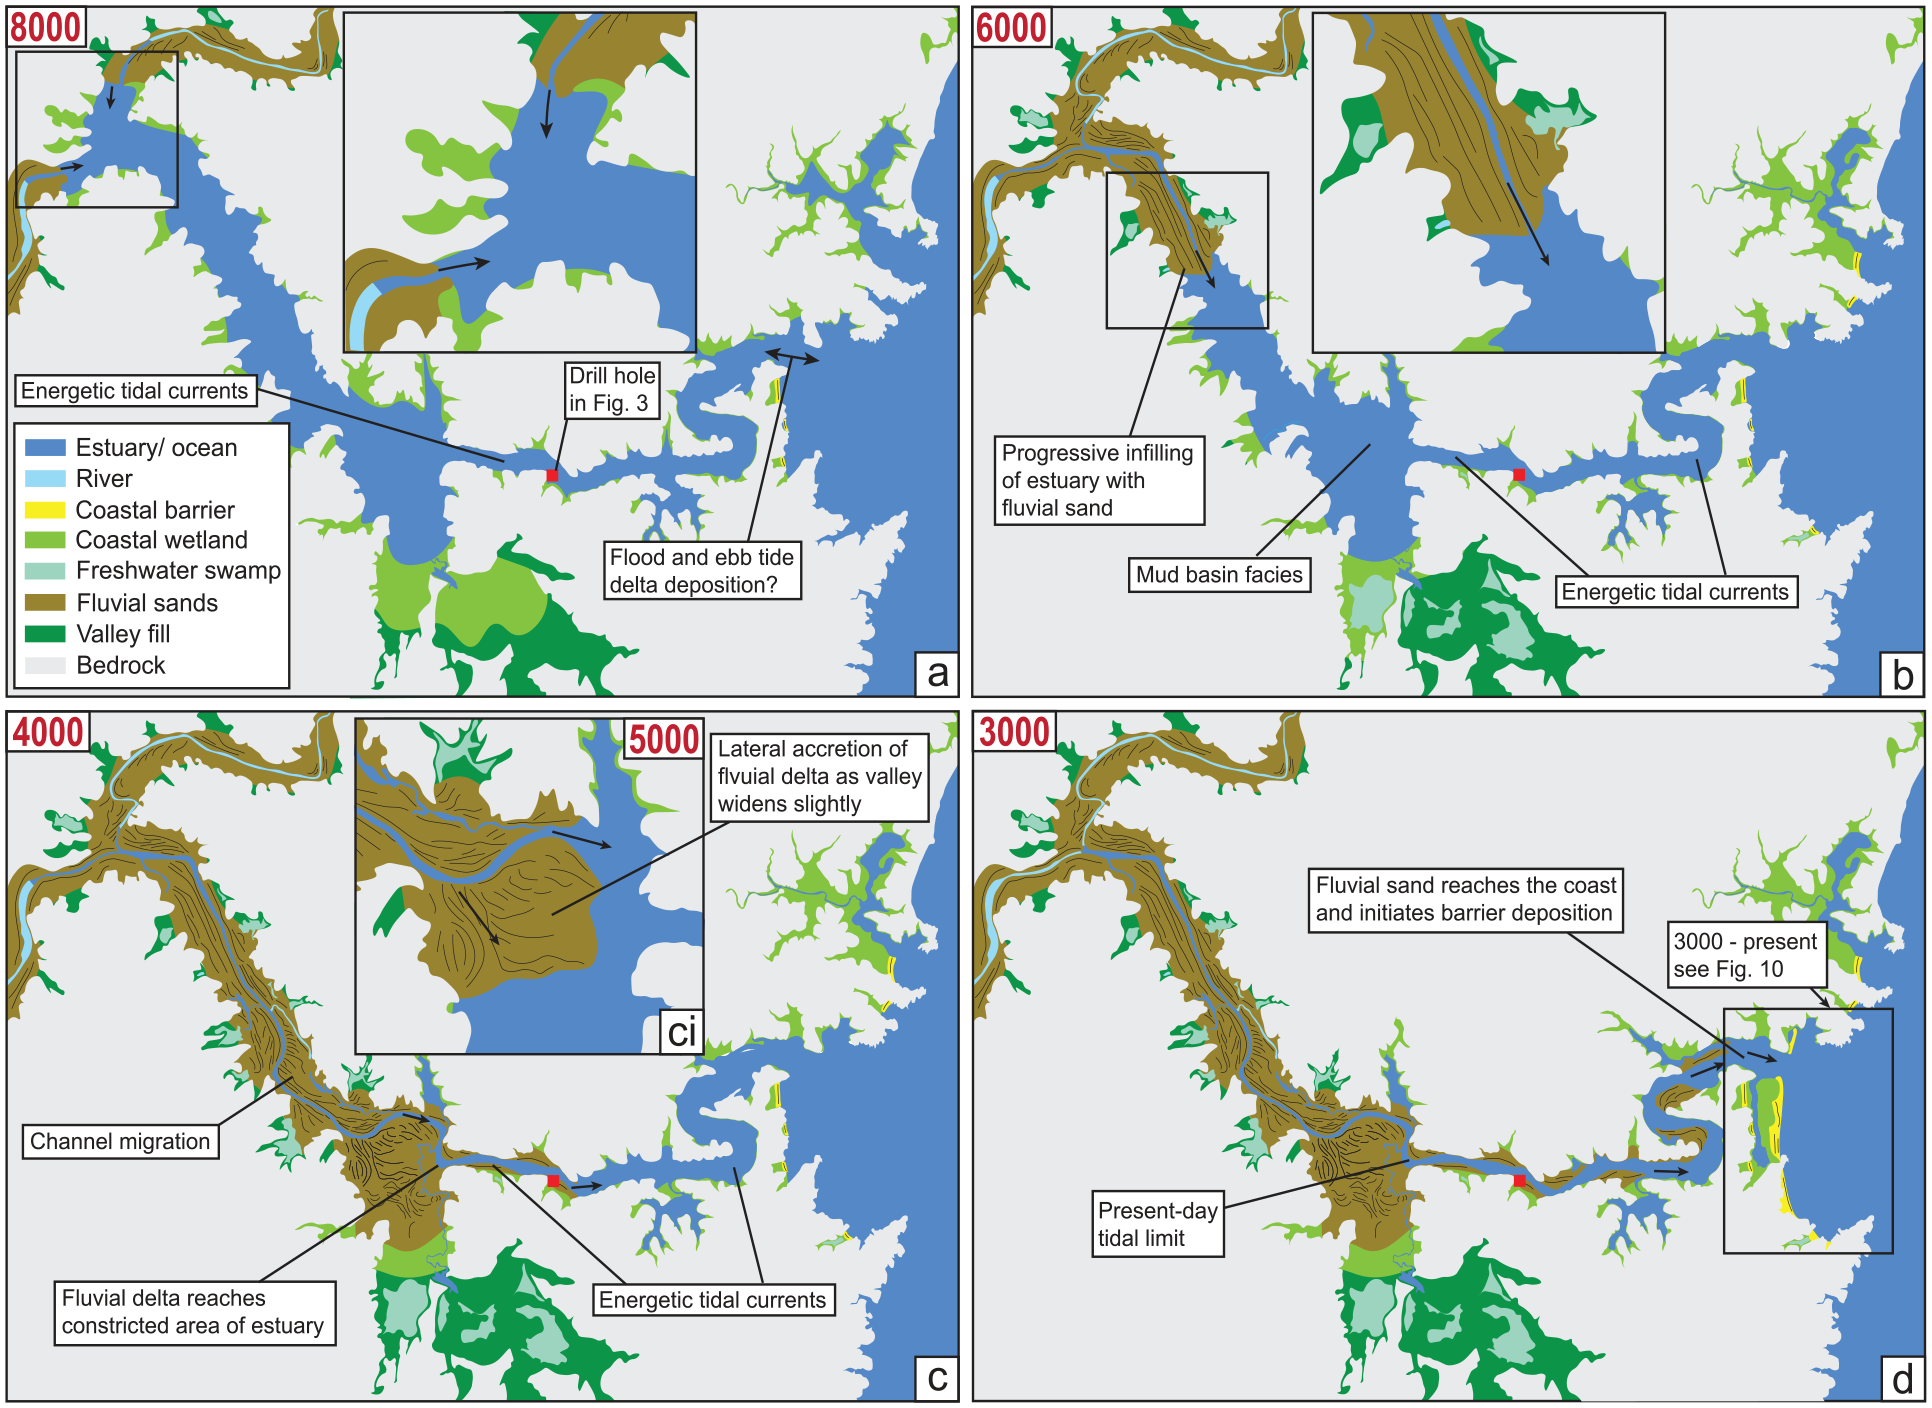
Depositional model of the Bega River estuary (a–d) from ~8000 to ~3000 years BP based on drilling by Sundararamayya (1983) (see Figure 2), drilling and radiocarbon dating by Coastal & Marine Geosciences (2000) (see Figure 3) and the high-resolution DEM in Figure 1. Note that timing of panels are approximate given the minimal chronological data available. Also note that the river channel has been drawn in its present position for all panels but would have migrated across the river valley over the Holocene as evidenced by abandoned channels and scroll bars visible in Figure 1 and sketched in Figure 9.
Estuarine deposition prior to sea-level reaching present elevations is also a feature of other estuaries along the NSW coast, both drowned river valley-type estuaries and barrier estuaries. Mud basin facies are recorded to depths of -30 m below present MSL in the lower reaches of the Shoalhaven River and are older than 8000 years (Roy, 1984a; Sloss et al., 2007; Umitsu et al., 2001). Mud basin facies associated with marine incursion into the Hawkesbury estuary were dated to 8030 ± 80 cal. years. BP −18 m below present MSL some 57 km upstream of the estuary mouth (Nichol et al., 1997). In the lower portion of the Hawkesbury estuary, mud basin facies are found between −40 m and −20 m below present MSL, the majority of which are older than ~9000 years BP (Roy, 1984a). In estuaries with shallower palaeo valleys such as the Minnamurra River, mud basin facies are evident below −2 m down to −9 m below present MSL with a sample from -2 m dated to ~7000 years implying the deeper mud-basin deposits are older (Panayotou et al., 2007).
Estuarine infilling from 8000–3000
As sea level stabilised between ~8000 and 7500 years BP (Sloss et al., 2007), a fluvial delta began to prograde into the Bega River estuary, initially as two separate depositional lobes from the Bega and Brogo Rivers (Figure 9a), and then joining together and progressively infilling the estuary (Figure 9b). This fluvial delta overlies the accumulated mud-basin facies, which in the upper estuary was 5–10 m thick (Figure 2b and c) and the emplacement of fluvial sand represents a transition from open estuary basin to intertidal areas to eventually, terrestrial riverine floodplain. During this time the Bega River estuary would likely have resembled an immature drowned river valley estuary with tidal currents moving energetically through the structurally-controlled bedrock valley (Figure 9b). Vertical aggradation of fluvial sand would have been occurring along the banks of the upper estuary upstream of the fluvial delta. A radiocarbon date from the base of the finer overbank material of ~4700 years BP (Brooks and Brierley, 1997) shows that in this region, the transition to a solely terrestrial environment was occurring in the Mid-Holocene. There is no chronological data for the exact timing of estuary infill from 8000 years onwards and the timing of the stages of infill in Figure 9b and c should be regarded as approximate. Sometime around 5000 years ago the fluvial delta likely expanded into the slightly wider portion of the palaeo valley before entering the narrow bedrock-constrained reach, from where the core in Figure 3 was taken (location indicated by the red square in Figure 9). Although an extensive area of low ground, which is now freshwater swamp, exists to the south of the main river channel near Jellat Jellat (Figure 1), the coring data from Sundararamayya (1983) demonstrates that these freshwater wetlands are not underlain by estuarine sediments (see Supplemental Figure 1). Thus the limit of Holocene estuarine deposition is between F-F’ and G-G’ (Figure 1) as indicated in Figure 9.
The evidence from the radiocarbon dating of the core in Figure 3 suggests that fluvial sand had reached the bedrock constricted margin of the river by ~4000 years. Vertical aggradation of fluvial sand then formed a ~10 m thick succession over a relatively short space of time, maybe only several hundred years (Figure 3). Transition to levee (overbank) facies after ~2250 years indicates channel infill was largely complete by this time. Thus the fluvial delta likely reached the open coast sometime between ~4000 and ~2250. The landward most OSL age from the Tathra Barrier, which contains a clear sedimentological ‘signature’ of fluvial input, is dated 3180 ± 140 years ago.
Barrier deposition from ~3000 to present
Coastal barrier deposition at Tathra Beach seemingly begins only once the Bega River has infilled to such a degree as to bring fluvial sand down to the coast ~3200 years ago. Such a young age for the landwardmost ridge at Tathra contrasts with other prograded barrier systems of this coastline which began forming around the time sea levels reached near present ca. 8000–7000 years ago. The nature of the open ocean shoreline before deposition of the Tathra Beach barrier system is unclear. The depositional model in Figure 9 shows a relatively open marine environment somewhat resembling Batemans Bay or the current mouth and lower reaches of Pambula Estuary. Several small, low, single ridges in narrow embayments may have been active during this time (Figure 9). However, these seem to be the result of fairly low energy conditions yet were unlikely to be particularly sheltered from wave energy. Whatever the case, there is little subaerial sedimentary deposits associated with the open coast before the current barrier system formed. Even when barrier deposition commenced, the rate of shoreline advance was relatively slow (0.15 m/year, Figure 7) compared with other prograded barriers in this region (Carvalho et al., 2019; Oliver et al., 2020).
Initially, the shoreline was divided by a central headland (Figure 10a) which was subject to marine erosion (Figure 6), being jagged like the current marginal headlands. An active flood and ebb-tide delta complex likely to have existed with sediment brought down the river during floods incorporated into the barrier system. By ~1000 years ago, the barrier had exceeded the central headland and assumed an orientation similar to the present-day shoreline (Figure 10b). A much wider and less constricted estuary entrance in the centre of the embayment is apparent around this time having been diverted southwards, eroding the northern margin of existing ridges (Figures 6a and 10b). A younger northwards extension of the barrier restricting the estuary entrance back northwards, adjacent to the northern headland, occurred in the last ~500 years. After the initial deposition of a single ridge at Nelson Beach, no further progradation occurred until a new ridge was deposited ~2500 years ago, after which slow (0.06 m/year) shoreline progradation occurred.
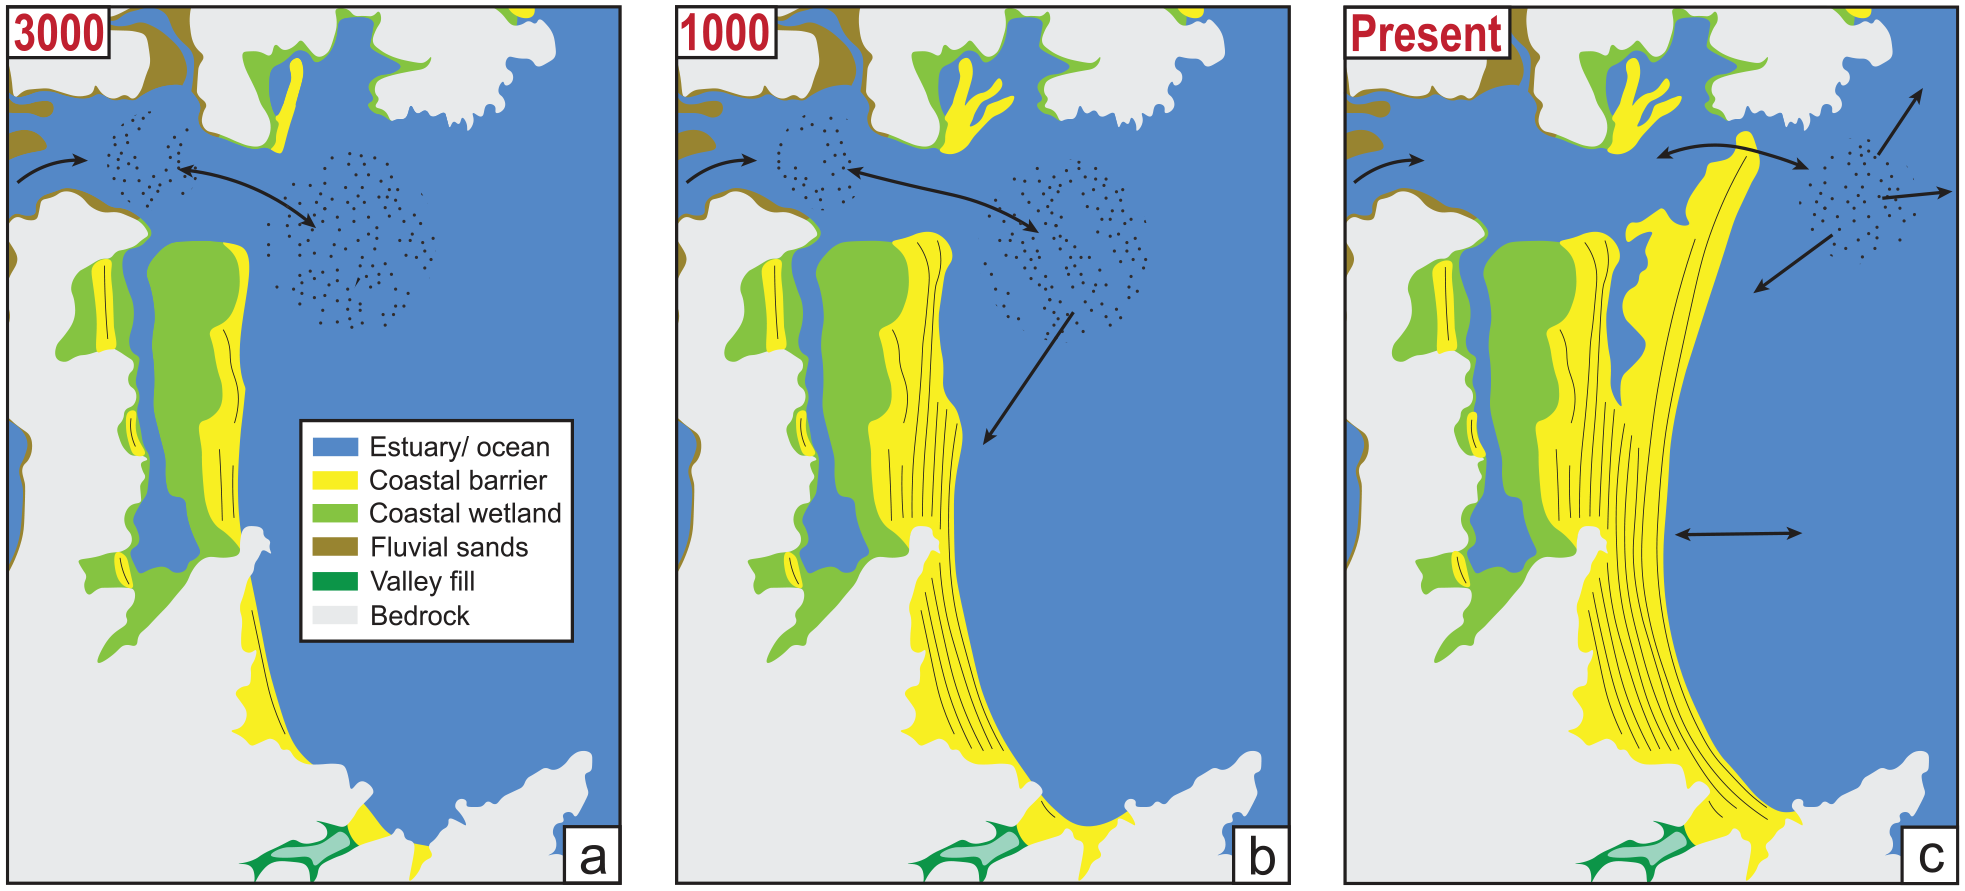
Deposition model of the Tathra barrier system from ~3000 years (a), ~1000 years (b) and present (c) based on OSL dating of coastal barrier sand in this study (see Figures 4–6). Refer to Figure 8 for the progressive infilling of the Bega River estuary prior to ~3000 years ago. Of particular note here is the recent northward extension of the barrier further impounding the lower estuary c.f. (b) and (c) which occurred in the past 500 years (see Figures 4a and 5a).
Coastal sediment budget – on what timescale?
The evidence presented in this study implies that over the Mid- to Late-Holocene the Bega River has been a sustained source of sand, initially forming a fluvial delta which infilled the Bega River estuary, and then promoting shoreline progradation of the Tathra Beach coastal barrier. In this sense, the millennial-scale sediment budget for this coastal compartment is clearly positive. It is important to recognise this longer-term context when interpreting processes operating on shorter timescales. When these shorter timescales are considered and the spatial scale is reduced to individual components of the coastal system (e.g. estuary entrance, upper shoreface, beach, dune), then periods of erosion and accretion are evident. However, these should be interpreted in context of the longer-term trend.
For instance, Tathra Beach has undergone periods of coastal erosion, such as in the 1970s when the beach lost >1,000,000 m3 of sand (PWD, 1980). These storms were preceded by the 1971 flood, which is the largest recorded at the Bega River gauge since records began there in 1851. Looking at this decade of coastal change would lead to a conclusion that the beach system was undergoing recession, as suggested in the PWD (1980) report. This had to be reconciled with the evidence of fluvial sand supply to the embayment and loss of sand offshore was suggested. However, when a longer timescale is considered (>100 years), it is evident that there has been a net positive sediment budget and slow but sustained coastal barrier deposition. For instance, an entirely new spit has been deposited enclosing the lower Bega River estuary in the last 500 years and contains ~690,000 m3 of sand (above MSL). The foredune ridges deposited over the last ~3000 years, which each take nearly 200 years to form, represent net accretion in the order of ~0.55 m3/m/year. Thus only a weakly net positive sediment budget is needed over longer timescales to promote barrier deposition. Each ridge has thus experienced numerous episodes of ‘cut and fill’ (Davies, 1957) prior to being stranded by further shoreline progradation. On decadal timescales beach volume changes in the order of 5–20 m3/m/year completely mask the longer term trend. This magnitude of interannual to decadal variability is also evident in time series of satellite-derived shorelines (Bishop-Taylor et al., 2021; Nanson et al., 2022; Vos et al., 2019a, 2019b, 2023) and beach volume change from photogrammetry of historical air photos from the 1940s to present (Department of Planning, Industry and Environment (DPIE), 2022).
Coastal morphodynamics – internal thresholds
Internal thresholds in coastal systems are exemplified where the estuary transitions from immature open basin conditions to mature riverine estuary conditions, such that sediment which once predominantly infilled the estuary is then delivered to the open coast (Roy, 1984b). In this scenario, the threshold of accommodation space within the estuary has been exceeded to facilitate sediment ‘overflow’ to the coast (Rogers, 2021; Rogers et al., 2022). The Bega River estuary reached this internal threshold sometime around ~3000 years ago as fluvial sand was delivered to the open coast promoting coastal barrier development.
The same concept can be applied to the Tathra Beach coastal barrier where, as the embayment fills due to barrier progradation, there is an increasing likelihood of sand delivered to the coast ‘leaking’ northward via longshore transport and headland bypassing. This is already occurring to some degree as fluvial sand is present at Nelson Beach (PWD, 1980) likely fed by the distinct sediment lobe adjacent to the Bega River entrance (red dotted circle in Figure 6a). In this sense, an internal morphodynamic threshold is being approached. This same type of threshold was reached further north at Pedro Beach where infilling of the bedrock accommodation space with barrier sand led to headland bypassing northward which enabled the deposition of the Moruya Heads barrier system (Oliver et al., 2020).
Projected sea-level rise – a future tipping point
Boundary condition changes impact the entire coastal system changing the nature of internal dynamics. Projected sea-level rise represents such a boundary condition change in the coastal morphodynamic system which will likely act as a tipping point for shorelines which will begin receding. Along this coastline, the most recent projections of median sea-level rise from the IPCC 6th Assessment Report (IPCC, 2022) are between 0.33 m to 0.78 m by 2100 relative to a 1995–2014 baseline depending on which Shared Socioeconomic Pathway is adopted. The tipping point for individual beaches and estuarine systems from stability or accretion to sustained recession or flooding depends on the sediment budget and the rate of sea-level rise. All sandy shorelines and estuaries have such a tipping point, although the shoreline response may lag the sea-level trend (Mariotti and Hein, 2022). Sharples et al. (2020) recently identified this tipping point for a wave-dominated beach on the western coast of Tasmania through a comparison of historical air photos and a range of climate and sea-level datasets. Beaches with positive sediment budgets can absorb a certain level of sea-level rise and either continue to prograde or remain stable. This has been well established along coastlines where sea levels have been steadily rising over the Holocene and coastal barrier deposition and shoreline progradation still occurred (e.g. Costas et al., 2016; Fruergaard et al., 2015).
Shorelines already in sediment deficit will be more prone to recession and at greater rates. It is important to think of the coastal system through a morphodynamic framework in order to appreciate internal thresholds and the influence of boundary condition changes and their impact on a range of spatial and temporal scales. This can only be achieved with datasets which span these same scales and consider millennial through to decadal processes and interactions between sub-environments of the overall coastal system. This leads to a nuanced view of shoreline vulnerability to projected sea-level rise and avoids reactive coastal management actions that will likely not address, and instead, possibly exacerbate coastal recession.
Conclusions
The concept of morphodynamics is fundamental to an understanding coastal system behaviour on a range of temporal and spatial scales. This study has examined the Holocene evolution of the Bega River estuary and Tathra Beach coastal barrier integrating existing sediment cores and radiocarbon dating with newly available airborne terrestrial and marine Lidar and a suite of OSL ages. Taken together, the results demonstrate the Bega River estuary began infilling through the progradation of a fluvial delta once sea levels stabilised at or near their present elevation, although the depth of the palaeo river valley meant that estuarine mud-basin conditions existed while sea level was ~10 m below present. Radiocarbon dating reveals the prograding fluvial delta reached the coast between ~4000 and 2250 years BP. Barrier deposition commenced ~3200 years ago coinciding with the arrival of fluvial sand at the coast and much later than other prograded barrier systems of this region. Sediment samples from the barrier and shoreface sand at Tathra contain a high proportion of angular grains and are rich in feldspars and lithic fragments which contrasts with the more common quartz-rich, sub-rounded beach sand of the broader region. Shoreline progradation at Tathra occurred at a rate of 0.15 m/year forming a sequence of ~17 foredune ridges which were active for an average of ~190 years before being stranded behind the accreting shoreline. In the past ~500 years, a sand spit has established and restricted the entrance of the Bega River estuary to the northern end of the embayment. A smaller embayment just north of Tathra contains a sequence of ~10 foredune ridges behind the modern Nelson Beach. The landward most ridge was dated to ~6000 years while the next seaward was ~2500 years, after which steady progradation to the present shoreline position occurred at a rate of 0.06 m/year. The infill of the Bega River estuary represents arrival at an internal morphodynamic threshold or tipping point, which then prompted coastal barrier deposition as fluvial sand reached the coast. As the Tathra embayment has infilled, the coastal system approaches another threshold which may promote sediment transport out of the embayment. However, projected sea-level rise represents an external boundary condition change to which all shorelines must adapt. Those with existing positive sediment budgets can absorb this system-wide change and will have a tipping point further into the future than those that are currently stable or already undergoing recession.
Supplemental Material
sj-pdf-1-hol-10.1177_09596836231197744 – Supplemental material for Holocene estuary infill leads to coastal barrier initiation from fluvial sand supply in southeastern Australia
Supplemental material, sj-pdf-1-hol-10.1177_09596836231197744 for Holocene estuary infill leads to coastal barrier initiation from fluvial sand supply in southeastern Australia by Thomas SN Oliver, Christopher J Owers, Toru Tamura and Derek van Bracht in The Holocene
Footnotes
Acknowledgements
OSL dating was supported by the Luminescence Laboratory at the Geological Survey of Japan and we are grateful to the technical support staff at this facility. Airborne terrestrial and marine LiDAR datasets forming the basis of topographic data in Figures 1,5 and 6 are available for download via the Elvis – Elevation and Depth – Foundation Spatial Data portal:  . This work is a contribution to IGCP Project 725 ‘Forecasting Coastal Change’.
Funding
The author(s) disclosed receipt of the following financial support for the research, authorship, and/or publication of this article: This research was supported by a UNSW Canberra Rectors Start-Up Grant awarded to Dr Oliver.
Supplemental material
Supplemental material for this article is available online.
References
Supplementary Material
Please find the following supplemental material available below.
For Open Access articles published under a Creative Commons License, all supplemental material carries the same license as the article it is associated with.
For non-Open Access articles published, all supplemental material carries a non-exclusive license, and permission requests for re-use of supplemental material or any part of supplemental material shall be sent directly to the copyright owner as specified in the copyright notice associated with the article.
