



Abstract
The question when people work is almost always reduced to the question how much people work on (non-)standard working hours. In this contribution, we applied optimal matching techniques using Belgian data from a weekly work grid (n = 6330) to identify individuals’ work timing patterns, offering a richer analytical approach than most previous studies on (non-)standard work time. Results show that such analysis captures much more and much more relevant variation in the timing of work than simple questions. Three general and 10 more detailed weekly work patterns are identified based on two dimensions of paid work: the number of hours worked and the percentage of hours worked on non-standard periods of time. Additional analyses show that men’s work patterns depend only on job characteristics. For women, work patterns are also explained by socio-economic factors including education, presence of working partner and presence of children.
Introduction
The main reason for most people for performing paid work is its remuneration. However, as an extension of this ‘manifest function’, employment as a social institution also has ‘latent functions’: it is a source of social contacts, it enhances participation in collective or individual transcending purposes, it offers an acceptable status and social identity, and contributes to regular activity (Jahoda, 1982). Simply because these experiences are unintended though inevitable consequences of the presence of paid work, it is mainly by becoming unemployed that one becomes aware of these latent functions of work. ‘While the unemployed are left to their own devices to find experiences within these categories if they can and suffer if they cannot, the employed take them for granted’ (Jahoda, 1982: 39).
Although this is taken for granted and unintended, the way of experiencing time and the regularity-creating characteristic of paid work plays an enormous role in the organization of daily life that forgoes the simple question of how much (how many hours) we work. Work schedules form the basis of our daily and weekly time-use patterns even for those who do not work. This highlights the importance of studying the instantaneous use of time, that is, studying the use of time at the episodic or activity level by its four characteristics (timing, tempo, sequence and duration), as opposed to time use integrated over days, weeks, years or a working life. (Hamermesh, 1999)
Non-standard work can be either the result of high time sovereignty of self-employed or employees in the public sector or the result of high time flexibility of blue-collar workers facing rigid working schedules and shift work. Besides addressing the question when people work, it is of equal importance to address the question who or what people work on non-standard hours. Especially because non-standard work is amongst other things, related to poorer health outcomes of employers (e.g. Jamal, 2004) or their family (e.g. Fenwick and Tausig, 2001), which motivates the need for a thorough approach of the subject. Likewise, part-time work can either be a deliberate choice (often in high-income families) (e.g. Booth and Van Ours, 2013) or an unavoidable consequence (often in low-income families, or inability to find a full-time job) to combine work and family responsibilities (e.g. Blank, 1989). Additionally, part-time work is typically a women’s ‘choice’. By grasping the additional variation in work patterns by the episodic (or instantaneous) approach using a more sophisticated analytical method (see further), we readdress some of these findings.
The aim of this contribution is, thus, to truly grasp the timing of weekly work (i.e., question 1: when do people work and how much?) and (re-)evaluate how different patterns of weekly work are socio-economically dispersed over society (i.e., question 2: who works when?). We use Belgian data from a weekly work grid (WWG) and an accompanying individual questionnaire (n = 6330) to answer both questions. Firstly, we will use the combination of two dimensions of weekly paid work to construct a typology of weekly work patterns, which is the innovatory part of this contribution. The first dimension is how much people work, varying from different amounts of part-time work to overwork. The second dimension is how these hours are dispersed not only over the days of the week but also over various (non-)standard working periods, i.e., daytime, evening and night-time work. Secondly, we will investigate who works by which schedule and – although we cannot test causality – elucidate on the implications of occupying a certain social position for the (possible) working time arrangement someone faces.
In what follows, we will first provide some background on delineating non-standard and part-time working arrangements and on who is assumed to work by such arrangements and argue where and how variation in these arrangements can be found. Secondly, we will introduce the data and explain the methodology and analytical strategy that allows us to make this variation visible. Thirdly, we present the different work patterns in terms of their arrangement over the week, working hour characteristics and socio-demographic background. Finally, we conclude with a discussion.
Background
As mentioned in the introduction, this contribution aims to both identify how (non-)standard and part-time work is patterned over the week (Q1) and who works by these patterns (Q2). In this section, we give a brief background on how the timing of work has been studied already in the past, how current literature explains the relation between social position and employment in non-standard and part-time work arrangements and how this contribution extends these attempts and findings.
Timing of (non-)standard and part-time work
The most frequently used indicator of time spent on paid work on standard or non-standard hours, or on full-time or part-time work comes from the Labour Force Survey (LFS) in Europe or Current Population Study (CPS) in the U.S. In the LFS, non-standard work is divided in evening work (7 p.m.–11 p.m.), night work (11 p.m.–5 a.m.) and work on Saturday and Sunday. Addressing the question of timing of work, then, is reduced to the question ‘How often have you worked on each of these periods/days’ with a four-category answering scale (Presser, 2005). Likewise, part-time employment is only questioned by expressing the extent of part-time work as a percentage of full-time employment.
Both questions are exemplary of how the true timing of work is missed. Consider the latter question and suppose someone answers 75%. How do we know whether this is the result of working 6 h on all five weekdays or of working 8 h on Monday to Thursday only? To truly grasp the timing of non-standard and part-time work, we need exact hours and minutes when the paid work was performed and for this reason scholars rely on time-use surveys (see, e.g. Hamermesh, 1998). Time-use surveys include diaries in which respondents denote for every activity – including paid work – the beginning and ending time. Time-use studies thus do provide information on the timing of paid work and a statistical technique called optimal matching analysis (OMA; see Data and method section) has been introduced to time-use research to identify time-use schedules or patterns in time-use data. This led to studies in Europe, in which Lesnard (2008), Glorieux et al. (2008) and Lesnard and De Saint Pol (2009) identified five different generic workday schedules, being typified as regular ‘standard’, ‘long’, ‘shift work’ and ‘part-time’ workdays and the irregular ‘fragmented’ workday.
However, time-use surveys are often limited to one day (e.g., yesterday recall method in the U.S.) or two days (e.g., the European HETUS guidelines suggest one weekday and one weekend day). So although these studies provided a relevant first insight in the scheduling of paid work, the data still included at most only one weekday and one weekend day per respondent and thus forced these scholars to treat days separately or, as far as we know, left weekend days out of the analyse. The days are being torn loose from the more encompassing week rhythm and the same problem as with the LFS questions remains present: suppose someone only registers one weekday and this weekday turns out to be a standard workday, we still do not have sufficient information about this person’s workweek or whether or not this person works full time or part time.
Social dispersion of (non-)standard and part-time work
Non-standard working hours
The issue of non-standard working hours is often approached from the remunerative or economic characteristics of work only, as if it were a problem of ‘the matching of workers with heterogeneous tastes for work times with firms that have different costs of offering work at various times of the day’ (Hamermesh, 1999: 38). Albeit workers will consider the non-monetary amenities of a job (e.g., non-standard working hours), their earning ability plays an important role, such that workers with low earning abilities will accept unpleasant jobs that compensate for this unpleasantness by offering higher wages. As a result, a relative increase in earnings will increase the possibility to avoid working at unpleasant times, giving non-standard working hours its inferior characteristic (Hamermesh, 1999). This inferior characteristic is also substantiated by the evidence that an overall relative increase in earnings over time is associated with an overall decrease in evening and night-work and an increase of work at the peak times of a ‘normal’ workday (Hamermesh, 1998, 2002).
Previous studies found that individuals of different socio-economic and demographic characteristics have a different tendency to work on (non-)standard hours. Presser (2005) thus found for the U.S. that age, education and race significantly relate to changes in working non-standard and weekend days. This relation for age is negative and equal for men and women, that is, the older one is, the lower the odds of working at unpleasant hours. The effect of education seems to be U-shaped: higher odds of having a non-standard time of work were found for both lower education (explained by shift work of blue-collar workers) and higher education (explained by, e.g. being on call of high-skilled workers like medical specialists). Lastly, women with an ethnicity other than Hispanic or non-Hispanic white or black women have one of the highest odds of having non-standard working schedules.
However, the reasons for men and women to work on non-standard hours or on weekend days are not merely economical. In the U.S., for example, a quarter of men and almost 35% of women mention personal and familial reasons, of which better childcare arrangements, most frequently. Here, Presser (2005) finds that children depress the odds for working non-standard hours for mothers but that the reverse holds for fathers, with an exception for dual-earner families. Mothers in dual-earner families also face a ‘positive’ effect of children on the odds of working on non-standard hours. In fact, over one-third of dual-earner couples with children under the age of 5 include at least one spouse who works on non-standard hours, and almost half of these couples include at least one spouse who works on weekend days. This leads Presser to conclude that ‘non-standard work schedules are no longer that nonstandard’ (2005: 214).
Part-time work
Working at non-standard hours can be the result of individual (e.g. low educated and therefore possibly less employable in good daytime jobs) or job characteristics (e.g. content of the job like ‘emergency services’ or assembly line work). In any case, the consequences for family life almost speak for themselves. Working at non-standard hours negatively affects the quality and stability of marriage, and this negative effect grows stronger once young children are present. As a result, according to Hamermesh (2002), couples try to arrange their working schedules in a way that they can spend some leisure time together. Additionally, working at non-standard hours complicates childcare arrangements (Presser, 2005). Whereas, for example, the United Sates leaves childcare largely to the market or to informal care, and whereas, for example, Scandinavian countries highly subsidize childcare facilities, in other countries, solutions arise in terms of working time arrangements like part-time work. The Netherlands is such a country that is highly characterised by female labour market participation through part-time employment (Bosch et al., 2010). In 2013, in the Netherlands, 77% of the female employed is working part time, whereas in Sweden, for example, this percentage is much lower (37.7%). Belgium falls somewhere in between with 42.5% of the female workforce working part time in 2013 (figures from the Policy Research Centre Work and Social Economy, www.steunpuntwse.be).
The Netherlands, thus, lends itself well to study (the mechanisms of) part-time work. Bosch et al. (2010) report stability in average working hours of women over cohorts from 1925 to 1987 in the Netherlands despite the increase in women’s educational attainment. They conclude that even though many studies emphasize the negative aspects of part-time work (see, e.g. Connolly and Gregory, 2008), this stability at least may be part of individual or household strategies (see, e.g. Hägerstrand, 1975). In fact, the presence of children and a full-time working male spouse increases the probability for the female spouse to work part time, and this ‘state of affairs’ results in a higher life satisfaction for both men and women (Booth and Van Ours, 2009, 2013). The same holds for satisfaction with working hours. Booth and Van Ours (2013) calculated the equilibrium weekly working hours to be 21 for women and 32 for men. However, the authors also found that for job satisfaction, no such relationship existed, hinting that ‘occupational downgrading’ of women is a serious issue. Connolly and Gregory (2008) report one-quarter of women who switch to part-time work to work at lower qualification than their previous job.
Nonetheless, women’s choice for part-time work might be a deliberate one to solve the puzzle of daily and weekly planning of activities that often happen in function of the working schedule. With good reason, Hochschild (1990) names work the ‘first shift’ of the day around which the ‘second shift’ of domestic work needs to be scheduled. Both shifts are in a constant struggle for daytime planning for two reasons: firstly, both paid work and domestic work contain activities that cannot be postponed (i.e., we have to go to work and we have to eat) and, secondly, both shifts repeat themselves every day (in the case of paid work at least on all contracted workdays). Despite the gender inequality in the division of work, but because of the positive relation to life satisfaction, the Dutch government took several measures in favour of part-time work in the Netherlands. Part-time workers now have the legal right on equal treatment (wages, overtime, bonuses, etc.), the legal right to request a reduction or increase in working hours and face a tax system that makes part-time work more attractive as compared to non-employment in relation to spouse’s full-time employment (Bosch et al., 2010). The authors thus conclude that part-time work is ‘here to stay’ in the Netherlands as a solution for families to face the daytime struggle of combining both ‘shifts’ themselves and take into account the ‘shifts’ of their spouse (see also Glorieux et al., 2010b).
It goes beyond the scope of this contribution to discuss whether the tendency of women working part time is a desired situation or not. What concerns us here is that from the above, we derive that non-standard working hours are becoming more ‘standard’ and that part-time working solutions might not only result from job characteristics but from a various number of family characteristics as well. So studying the main patterns of paid work within a society means studying the way the temporal organization of society takes place and vice versa (Dumazedier, 1962; Gershuny, 2000; Robinson and Godbey, 1999). In other words, unravelling different work schedules gives an insight in how the struggles of the daily ‘shifts’ gets solved. An example is the rise of part-time work schedules that can be understood from the increased female labour force trying to solve the time-puzzle that emerges from their simultaneous roles as an employee and caring mother. As a consequence, it will be highly likely that there exist different non-standard and different part-time work patterns. Furthermore, a pressing additional question includes what the ‘pattern of reference’ – the standard working pattern that is becoming less standard at least according to Presser (2005) – looks like? At this point, we side with (Hamermesh, 1998; 1999; 2002) that we should be concerned with the timing of work and not only with calculating equilibriums of the number of working hours.
Weekly work patterns
As we mentioned, to analyse the scheduling of paid work profoundly, studies that only investigate average work time durations provide insufficient information. Likewise, time-diaries that inquire only one weekday and/or one weekend day do provide an insight in daily scheduling of work, but extrapolating these findings to a weekly work pattern still might result in false assumptions. One way to solve this problem is to use data from the so-called WWG, which contains information of the timing of work for seven consecutive days.
Lesnard and Kan (2011) were the first to use the WWG to identify weekly work patterns, by, firstly, identifying workdays (standard, long, shift, part-time, short workdays) like previously done by Lesnard (2008) and Glorieux et al. (2008) and, secondly, analysing the sequence of these workday typologies within each individual week (standard, long, shift, alternate, part-time I and II, short workweeks). The reason they give for the two-stage approach is that investigating workweek patterns involves two nested periodicities, namely, hours within days and days within weeks. Therefore, ‘it will be more appropriate to take account of these two nested periodicities in the analysis as workers are likely to schedule their work time at two stages in real life’ (Lesnard and Kan, 2011: 345).
We argue that there is not necessarily a need to depart from two nested periodicities of paid work. The reason here for is twofold and concerns the worker’s increased freedom or sovereignty to schedule their working hours every single day of the week (cf. the first nested periodicity of workweek patterns). Firstly, the temporal structure of daily work is relatively rigid because its social character reflects and builds on the work hour preferences of the employers (Golden, 2001; Lesnard, 2008). A temporal structure of daily work in which every employee works according their preferences is very unlikely to happen (at the least because of coordination problems) and, secondly, even if this would be possible, the social or collective rhythm of society would, in the end, lead to relatively rigid temporal structures of daily work, no matter what (Hägerstrand, 1975; Lewis and Weigert, 1981). Individuals living together are in need of coordination and time functions as a structuring mechanism to make this coordination possible. Time, at this point, becomes a social and normative construct that guides the temporal arrangements of our lives, which, if we follow these guidelines, in turn, reinforce them (Durkheim, 1965 [1912]). So, it comes at no surprise that most of us sleep at night, have breakfast in the morning, lunch at noon, leisure in the evening and work during daytime. So, in alliance with collective rhythm of a society, most of the employees work between 8 a.m. and 6 p.m., and most part-time workers either take-off one whole day or every afternoon. Based hereupon, we argue that this rigidity of the temporal structure of daily work legitimates (or maybe even requires) the study of the scheduling of paid work immediately within the periodicity of the week cycle.
Therefore, and as far as we know, we will for the first time apply the optimal matching directly to the WWG data. Although the main goal of this contribution is to answer the question who works when?, it also allows us to compare our results with those of Lesnard and Kan to see if this direct optimal matching yields different results than their two-stage approach.
Data and method
Data
We will use the WWG, more specifically a pooled file of the 1999 and 2005 data (WWG9905), that comes along with the Belgian time-use surveys of 1999 (TUS99) and 2005 (TUS05). Both surveys are conducted by Statistics Belgium and are a random sample of the Belgian population (n = 14,782). Whereas the TUS only asks respondents to fill in diaries for one weekday and one weekend day, the WWG requests employed respondents to indicate their seven-day work episodes by drawing a line from the starting time to the ending time of each work episode. In order to do so, for every day of the week, the WWG provides a grid of 96 15-min time slots and the instructions hold that respondents exclude (meal) breaks and travelling time.
We withheld only those respondents (18 to 75 years) who have reported to be employed in the questionnaire and who reported at least one work episode in the WWG. This brings the sample size to 6330 respondents.
Measures
As mentioned in the introduction, we use two dimensions of paid work to typify weekly work patterns. The first dimension is the number of hours worked, which indicates the continuum of part-time through full-time work (i.e., 40 h/week) to overwork (i.e., extended workweek). The second dimension is the percentage of work performed on non-standard periods, which we define as weekend work (i.e., work performed on weekend days from 6 a.m. till 7 p.m.), evening work (i.e., work performed all days from 7 p.m. till 10 p.m.) and night work (i.e., work performed on all days from 10 p.m. till 6 a.m. the next day). The ‘standard workweek pattern’ has to meet the standard of both dimensions, that is, contain about 40 h of paid work and the least percentage of work performed on non-standard working periods.
We will analyse the identified weekly work patterns in terms of gender, age (18–39 years, 40–54 years, 55–75 years), education (max. lower secondary, higher secondary, higher or university), earning situation (single earner, single-earner family, dual-earner family), age of youngest child (no child or child over the age of 25, child under the age of 7, child between 7 and 25 years old) and sector of employment (private sector, public sector, self-employed). No valid and reliable measure of income is available in the Belgian time-use studies of 1999 and 2005.
Sample characteristics (column percentages).
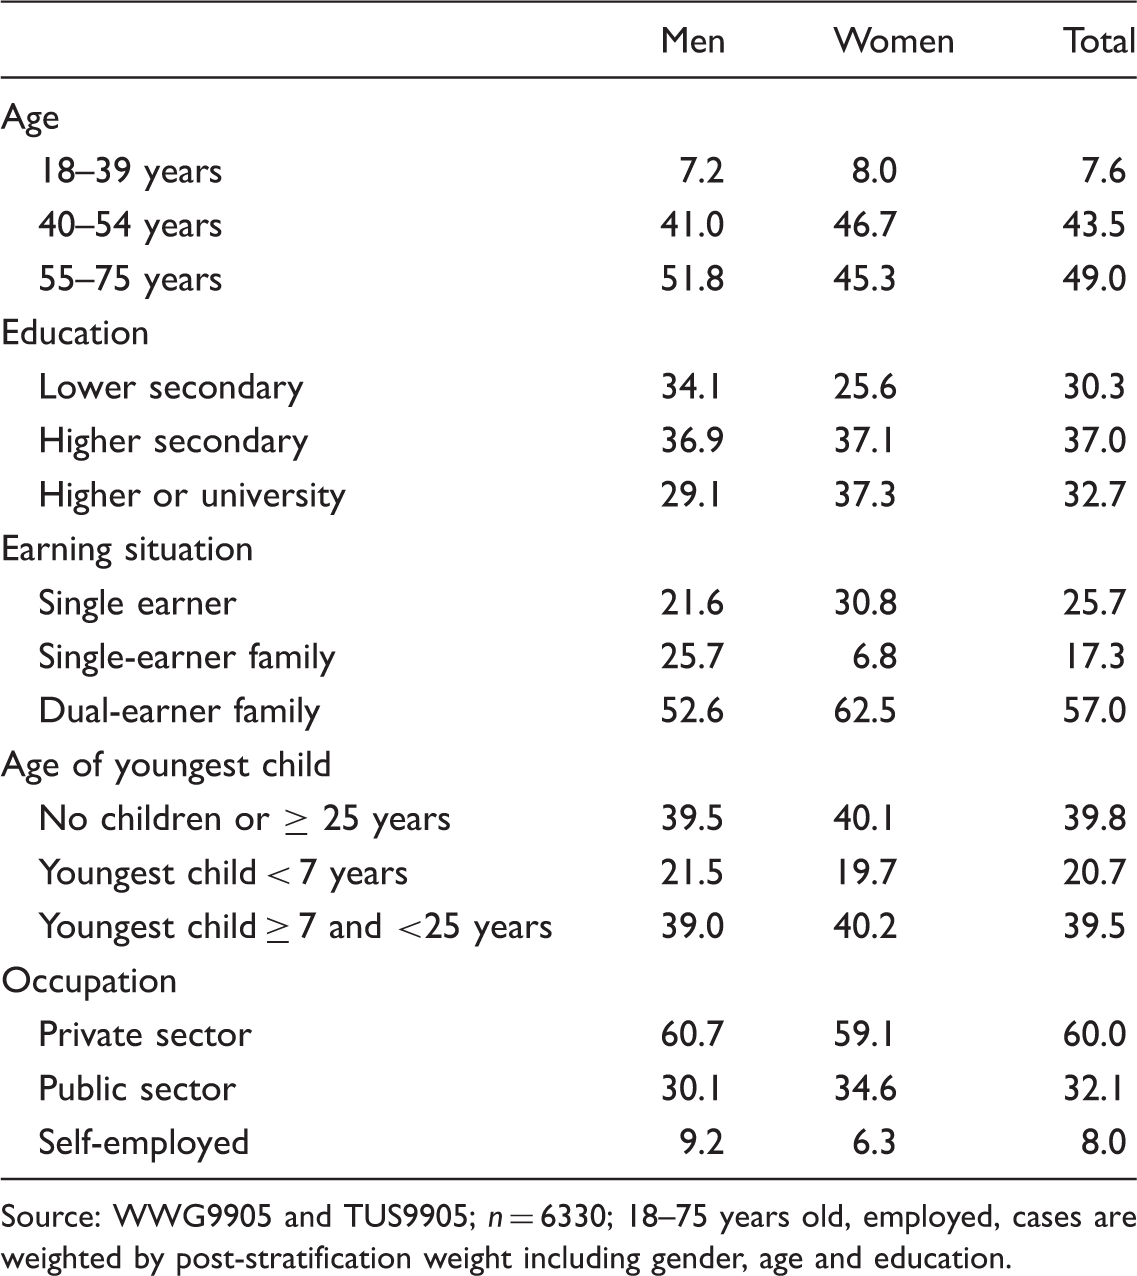
Source: WWG9905 and TUS9905; n = 6330; 18–75 years old, employed, cases are weighted by post-stratification weight including gender, age and education.
Analytical strategy
Optimal matching analysis (OMA)
OMA has been introduced in social sciences by Andrew Abbott and colleagues (Abbott, 1983, 1984, 1995b; Abbott and Forrest, 1986; Abbott and Hrycak, 1990). The main purpose of OMA is to discover patterns in individual sequences of events by comparing each individual sequence with all other sequences in terms of the number of ‘operations’ needed to equalize two sequences. These operations consist of ‘inserting’ an event, ‘deleting’ an event or ‘substituting’ an event, and different operations concerning different events are assigned different ‘costs’. The cost-setting of these operations is, although often based on theoretical grounds, largely arbitrary (for a theoretical discussion on cost-setting, see Abbott, 2000; Abbott and Tsay, 2000; Lesnard, 2014; Levine, 2000; Wu, 2000) (for a technical outline of cost-setting, see Abbott, 1995a; Dijkstra and Taris, 1995; Elzinga, 2003; Hamming, 1950; Lesnard, 2010; Levenshtein, 1966). Nevertheless, in the end, this makes OMA an optimization problem, namely, computing the minimal (‘optimal’) costs needed to ‘match’ an individual sequence with all other sequences. The result of OMA, then, is a matrix containing the costs or ‘distances’ between all sequences, which, in turn, can be reduced by a clustering method in order to aggregate sequences for which mutual distances are low and for which distances from the other sequences are high.
OMA has been introduced to time-use research by Lesnard (2004) and, hereafter, applied to study the sequences of different time-use activities, such as paid work time (Glorieux et al., 2008; Lesnard, 2008; Lesnard and De Saint Pol, 2009), active and passive leisure time (Glorieux et al., 2010a) or temporal regimes of contracted, committed and personal time (Kragelj, 2009).
One of the reasons OMA is being more and more applied to time-use data is because time-use series are a specific type of sequences and time-sequences are easily divisible in equally large or small time slots (e.g., 24 h, 96 quarters of an hour, 144 10-min intervals, etc.). However, the continuous, linear character of time implies that applying ‘insertions’ of ‘deletions’ to match time-sequences would imply ‘time warping’ and thus make not much sense. The reason for this is the so-called embeddedness of time-use (Lewis and Weigert, 1981), meaning that many activities get their meaning from ‘occupying’ a certain time-slot during the day and from the preceding or succeeding activity. For example, 1 h of work during daytime has a different meaning or connotation than 1 h of work during night-time (cfr. Hamermesh, 1999). The meanings and connotations we attach to time-use makes that time both has a natural and social course during the 24 h that make up the day or 168 h that make up the week, and, as a result, ‘warping’ time-use activities (e.g., deleting lunch at noon and inserting it at midnight) violates the collective and social structure of time-use activities (Van Tienoven et al., 2011).
Because of the equal length and structure of time-sequences and because of the ‘substitution’ of time-use activities as the only legitimate operation to match different time-sequences (since it recognizes the contemporaneity of time-sequences), OMA is a relatively powerful analysis tool to identify different time-use patterns that aggregate from individual time-use schedules like paid work, as we will demonstrate in this contribution.
Analytical approach
Since the WWG9905 consists of 96 episodes a day or 672 episodes a week starting on Monday at midnight and with the registration of only two states (i.e., work or no work), we are able to use the OM algorithm to compare the 672 episodes of each individual sequence with the homologous episodes of all other sequences. To match these sequences, we use ‘Dynamic Hamming Matching’, which allows only substitutions as a valid operation (Lesnard, 2004). Moreover, cost-setting for the operation is based on transition frequencies, which basically means that costs vary relative to the timing of sequences, that is, costs are made inversely proportional to transition frequencies between pairs of states at a given time as observed in the sample (Lesnard and Kan, 2011). The less two sequences resemble each other; the more operations (i.e., substitutions) are needed to make them both ‘match’. Summing these substitutions will provide a measure for the distance between those two sequences and OM will generate a matrix containing all mutual distances of all sequences. Hereafter, we used ‘Ward Hierarchical Clustering’ to reduce this matrix of distances to typify the most common workweeks. Both analyses are performed with the statistical program ‘R’.
After having presented the identified workweeks, we merge the WWG9905 to the individual questionnaire of the TUS9905, and we use a binomial logistic regression model to analyse the relationship of the socio-economic measures and the workweek patterns. Analyses are performed separately for men and women to compare differences in effects of the socio-economic measures.
Results
Weekly work patterns
In total, we have identified 10 weekly work patterns. For completeness, we mention that there was an 11th pattern which was highly fragmented and consisted of a low number of respondents (6.7% of the selected sample) probably as a result of days called in sick, days off or any other reasons that made the registered workweek ‘highly unstructured’. We will leave this pattern out of further analyses, which reduces the sample size to 5908 respondents.
To create a typology of weekly work patterns, we relate them to a standard workweek. As we mentioned in the previous section, the standard workweek itself will be marked off on the basis of two criteria of what is generally assumed to be ‘standard’: (a) work is performed on Monday till Friday both in the morning and afternoon (i.e., full time for about 40 h) and (b) it is the pattern containing the least work performed on non-standard work hours (i.e., work after 7 p.m. or in the weekend). This weekly work pattern is typified as the ‘standard 42 h’ workweek and serves as a reference to which all other patterns are reflected. We note that the number of work hours lies above the contractual work hours (38 to 40 h) of a typical full-time workweek in Belgium. The reason for this is that respondents to a limited extent include unpaid lunchtime and/or travel from and to work in the WWG (Robinson et al., 2002). This leads to a minor overestimation of working hours (see also ‘Discussion’ section).
We summarized all information in Figures 1 and 2 and Table 2. Figure 1 shows the tempograms or collective rhythm of work time for each weekly work pattern. The black colour in the figure represents the average percentage of people within each pattern that is working at every 15-min time slot, starting at Monday at 0 h and continuing till midnight at Sunday. Our workweek of reference is the first tempogram depicted in the figure. Based hereon, we were able to categorize all weekly work patterns in three generic types of workweeks, namely, the standard workweek (i.e., working full time only on weekdays), the extended workweek (i.e., working full time on weekdays and on non-standard hours and weekend days) and the part-time workweek (i.e., working part time by not working all five weekdays or working half days). We also have included the average numbers of hours worked and the proportional division of men and women in each pattern.
Tempograms of workweek patterns representing the percentage of people at work on different weekdays. Positioning of weekly work patterns based on total weekly hours worked and percentage of non-standard work. Non-standard work in identified weekly work patterns. Source: WWG9905; n = 5908; 18–75 years old, employed.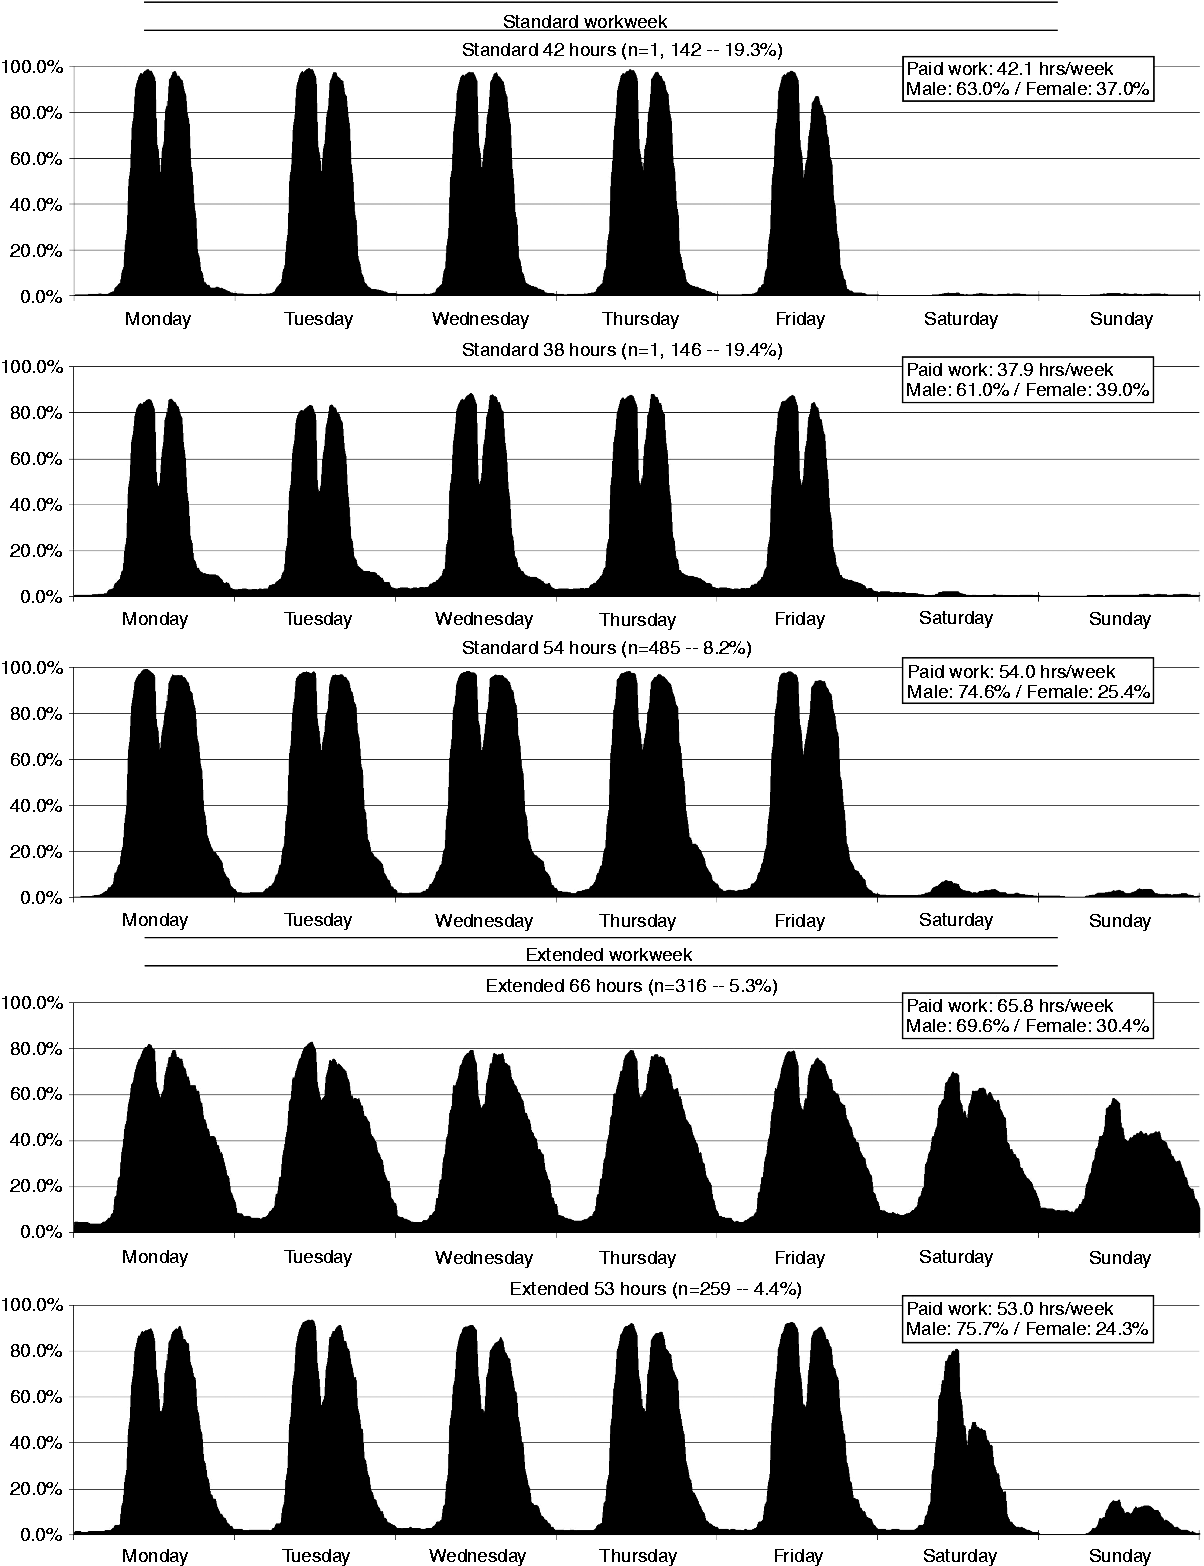
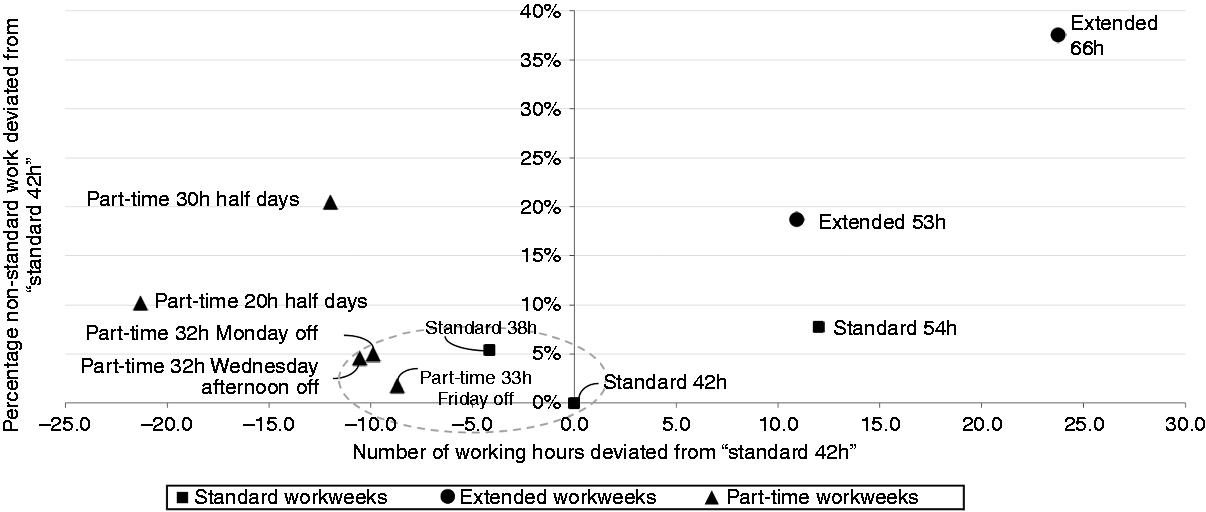
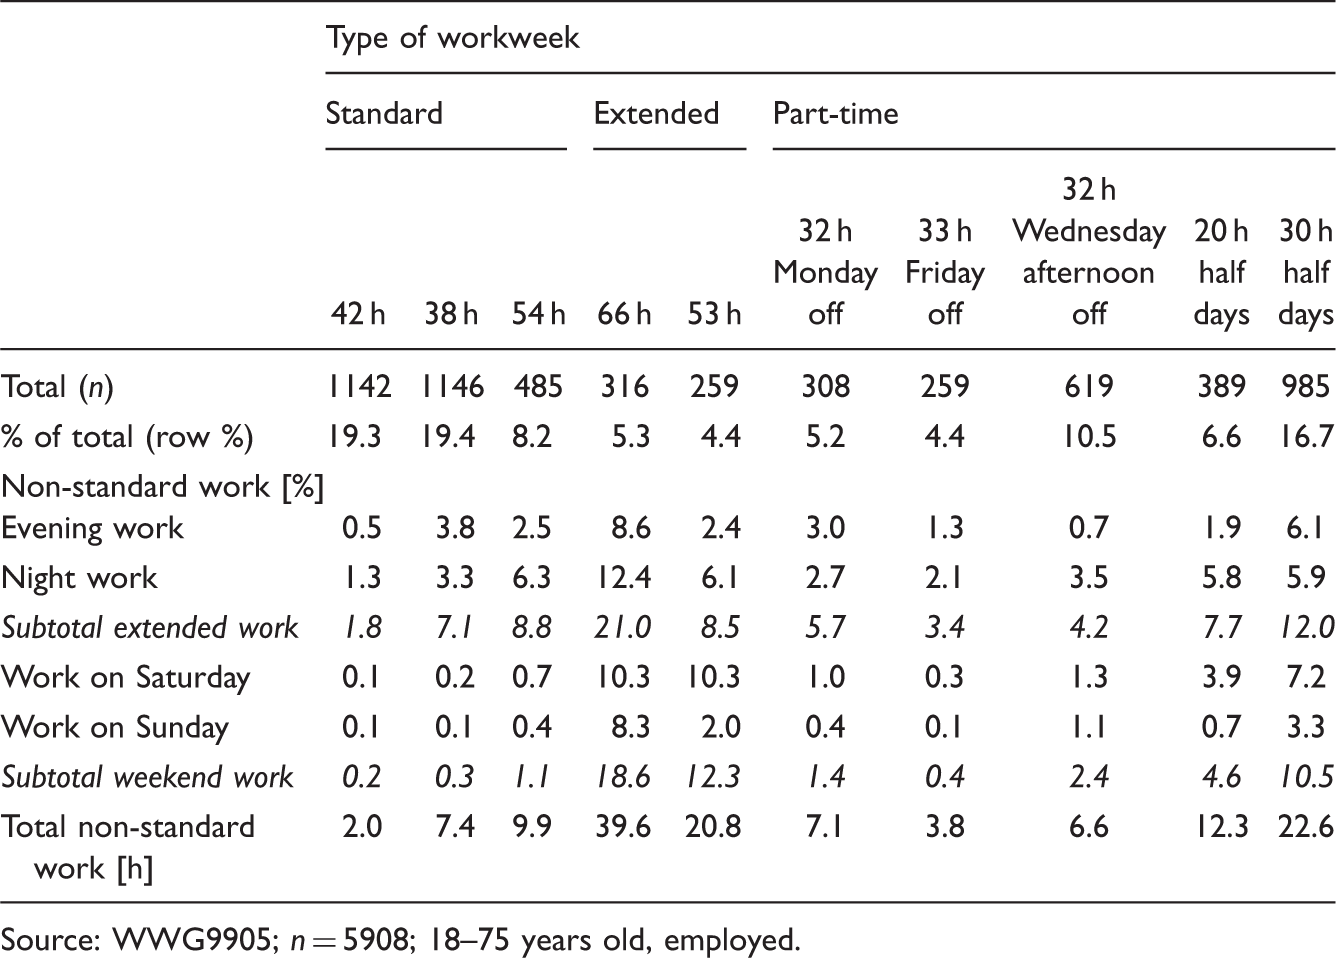
Table 2 takes a closer look at the distribution of non-standard work. It distinguishes between extended work, that is, evening work and night work on all seven days of the week, and weekend work, that is, work during Saturday and Sunday on standard hours (6 a.m. till 7 p.m.).
Figure 2 positions all weekly work patterns relative to each other in terms of total weekly work hours and the weekly percentage of non-standard work. At the origin of the graph, we positioned the ‘standard 42 h’ workweek. Both axes represent the deviation of each pattern from this reference workweek in the number of weekly work hours (horizontally) and the percentage points of non-standard work (vertically). This means that the farther a weekly work pattern is situated relative to the origin both in width and height, the less it follows a standard weekly work pattern.
Standard workweeks
Three variations of the standard workweek exist, and 56.7% of the sample falls within this category. Almost 40% of the total sample has a workweek that runs from Monday to Friday and lasts 42 or 38 h on average. The distinction between both patterns has been made on the 7.1% of evening and night work in the ‘standard 38 h’ pattern. Another 8.2% works more hours (54 h/week) due to more evening and night work (10% of total work time), but still only work on weekdays. As a result, these patterns lie close to the origin of the graph in Figure 2 This confirms that it is still reasonable to speak of standard workweeks.
Extended workweeks
The extended workweeks are named after the fact that work is continued during the weekend and also in the evening and night, as becomes clear from Figure 1. Especially the ‘extended 66 h’ weekly work pattern suggests long non-standard working hours. More than 20% of the reported work hours are performed during the evening or the night and another, almost, 20% on Saturday and Sunday (see Table 2). Equally, the ‘extended 53 h’ workweek has also over 20% of the working hours being performed on non-standard times. Although the total number of working hours almost equals the ‘standard 54 h’ workweek, twice as much paid work is performed on non-standard working periods. Based on the positions of the extended weekly work patterns in Figure 2, we may conclude that these are the least regular work-time schedules. Nonetheless, less than 10% of the selected sample has an extended workweek.
Part-time workweek
Around 40% of the sample works by a weekly part-time work schedule, and we identified five variations of part-time work (see Figure 1). Firstly, there are three weekly work patterns of around 32 working hours (almost 20% of the total sample) which consist of having a Monday off (5.2%), a Friday off (4.4%) or a Wednesday afternoon off in combination with early work ending times in the afternoon on all other weekdays (10.5%). The latter workweek pattern is a typical female pattern (68.5% within this pattern is female). Secondly, there are two workweek patterns that are part time only in terms of the number of hours worked (20 and 30 h/week, respectively). However, these patterns are characterised by a high percentage of non-standard work (12.3% and 22.6%, respectively, see Table 2). The ‘part time 20 h’ pattern is also a typical female workweek pattern (76.6% within this pattern is female). The ‘part time 30 h’ pattern is the most irregular part-time workweek (see Figure 2).
Type of workweek and social position
Binomial logistic regression analyses for three generic types of workweek by gender.
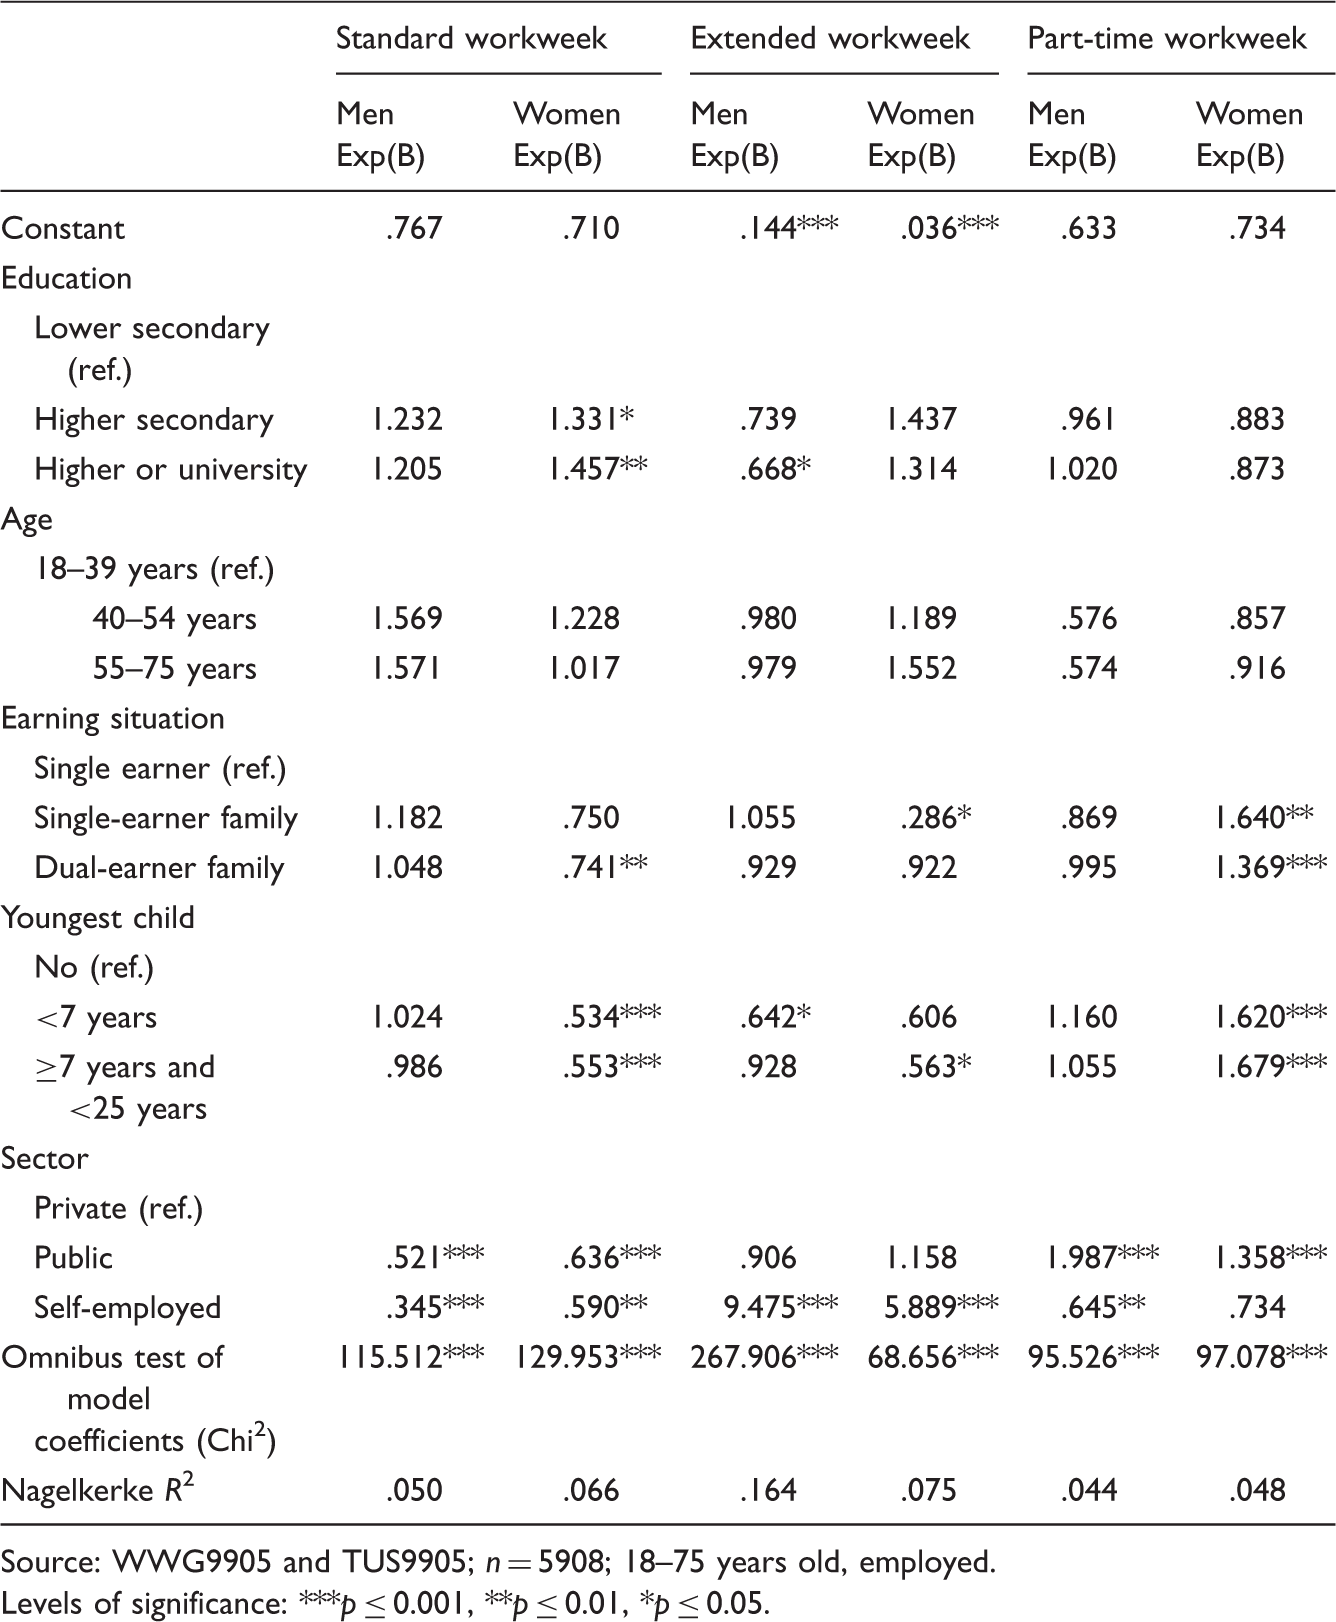
Source: WWG9905 and TUS9905; n = 5908; 18–75 years old, employed.
Levels of significance: ***p ≤ 0.001, **p ≤ 0.01, *p ≤ 0.05.
The most striking finding is that men’s chance of working either a standard workweek or a part-time workweek is not affected by socio-demographic characteristics and only by job characteristics, in this case the sector of employment. Men working in the public sector have a lower chance of having a standard workweek (OR = 0.521, p < 0.001) and a higher change of having a part-time workweek (OR = 1.987, p < 0.001). For women, we find the same significant chances for the sector of employment, but more important, earning and family characteristics seem to have a significant impact. Women who live with a working partner are less likely to work by a standard workweek (OR = 0.741, p = 0.003) and more likely to work by a part-time pattern (OR = 1.369, p = 0.001). Even women who live with a non-working partner are much more likely to work by a part-time pattern (OR = 1.640, p = 0.006) than by a standard workweek pattern although the latter is not significant. Additionally, if there are children present, regardless whether they are younger than 7 years old or not, women have a lower chance of being employed in a standard workweek (respectively OR = 0.534 and 0.553, p < 0.001) and a higher chance of being employed in a part-time workweek pattern (respectively OR = 1.620 and 1.679, p < 0.001). Education does matter for women; higher educated women are more likely to have a standard workweek pattern (OR = 1.457, p = 0.005). Finally, having an extended workweek pattern is almost only associated with being self-employed, as observed with the high-odds ratios (9.95 for men; 5.89 for women).
Discussion
Timing, social position and (non-)standard and part-time work
In this contribution, we posed two questions: when do we work and who works when? Firstly, these questions were methodologically motivated. Studies of non-standard work or part-time work hardly ever grasps the true variation hereof. Largely, this is due to the use of an unsuitable question that reduce the timing of non-standard and part-time work to the duration hereof (like in the LFS) or due to the limitations of the data since most time-use surveys only investigate one weekday or one weekend day. On the contrary, the WWG provides information of the timing of work for a whole week, and thus we used WWG to identify by what weekly work patterns we work. This truly improved previous work on weekly and daily timing of work (Glorieux et al., 2008; Lesnard, 2004; Lesnard and De Saint Pol, 2009; Lesnard and Kan, 2011) since it allowed, for example, identifying different types of a part-time workweek.
Secondly, from this methodological improvement, the social relevance stands clear. In line with Presser’s (2005) statement that the ‘standard workweek’ is not so standard anymore, we do find that only 40% of the employees in Belgium have a true standard full-time workweek (i.e., work on weekdays only, hardly any non-standard work and a total of 38 up to 42 h/week). However, this does not mean that the 24-h economy flourishes exuberantly. Most patterns only show up to 6% of night work, with an exception for the ‘extended 66 h’ workweek (12.4% of night work). Nonetheless, large part of the Belgium workforce are likely to face non-standard working times or social inequality in working times (i.e. non-standard work of blue-collar shift workers or part-time work of women).
Next to the standard workweek patterns, we also identified two extended workweeks and five variations of part-time work. These variations are the result of the number of hours worked and the percentage of work performed on non-standard working times. Unlike Presser (2005), who was able to differentiate between extended workdays and weekend work only, our extended workweeks were characterised by evening and night work and work on weekend days. The longest workweek lasted on average 66 h and contained 40% of work on non-standard working times. It involves a large share of men and, a very large proportion of self-employed, feeding the idea that extended workweeks in our case are not so much the result of the inferiority of non-standard working hours, as Hamermesh (1999) suggests, but the result of deliberate labour market choices. As we mentioned, part-time workweeks present themselves in different forms, either by (part of the) days off or by a high percentage of non-standard work.
When answering the second question of who works when, the binomial regression analyses showed very different results for men and women. Men’s likelihood of working by one of the standard or part-time workweek patterns is to a great part solely motivated by job characteristics. For women, however, family characteristics play a much more important role. Having a working partner and/or a child almost halves the chances of women working by a standard full-time workweek pattern. We do not have any information on the motivation for part-time work, so we cannot judge whether or not this is an equally deliberate choice, as it seems in the Netherlands (Booth and Van Ours, 2009). Nonetheless, regardless the motivation, it remain women who adjust their work to family demands and we demonstrated by revealing different patterns of part-time work that multiple strategies exist.
The weekly work grid
We demonstrated that the WWG is very valuable when studying the arrangements of working hours. It reveals more insights in the temporal organisation of paid work compared to working hour estimates that are ‘integrated’ over days (cfr. Hamermesh, 1999). Therefore, we argue that surveys that provide these estimates – of which the obligatory LFS is the most well known – come with a WWG, such that the ‘instantaneous’ use of time can be analysed as well. We mentioned, however, that the WWG to a limited extent overestimates the number of working hours because respondents tend to include some work-related activities like unpaid lunch breaks and/or travel to and from work (Minnen & Glorieux, 2011). Ideally, the WWG (and LFS) also come with a time-diary, since time-diaries have proven to provide less biased estimates of the time spent on different activities. A study from Robinson et al. (2002) revealed that, when comparing weekly work hours of the time-diary, work grid and survey estimate, ‘the largest average was from the estimate […], the lowest for the diary […], with the work grid in between [… providing] independent evidence that simple workweek estimate questions provide overestimates’ (2002: 48). A combined dataset including all three methods for the same respondents would settle the discussion on work time arrangements even better.
Optimal matching and time-use data
To conclude, a final word on OMA. We applied OMA – a relative new technique in time-use research – to data coming from the WWG. This leads us to positively evaluate both the usefulness of the WWG as a seven-day registration method for paid work additional to classic diary research as well as optimal matching as an effective method to identify time-use patterns (in this case patterns of paid work) without detaching these activities from their sequential occurrence in time as Lesnard and Kan (2011) do in their UK study. We also argued that we saw no reason to first identify different workdays and second identify different workweeks based on the combination of these different workdays. Although we need to be very cautious about comparing workweeks in the UK and Belgium because of different working conditions and social systems, we do see some general similarities. Both in the UK and Belgium, almost half of the employed work according to standard workweek patterns and in both countries the ‘standard workweek’ includes 42 h and only a small portion of non-standard and weekend work. Both methods are also able to distinguish between part-time work patterns of around 32 to 34 h and of around 21 h for an equal share of the sample. However, there are some differences that we might assign to a difference in approach. This concerns the nuances in the standard and part-time work patterns. Our approach yields a distinction in ‘long’ workweeks that are long because of evening and night work on the one hand and because of weekend work on the other. The same holds for part-time work, where we identified patterns that have a Monday off, a Friday off or Wednesday afternoon off. Our results underline the notion of Lesnard and Kan (2011) that ‘the overall proportion of atypical or non-standard workweeks will be underestimated if the figures are generalized from the analysis of workdays alone’ (2011: 364) when following their approach. Even though our more nuanced findings of non-standard or part-time work pattern might still be the result of different working arrangements in the UK and Belgium, they prove that the statement that results of analysing both workdays and workweeks using two-stage optimal matching ‘gives some confidence to researchers who only have day long time use data’ and that ‘analysing how work is organized at the level of the day is likely to give good insight into how work is scheduled over a longer weekend’ (2011: 364) should be taken with care. The week as a social time-cycle adds to the scheduling of working hours and, for example, even though the worked days and hours are equal, a working pattern with Monday off is different than a working pattern with Friday off.
Footnotes
Acknowledgements
The authors are thankful to the anonymous reviewer for her/his extensive comments, which truly helped improving this contribution.
Declaration of Conflicting Interests
The author(s) declared no potential conflicts of interest with respect to the research, authorship, and/or publication of this article.
Funding
The author(s) disclosed receipt of the following financial support for the research, authorship, and/or publication of this article: This research was supported by the Research Foundation – Flanders (FWO) (G.0.267.08 N.10).