
Abstract
Infographics of modest complexity are commonly used to convey knowledge to non-experts. However, little is known regarding how the use of infographics may convince the public and lead to massive behavioral changes in response to an acute cause. In March 2020, scientists and journalists revamped a scholarly published graph into the “flatten the curve” (FTC) mantra that defined the United States’ initial response to the COVID-19 pandemic. This study examined how Americans’ awareness of the flatten the curve charts relates to their perceived effectiveness of social distancing measures, perceived controllability of the pandemic, and behavioral intentions toward social distancing measures. Implications on visual communication of science are discussed.
1. Introduction
The 2019 novel coronavirus (COVID-19) emerged in December 2019 after originating in Wuhan, China and was declared a global pandemic by the World Health Organization (WHO, 2020) on 11 March 2020. While a massive global health campaign was quickly launched to slow the spread of the virus, the United States surpassed all other countries with the highest number of infected cases and deaths during early months of the pandemic (Centers for Disease Control and Prevention (CDC), 2020).
The United States’ initial public health response to COVID-19 centered around a concept called “flatten the curve” (FTC). The first published instance of FTC can be found in a 2007 report from the Centers for Disease Control and Prevention (CDC, 2007), which provides guidance on mitigating the effects and spread of global pandemics like COVID-19. The visual representation of this concept includes two bell-shaped curves: “one had a steep peak indicating a surge of coronavirus outbreak in the near term; the other had a flatter slope, indicating a more gradual rate of infection over a longer period of time” (Roberts, 2020). “FTC,” in this case, means to reduce the harms of COVID-19 through non-pharmaceutical interventions, such as practicing social distancing, improving personal hygiene, and implementing voluntary home quarantine of confirmed cases before an effective vaccine becomes available (CDC, 2007; Qualls et al., 2017).
While non-pharmaceutical interventions and health care system capacities were used as warnings about the risks of pandemics in the 2000s by the WHO and CDC, especially after the 2002–2004 Severe acute respiratory syndrome (SARS) outbreak and the 2009 swine flu pandemic (Ferguson et al., 2020; McCarthy and Shi, 2020; Rudisill, 2013), the FTC concept was first visually introduced to the public when COVID-19 hit the United States. It was originally introduced by journalists at The Economist (The Economist, 2020), and then recreated and disseminated on Twitter by public health expert Drew Harris (2020). Harris’ sketchy demonstration of the FTC concept was subsequently illustrated into an animated cartoon by cartoonist Toby Morris and popularized by Siouxsie Wiles (2020b), a microbiologist, for the New Zealand online magazine The Spinoff on 10 March 2020. Since then, countless static and animated versions of this graphic were replicated and used to communicate the concept across mainstream news outlets and social media. As of November 2020, the hashtag #FlattenTheCurve has over 1.5 million uses on Instagram (2020). According to Google, the term of “flatten the curve” was searched for 10–100,000 times on average per month between March and October 2020, with its highest peak occurring between 15 and 21 March 2020 (Google Ads, 2020; Google Trends, 2020).
Meanwhile, the FTC concept and its visual representations have been widely used by health scientists and governmental officials to convince the public of the benefits of social distancing measures (Chow and Abbruzzese, 2020). Some believed that the simplicity and visual appeal of the FTC charts make the information digestible and enhance viewers’ comprehension and acceptance of the concept (Weinberg, 2020). In addition, since the FTC charts explicitly visualize how collective actions against the spread of virus can bring the pandemic under better control, viewers may be motivated to follow the CDC’s guidelines on protective measures due to enhanced perceptions of self-efficacy.
Using a nationally representative sample of US adults (N = 500), this study investigated the effects of the “FTC” charts on American’s perceptions of and behavioral intentions toward social distancing measures recommended by the CDC. In addition, we examined whether awareness of the FTC charts would enable individuals to engage in systematic processing and become less reliant on cognitive heuristics, such as trust in medical professionals, scientists, and the CDC, to assess the effectiveness of social distancing measures and controllability of the COVID-19 pandemic. We discussed the usually overlooked role of information visualizations as persuasive devices for communicating science and recommended strategies for future design practices.
2. The “flatten the curve” chart: From a scientific graph to a “meme”
In December 2019, pneumonia cases caused by an unknown pathogen were reported in Wuhan, Hubei, China. After multiple sample collections and laboratory analyses, the pathogen was identified as a novel coronavirus named “severe acute respiratory syndrome coronavirus 2 (SARS-CoV-2)” by the International Committee of Taxonomy of Viruses (Liu et al., 2020). The World Health Organization declared a public health emergency on 30 January 2020 and named the disease “COVID-19” on 11 February 2020. On 11 March 2020, the WHO declared COVID-19 a global pandemic; President Donald Trump declared a national emergency in the United States 2 days later (The White House, 2020). While the first confirmed US case was discovered in Washington state on 20 January 2020 (National Public Radio (NPR), 2020a), there were confirmed cases reported in every state by 17 March (CDC, 2020).
As scientists around the world researched the symptoms and effects of the virus, a memo dated 14 February 2020 from the National Security Council titled “U.S. Government Reponses to the 2019 Novel Coronavirus” outlined mitigation measures, including “significantly limited public gatherings and cancellation of almost all sporting events, performances, and public and private meetings that cannot be convened by phone, consider school closures” (Lipton et al., 2020) among others. The official national guidelines issued by the White House came on 16 March and recommended that Americans stop unnecessary travel, avoid bars and restaurants, and do not congregate into groups of more than 10 people (Rogers and Cochrane, 2020).
Meanwhile, the concept of “FTC” was used by governmental officials, epidemiologists, and journalists to educate the public on the effectiveness of social distancing measures and to encourage behavioral changes (Makulec, 2020; NPR, 2020b; Roberts, 2020). The first published instance of FTC can be found in a 2007 report published by the CDC, which provides interim guidance for mitigating influenza pandemic at the community level (CDC, 2007). The major goals of community mitigation, as outlined in this report, are to (1) “delay outbreak peak,” (2) “decompress peak burden on hospitals/infrastructure,” and (3) “diminish overall cases and health impacts” (CDC 2007: 9). These goals are well demonstrated using an illustrative graphic with two bell-shaped curves, later known as the “FTC” chart (Figure 1a). Reproductions of this chart were included in the finalized guidance published by CDC in 2017 as well as in the European Centre for Disease Prevention and Control’s (ECDC, 2009) guide to influenza pandemic mitigation.
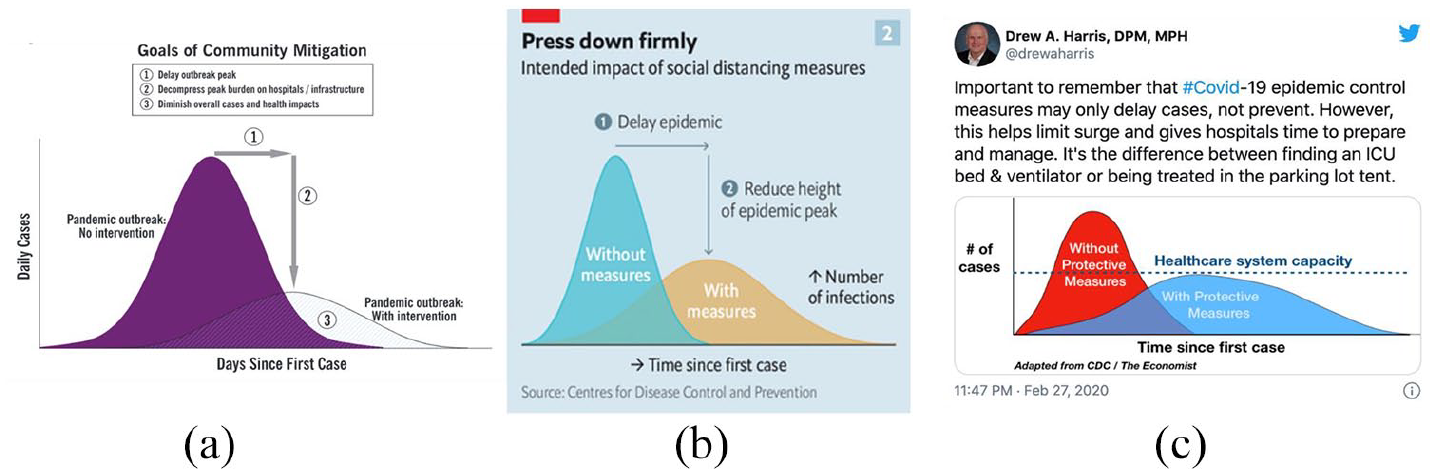
(a) The “Goals of Community Mitigation” graphic in the CDC report that first mentioned the phrase “Flatten the Curve” in 2007 (CDC, 2007). (b) The “Flatten the Curve” chart reproduced by The Economist (The Economist, 2020). (c) Drew A. Harris’ tweet containing his version of the FTC graphic (Harris, 2020).
In February 2020, journalists at The Economist rebuilt the CDC graphic and used it to explain the benefits of social distancing measures amid the COVID-19 pandemic (Figure 1b). Although the designer claimed that she “didn’t want to editorialize the work of scientists” (Wilson, 2020), the resulted visual deviated from the original design. As shown in Figure 1a, the CDC chart uses a visibly smaller area under the curve of “with interventions” to imply fewer overall cases; however, such visual difference is eliminated from The Economist’s graphic (Figure 1b). The edited graph, as argued by some data scientists and observers, could induce an illusion that intervention measures only delay the outbreak peak but not reduce the overall public health impact (Bach, 2020).
Later, when Drew Harris, a population health analyst at the Thomas Jefferson University saw The Economist article, he decided to recreate the graphic and post it on his Twitter account (Figure 1c). In Harris’ chart, he changed the color scheme to make the contrast of two curves visually salient and added an extra dotted line labeled “healthcare system capacity” “to make clear what was at stake” (Roberts, 2020). Along with this reproduced chart, he argued that “COVID-19 epidemic control measures may only delay cases, not prevent. However, this limits surge and gives hospitals time to prepare and manage.” These edits and reinterpretations ultimately turned the chart into a visual mantra that went viral and defined the United States’ initial response to the COVID-19 pandemic (Wilson, 2020).
Nonetheless, Harris’ chart and its replications did not correct the visual misrepresentation noted earlier and somewhat conflicted with the degree of scientific rigor in the original graph published by CDC (Amidon et al., 2020). What is more, the original FTC chart and its derivatives obscured the nature of both curves as mathematical projections and omit uncertainty involved in statistical modeling (Amidon et al., 2020). They also presented rhetorical limitations by metaphorizing the pandemic risk into a “single-peak curve” instead of multiple-peak “waves,” which was more akin to the reality (Amidon et al., 2020).
Despite the downsides, the renditions of the FTC chart effectively lay out how virus transmission works and explain the exponential change, showing how the number of infected cases is about trending, not fixed numbers (Rawlins and Labarre, 2020). As Mother Jones journalist Abigail Weinberg (2020) argued, There are no actual numbers, and the curves are entirely theoretical so in truth there was nothing particularly rigorous about the chart. It was a work of the imagination, too artless to be art but lacking the hard empiricism we expect of science. That in-betweenness is what made it so effective.
3. Infographics as persuasive devices for science communication
Information visualizations (also known as “infographics”) have been commonly used to communicate scientific facts related to public health issues (Alcíbar, 2017). When designed properly, scientific infographics can illustrate concepts, clarify data patterns, provide aesthetic pleasure, as well as engage both specialists and laypersons (Frankel and DePace, 2012; Trumbo, 1999). For instance, health care professionals frequently use infographics combining texts and easy-to-understand graphs (e.g. pictographs, bar graphs etc.) to help patients comprehend the risks and benefits associated with medical treatments (see Garcia-Retamero and Cokely, 2017 for a review). Decades of research on health literacy have emphasized the importance of using information visualizations to enhance the public’s comprehension of medical facts by leveraging existing visual analysis skills while reducing the demand on literacy and numeracy competencies (Bakken et al., 2020, Garcia-Retamero & Cokely, 2017).
Despite the popular use and educational benefits of infographics in the contexts of science or health communication, scholars have argued that such devices can be used for persuasive purposes (Lazard and Atkinson, 2015). According to the Elaboration Likelihood Model, infographics play a critical role in facilitating individuals’ systematic processing of the shown information by integrating both textual and visual components (Lazard and Atkinson, 2015). Research showed that non-expert audiences report a higher level of elaboration tendency when viewing infographics depicting issues of recycling and food labeling than when viewing a purely textual or visual message. The effects held consistent for people with varying learning styles and different levels of visual literacy (Lazard and Atkinson, 2015).
In addition, infographics that are visually simple can be potentially more effective than the ones presenting more complexity. Visual simplicity refers to the perception that a visual message presents “orderliness, balance, and clarity—the concepts of figural goodness defined by Gestalt psychology” (Lazard et al., 2015: 2). From a designer’s perspective, simplistic features of an infographic can include, but are not limited to, minimum number of objects, high similarity of objects, symmetry, and regularity of object arrangement (Lazard and Mackert, 2014). Research showed that non-experts tend to perceive high level of comprehension difficulty and refrain from further processing when viewing infographics that are overly complex, such as showing large amount of information, using multiple colors, and containing “densely packed visual elements” (Harold et al., 2020: 255), such as error bars or confidence intervals. Scholars have suggested that keeping infographics visually simple can reduce the cognitive burden of systematic processing and therefore enhance the message’s cognitive and persuasive effects (Harold et al., 2020).
Infographics of visual simplicity were shown to enhance individuals’ understanding of information described in numeric or scientific terms (Garcia-Retamero and Cokely, 2013, 2015). Enhanced comprehension resulting from infographic exposure can subsequently increase self-efficacy (Reddy, 2020) and/or lead to positive behavioral change (Garcia-Retamero and Cokely, 2013; Houts et al., 2006). Results of a large longitudinal survey with young adults showed that the effects of simple and memorable visual aids can be as effective as extensive educational interventions when being used to promote condom use among this population (Garcia-Retamero and Cokely, 2015).
Nonetheless, infographics of poor design could distort viewers’ understanding or even decrease their perceived quality of the shown information despite presenting visual simplicity (Parrott et al., 2005; Schapira et al., 2001). Results of an experiment with 206 participants suggested that when being used to demonstrate a complex scientific concept (e.g. the interrelationship between genes, environment, and health), infographics consisting of simple charts and intense texts are not better comprehended when compared to an easy textual explanation (Parrott et al., 2005). In fact, approximately one-fifth of American adults perform at the lowest levels in literacy (U.S. Department of and Education, 2017); even those who possess higher health literacy skills prefer shorter, simpler text (Ancker et al., 2006). A scientific infographic needs to present adequate verbal and visual simplicity to render itself accessible and convincing to the audience (Ancker et al., 2006; Houts et al., 2006).
Noticeably, Harris’ FTC chart and its renditions are excellent examples of scientific infographics that present both visual and verbal simplicity. Instead of showing and explaining the multiple benefits of community intervention measures, the revamped FTC chart helped viewers refocus on the importance of sustaining the healthcare system’s capacity amid the initial surge of COVID-19 cases (Sentell et al., 2020). This concise yet effective message resonated with many Americans who were worried about the availability of hospital supplies, services, and treatment during the early months of the pandemic (Saad, 2021). In part due to the design appeal, simplicity and proper tailoring, the FTC charts not only demonstrate critical facts that assist in citizens’ decision-making, but also become the “iconic image with the power to steer arguments and ‘speak for themselves’ in the public sphere” (DiFrancesco and Young, 2011: 533).
With these considerations, we hypothesized that awareness of the FTC charts would allow viewers to engage in systematic processing of the concept and lead to more positive perceptions regarding the effectiveness of social distancing measures. In addition, awareness of the FTC charts should link to viewers’ perceived controllability of the COVID-19 pandemic and their willingness to engage in preventive behaviors against COVID. Three hypotheses were raised as follows:
H1a. People who were aware of the FTC charts would be more likely to perceive social distancing measures to be effective than those who were unaware.
H1b. People who were aware of the FTC charts would be more likely to believe the COVID-19 pandemic is controllable with interventions than those who were unaware.
H1c. People who were aware of the FTC visuals would have more intentions of performing social distancing behaviors than those who were unaware.
Assuming exposure to the FTC charts would lead to systematic processing of the concept, we wondered if people who were aware of the FTC charts would be less reliant on cognitive heuristics, such as trust in institutions that manage public health, than those who were unaware when assessing the effectiveness of social distancing measures and the controllability of the COVID-19 pandemic. Social trust in institutions responsible for managing uncertain risks can function as a cognitive heuristic that shapes individuals’ risk judgments for unfamiliar and uncertain hazards (Cummings, 2014; Siegrist and Cvetkovich, 2000). Most recent research suggested that trust in government, science, and medical professionals serve as significant predictors for people’s risk perceptions regarding the COVID-19 pandemic (Dryhurst et al., 2020). More importantly, trust in governmental agencies closely relate to individuals’ acceptance of social distancing measures in the United States (Fridman et al., 2020). It is reasonable to infer that social trust in scientists, CDC, and medical professionals will function as mental shortcuts that enable individuals to assess (1) the effectiveness of social distancing measures and (2) the controllability of the pandemic, which has been conceptualized as one dimension of risk (Sandman, 1989).
Nonetheless, for those who have seen the FTC charts and hence acknowledged the underlying concept, their heuristic processing tendency might be mitigated. As viewers understood the collective benefits associated with the social distancing measures (e.g. sustaining the capacity of medical systems and delaying the pandemic peak), they might perceive such measures to be effective despite their levels of trust in public institutions. In other words, the relationship between trust and perceived effectiveness of social distancing measures could be less significant among people who were aware of FTC charts than among those who were unaware. Similarly, the relationship between perceived controllability of COVID-19 and trust in public institutions could be moderated by FTC awareness as well. Therefore, H2a and H2b were raised:
H2a. The relationship between perceived effectiveness of social distancing measures and trusts in scientists, CDC, and medical professionals would be less significant among those who were aware of FTC charts than among those who were unaware.
H2b. The relationship between perceived controllability of the COVID-19 pandemic and trust in scientists, CDC, and medical professionals would be less significant among those who were aware of FTC charts than among those who were unaware.
4. Research methods
Data collection
Data were collected by the SSRS those an online survey sample of 500 US adults between 23 July and 3 August 2020. SSRS Opinion Panel members are recruited randomly based on nationally representation ABS (Address Based Sample) design. In addition, a bilingual, random-digit dialing (RDD) platform was used to recruit participants from under-represented groups, such as Hispanics, African Americans, lower education, or lower income populations. The survey was administered online and lasted 7.9 minutes on average. Multiple email invitations were sent to ensure all panelists could participate. Participants received US$5 in the form of an electronic gift card upon the completion of the study. In total, 1297 panelists were contacted; the response rate was 43% for the RDD sample and 35% for the ABS sample. All responses were weighted using the weights adjusted for sex, age, education, census region, civic engagement, household telephone usage, and Internet access.
Measures
FTC awareness
Awareness of the FTC graphs was measured by asking participants if they have seen anything like the shown images since the beginning of the pandemic. The shown images were a collage of nine FTC charts published on a variety of outlets (e.g. mass media, blogs, university websites, etc.). While all charts showed similar curve patterns, they were of various colors and styles (e.g. comics, scientific charts, static and animated charts, etc.). Such images should represent the diversity of FTC charts and maximize the chances of accurately reporting awareness. Overall, 73.6% of respondents indicated being aware of the FTC charts.
Perceived effectiveness of social distancing measures
Four items were used to measure respondents’ perceived effectiveness of the social distancing measures recommended by CDC. Using a 7-point scale (1 = “very unlikely,” 4 = “neutral,” 7 = “very likely”), the question asked how likely each of the given scenarios would have happened “if most Americans had followed the CDC’s recommendations and practiced social distancing.” The four scenarios were “the outbreak would have slowed down” (M = 5.89, SD = 1.54), “fewer people would have been infected” (M = 5.89, SD = 1.51), “more lives would have been saved” (M = 5.82, SD = 1.60), and “hospitals would have been less crowded” (M = 5.95, SD = 1.45). The mean value of the four items was used to measure the overall perceived effectiveness of social distancing measures (Cronbach’s alpha = .96, M = 5.89, SD = 1.44).
Perceived controllability of COVID-19
Participants were also asked to indicate whether they think the COVID-19 pandemic is controllable with interventions on a 5-point scale (1 = “uncontrollable,” 5 = “controllable”). In total, 38.3% thought the pandemic is controllable, while only 6.6% believed it is uncontrollable (M = 3.81, SD = 1.23).
Behavioral intention
Behavioral intention was measured by asking participants how likely it was that they would practice social distancing the next 2 weeks on a 7-point scale (1 = “very unlikely,” 4 = “neutral,” 7 = “very likely”). More than 70% participants indicated they were “very likely” to practice social distancing in close future (M = 6.35, SD = 1.38).
Trust in medical professionals/scientists/CDC
Trust was measured by asking individuals to indicate their confidence in “medical doctors and nurses,” “scientists,” and “the CDC,” respectively, using a 5-point scale (1 = “no confidence at all,” 5 = “a great deal of confidence”). On average, trust in medical professionals (M = 4.15, SD = .89) was higher than that in scientists (M = 3.9, SD = 1.0) and in the CDC (M = 3.58, SD = 1.10).
COVID-19 history
To rule out the potential confounding effects of people’s experiences with COVID-19 on the outcome variables, we asked participants if they have ever had, or thought they might have had COVID-19 in the past. Among our sample, 20.8% indicated they had or thought they might have been infected.
Political leaning
Considering the potential impact of political leaning on the outcome variables, we included it as a control variable in the model. Two items on party identification and political ideology were standardized and combined to measure political leaning (Pearson r = .66, M = 0, SD = .91). Party identification was measured on a 6-point scale (1 = “strong Democrat,” 6 = “strong Republican”) (M = 3.62, SD = 1.64). Political ideology was measured by a 5-point scale (1 = “very liberal,” 3 = “moderate,” 5 = “very conservative”) (M = 2.99, SD = 1.07).
Demographics
Age was measured using an ordinal variable with 20.3% being 18–29 years, 33.7% being 30–49 years, 25.2% being 50–64 years, and 20.8% being above 65 years old. Gender wise, 51.3% of participants were females. In terms of educational attainment, 38.4% were high school graduates or below, and 32.5% of the respondents had finished college. The median household income level was between US$50,000 and US$75,000. In addition, 62.2% were White. All demographical variables were included as control variables in the analytical models.
Analytical framework
We hypothesized that awareness of the FTC charts is positively related to (1) perceived effectiveness of social distancing measures, (2) perceived controllability of COVID-19, and (3) behavioral intentions toward social distancing measures. In addition, we proposed that the relationship between trusts in multiple institutions (i.e. medical professionals, scientists, and CDC) and perceived effectiveness of social distancing should vary as a function of FTC awareness. The same hypothesis was as well proposed for the dependent variable of perceived controllability of COVID-19.
To test these hypotheses, we fitted a series of multiple linear regression models embodying the interaction terms of FTC awareness × trust variables; the lower order items were also included in the models. To avoid the potential multilinearity problem introduced by including multiple trust variables in the same model, we regressed each of the trust variables on the other two along with political leaning as these variables were highly correlated with each other; the residuals were saved and used as the independent variables in the models. This approach of residual centering has been shown to effectively remove unwanted collinearity between items (Geldhof et al., 2013).
5. Findings
In general, older, non-White people were more likely to perceive social distancing to be effective and more willing to engage in such behaviors than their younger and White cohorts. Larger scale surveys found a similar trend that older people adopted mitigating behavioral changes more than young people as the pandemic progressed overtime (Kim and Crimmins, 2020). Being a member of a racial minority group also significantly predicts people’s willingness to engage in such behaviors (Kim and Crimmins, 2020). In addition, liberal Democrats were more likely to believe that social distancing is effective, COVID-19 is controllable with interventions, and more willing to practice social distancing than conservative Republicans. Trusts in social institutions, including medical professionals, scientists, and the CDC, were positively related to all outcome variables. People who indicated they either had or thought they might have COVID were more likely to believe that social distancing is effective, and the pandemic is controllable with interventions.
H1a hypothesized that FTC awareness is positively related to perceived effectiveness of social distancing. The ordinary least squares (OLS) regression results showed that the relationship between these two variables is not significant (see Table 1). H1a was therefore rejected. In a similar vein, neither the main effect of FTC graph awareness on perceived controllability of COVID-19 nor that on behavioral intention was significant (see Table 1). H1b and H1c were rejected. In other words, approximately 4 months after the FTC concept was introduced and popularized by scientists and the media, people who were aware of the concept’s graphical demonstrations did not have significantly different perceptions of and behavioral intentions toward social distancing compared to those who were unaware.
OLS regressions predicting three outcome variables.

CDC: Centers for Disease Control and Prevention; COVID: coronavirus disease; FTC: flatten the curve; OLS: ordinary least squares.
Total N = 500. Standardized coefficients (β) were reported for main effects. Before entry betas were reported for interactive effects.
p < .05; **p < .01; ***p < .001.
H2a hypothesized that the relationships between trust in different social institutions (i.e. medical professionals, scientists, and the CDC) and perceived effectiveness of social distancing would vary as a function of FTC awareness. This hypothesis was rejected, as none of the interaction terms was significant for the dependent variable of perceived effectiveness (see Table 1).
H2b hypothesized that the relationships between trust in various institutions and perceived controllability of COVID-19 would vary as a function of FTC awareness. The results were mixed. On one hand, people who were aware of the FTC charts were less likely to rely on their trust in scientists to perceive the controllability of COVID-19 compared with those who were unaware (β = –.17, p < .05; Figure 2a). This result indicated that exposure to informative visualizations may help individuals mitigate their reliance on trust in scientists as a cognitive heuristic to make judgments regarding the controllability of the pandemic.

(a) Interactive effect of trust in scientists and FTC awareness on perceived controllability of COVID-19. (b) Interactive effect of trust in CDC and FTC awareness on perceived controllability of COVID-19.
However, a reverse trend was observed for the interactive effect of trust in CDC and FTC awareness on perceived controllability of COVID-19 (β = .39, p < .001). As shown in Figure 2b, trust in CDC was only positively related to perceived controllability for those who were aware of the FTC charts. For those who were unaware, the relationship was nearly flat, indicating that people in this group do not rely on their trust in CDC to infer the controllability of COVID-19. A post hoc analysis revealed that people who are unaware of the FTC charts are likely to be conservative, of lower socioeconomic status and non-White. This sample segment also showed relatively low level of trust in the CDC; the non-relationship between trust and the dependent variable could be potentially due to a lack of variance in the independent variable for this sub-group.
6. Discussion
The COVID-19 pandemic presents one of the greatest public health threats in modern history and offers a quasi-experimental context wherein the effectiveness of science communication efforts can be observed. Using a nationally representative sample of the US public, this study examined the relationship between individuals’ awareness of the “FTC” charts and their perceptions of and behavioral intentions toward the social distancing measures during the COVID-19 pandemic. The various renditions of the FTC chart were well received by the United States public as nearly three quarters of the survey respondents reported being aware of them 5 months into the pandemic. However, chart awareness did not significantly relate to perceived effectiveness of social distancing measures or controllability of the pandemic. People who were aware of the FTC charts did not differ in their behavioral intentions toward social distancing compared to those who were unaware. Nonetheless, awareness of the FTC charts exhibited potentials in mitigating individuals’ reliance on cognitive heuristics, such as trust in scientists, when assessing the controllability of COVID-19. Before discussing the findings in more depth, we noted a few methodological limitations inherent to the study.
First, although the study presented ecological validity by examining the public’s real-time awareness of the FTC charts and attitudinal changes, the results could be confounded by the ongoing COVID-19 pandemic. The US daily cases originally rose in March 2020 and remained steady until late June (CDC, 2020), the country then hit a second peak in infected cases when the data were collected between late July and early August. On 3 August 2020, Deborah Birx, the coronavirus response coordinator, announced that the United States “has entered a new phase” in the pandemic as infections remain widespread across all areas and kill more than 155,000 by that time (AJMC, 2020). Due to the exacerbated pandemic and heightened public concern, participants might acknowledge the effectiveness of social distancing measures and be willing to comply despite not having seen a visual representation of the FTC concept at the time of data collection. These unexpected events could introduce an uncontrollable factor that diminished the relationship between FTC awareness and the outcome variables. We would caution against any over underestimation of the effectiveness of FTC charts based on the insignificant findings of this study.
Second, although the quasi-experimental context was present, the cross-sectional nature of the survey data prevented us from drawing any concrete conclusions regarding the causality between FTC awareness and the outcome variables. Future studies should conduct controlled experiments using appropriate samples to answer the core question raised by this study: Can the use of (simple) infographics regarding science cause attitudinal and behavioral changes among the audience? As information visualizations have been increasingly used for communicating science to the public, it is important to empirically test their effectiveness and investigate the design features (e.g. verbal and visual simplicity) that make them effective.
The popularity of FTC charts exemplifies how an expert-generated concept and visualization can be revamped into a mantra that helps inform the public regarding science. The simplicity and visual appeal of the reproduced FTC charts have effectively attracted laypersons’ attention and facilitated participatory discussion between them and scientists on social media. Although we did not detect any main effects of the FTC charts on individuals’ perceptions of or behavioral intentions toward social distancing, we believed the wide popularity of FTC charts as indicated by the survey results would imply the successfulness of this public education effort initiated by individual scientists and journalists.
In addition, the potential effectiveness of the FTC charts can be demonstrated by the significant interactive effects of FTC awareness and trust in scientists on the perceived controllability of COVID-19. Social trust in institutions responsible for risk management function as a cognitive shortcut that shapes one’s perception of an uncontrollable and involuntary hazard. However, such a tendency can be mitigated by exposure to mediated messages that are informative and convincing. As the results indicated, people who were aware of the FTC charts were less likely to rely on their trust in scientists as one of the major risk-managing institutions to assess the controllability of the pandemic than those who were unaware. As a result, exposure to FTC charts may bridge the attitudinal gap between those with high and low level of trust in scientists.
The FTC chart exemplifies how scientists, journalists, and policymakers can use simple information visualizations to revamp an otherwise abstruse scientific concept into a visual mantra that serves the public’s interest. Its popularity also proves how social media can broaden the societal discussions of science by enabling individual scientists to reach out to a wider audience. Scientists, in this case, serve as key disseminators of knowledge for a bewildered public that craves a quick and accessible explanation of science in the face of an acute cause.
Nonetheless, while simple infographics present great potential to build knowledge and (health) literacy, it is important to accommodate such visuals with accurate and understandable explanations or stories. Unlike words, visuals cannot convey precise relationships between the depicted subjects, presence of misleading visual cues, or a lack of meaningful explanation can result in miscommunication with long-lasting impact.
Future practices should accurately visualize scientific information and complement the visual representation with clear messaging that allows the viewers to make informed decisions. More importantly, such visual representations should present adequate simplicity, both verbally and visually, to lower viewers’ cognitive burden and enhance the messaging effectiveness. The goal is not only to promote the viewers’ understanding of science, but also to equip them with necessary knowledge and skills to see the rationale behind science and relate themselves to the scientists’ conclusion.
Footnotes
Funding
The author(s) received no financial support for the research, authorship, and/or publication of this article.