



Abstract
Abstract
In today’s fast moving and dynamic world, short-term investors face difficulty while choosing which avenue to invest in. Investors view investment in securities as a highly risky avenue due to VUCA (Volatility, Uncertainty, Complexity and Ambiguity) pertaining to future movement of security prices. The study has been carried out to analyse the post-Initial Public Officer (IPO) performance of various companies that have gone public in 2017 using event study methodology. The study also tries to determine whether these IPOs were underpriced in short run and identifies various factors that influence the movement of such IPOs in the short run. The study found that about 70 per cent of the selected IPOs are underpriced in short run and the movement of these IPOs in short run is not influenced by the age of the company, issue size of the IPO, ownership sector and the promoter’s holdings after the issue.
Introduction
In recent years, there has been a tremendous increase in the number of Indian firms which went public. These firms aim to obtain funds for various purposes such as expansion, diversification, financing their working capital needs, purchasing an asset, debt reconstruction, etc. One of the major sources of raising required funds for these firms is by opting for an Initial Public Offer (IPO). Chauhan defined an IPO as a process of selling of securities to the public in the primary market.
Since opening up of the economy in 1991, the Indian IPO has witnessed various reforms, policy changes, technological advancements and restructuring. As a result, the Indian IPO market has been booming tremendously as the number of companies going public and issuing equity shares in the capital market have increased rapidly. Narang (2017) said that issuing companies rigorously try to achieve full subscription by attracting all the potential investors and aim at fixing the prices of IPO in a better way by strengthening their understanding of the price behaviour of IPOs.
The year 2017 can be regarded as the golden year for the Indian IPO market as the total capital mobilized through IPOs hit a 6-year high in 2017. A total of US$11.6 billion was raised by over 150 companies, including small- and medium-sized enterprises, the highest since 2011. The year 2017 saw many of the IPOs giving investors positive returns with few of them giving as high as 500 per cent returns during the same day. On the other hand, nearly 50 per cent of the companies which issued IPOs in 2017 outperformed the market since their issuance. This clearly indicates that when compared to equity market, the risk faced by the investors in the primary market is not any lower. Thus, this shows that the odds are clearly against the investors and they need to take utmost caution while investing in IPOs today.
Due to the existence of high risk while investing in an IPO, the investors face a dilemma of whether to invest in IPOs or not and thereby come across various questions such as what are the various factors that affect the post-IPO performance? What should be the time horizon for investment in IPOs to maximize the returns in short run? How is the valuation of IPOs done? Thus, the study has been undertaken
To analyze the initial day returns as well as following days return over and above the benchmark index for selected companies issuing IPO in 2017 by using event study methodology and to identify various factors that influence the return performance of IPOs in Indian Stock Market.
Literature Review
Hawaldar, Naveen Kumar and Mallikarjunappa (2018) found book-built IPOs are underpriced compared to fixed-price IPOs by lower magnitude. Malhotra and Premkumar (2017) found underperformance of IPO in the long run. Furthermore, they observed no significant impact of firm age, company size and time lag on the performance of IPO issue. Hoechle, Karthaus and Schmid (2017) observed underperformance of matured firms over 2 years. Poornima, Haaji and Deepha (2016) observed IPOs can be considered as both long-term investment tool and speculative tool. Ambily (2016) found that majority of IPOs gave positive returns and largely the investments in these IPOs were done on the basis of company’s image rather than fundamental analysis. Devarajappa and Tamragundi (2014) found that the fluctuations in the returns from a particular stock are influenced by various factors such as the performance of companies, speculation and other external factors. Mittal, Gupta and Sharma et al. (2013) studied the performance of IPOs across various sectors, over different time frames and tried to determine the impact of performing sectors on non-performing sectors. The results of the study indicated that the public sector stocks performed well in both short run and long run and outperformed other sectors too. The manufacturing sector appeared to be performing the least in the short run as well as in the long run. Sahoo and Rajib (2010) studied the price performance of 92 IPOs issued during the years 2002–2006 up to a period of 36 months including listing day. The study found that Indian IPOs were underpriced by 46.55 per cent on listing day when compared to market index. The study also brought to light that investors who invested in the IPOs through direct subscription earned positive returns throughout the 36 months and the investors who invested in IPOs on listing date earned negative return up to 12 months after which they earned positive returns. Sabarinathan (2010) studied the changes in the characteristics of companies which went public during the periods 1993–1994 and 2008–2009. The study concluded that although, over the years, only lesser number of firms were going public, the size of the firms was increasing simultaneously. Vong and Trigueirosn (2009) found that IPO returns remained positive in terms of expected returns and majority of the investors except the small investors remained unaffected by risk-free rate of return and transaction costs. Anjana and Kunde (2009) studied 110 IPOs during the period of January 2006 to April 2007. They found that out of 110 IPOs, 104 IPOs gained on first day of trading. They also found that IPOs performed well in both short run and long run. These stocks recorded an average of 33 per cent returns on the listing day. Ishwara (2009) studied the performance of 107 IPOs during the financial year 2007–2008. The study found that only 86 companies recorded positive returns on both NSE and BSE on the listing day and the remaining stocks recorded negative returns. They also found that during bullish market conditions majority of the companies were traded for high prices and provided positive returns to the investors. Deb (2009) studied the underpricing for 187 IPOs during the period from 2001 to 2009. The researchers found that even though nearly half of the IPOs were underpriced during the period of study, the mispricing adjusted very quickly and thus the investors could not reap benefits of excess returns in the long run. The researcher found that there existed a strong positive relationship between underpricing and ex ante and ex post measures of uncertainty. Pande and Vaidyanathan (2009) found a positive relationship between first day underpricing and listing day, money spent by companies on marketing and demand generated during book building process. Shelly and Singh (2008) studied the relationship between oversubscription and various variables for 1,963 IPOs listed on BSE. They found that there existed a positive relationship between underpricing, reputation of lead manager, the age of the company and oversubscription for selected IPOs. Garg, Arora and Singla (2008) found that the stocks were significantly underpriced in the short run and overpriced in the long run. The study also found that there was no significant difference between opening price returns and closing price returns and there was no difference between underpricing in hot and cold period. However, the study also observed that the underpricing significantly differed in bearish and bullish markets. Firth and Wang (2008) studied the relevance of price earnings multiples on the IPOs issued during the period 1992–2002 as disclosed by manager in IPO prospectus in China. The research found that there existed an impact of price earnings multiples on formation of price of securities. Xiaozhou, Jin and Hong (2008) found that there existed no significant relationship between the level of pre-IPO earning management and abnormal return. Dolvin and Pyles (2007) found existence of high level of underpricing for IPOs that went public during fall and winter period. The study also found that there existed an impact of emotions of buyers on pricing of IPOs. Paleari and Vismara (2007) found that post-IPO growth was lower than the expected growth and the forecast errors were affected by forecasted growth, sentiments of the market and size of the firm. Hill (2006) found that there was no significant relationship between IPO underpricing and post-IPO shareholding pattern of selected firms. Prasad, Vozikis and Ariff (2006) found the existence of higher underpricing in Malaysia when compared to developing nations. They also concluded that there exists a positive relationship between first day underpricing and government regulatory intervention.
Objectives
To analyse post-IPO performance of selected companies.
To identify whether the IPOs of selected companies are underpriced, fairly priced or overpriced.
To analyse the impact of various variables such as age of the companies, issue size of the IPO, ownership holding of such companies and the promoter’s holdings after the issue on abnormal and total returns of selected Indian IPOs.
Research Hypothesis
H1: Indian IPOs are underpriced in the short run.
H2: There exists significant impact of various variables (age of the company, issue size of the IPO, ownership sector and the promoter’s holdings after the issue) on the initial returns, abnormal returns and normal returns of 1st day and 30th day of all the selected IPOs.
H3: There is a significant difference among the mean abnormal returns and total returns of 1st day, 5th day, 9th day, 15th day and 30th day of selected Indian IPOs.
Research Methodology
Event Study: The study has been undertaken by using an event study, whereby the post-IPO short-run performance has been measured on 1st day, 5th day, 9th day, 15th day and 30th day of the IPO.
Selection of IPO: The IPOs have been selected on the basis of the year of issue. The study selected all the IPOs issued in the year 2017 (January 2017 to September 2017).
Sources of Data: The data of all the selected IPOs have been collected from the annual reports of selected companies and official website of National stock exchange (www.nseindia.com). The website www.chittorgarh.com (Indian IPO investment portal) was used to get the details pertaining to IPOs. The daily data of market index, that is, Nifty 50 were collected from NSE website.
Analytical Tools: The study uses Correlation, Regression and ANOVA test to analyse the post-performance of selected Indian IPOs.
The study uses the following measures for analysis of the data:
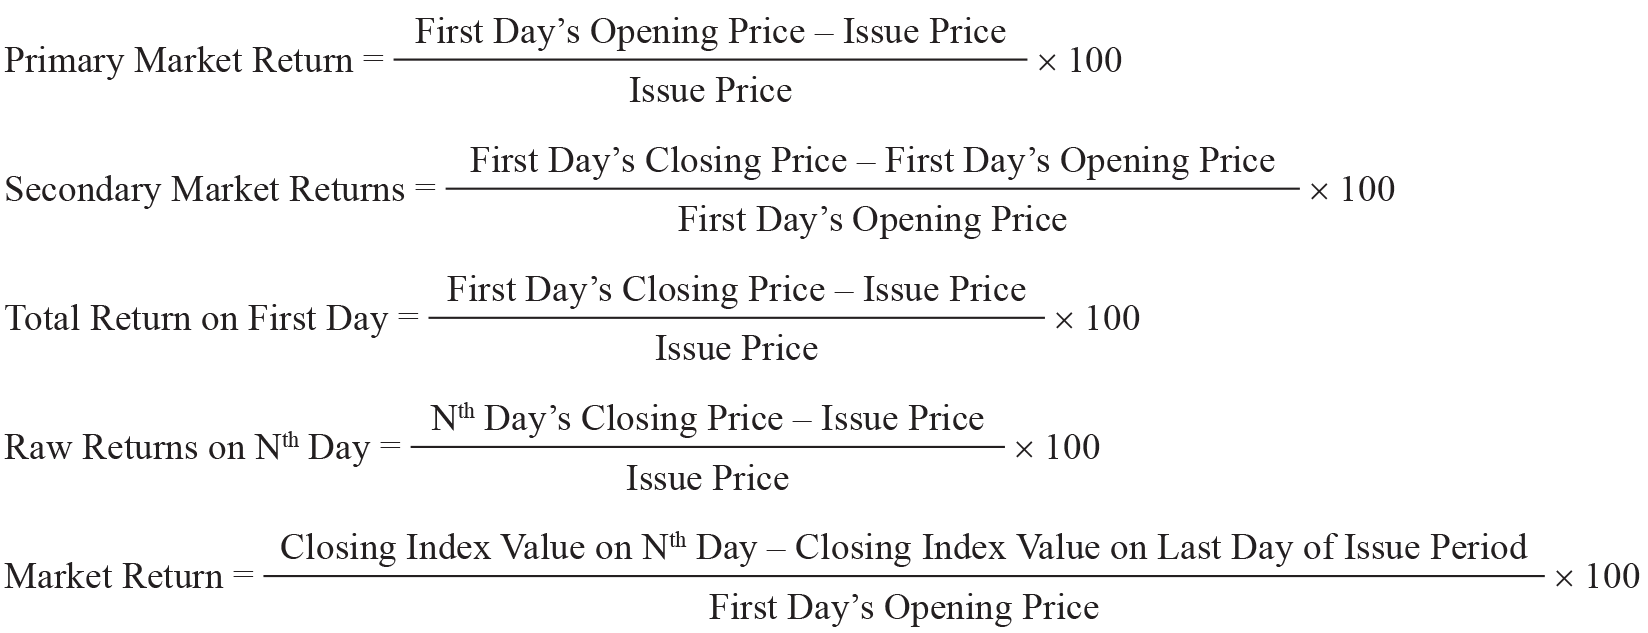
Abnormal Return = Raw Return − Market Return
If the Abnormal Return is positive, then it implies that the IPO is underpriced.
If the Abnormal Return is zero, then it implies that the IPO is fairly priced.
If the Abnormal Return is negative, then it implies that the IPO is overpriced.
Correlation: The correlation test is used to test the relationship among abnormal returns and normal returns of 1st day and 30th day of all the selected IPOs with the age of the company, issue size of the IPO, ownership sector and the promoter’s holdings after the issue.
Regression Analysis: The study used regression analysis to analyse the impact of age of the company, issue size of the IPO, ownership sector and the promoter’s holdings after the issue on abnormal returns and normal returns of 1st day and 30th day of all the selected IPOs, respectively.
The study considers abnormal returns and normal returns of 1st day and 30th day as dependent variables. Furthermore, the study considers age of the company, issue size of the IPO, ownership sector and the promoter’s holdings as independent variables.
The testing of these statistical tools involves estimating the following regression equation:




where TR1 is the 1st day total return, AR1 is the 1st day abnormal return, TR30 is the 30th day total return, AR30 is the 30th day abnormal return, β0 is constant (C), β1 is the regression coefficient of age of the company, β2 is the regression coefficient of issue size, β3 is the regression coefficient of promoter’s holding after issue and β4 is the regression coefficient of ownership sector.
ANOVA Test: The study used ANOVA test to verify the mean abnormal returns and total returns of 1st day, 5th day, 9th day, 15th day and 30th day of selected Indian IPOs are equal or not.
Data and Results
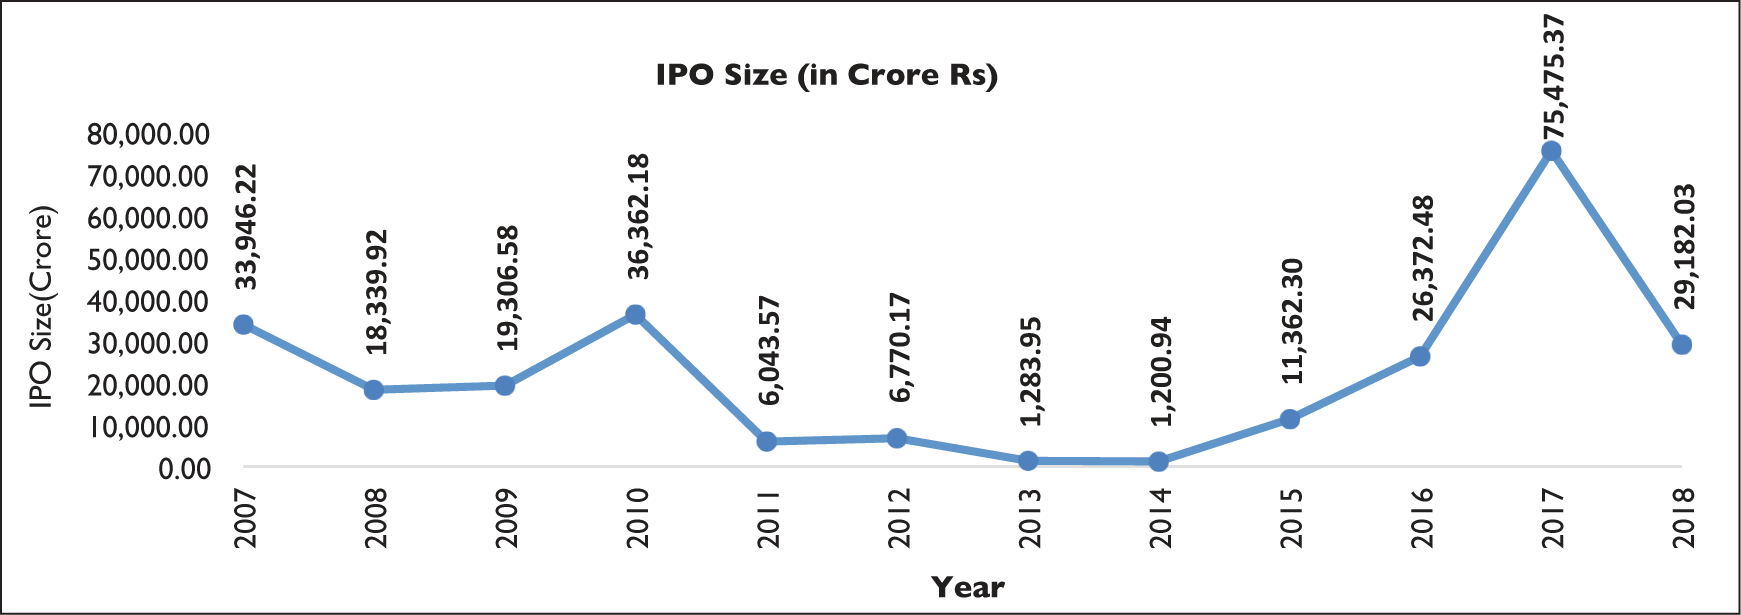
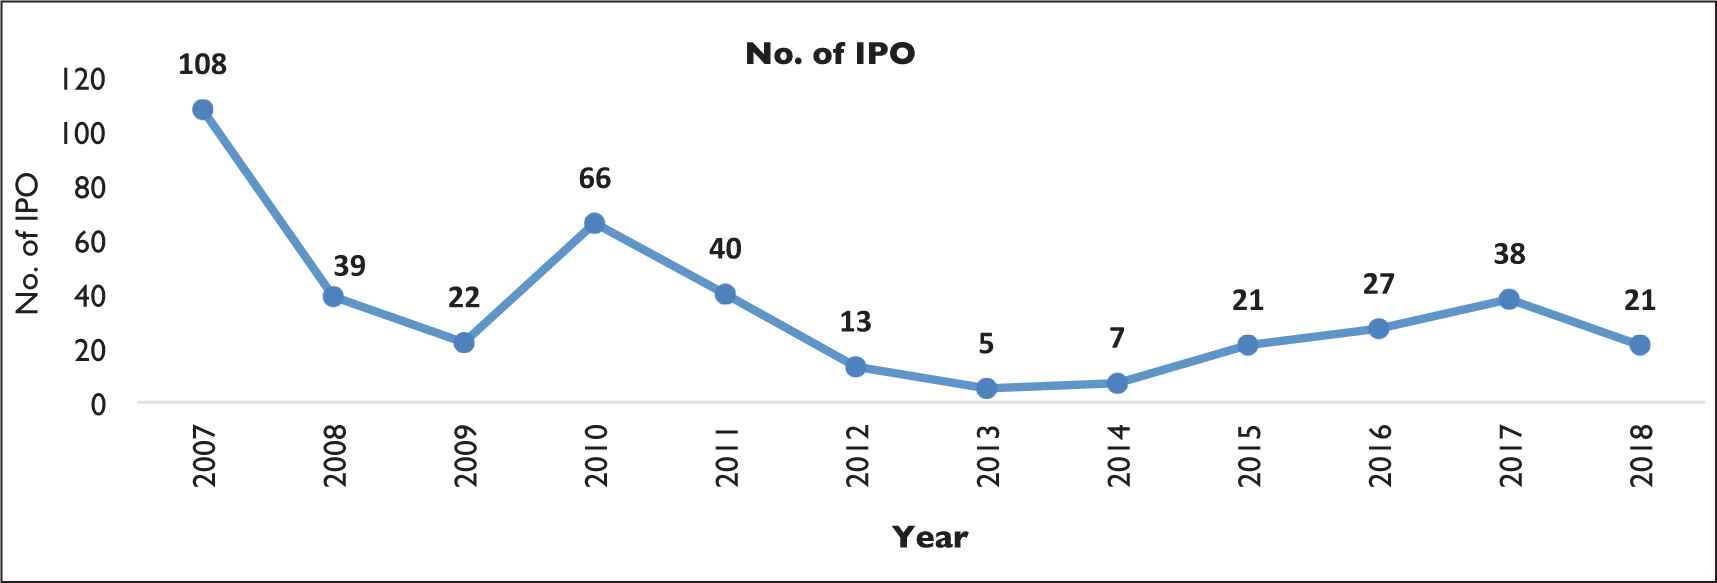
Figures 1 and 2 clearly indicate that the year 2017 was the blockbuster year for IPOs as the selected 38 companies raised approximately INR 75,475.37 crore through equity market route in 2017. The amount thus raised is the highest in any financial year and is 3.46 times the amount raised in the last 7 years. This is due to the addition of seven IPOs which received mega response of more than 10 times subscription. As far as the retail investors are concerned, 2017 witnessed very good response from them as well.
Descriptive Statistics of Total Return

The results as shown in Table 1, the study indicates that the average returns of the selected 26 companies are increasing over a period of time with lowest mean return being observed on 1st day and highest mean return being observed on 30th day. The highest total return is being observed on 30th day and the lowest return being observed on 5th day. It is also observed that over the period of study the standard deviation and variance of data increases which implies that the returns are not concentrated towards average and there exists large amount of variation. It is also observed that over the period of time there exists positive skewness which signifies that data are skewed right and the right tail of distribution is longer than left tail. On the other hand, only on day 1 the value of kurtosis in more than three which signifies that distribution on first day is leptokurtic and on the other days the distribution is platykurtic.
Frequency Distribution for Total Return


Table 2 and Graph 1 clearly show that by the end of 30th day, approximately 27 per cent IPOs give more than 50 per cent total return, whereas a total of 38.5 per cent of the total IPOs give less than 0 per cent returns to investors. It can also be seen from Table 2 that there has been substantial increase in the number of companies giving more than 50 per cent returns, whereas a fluctuation in number of firms giving less than 0 per cent return can be observed. It is also seen than around 40 per cent of stocks provide investors with around 10 per cent returns on first day. Further, it can be observed that only 23–27 per cent give investors 10–50 per cent from 1st day to 30th day.
Descriptive Statistics for Abnormal Returns
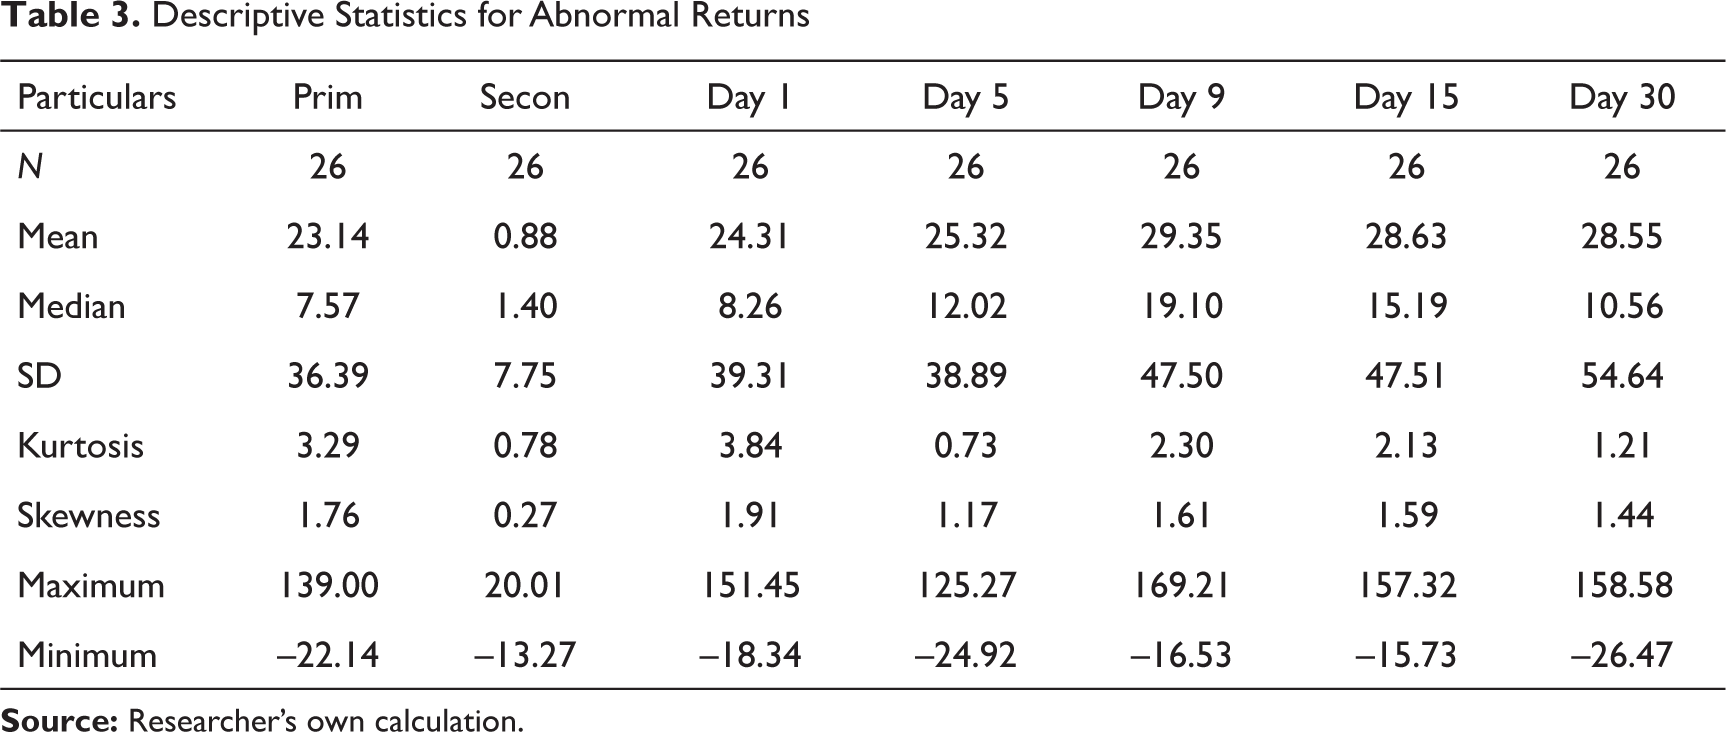
Table 3 shows that the average abnormal returns for the selected 26 companies are fluctuating over the period of time with highest mean return being observed on 9th day and lowest return being observed on 1st day. The highest average abnormal return is being observed on 9th day and the lowest average return being observed on 5th day. It is also observed that over the period of study the standard deviation increases. This means that the data are farther away from the mean, not concentrated towards average and there exists large amount of variation in the data set. Furthermore, it is observed that over the period of time, there exist positive skewness and the value of skewness on all days is more than one. Positive skewness signifies that data are skewed right and the right tail of distribution is longer than left tail. Also, value of skewness greater than one signifies that the distribution is highly skewed. On the other hand, the value of kurtosis over the period is fluctuating. Only on 1st day, the value of kurtosis in more than three which signifies that distribution on 1st day and on other days the value of kurtosis is less than three which signifies that distribution on these days is platykurtic.
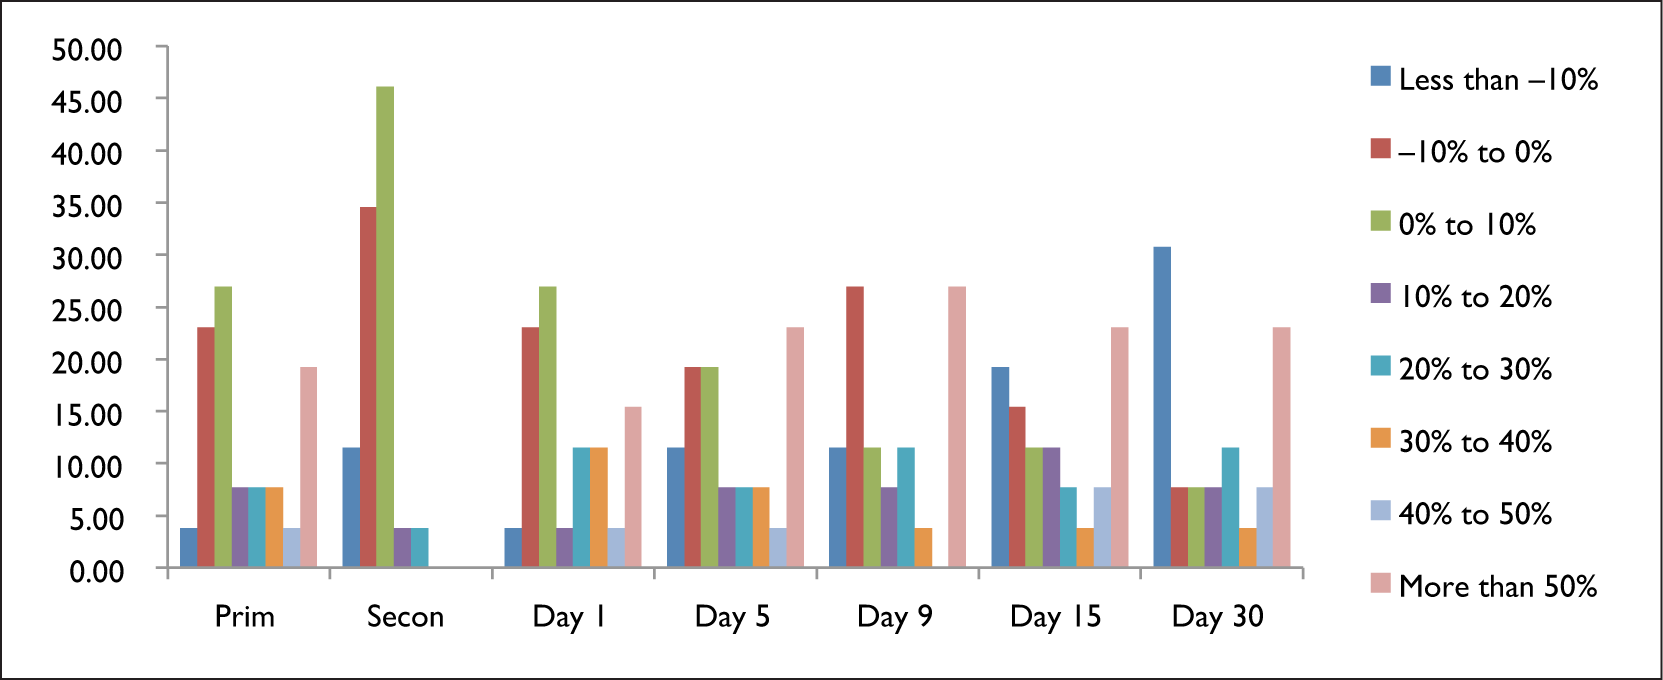
Table 4 and graph 2 show the frequency distribution of abnormal return where it is clearly observed that approximately 30–35 per cent are overpriced over the period of study and around 70 per cent of companies are underpriced over the period of study. There has been an increase in the number of companies giving more than 50 per cent abnormal return, whereas fluctuation is observed in respect to number of firms giving less than 0 per cent return. It can also be seen that on first day around 70 per cent companies give positive abnormal return and a decreasing trend is seen over the period of time. It is also It is also observed that around 46.15 per cent companies provide 0–10 per cent abnormal return in secondary market on first day [Secon]. The abnormal returns of majority of selected event periods are positive for all sample IPOs of 2017. Thus, it clearly indicates that all the selected Indian IPOs of 2017 are underpriced.
Table 5 shows the correlation results between the returns and selected variables. It clearly indicates that there exists a positive but weak correlation between promoter’s holdings and returns of all the days. In contrast, there exists a negative and weak relationship between issue size and all the returns. Thus, the correlation results conclude that returns are affected adversely by issue size and positively by promoter’s holding. In case of ownership sector, it affects the total return and abnormal return on the first day negatively. Thus, there exists a negative and weak relationship between ownership sector and total and abnormal return on day 1. Thus, the ownership sector affects the returns on day 1 adversely. On the other hand, the ownership sector affects the returns on 30th day positively. There exists a positive but a weak relationship between sector on the one hand and the total return on 30th day and abnormal return on 30th day on the other hand. In the case of age, there exists a negative and weak relationship between age on the one hand and total return on 30th day and abnormal return on 30th day on the other hand. Thus, the age of companies affects the various returns adversely. On the other hand, there exists a positive and a weak relationship between age and the various returns.
Frequency Distribution for Abnormal Returns

Frequency Distribution for Abnormal Returns
The Consolidated Correlation Results

Table 6 shows the consolidated multiple regressions results. The regression results clearly indicate that the regression coefficients of all the selected independent variables namely, age of companies, issue size, promoter’s holding post-issue and the ownership sector are insignificant. Thus, the consolidated regression results reveal that there is no significant impact of all the selected independent variables on the abnormal returns on 1st day and 30th day, total returns on 1st day and 30th day, respectively. These results are consistent with Malhotra and Premkumar (2017).
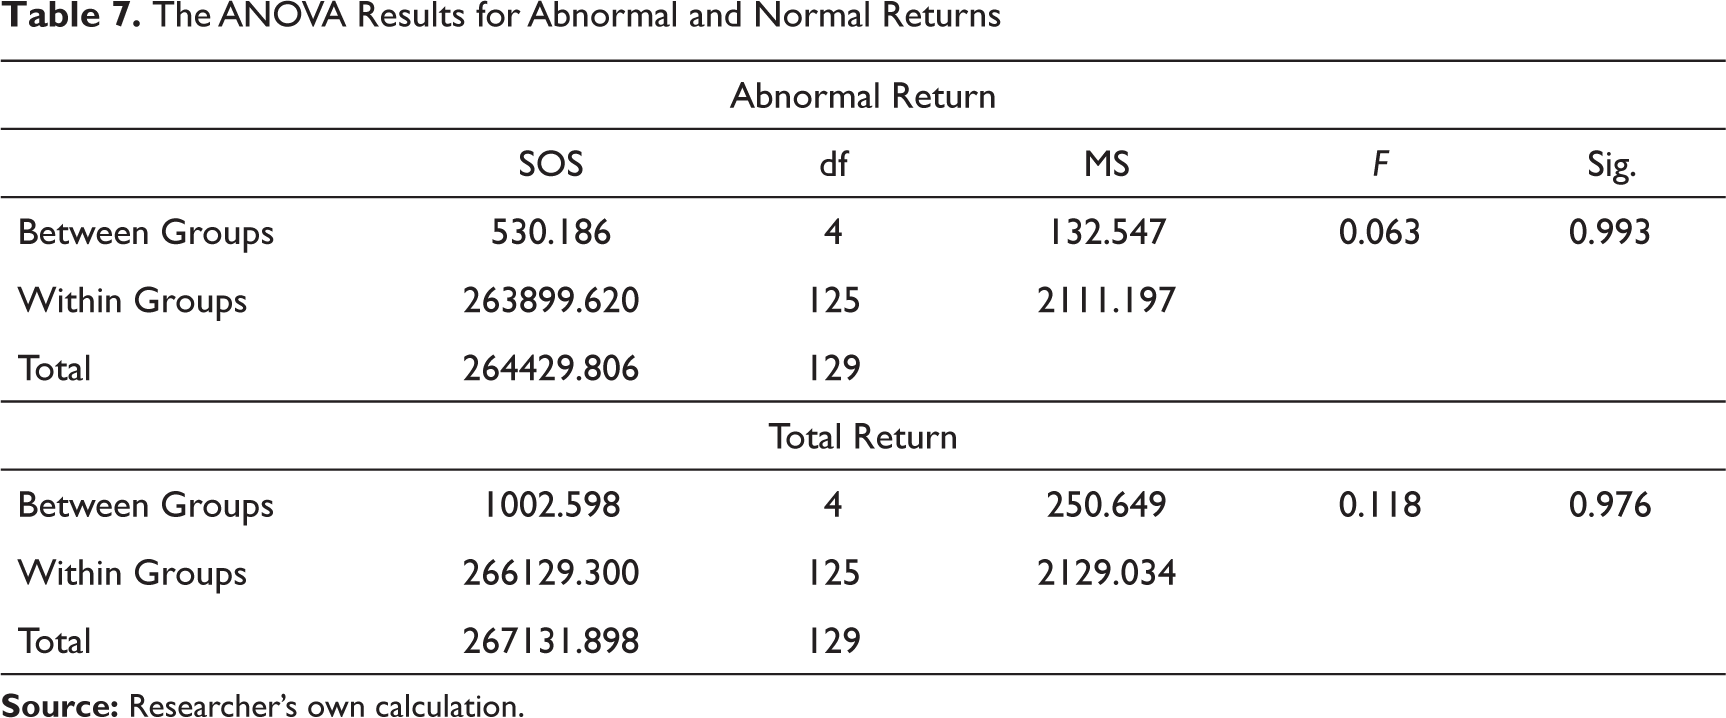
Table 7 shows the ANOVA results for abnormal and normal returns. The probability values of abnormal and total returns are insignificant. It clearly indicates that the mean abnormal returns and total returns of 1st day, 5th day, 9th day, 15th day and 30th day are same.
The Consolidated Regression Results

The ANOVA Results for Abnormal and Normal Returns
Discussion
Theoretical Contribution of Study
Our study analyses a unique and comprehensive data to understand the short-run price movement of selected IPOs and understand whether factors such as age of the company, the promoter’s holdings post-issue, issue size of the IPO and the sector to which the company belongs affects the IPO performance in short run. It computes the IPO performance using event study methodology on 1st day (primary market returns as well as secondary market returns), 5th day, 9th day, 15th day and 30th day and uses correlation and regression analysis to determine the type and extent of relationship between the specific factors and the IPO returns (total return and abnormal return). The findings of the study are consistent with the findings of the literature reviewed and provide original contributions to the prior literatures. The study highlights that even though the number of companies going public and capital raised through IPO option are increasing, the investors investing in these IPOs still view this option as a means to earn speculative gains rather than as an option to diversify their portfolios. The findings of the study indicate that the average total return provided by the selected IPOs on the listing day is 23.67 and the abnormal return provided by these IPOs over and above the market return is 23.14 which are quite impressive. This result supports the previous researches and highlights that the investors stand a chance to earn these returns in a time period of around 3–4 weeks. Since the research indicates that the total and abnormal returns calculated for the selected IPOs are positive, we can conclude that the IPOs in the year 2017 were underpriced.
Thus, investing in IPOs for short term can prove to be very lucrative option and can help the investors to make handsome gains in very short period of time. Pearson’s correlation and regression model have been applied between the returns calculated (total returns and abnormal returns) and the selected independent variables. The study observed that the selected independent variables do not affect the IPO performance in the short run. Thus, it can be concluded that underpricing exists due to information asymmetry between the various investors and the issuer. Furthermore, the study emphasizes that positive sentiments and bullish trends in the market help the companies to keep the prices of their IPOs on the higher side. Finally, the study aims to eliminate the information disparity between the issuers and the investors and thereby aims to increase the confidence and trust of both the players in the primary market, which can ultimately help the economy to grow as a whole.
Managerial Implications of the Study
There are majorly four participants in the Indian IPO market, namely the investors in the primary market, the issuer, the underwriters and the investors in the secondary market. The investors in the secondary markets stand a chance to benefit from the underpricing of IPOs in the secondary market and stand to lose nothing. Thus, the underpricing of the IPOs encourages the investors in the secondary market to invest in the IPOs. Similarly, the investors in the primary market too want the IPO to be underpriced as they also stand a chance to gain and the same helps the investors to avoid the winner’s curse due to pricing uncertainty or asymmetric information as highlighted by Rock (1986).
The underwriters too want the IPOs to be underpriced as the underpricing is consistent with profit maximization for underwriter. When the underwriters act as post-IPO market makers and allocate shares to their customers on collateral, the underwriters gain from the IPO underpricing and thus maximizes their profit.
For the issuers, underpricing helps them to reduce the cost of external finance by improving corporate governance, due diligence practices and disclosure quality. The underpricing also helps the companies to attract the market, investors and media coverage and thus generates great publicity. Second, underpricing could act as a substitute for the marketing activities and can help in increasing customer recognition in the market. Finally, underpricing helps to boost post-IPO liquidity of stocks, increase recognition by the investors and increase the market demand of the stocks and hence, reduce the cost of equity. Therefore, we can conclude that underpricing is associated with larger reductions in borrowing costs for the IPO firm after going public. Thus, we can say that loss due to IPO underpricing can be compensated by benefits of lower borrowing costs.
Limitations of the Study
As highlighted and discussed in above sections, this study has several important contributions to the existing literatures and add value to various participants of the IPO market. Despite the wide scope and exhaustive study, our research regarding the performance of Indian IPOs in short run has the following limitations:
The research uses event study mechanism to analyse the total returns and abnormal returns on 1st day, 5th day, 9th day, 15th day and 30th day. The period of study considered is rather short and perhaps a longer study period could give much comprehensive results and better understanding to the various participants in the IPO market. Furthermore, the study can be carried out on post-IPO volatility estimation using advance GARCH family tools. The study only considered the companies which went public during the period between January 2017 and September 2017. However, if the study would have considered more IPOs over a longer period of time, the study could have produced much better results and contributed more to the existing literatures. The study tried to identify if the total and abnormal returns of the IPOs are affected by the four factors namely the promoter’s holdings post-issue, the age of the company, the ownership sector of the company and issue size of the IPO. However, the study could have used many more factors such as industry to which these companies belonged to, the allocation pattern between the various investors, the market conditions like bullish and bearish trends, etc. to give much more enhanced results.
Future Research Directions
In spite of the wide coverage of our study on the analysis of the short-run performance of Indian IPOs, we still consider that there are much scope for future study. Therefore, to further improve upon the present study, the suggested research avenues can explore the following: (i) The future studies can analyse not only the short-run performance but also the long-run performance of the IPOs over a period of time to give more comprehensive results. (ii) Another area of study can be to identify if the total and abnormal returns of the IPOs are affected by the allocation pattern between the institutional and retail investors. (iii) The future studies can also examine if the IPO performance in short run and in long run is associated with the fixed price offerings or book building methods of allocation in India and which helps in giving better returns to the various participants. (iv) The study may also try to examine if there exists any relationship between the various factors affecting the IPO underpricing and Future Public Offers in India. (v) Also, the future studies can identify if the factors such as necessary disclosure at the time of IPOs, process followed for IPO allotment, SEBI guidelines, etc. affect the pricing and performance of the IPOs in India. (vi) Another area of study for future could be the performance of the IPOs in both the stock exchanges, that is, Bombay Stock Exchange and National Stock Exchange to give a wider perspective on the IPO performance in India. (vii) Finally, the future studies use case study analysis of the companies which have performed exceptionally well and have performed poorly in the IPO market to identify other possible anomalies for the underpricing in the Indian IPO market. (viii) Further, the study recommends the academicians, researchers and markets analysers to focus on conducting a comparative study on performance of Indian IPO’s with Global Markets IPOs.
Conclusion
The study employed to empirically analyses whether the Indian IPOs are underpriced in short run or not and to determine whether various independent factors such as age of companies, size of the issue, promoter’s holdings post-issue and ownership sector have an impact on the total and abnormal returns of the selected companies. The results showed that majority of IPOs in 2017 were underpriced. Also the study highlights that there is no significant impact of various independent variables on the total returns and abnormal returns of selected Indian IPOs. The regression and correlation results suggest that no significant relationship exists between the selected independent variables and returns on 1st day and 30th day, respectively. The non-existence of a relationship between selected variables and the IPO returns may be due to various financial structural reforms which took place in Indian economy prior as well as during the period of study. Two of these major reforms were de-monetization which took place on 8 November 2016 and implementation of Goods and Service Tax from 1 July 2017 onwards which resulted in huge uncertainty and unpredictable behaviour patterns in the Indian Economy.
Footnotes
Declaration of Conflicting Interests
The authors declared no potential conflicts of interest with respect to the research, authorship and/or publication of this article.
Funding
The authors received no financial support for the research, authorship and/or publication of this article.