
Abstract
The accumulation of industrial waste at the global level is distressing, as the World Bank estimated in 2016 that the growth of solid waste will hit 3.4 billion tonnes by 2050. India faces similar issues related to inefficient waste management and enfeebled waste reporting practices as the Energy and Resources Institute (TERI) estimated that more than 62 million tons of industrial waste are generated annually, of which around 12 million tons are treated before disposal, 31 million tons are diverted towards landfills, and the majority is unprocessed and unaccounted for. In this response, this study analyses the waste reporting practices adopted by the top corporate social responsibilities ranked Indian companies with a motivation to align the Indian reporting pattern with the Global Reporting Initiative (GRI). The study finds inconsistent, unstandardized, and unstructured waste reporting practices when analysed under the GRI across the selected Indian companies concerning massive waste generation per turnover and earnings per share. The findings suggest the need for integrated compliance towards reporting standards to control any negative impact on the environment, as shown through waste intensity ratios. The findings have largely contributed towards understanding the anomalies between the Indian corporate reporting practices and the global reporting under GRI.
Keywords
Introduction
The growth and production of solid waste at the global level are alarming (Adler et al., 2022), as the World Bank estimated in 2016 that the growth of solid waste would hit 3.4 billion tonnes by 2050 (Kaza et al., 2018), which would proportionately increase problems related to global health and safety. Due to the lack of environmental protection laws, this problem has become more prevalent in underdeveloped or developing countries, causing severe health issues due to the absence of adequate technology and infrastructure to handle the cumulation of solid wastes (Ferronato & Torretta, 2019). Ultimately, the solid waste finds its way into open spaces, rivers, ponds, oceans, and seas, polluting water sources and disturbing all the natural habitats. Such a scenario is familiar in developing South Asian countries, such as India, Bangladesh, Pakistan, Nepal, and Sri Lanka (World Bank, 2019b).
India has faced a severe environmental challenge in its existing waste management practices; including massive waste generation due to a perpetual economic activity, that intensified issues related to inadequate waste collection, transportation, treatment, recovery and open disposal to landfills or into water (Kumar et al., 2017). In India, the world’s most populous country, its existing waste management practices cannot handle the massive quantity of waste being produced, especially in the urban areas where the population, as well as producing firms, are highly concentrated; as a result, more than 80% of wastages end up in water bodies and wetlands (D’Cunha, 2016) and with higher growth potentials, India’s higher economic activities correlate with the amount of waste generated, further intensifying the rate of waste accumulation (Court, 2012). This waste management issue degrades the natural environment and harms public health. Most of the waste in India is industrial waste as it has several polluting units, especially the chemical manufacturers, which have primarily impacted the environment (World Bank, 2019a).
A report on industrial waste management in India by Modor Intelligence in 2023 disclosed that landfilling remains the most popular method of disposing of waste in India, as more than 50% of the total solid waste generated is dumped in landfills without any treatment or processing due to the absence of efficient waste management practices (Modor Intelligence, 2023). Estimates in 2023 by The Energy and Resources Institute (TERI) reveal that more than 62 million tons of industrial waste are generated per year in India (Singh & Singh, 2023), out of which around 12 million tons are treated before disposal, and 31 million tons are diverted towards waste yards and landfills. The majority of the waste generated remains unprocessed and unaccounted for. The Indian Central Pollution Control Board (CPCB) estimates that the annual industrial waste generation in India will increase to 165 MT by 2030 (ITA, 2023), which will proportionately increase the quantity of waste being untreated or raw waste being sent to landfills (Court, 2012). These reports have mainly highlighted the issue of the unaccountability of waste generation and the lack of adequate waste collection, treatment, and disposal operations, which have become significant causes of environmental and public health concerns in India.
On the other hand, the concern for sustainability has increased in the corporate sector with its increasing relevance for corporate governance, transparency, accountability, responsibility, and policy and decision-making (Siew, 2015). Sustainability has become an ace card for most organisations to stand high and display a positive image in the market, which also prevails in the Indian market, as the Indian corporate sector is now under the blanket of sustainability frameworks, standards, and guidelines. The purpose of these sustainability frameworks is not only to achieve organisational transparency or responsibility but also to concern legal obligations (Sartori et al., 2017).
In India, the disclosure of the sustainability reports has been called for mandatory compliance by the top 1000 listed companies (based on market cap) from the FY 2022 to 2023 by the Securities and Exchange Board of India (SEBI), which is marked as a beginning of the inclusion of sustainability disclosure under legal obligation for the Indian corporate sector. However, only a handful of Indian companies undertake waste management practices—its accounting and reporting under the Business Responsibility and Sustainability Reporting (BRSR) frameworks (Verma & Khan, 2021)—while the majority of the companies neglect the importance of waste management practices with no voluntary dedication towards waste management accounting and reporting until the financial year 2021–2022. Since the BRSR became mandatory in the financial year 2022–2023, it has been the top corporate social responsibility (CSR) ranked Indian company focused on taking the lead in disclosing statutory reports. With 2022–2023 as a year-on focus, will the CSR-ranked companies disclose the BRSR in accordance with the Global Reporting Initiative (GRI)? If yes, then to what extent? Will the report be standardised across all the CSR-ranked Indian companies? This is the research motivation behind the present study, and the findings will make a greater contribution towards understanding the anomalies between Indian corporate reporting practices and global reporting under GRI, along with cross-company comparisons between the Indian companies on the corporate social reporting under BRSR which is based on the GRI.
Sustainability Reporting Under GRI Standards
The Global Sustainability Standards Board (GSSB) is responsible for formulating the GRI standards, which are globally accepted sustainability reporting standards. GRI was originally founded in 1997 in Boston, USA, with its first version originally launched in 2000. The GRI G3 standards were launched in 2006, and standards related to waste were launched in 2020 (GRI, 2024). Now, GRI standards as a guide to report information related to sustainability are widely being adopted (Adhariani, 2021). In particular, ‘GRI 306 Waste’ deals with the reporting standards for reporting waste-related information.
GRI 306: Waste (GRI, 2024) is bifurcated into two different sections, that is, the management approach disclosures, which further consist of two disclosure guidelines, that is, ‘Disclosure 306-1’ for waste generation and significant waste-related impacts and ‘Disclosure 306-2’ for management of significant waste-related impacts. Another section deals with the topic-specific disclosures, which has three different disclosure guidelines, that is, ‘Disclosure 306-3’ for waste generated in due course of activities by the organisation, ‘Disclosure 306-4’ for waste which is diverted from the disposal, and ‘Disclosure 306-5’ for the waste which is directed to disposal. This standard can be applied and used by any type of organisation irrespective of their sector, type, size, or geographical location. These standards should be reported along with the recent standards under ‘GRI: 306 Foundation’, ‘GRI 103: Management Approach’ and the ‘GRI Standards Glossary’.
Corporate waste disclosure and reporting under GRI standards are gradually entering the limelight. The study of Veleva et al. (2017) assessed the sustainability reports of eight pharmaceutical companies indexed in the Dow Jones Sustainability Index that adhered to GRI reporting frameworks and found that the companies have disclosed inconsistent data on waste reporting section with ineffective indicators for waste measurement and waste reduction or waste reuse. The problem of inadequate and ineffective parameters to measure waste data has been raised. Further, Alrazi et al. (2018) attempted to investigate governing factors influencing sustainability disclosures of 75 Asian companies. The results disclosed that a country’s law enforcement and environmental commitment dictated the sustainability disclosures based on GRI guidelines. Through a comprehensive analysis of the sustainability reports prepared as per GRI guidelines by energy sector companies of the EU, Janik et al. (2020) attempted to find out the quality and pattern of reporting greenhouse gas (GHG) emissions. The findings showed that the companies prioritise GHG issues in their reports and rarely discuss initiatives towards a ‘Circular Economy’.
In an attempt to explore the relationship between CSR performance, CSR reporting, GRI compliance in CSR reports, and validating the authenticity of CSR reports through a third-party agency, Karaman et al. (2021) found that the entities that adopted the GRI framework and efforts to obtain external assurance statements were positively adopting GRI guidelines while preparing the CSR reports and further verified the CSR reports from a third-party external independent agency. The study of Maia et al. (2021) aimed to identify and analyse the electricity sector’s waste generation and disposal typologies. The data source for the study was the respective companies’ GRI reports from 2017 to 2019, and it was found that 15 companies out of 26 reported waste management practices but in a non-standardized structure. The study concluded by stating that current waste management practices are gradually heading towards sustainable patterns, which remains the embryonic theme of recent literature. Wulansari and Adhariani (2022), in Indonesia, one of the world’s top plastic waste generators, studied the sustainability reports of Indonesian companies as per the guidelines enlisted in GRI 306 and found exceptionally low compliance. Similarly, the study of Nirwana and Wedari (2023) analysing sustainability reports found that the return on assets (ROA) as a proxy of firm performance had no significant impact on the disclosure of waste under ‘GRI 306: Waste and Effluents’, instead other significant factors were the board composition, audit committee etc.
Relevant Literature
At the global level, sustainability reporting practices are widely adopted by the corporate sector in response to the demand for transparency on environmental and social issues by the stakeholders. This has led to the popularity and development of several sustainability reporting tools like GRI, which are considered useful tools as they enable corporate houses to inform the concerned stakeholders of their progress on sustainability practices. However, the studies, especially considering the accounting and accountability literature on solid waste, have attracted limited research considering its significance in waste management (Qian et al., 2011). The mainstream studies have undertaken research related to the influence of the organisation on nature (Gray & Laughlin, 2012), the perception of such influences on the part of concerned stakeholders (Phan et al., 2018) and efforts to control any negative influences on nature (Kuruppu et al., 2019). However, the studies on sustainability reporting practices with special reference to waste accounting and reporting have been limitedly researched and discussed.
Siew (2015) found an increasing adoption of sustainability reporting practices worldwide, evidenced by the popularity of sustainability reporting tools like GRI, AA1000, CDP, etc., but such growth with varying criteria and new methodologies has created major complications for concerned stakeholders. The study of D’Onza et al. (2016) proposed a management accounting system and a tool for waste, that is, full cost accounting (FCA) method for effective waste accounting through separated collection that results in efficient reporting. The study of Haraldsson (2016) explored the reasons for differences in the FCA reporting of Swedish municipal waste management and found that the mixed context of institutional and economic factors with municipal administration produces an array of forces that result in differentiated and uneven accounting and reporting practices under waste management.
A model based on the TBL framework and stakeholders’ perception, as proposed by Garcia et al. (2016), shows how this model supports informed decisions backed by integrating sustainability practices, accounting, and reporting activities. Assessment of the sustainability performance by Sartori et al. (2017) of a selected industry found that the companies had adopted the Triple Bottom Line (TBL) framework of sustainability and only a handful of companies were found to be efficient in reporting sustainability performance under the TBL approach. In particular, the ‘Waste Hierarchy Theory’ included in the European Union (EU) action plan is identified as a legitimate strategy for achieving environmental sustainability for the circular economy, as Pires and Martinho (2019) highlighted. The study by Slacik and Greiling (2019) undertook the materiality principle for making the sustainability report more material for relevant interested parties and found that the quality and coverage of electric companies’ sustainability reports stay far away from the necessity of transparent statements with a severe lack of materiality in the reports. In investigating the cooperative societies of Spain, Campillo-Alhama and Igual-Antón (2021) attempted to understand the level of commitment and stakeholder participation towards CSR and related policies. Surprisingly, it disclosed a non-linkage between the cooperatives’ CSR initiatives and their priority sustainable development goals (SDGs) with a mere focus on sustainability as a commitment to their community.
Recent studies, the study of Basak and Das (2021) on the Indian automobile sector states that the reporting of initiatives undertaken to achieve global sustainability and any damage to the societal wealth caused by business actions is vital for sustainable societal welfare and their study revealed a mixed performance in this vital aspect. Demonstrating the use of environmental management accounting in rural China, Yang et al. (2021) used the material flow cost accounting (MFCA) method for accounting and estimating the damages to the environment and displayed that an extended MCFA results in enhanced reporting of economic and environmental sustainability. The study by Chouhan et al. (2021) attempted to investigate the sustainability of accounting practices in Indian Cement Companies and observed that though they follow a common reporting method, but a critical difference in sustainability reporting by the companies in the industry. Highlighting the importance of the new BRSR framework, Verma and Khan (2021) state that the revised reporting mechanism will create awareness and support improved investment decisions, and it is likely to align with the GRI standard, which will improve transparency, accountability, sustainability awareness and performance standards of the companies. Sileryte et al. (2022) study the new Circular Economy Action Plan of Europe and state that the European Waste Statistics Regulation focuses on waste as a ‘post-factum problem’ with more than 76% of waste disposing units not complying with the regulations and the responsibilities relies on the units that undertake costs of waste management. The study of Adler et al. (2022) examined the waste reporting pattern of both solid and liquid wastages disclosed by India’s top 30 companies for the year 2012–2018 through content analysis and found that the reporting pattern has seen a significant improvement after India’s national waste management campaign with around 26 companies providing partial disclosure of waste generation. Analysing the environmental sustainability reporting in the waste-to-energy sector of Italy, Comoglio et al. (2022) studied the waste incineration plants and found that they recognised 197 indicators and 140 improvement goals, and the study provides useful results and references necessary for the environmental reporting of the waste incineration sector. A recent study in India by Saxena et al. (2022) evaluates waste management during the COVID-19 period and reveals that India lacks behind in terms of COVID-19 waste management and suggests the need for inclusive control and implementation of waste management practices towards the achievement of SDGs. Mustika et al. (2023) studied the waste accounting and disclosure pattern by the integrated waste processing site and waste facility of Indonesia along and found that the application of environmental cost accounting has undeniable significance in waste management as it can evaluate, control and report the impact of the waste management process to the environment. Similarly, the study of Szczerbak and Wikarczyk (2023) demonstrated the use of various tools available in the cost and management accounting for waste management practices and also reflected the position of circular economy in sustainable development with a clear indication of the positive influence of waste management practices on company’s financial performance and the environment. Vološinová et al. (2023), through an interdisciplinary perspective of both producers and consumers, proposed an accounting method for waste production pathways, clearly differentiating the meaning of waste footprint for different perspectives as relevant to the achievement of the circular economy. Somlai et al. (2023) studied the wastage from plastic packaging across the EU member states and explored the quality of individual national reporting based on two approaches- ‘placed on the market’ and ‘waste analysis’ and found inconsistent compliance of reporting practices which makes the comparison process difficult across EU member states. Maalouf and Mavropoulos (2023) attempted a cross-comparison with the data of waste generation using ‘material flow analysis’ and ‘regression analysis’ and were concerned about the inconsistency of global waste reporting pattern due to lack of generally accepted standards, differences in interpretation and methodologies. While assessing the impact of environmental accounting practices on the sustainable performance of micro, small and medium enterprises (MSMEs), the study of Latifah and Soewarno (2023) explored the mediation effect of waste management practices between environmental accounting practices and MSMEs’ sustainable performance along the line of GRI standards and found the presence of mediation effect in the model as assessed by employing structural equation modelling.
The review of the existing literature shows that the studies related to sustainability reporting practices in India are limited and at an embryonic stage with little concern towards waste management practices, with no study undertaken to verify compliance with global reporting standards. Further, only a limited study raises issues related to adopting the GRI guidelines in accounting and reporting sustainability practices. This present study concerns this issue and aims to fill this gap.
Objective
The study aims to probe the conformity with ‘GRI 306 Waste’ in the BRSR by top CSR-ranked Indian companies for which the objective is to:
analyse, both qualitatively and quantitatively, the improvement in the BRSR of waste management practices during the mandatory period, that is, in the financial year 2022–2023, over the voluntary period 2021–2022 by CSR-ranked Indian companies. estimate the waste intensity ratios, revealing the pattern across the companies in their waste management endeavour. verify the compliance with ‘GRI 306: Waste’ under GRI by CSR-ranked Indian companies in the BRSR.
Methodology
The present study employed an exploratory research design using both qualitative and quantitative analysis of the conceptual issues with respect to the waste management practices currently being adopted by the top CSR-ranked Indian companies. Content and descriptive analysis of the waste management practices adopted by the companies are conducted, which allows the identification and analysis of quantities, typologies, disposal and recovery options of waste generated by the sample companies through their disclosed information and will ultimately open an avenue to verify the compliance of sustainability reporting with the GRI.
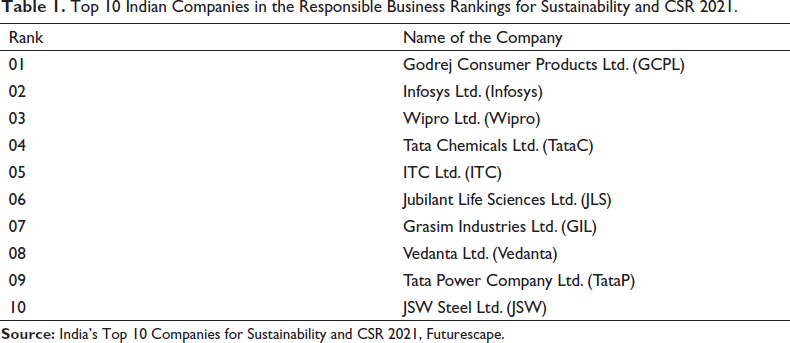
The secondary data source for analysis is the BRSR, as reported in the company’s integrated annual report. Since the reporting of the sustainability practices was on a voluntary basis until the FY 2021–2022, it was limitedly adopted by a handful of companies, but from the FY 2022–2023, the sustainability reporting practices are to be reported mandatorily under the BRSR framework in the integrated annual report as per the official circular of May 2021 issued by SEBI for listed Indian companies. The adopted methodology selected the companies from the rankings in the ‘Responsible Business Rankings for Sustainability and CSR 2021’ of Indian listed companies as assessed by Futurescape, a sustainable experience transforming agency. From these rankings, the top 10 companies, as shown in Table 1, selected and extracted the BRSR from the company’s integrated annual report of the FY 2021–2022 and 2022–2023 that would fulfil the objective of the assessment in the improvement of waste management practices during the mandatory period, that is, in the FY 2022–2023 over the voluntary period, that is, in FY 2021–2022.
Top 10 Indian Companies in the Responsible Business Rankings for Sustainability and CSR 2021.
Initiatives Undertaken by the CSR-ranked Companies Towards Waste Management Practices
The CSR-ranking companies adhere to the reporting pattern of waste management practices in two sections. First, the descriptive reporting on the initiatives undertaken by these companies towards waste management practices which is primarily a ‘recital reporting’. Companies portray this form of reporting through statutory reports, sustainability reports, business responsibility reports, ESG reports, or integrated annual reports. The recital reporting allows the concerned stakeholders of these companies to get to the bottom of the initiatives/steps towards waste management practices and allows them to appreciate these initiatives undertaken to arrest the consequences and hazards arising from improper and perilous recovery or disposal methods of the company’s waste management practices. In this section, we attempt to show how the top CSR-ranking companies efficiently manage and report the initiatives under waste management practices. Based on the statutory reports, ESG reports, sustainability reports, and integrated annual reports of the companies, Table 2 reveals the strategy and the achievements gained from the said waste management practices.
Strategies and Achievements in Waste Management Practices of CSR-ranked Companies.
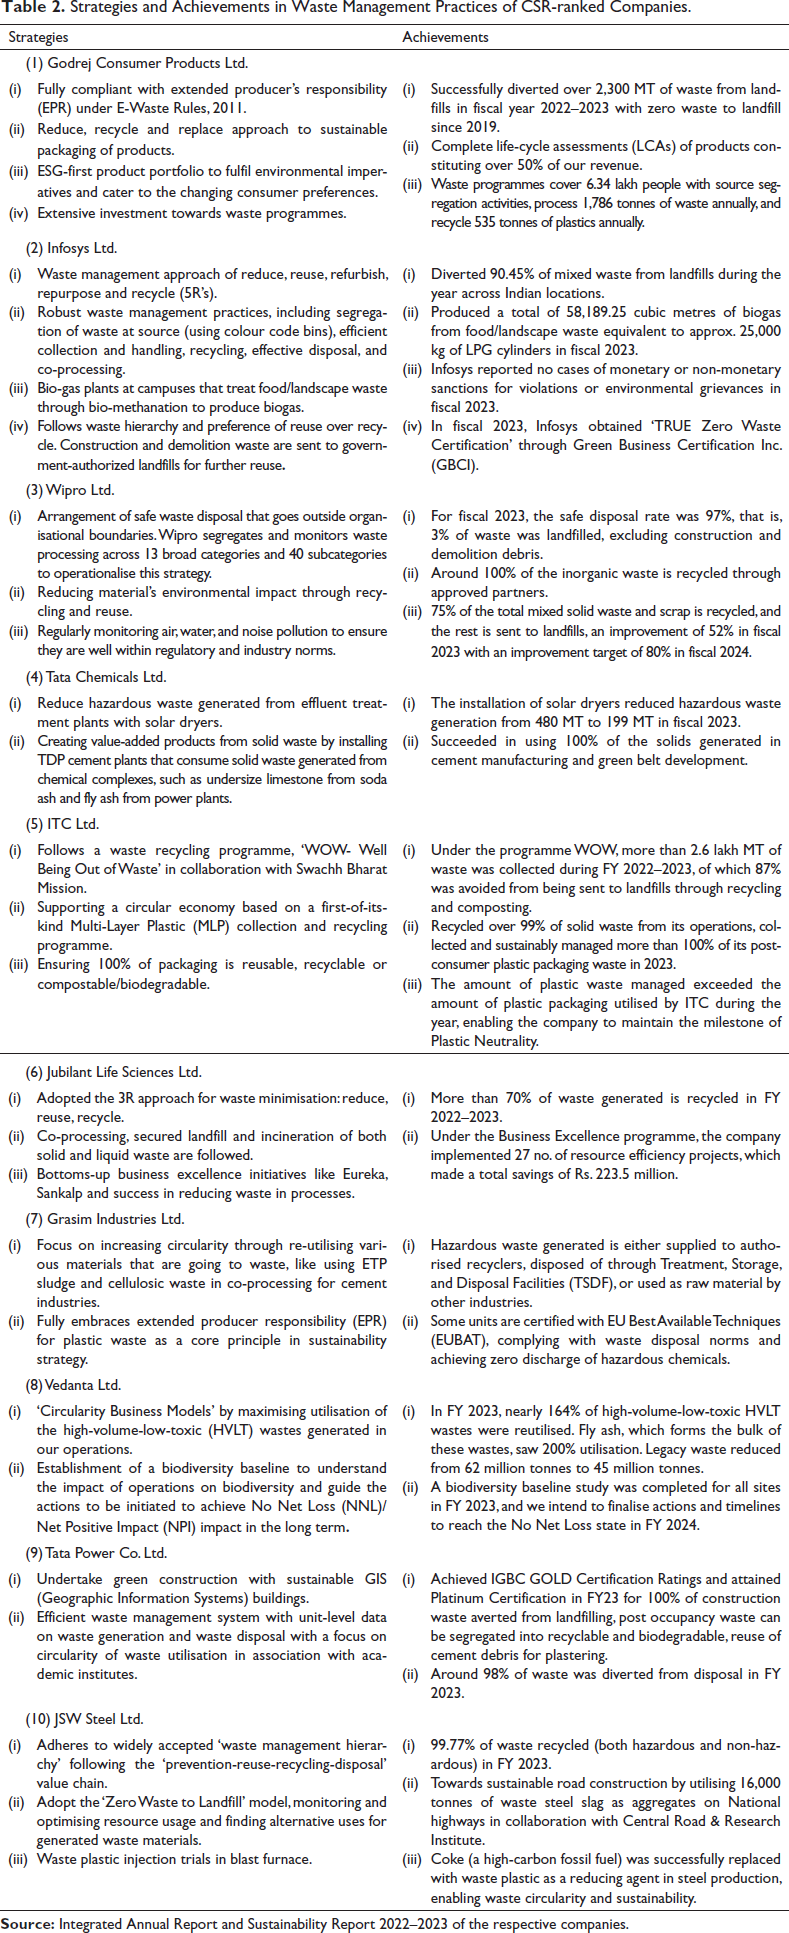
Through the qualitative assessment of the waste management practices adopted by CSR-ranked companies, it is found that most companies adhere to the 3Rs approach or its modified version, like the 5Rs approach of waste minimisation. To ensure circularity and sustainability, the companies have adopted efficient waste management techniques like co-processing, which is the use of waste as raw material, as a source of energy, or both to replace natural mineral resources and fossil fuels. ‘Zero Waste to Landfill’ remains the major focus of the waste management programmes adopted by these companies, and so far, only the Godrej Consumer Products Ltd. has successfully achieved zero waste to landfilling backed by Extended Producers Responsibility (EPR) and through life-cycle assessments (LCAs). Further, most manufacturing companies that sell branded products with plastic packaging comply with the requirements of Extended Producer Responsibility under the Plastic Waste Management Rules, 2016 and also perform LCAs for their product portfolio. These companies are Godrej Consumer Products Ltd., Tata Chemicals Ltd., ITC Ltd., Grasim Industries Ltd., and JSW Steel Ltd.
Quantitative Analysis of Waste Management Practices of CSR-ranked Companies
The other section in the reporting pattern of waste management practices adopted by the CSR rank companies includes quantitative reporting highlighting the performance under waste management practices, which is primarily a ‘numeral reporting’. Quantitative reporting serves the concerned stakeholders of the company as a performance indicator of the achievement of waste management practices by reflecting the numeral quantitative information on waste handling. Previously, without a given standard or a framework for reporting waste management practices, few companies voluntarily reported the quantitative data in a separate report file, say in a sustainability report, or business responsibility report, etc, which tremendously varied across companies. Since the BRSR framework came into effect, the quantitative data on waste management practices is reported in ‘PRINCIPLE 6: Businesses should respect and make efforts to protect and restore the environment’ under the statutory report section of the integrated annual report. Thus, the summarised version of waste management practices reported as quantitative data while pursuing the strategies and initiatives as discussed in Table 2 above has been presented and discussed company-wise using the following data tables.
Table 3 presents the waste management accounting and reporting practices of the selected 10 companies for the voluntary period FY 2021–2022. Section (a) of Table 3 shows that Tata Chemicals has generated the highest quantity of plastic waste, followed by Godrej Consumer Products Ltd. However, companies like ITC Ltd., Grasim Industries, and Tata Power have not disclosed the quantity of plastic waste generated; instead, it has been merged and reported as non-hazardous waste. Also, Grasim Industries and Tata Power have not provided bifurcation or break-up by composition of both hazardous and non-hazardous waste. Vedanta Ltd., a natural resource supplier, has reported the highest quantity of both hazardous waste and non-hazardous waste, topping the list with 1.95 crore metric tonnes of waste being generated in 2021–2022, followed by JSW Steel Ltd., with 1.32 crore metric tonnes of waste generated. On the other hand, Wipro Ltd., a service-providing company, stands lowest with only 2700 metric tonnes of waste generated in the same year, followed by Infosys Ltd. Surprisingly, Jubilant Life Sciences Ltd. remains third lowest in quantity of waste generation with 13308 metric tonnes of waste generated and fourth lowest being Godrej Consumer Products Ltd., with 14627 metric tonnes of waste generated which is significantly lower as compared to waste of 1.95 crore metric tonnes being generated by Vedanta Ltd., all being a manufacturing companies.
Waste Management Reporting Reported as per GRI 306 in BSBR for FY 2021–2022.
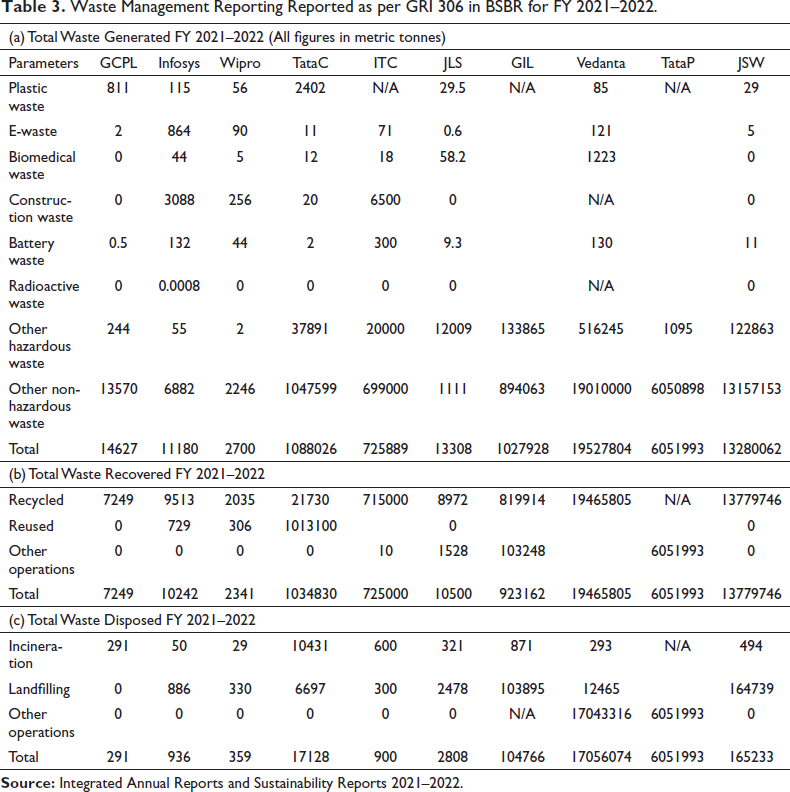
In waste recovered section (b) of Table 3, Vedanta Ltd., which reported the highest quantity of waste generated, has recovered 1.946 crore metric tonnes of such waste, but the process of recovery operations is not disclosed in the report. Second, JSW Steel Ltd., which had generated 1.32 crore metric tonnes of waste, reports recovering 1.37 crore metric tonnes of waste through the process of recycling. Tata Power Ltd. reports recovering 100% of waste generated in the same year, but again, the process of such recovery is not disclosed. Similarly, a few companies (ITC Ltd., Jubilant Life Sciences Ltd., and Grasim Industries Ltd.) have reported quantities of waste being recovered through other recovery operations, but details on such operations are not provided. Although some companies have reported waste reused and recycled as a single parameter without any bifurcation, it can be stated that most of the companies have recovered waste through the recycling or reusing process, which clearly indicates a mark for achieving the sustainability goals.
Finally, in the waste disposed section (c), Godrej Consumer Products Ltd. is the only company that sends zero waste to landfill and has achieved the goal of ‘Zero Waste to Landfill’ since 2019. However, companies such as JSW Steel Ltd. and Grasim Industries Ltd. have disposed of massive quantities of waste in landfills. Further, Vedanta Ltd. and Tata Power Co. Ltd. have reported massive quantities of waste being disposed-off through other disposal operations, but details on operations are not mentioned in the report.
So, through detailed content analysis of Table 3, it can be stated that most of the companies have followed and provided a break-up of waste generated, but still, a massive quantity of waste is cumulated in the hazardous and non-hazardous section, which clearly demands a need for further filtration or bifurcation of waste category. This also provides evidence that the existing format may not be applicable to all companies that largely differ in their business activities, and as such, inter-company comparison is not feasible. It is also stated that the parameter ‘other operations’ in both the waste recovered and waste disposed section provides enough ground to blanket vital information on industrial waste handling practices unless a provision is to be made to report such operations within the same structure in brief after external assurance.
Table 4 reveals the companies’ waste management accounting and reporting practices for the mandatory period FY 2022–2023. In section (a) of Table 4, we see that Vedanta Ltd. and JSW Steel Ltd., as similar in FY 2021–2022, remain the top two companies of highest waste generation with 1.86 crore metric tonnes and 1.42 crore metric tonnes, respectively. The Tata Power Co. Ltd. remains the only company that provides no bifurcation or break-up by composition in the waste generated section for FY 2022–2023. The ITC Ltd., as similar to FY 2021–2022, has merged the quantity of plastic waste with the other non-hazardous waste. Surprisingly, Godrej Consumer Products Ltd., a manufacturing company, stands second lowest in terms of waste generation, with only 4730 metric tonnes of waste generated in FY 2022–2023 after Wipro Ltd., with 4478 metric tonnes of waste generated. The waste generated by Godrej Consumer Products Ltd. is much lower than that of Infosys Ltd., a services company. Even after considering the massive construction and demolition waste by Infosys Ltd., in FY 2022–2023, it generated higher waste than Godrej Consumer Products Ltd. The pattern of waste reporting is similar to FY 2021–2022, where most waste is cumulated at the hazardous and non-hazardous waste parameters for all the companies.
Waste Management Reporting Reported as per GRI 306 in BSBR for FY 2022–2023.

The waste recovered section (b) of Table 4 reveals a similar pattern to FY 2021–2022, where some companies have reported waste recycled and reused as a single parameter. Vedanta Ltd. reports the highest quantity of waste being recovered in FY 2022–2023, but the recovery operation of such wastages is not disclosed; rather, it is reported under a single parameter of waste recovered with no bifurcation. Similarly, Tata Power Co. Ltd. reports that 100% of the waste generated is being recovered, but such recovery operation is not disclosed in the given format. Lastly, JSW Steel Ltd. has recovered more than 100% of waste generated through its recycling process, which, along with Godrej Consumer Products Ltd., are the two companies that adopted only the recycling operation in the waste recovery process.
Again, Godrej Consumer Products Ltd. has achieved the ‘Zero Waste to Landfill’ goal for FY 2022–2023, while other companies divert a significant quantity of waste to landfills, as seen in section c of Table 4. Although some companies claim to divert such waste to municipal authorised wastelands, waste treatment in such authorised landfills is still questionable. Few companies have reported waste disposal through other disposal operations, but such operations are not mentioned, and Tata Power Co. Ltd. remains the only company to provide no bifurcation on the quantity of waste being disposed of.
The content analysis of Table 4 reveals no significant improvement in the reporting pattern during the FY 2022–2023 as some companies does not follow the break-up by composition in the waste generation section, which provides an unclear picture about the types and quantities of waste generated along with massive quantity of waste accumulated in the hazardous and non-hazardous section which again demands a need for further filtration of waste categories. The situation is similar in the waste recovered section, where different recovery processes are combined and reported as a single parameter with vague information about other recovery processes. The pattern of reporting the waste disposal methods is similar to the previous year, where both Tata Power Co. Ltd and Vedanta Ltd. have disclosed waste disposal through other operations, while such methods of operations remain undisclosed. The majority of the companies follow similar patterns and exhibit similar trends in waste management reporting, but the handful of companies has made it difficult to present a full inclusive picture of the waste management practices, including waste recovery and disposal processes.
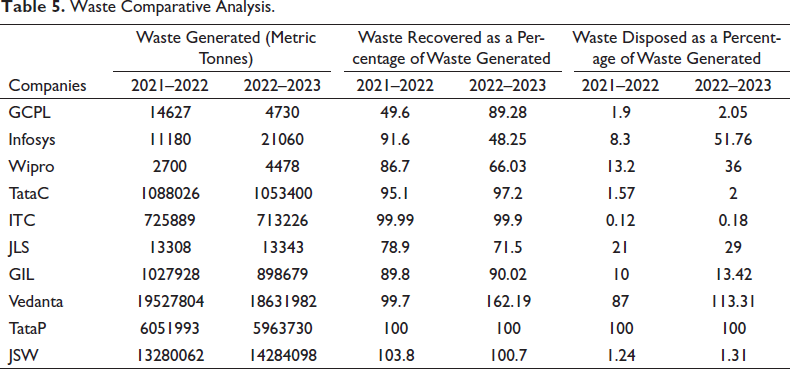
Now, we use a simple percentage to analyse the pattern of waste handling for all 10 companies. In Table 5, we present the comparative analysis of the waste recovered and disposed waste as a percentage of total waste for FY 2021–2022 and 2022–2023. An important pattern can also be observed in the waste treatment process where most of the companies’ waste quantities undergo waste recovery rather than waste disposal operations for both years. Only Infosys Ltd., in FY 2022–2023, has a higher percentage of waste disposed (51.76%) as compared to its percentage of waste recovered (48.25%) due to higher construction and demolition wastages, which was sent to municipal authorised landfills. Companies like Godrej Consumer Products Ltd., Tata Chemicals Ltd., ITC Ltd., and JSW Steel Ltd. divert a minuscule percentage (below/around 2% of total waste generated) to waste disposal operations for both years, which is indeed an appreciating achievement towards an efficient waste management practice in Indian corporate sectors. The waste treatment of other companies seems quite satisfactory as they have adopted strategies to divert the waste towards recovery operations. This displays the pattern of waste treatment practices, where most companies adhere to waste recovery rather than waste disposal, as they try to recycle and reuse the waste generated in their ordinary business process. The trend of minimising waste disposal remains prevalent among these companies as they focus more on bringing the waste disposal metrics to null, and this trend should be communicated and carried to other companies in similar industries in the Indian corporate sector.
Waste Comparative Analysis.
After analysing the reporting pattern under the BRSR framework, it is understood that all the companies have prepared and reported their sustainability reports in an unstructured fashion. Further, the current format may not be suitable for all the business activities as we observed massive accumulation of waste quantity in sections like ‘other hazardous waste’ and ‘other non-hazardous waste’ on which the majority of the companies have provided no break-up by composition within these two parameters. Also, parameters like ‘other recovery operations’ and ‘other disposal operations’ in the format allow companies not to disclose the actual recovery or disposal methods that may be detrimental to public health, society, and nature as a whole. Since it is exposed that the reporting pattern varies across companies to some extent, it is necessary to present a simplistic view of the issue of waste generation across these companies. Further, to make the comparison more convenient, we use a few composite ratios identified as waste intensity ratios, which are computed by making a comparison between non-financial and financial information. From the integrated annual reports 2021–2022 and 2022–2023 of the respective companies, the information such as turnover, number of employees (including workers), EPS (basic) and total waste generated is extracted, and the three ratios viz., ‘Waste generated per crore Turnover’, ‘Waste generated per Employee’ and ‘Waste generated per rupee EPS’ is computed and presented in Table 6 where the waste generated (in metric tonnes) excludes construction and demolition waste to present fair information on the waste generated during normal business activities.
Waste Intensity Ratios.
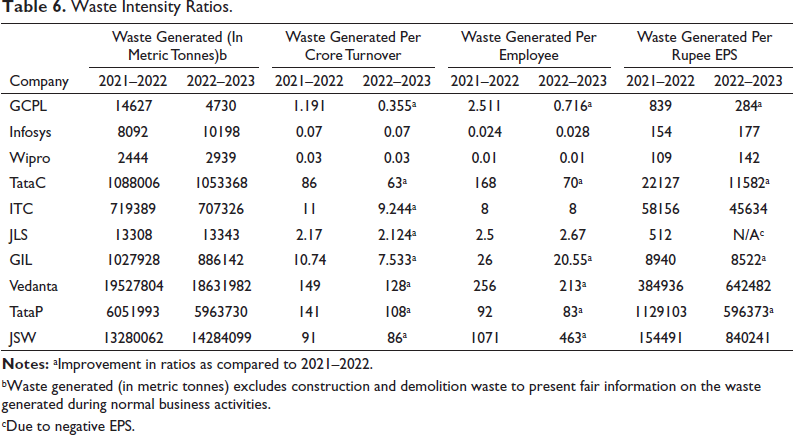
bWaste generated (in metric tonnes) excludes construction and demolition waste to present fair information on the waste generated during normal business activities.
cDue to negative EPS.
It is observed in Table 6 that for the FY 2022–2023, waste generated per crore turnover is highest for Vedanta Ltd., with 128 metric tonnes per crore turnover, followed by Tata Power Ltd., with 108 metric tonnes per crore turnover and lowest across service companies for Wipro Ltd., with 0.032 metric tonnes per crore turnover and Infosys Ltd., with 0.069 metric tonnes per crore turnover. Per employee waste generated is highest for JSW Steel Ltd., which generated 463 metric tonnes of waste per employee engaged, followed by Vedanta Ltd. and Tata Chemicals Ltd. Last of all, the waste generated per rupee of EPS reveals breath-taking metrics showing JSW Steel Ltd. generated 840241 metric tonnes of waste per rupee of EPS, which means that to provide an earning of one rupee to a shareholder, the company has generated 840241 metric tonnes of waste. Similar figures are exposed by Vedanta Ltd. and Tata Chemicals Ltd. The service companies, that is, Wipro Ltd., generated 141.775 metric tonnes of waste per rupee of EPS, the lowest amongst these ten companies. With improvement in 18 ratios (marked with *) for FY 2022-23 in comparison with FY 2021–2022, the waste intensity ratios reveal a gradual movement towards the achievement of their respective sustainability goals, which is further expected to improve in future as there exists an ample space of improvement in the sustainability practices.
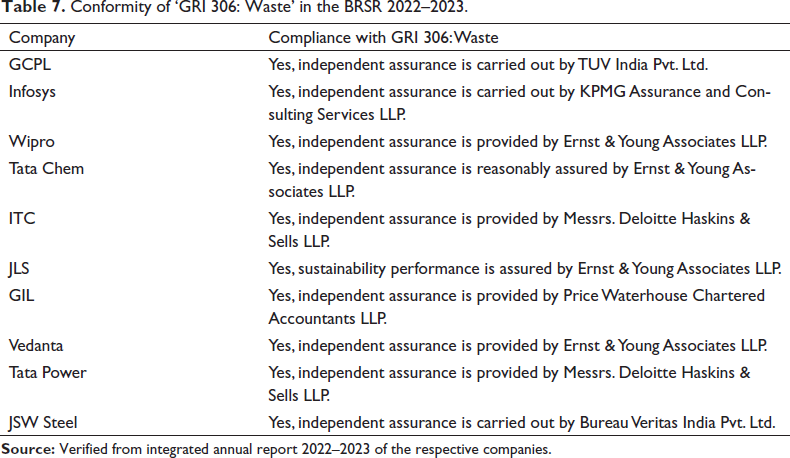
The question of the assurance and authenticity of the reported data on waste management practices requires validation. Further, the analysis of compliance with the GRI is necessary to meet the objective of the present study. Table 7 is of such purpose. Analysing the compliance with GRI, it is observed that all the companies selected for the study have complied with GRI guidelines. In more specific terms, the compliance falls under the GRI Series 300, which includes ‘Environmental Series’, and under this series, GRI 306 is a topic-specific standard for waste named ‘GRI 306: Waste’, and it confirms that the companies have complied with the global reporting practice and the compliance is reasonably assured by its respective independent assurance entity.
Conformity of ‘GRI 306: Waste’ in the BRSR 2022–2023.
Concluding Remarks
Since the BRSR framework came into effect in the year 2022–2023, the waste management practices reported in the integrated annual report of the respective ten companies have revealed various significant and relevant information in both qualitative and quantitative terms. Although the financial year 2022–2023 marked the end of voluntary reporting and the beginning of mandatory reporting of sustainable practices, the result of content analysis of such report states that the disclosure made by the companies under a given framework remains unstructured, which varies across companies. These variations are briefly highlighted as:
Considering the qualitative content analysis of the sustainability report, comparing qualitative waste management measures across companies is not viable due to the lack of a common ground or the absence of a qualitative disclosure framework. This concerns the inability to produce inter-company comparisons on qualitative ground. In the quantitative report section, some companies have provided detailed breakdowns by composition of ‘hazardous waste’ and ‘non-hazardous waste’ as available in the report, while some have not provided the same. Further, the massive accumulation of waste quantity in these two sections indicates that major parameters of waste accounting are unidentified in the current framework. Majority of the company has used ‘metric tonnes’ as a parameter to measure the quantity of waste except for ITC Ltd., which has used ‘Kilo tonnes’ as a waste measurement unit, which was later converted for the purpose of analysis. Further, ITC Ltd. has reported plastic waste under non-hazardous waste (originally mentioned in the report), while the majority of the companies have separately reported the actual quantity of plastic waste generated. Some companies, like Grasim Industries Ltd., Vedanta Ltd., and Tata Power Ltd., have made no bifurcation on the category of waste recovered, as both reused and recycled waste are reported as a single indicator. Also, Grasim Industries Ltd. had bifurcated hazardous and non-hazardous waste in the waste recovered and waste disposed section in the original report, which is unique among all the other companies. Majority of the companies have not mentioned the procedures under ‘other recovery operations’ and ‘other disposal operations’, although a significant quantity of waste is accounted for and reported under these indicators.
In the presence of these inconsistencies, it can be stated that all the companies under study have undertaken waste management accounting and reporting practices in compliance with GRI guidelines. Further, each company has reported the sustainability report in BRSR, which is included under the statutory report of the integrated annual report. Though sustainability reporting in the Indian corporate sector was under several transitory phases during the voluntary reporting period, such reports under the mandatory reporting phase require a huge scope of improvement. The findings of these studies stand in line with the study of Veleva et al. (2017), who raised the issue of inconsistent waste disclosure data with ineffective and inadequate parameters to measure both waste generation and waste disposal. Ultimately, the study suggests the need for immediate and integrated compliance with global reporting standards, such as GRI standards, in a stringent fashion so that any anomalies of sustainable corporate reporting can be removed and replaced with expressive content. Also, the waste intensities ratios, as suggested through this study, can help the companies to trail their efforts towards environment and sustainability by integrating all the concerned stakeholders of the organisation as it shows the cost incurred in terms of waste generation to provide benefit returns (turnover, EPS, employment etc) to the stakeholders. This ratio can help identify the interaction of the organisation and its stakeholders with the environment in terms of waste generated, and suggestions are to keep such ratios as low as possible to control the negative impact on the environment, which is very high and shrill as shown in the findings of this study.
Footnotes
Declaration of Conflicting Interests
The authors declared no potential conflicts of interest with respect to the research, authorship and/or publication of this article.
Funding
The authors received no financial support for the research, authorship and/or publication of this article.