



Abstract
The article examines the motives and determinants of foreign direct investment (FDI) in Oman during the period 1980–2013. It investigates the market size, natural resources, inflation rate, trade openness and government expenditures as factors influencing FDI. Cointegration and vector error correction model (VECM) approach are used to identify the short- and long-run dynamics of the FDI determinants. The Johansen cointegration test reveals an existence of long-run relationship among the FDI determinants. This long relationship indicates that FDI flows in Oman are positively influenced by the market size and natural resources, and negatively by inflation rate and degree of openness. The error correction term suggests that approximately 36 per cent of total disequilibrium in FDI flows was being corrected each year. Moreover, Granger causality results show that there is a unidirectional causality running from each of the market size and natural resources to FDI, indicating that flows of FDI into Oman are characterized by market-seeking and resource-seeking motives.
Keywords
Introduction
Foreign direct investment (FDI) facilitates the process of economic growth and development in host countries, as it provides them with additional capital, new technology, organizational and managerial practices and global production networks (Goldberg, 2007; Lall, 2000; OECD, 2002; Ok, 2004; Wang & Blomström, 1992).
The World Investment Report by United Nations Conference on Trade and Development (UNCTAD, 2014) confirms that FDI flows showed an increase of 9 per cent in 2013 reaching $1.45 trillion, and expected to rise to $1.6 trillion in 2014, $1.7 trillion in 2015 and $1.8 trillion in 2016. The flows to the developing countries increased from $648.2 billion in 2010 to $778.4 billion in 2013, contributing with 46.5 per cent of the global FDI. Similarly, emerging economies have attracted $107.9 billion of FDI in 2013 compared with $70.5 billion in 2010, with a compound annual growth rate (CAGR) of 15 per cent during the period 2010–2013.
In contrast, the share of the FDI flows to the Gulf Cooperation Council (GCC) witnessed a decline from 1.74 per cent in 2011 to 1.65 per cent in 2013. Oman, among the two countries, in addition to United Arab Emirates (UAE), has kept a good track of FDI flows since the 1990s. It registered an increase of 56 per cent in FDI flows in 2013 compared with 9.2 per cent for the UAE. Also the business environment in the country has improved immensely to the extent that Oman occupied the third rank among the countries of the Middle East and North Africa (MENA) region, and 47th globally in the ease of doing business according to the World Bank rankings in 2013.
FDI is vital for Oman for a number of reasons. First, it represents one of the most important pillars of the country’s long-term strategic plan ‘Vision Oman 2020’ that aims to diversify the Omani economy and reduce its heavy reliance on Oil. Second, according to a number of estimates, Oman’s oil resources will be depleted by the year 2022 and hence FDI can supplement the country with additional capital and increase its savings capacity. Third, the new technology and modern management practices associated with FDI enhance the efficiency and competitiveness of the Omani economy.
To attract FDI, Oman has undertaken many economic reforms embedded in the ‘Vision Oman 2020’, the long strategy covering the period 1996–2020. The strategy emphasized local human resources development, diversification, private sector and foreign investment promotion as prime pillars. Also, the law of foreign capital investment declared in 1994 with subsequent amendments provided good incentives to the foreign investors. This major policy change may create structural break in the FDI series that need to be considered in the analysis. The incentives in that law included tax holidays, removal of entry and ownership restrictions, free transfer of capital and profits, exemption from custom duties for raw material and capital goods, subsidized electricity, water and fuel charges and granting land at concessional least rent and government soft loans (OCCI, 2013). Following these developments, FDI flows showed a tremendous increase from $111 million in 2004 to $1.485 billion in 2009, reaching $1.626 billion in 2013 with a CAGR of 34.8 per cent during the period 2004–2013. According to the National Centre for Statistics and Information report (2014), the oil and gas exploration projects have taken the lion’s share of the FDI in 2012, amounting to 46.6 per cent; followed by the manufacturing and trade projects, 28.7 per cent; financial intermediation, 18.3 per cent; and the share of other sectors, such as, transport, telecommunications and hotels, constituting 6.4 per cent.
This good performance of FDI flows in Oman, which reflects the growing interest of the international investors to invest in the country, raises a number of questions: what factors are responsible for these flows and what can policymakers do to sustain these flows? To answer these questions, this study is motivated to examine the main determinants of the FDI.
Most of the previous studies investigated determinant of FDI in Oman and addressed the issue within a panel data framework, such as, MENA region, Middle East countries or Arab countries (Mohamed & Sidiropoulos, 2010; Elfakhani & Matar, 2007). Although this frame enables to study dynamic relationship and control for individual heterogeneity (Hsiao, 2003), it suffers from many limitations related to the design, data collection and data management of panel surveys (Kasprzyk, Duncan, Kalton and Singh, 1989). This study is based on time series analysis, exploring the motives and determinants of FDI in Oman during the period 1980–2013. The focus on that period was mainly due to the limits on data availability for longer series in Oman.
The remaining part of the article is organized as follows: Section 2 provides a review of the literature on the motives and determinants of FDI, Section 3 presents the methodology, Section 4 presents the empirical results and discussion and Section 5 concludes the article.
Motives and Determinants of FDI
The FDI literature examining why FDI goes where it goes has identified three motives: market seeking, resource/labour seeking and efficiency seeking (Dunning, 1993). In the market seeking, the foreign investments flows are attracted by the size of the economy to make of the benefits of economies of scale and continued demand. Size of the market is measured by the gross domestic product (GDP) or per capita income, and growth potentials. For resource seeking, the pulling factors for FDI are the availability of natural resources—such as, minerals and raw material—cheap labour and good infrastructure. The efficiency-seeking investments are motivated by well-cultured, institutional and economic systems in the host countries.
There is a vast literature on the empirical determinant of FDI. A study of Sánchez-Martín, de Arce and Escribano (2014) addressed the main factors influencing FDI in Latin America over the period 1990–2010, and has found that trade openness, low short-term debt levels and balance of payments deficit, government stability and low expropriation risk are key factors. Omanwa (2013) explored factors affecting FDI inflows in Kenyan economy during the period 1996–2009 and showed that only market size and openness found to be significant. Khondoker and Kalirajan (2010) in a panel data examining FDI determinants in 68 low-income and lower-middle-income developing countries concluded that GDP and GDP growth rate, trade and a friendly business environment are main derivers for FDI in these countries. Similarly, Asiedu (2006) investigated factors affecting FDI in a panel data for 22 countries over the period 1984–2000 and has found that natural resources, large markets, lower inflation, good infrastructure, an educated population, openness to FDI, less corruption, political stability and a reliable legal system all promote FDI. In contrast to the positive role of market size on FDI, Edwards (1990) and Jaspersen, Aylward and Knox (2000) have found a negative relationship when using the inverse of GDP per capita.
Mohamed and Sidiropoulos (2010) studied the main determinants of FDI in MENA region using panel data over the period 1975–2006. The study showed that size of the host economy, the government size, natural resources and the institutional variables are key derivers of FDI to the MENA region. Also, in a dynamic panel model covering the period 1990–1999, Kamaly (2002) showed that only the economic growth and the lagged value of FDI/GDP are significant determinants of FDI flows in the MENA region.
In a study of Ali and Guo (2005) for 22 firms operating in China, it was found that the large market size and low labour cost are major factors attracting FDI in China, especially for the US and Asian firms. Location advantage was found to be the main reason behind China being attractive to FDI as shown by Zhang (2000) and Wei and Liu (2001). On the other hand, Yunshi and Jing (2005) explained success of China in attracting FDI to factors, such as, preferential foreign investment policies, low cost of labour, increasing purchasing power and good investment environment. Kinda (2010), Swain and Wang (1997) and Liu, Romilly, Song and Wei (1997) concluded that there was a positive relationship between the relatively cheap labour in China and inward FDI, while the findings of Schneider and Frey (1985) showed the opposite.
In a panel data covering the period 1995–2000, Quazi and Mahmud (2004) indicated that economic freedom, degree of openness, economic prosperity and human capital affect FDI positively in South Asia: Bangladesh, India, Nepal, Pakistan and Sri Lanka, while political instability affect it negatively. The negative role of political instability was also confirmed by Swain and Wang (1997) and Liu et al. (1997) when studying FDI in China.
Naeem and Azam (2005) exploring FDI in Pakistan during the period 1970–2000 found that market size, domestic investment, degree of openness, indirect taxes, inflation and external debt are key factors. Azam and Lukman (2008) investigated the economic factors affecting FDI inflow into Pakistan, India and Indonesia using secondary data from 1971 to 2005, which showed that market size, external debt, domestic investment, openness, and infrastructure are key determinants of FDI. Muhammad and Mohammad (2012) showed that FDI in Pakistan is influenced by financial development, imports and economic growth.
With regard to the role of exchange rate on FDI, there is no general agreement in empirical literature. While Blonigen and Feenstra (1996) and Ang (2008) argued with a negative correlation between a country’s exchange rate and FDI, Edwards (1990) and Hasan (2007) claimed that the relation is positive. Similarly, Ricci (2006) found that for small countries or currency areas, exchange rate volatility has a long-run negative effect on FDI flows. Kozo and Urata (2004) and Lui, Chow and Li (2006) also claimed that a depreciation of the currency of the host country attracts FDI while high volatility discourages it. Other studies of Sader (1993) and Tuman and Emmert (1999) found no significant effect for exchange rate on FDI.
From the literature discussed above, we observe that the key determinants of FDI include factors, such as, market size—measured by GDP or GDP per capita—trade openness, return on capital, labour cost, quality of infrastructure, real exchange rates, political stability and domestic macro policies, although there is no general consensus to the direction of the effect.
Methodology
Cointegration and VECM
In economic time series analysis, a spurious relationship arises when we apply a vector autoregressive (VAR) model to series that are integrated. Two solutions are recommended: using a VAR model on first difference or using a vector error correction model (VECM). The latter is preferred as it provides the long relationship and produces efficient coefficient estimates (Hoffman, 1996).
The process of estimating a VECM involves the following steps:
To test whether the series have a unit root or not.
It checks for serial correlation and heteroscedasticity, and normality will be conducted for the residuals.



where yt is a (n × 1) vector of the n variables, m is a (n × 1) vector of constants, Γ represents a (n × (k–1)) matrix of short-run coefficients, εt denotes a (n × 1) vector of white noise residuals and Π is a (n × n) coefficient matrix. If the matrix Π has reduced rank (0 < r < n), it can be split into a (n × r) matrix of loading coefficients α, and a (n × r) matrix of cointegrating vectors β. The former indicates the importance of the cointegration relationships in the individual equations of the system and of the speed of adjustment to disequilibrium, while the latter represents the long-term equilibrium relationship, so that Π = αβ′, where k is the number of lags, t denotes the time and Δ is a difference operator.
Causality Test
To capture the short-term deviations of series from their long-term equilibrium path, Granger causality requires inclusion of an error term in the stationary model (Granger, 1986).

The terms in parentheses are the error correction terms (ECTs). Zt is said not to Granger-cause Yt if Zt cannot help predict future Y.
The Econometric Model
As the objective of this article is to explore the motives and determinants of FDI in Oman, an econometric approach has been adopted. The following model will be estimated:

where FDI refers to foreign direct investment flows in US$ millions taken as a ratio of GDP to avoid possibility of having a non-stationary or explosive dependent variable (Kamaly, 2003), MZ is the market size measured by GDP per capita, INF is a measure of inflation based on consumer price index, RES is the availability of natural resource endowments measured by the share of minerals and oil in total exports, Govexp is government expenditures and OPP is a measure of trade integration and openness with the rest of the world, measured as the share of goods and services trade in GDP. All data are compiled from World Development Indicators (WDI) of the World Bank database. The choice of these variables in the model was based on the nature and dynamics of the Omani economy, availability of the data and the good placement of these variables in the FDI literature (Asiedu, 2006; Omanwa, 2013).
Empirical Results
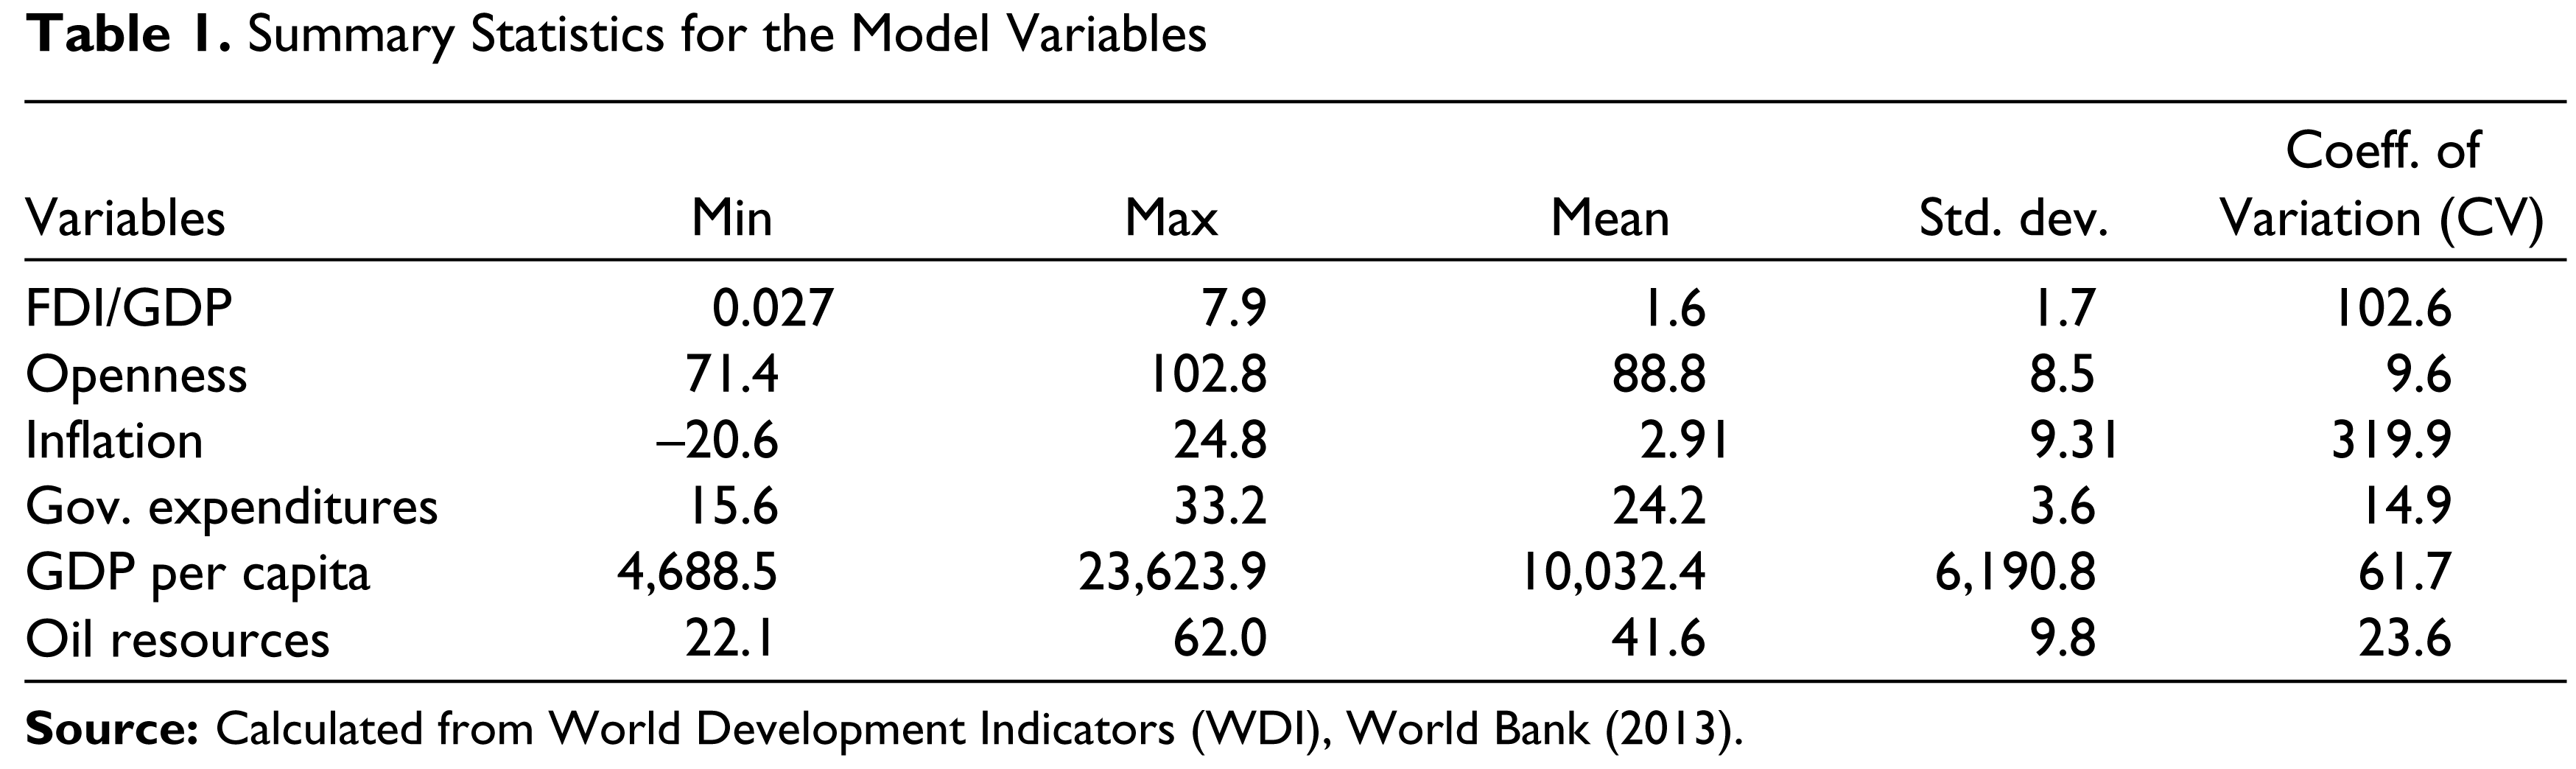
Table 1 provides the summary statistics for the FDI and its determinants. Over the period 1980–2013, the average of the ratio of the FDI to the GDP amounted to 1.6 per cent with a high coefficient of variation (CV) of 102.6 per cent, indicating great fluctuations in the performance of FDI during the given period. Also with the exception of inflation, which showed highest fluctuations, and the GDP per capita, the remaining variables exhibited less variations as indicated by their low CVs.
Summary Statistics for the Model Variables
Unit Root Unit Test (ADF) for the Model Variables
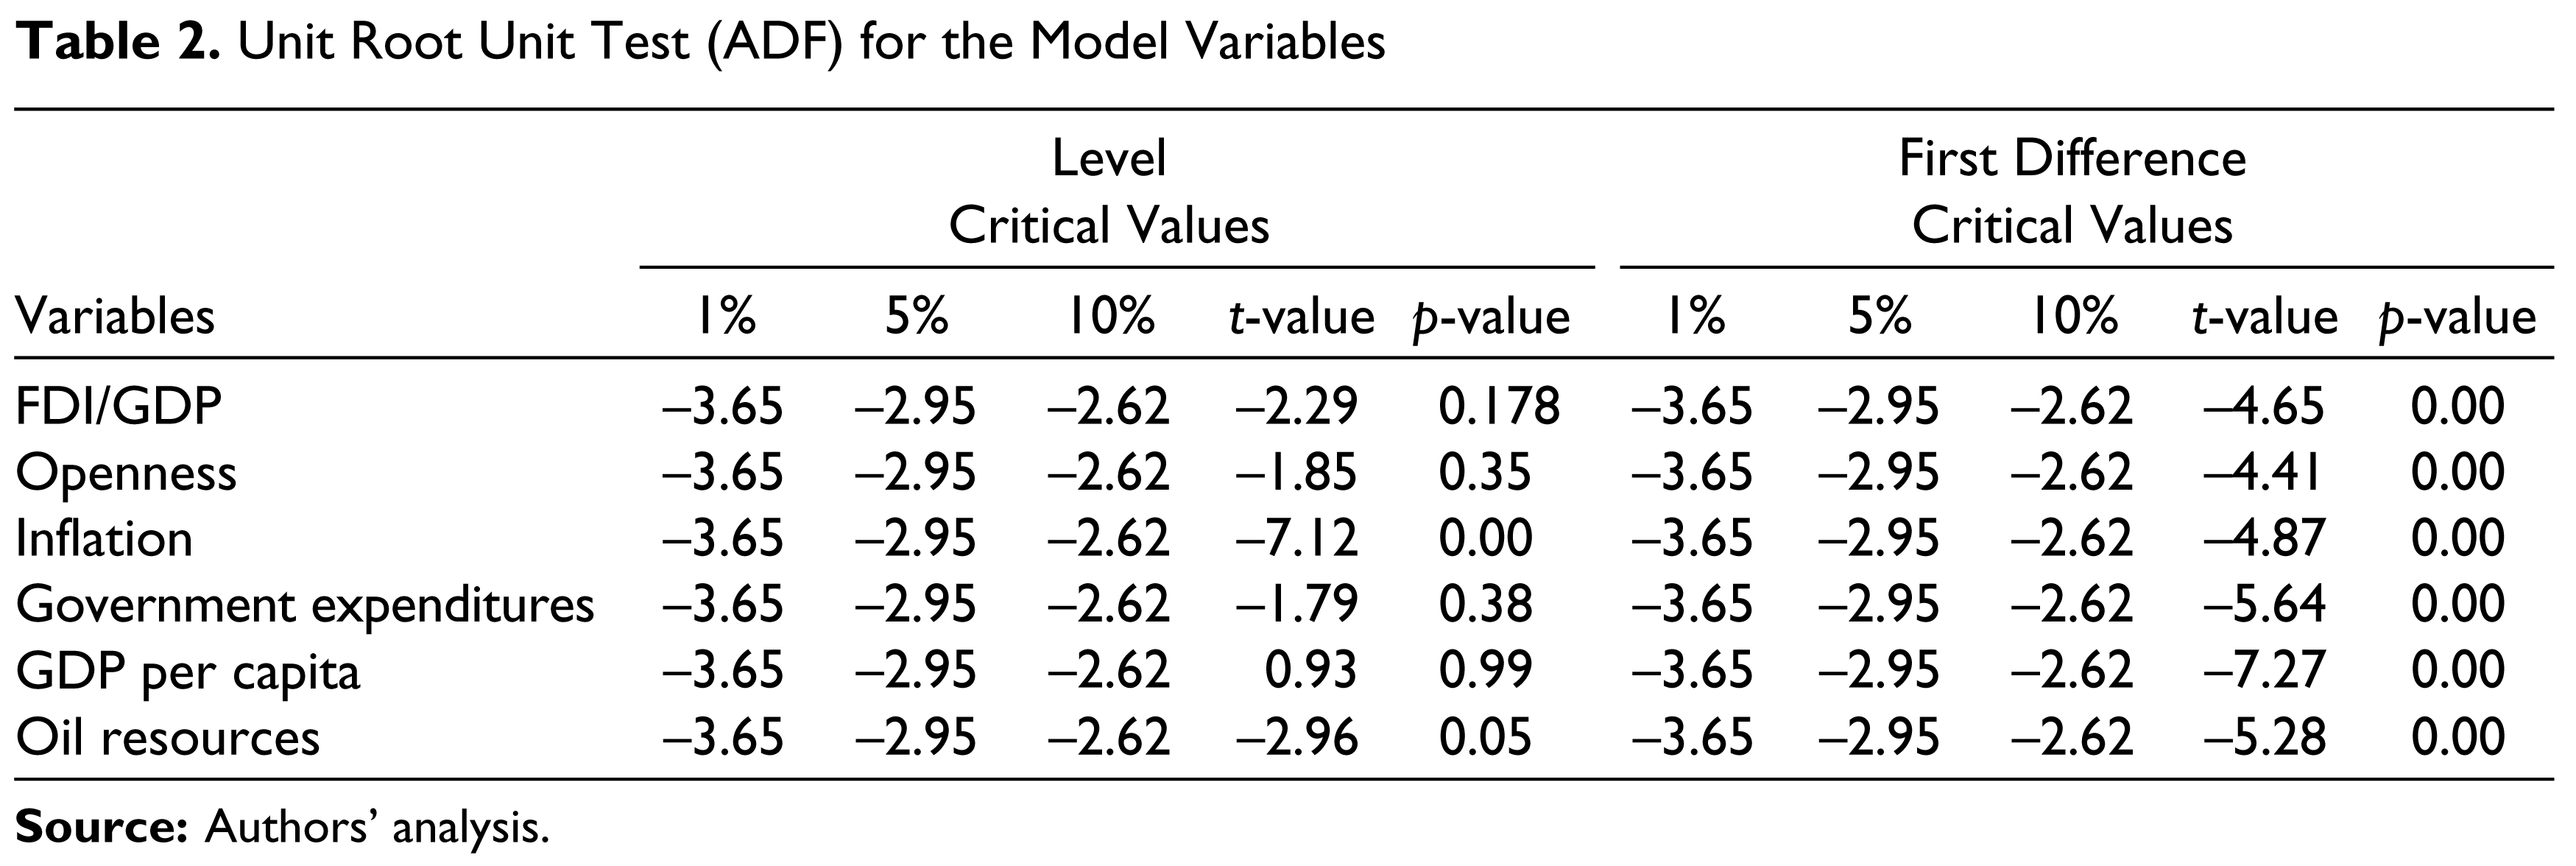
The results of the test of the stationarity of the series of the model are presented in Table 2. The unit root (ADF) test showed that at level, all the series with the exception of inflation are non-stationary (p-value > 0.05). The t statistics for ADF test for the FDI/GDP, openness, government expenditures, GDP per capita, and oil resources are not greater than the critical values at 1 per cent, 5 per cent and 10 per cent levels, respectively, implying that the variables are non-stationary in their level forms. On the other hand, inflation is stationary at level. For the first difference, the ADF test showed that all variables are stationary with p-value less than 0.05. With the exception of inflation, all the variables are integrated of order 1.
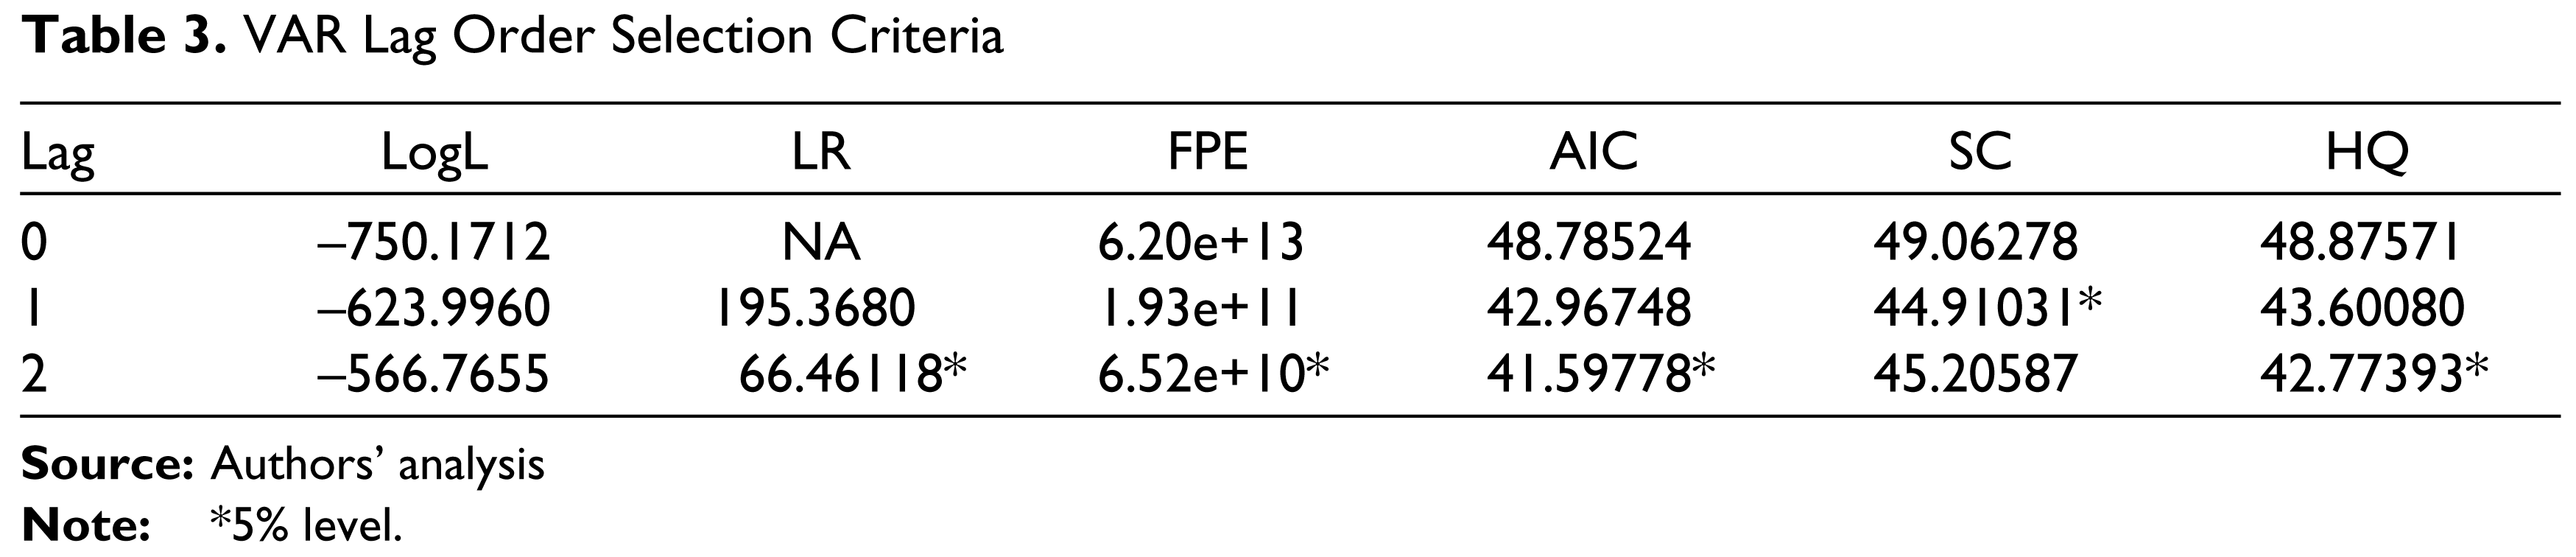
After formulating a VAR system containing FDI/GDP, openness, inflation, government expenditures and oil resources, VAR lag order selection criterion is provided in Table 3. With the exception of SIC that called for one lag, all the other criteria including AIC, HQC, final prediction error (FPE) and Sequential likelihood ratio (LR) called for two lags. Hence, lag two is considered as optimum lag in our model.
VAR Lag Order Selection Criteria
Johansen Cointegration Test
Normalized Cointegrating Coefficients

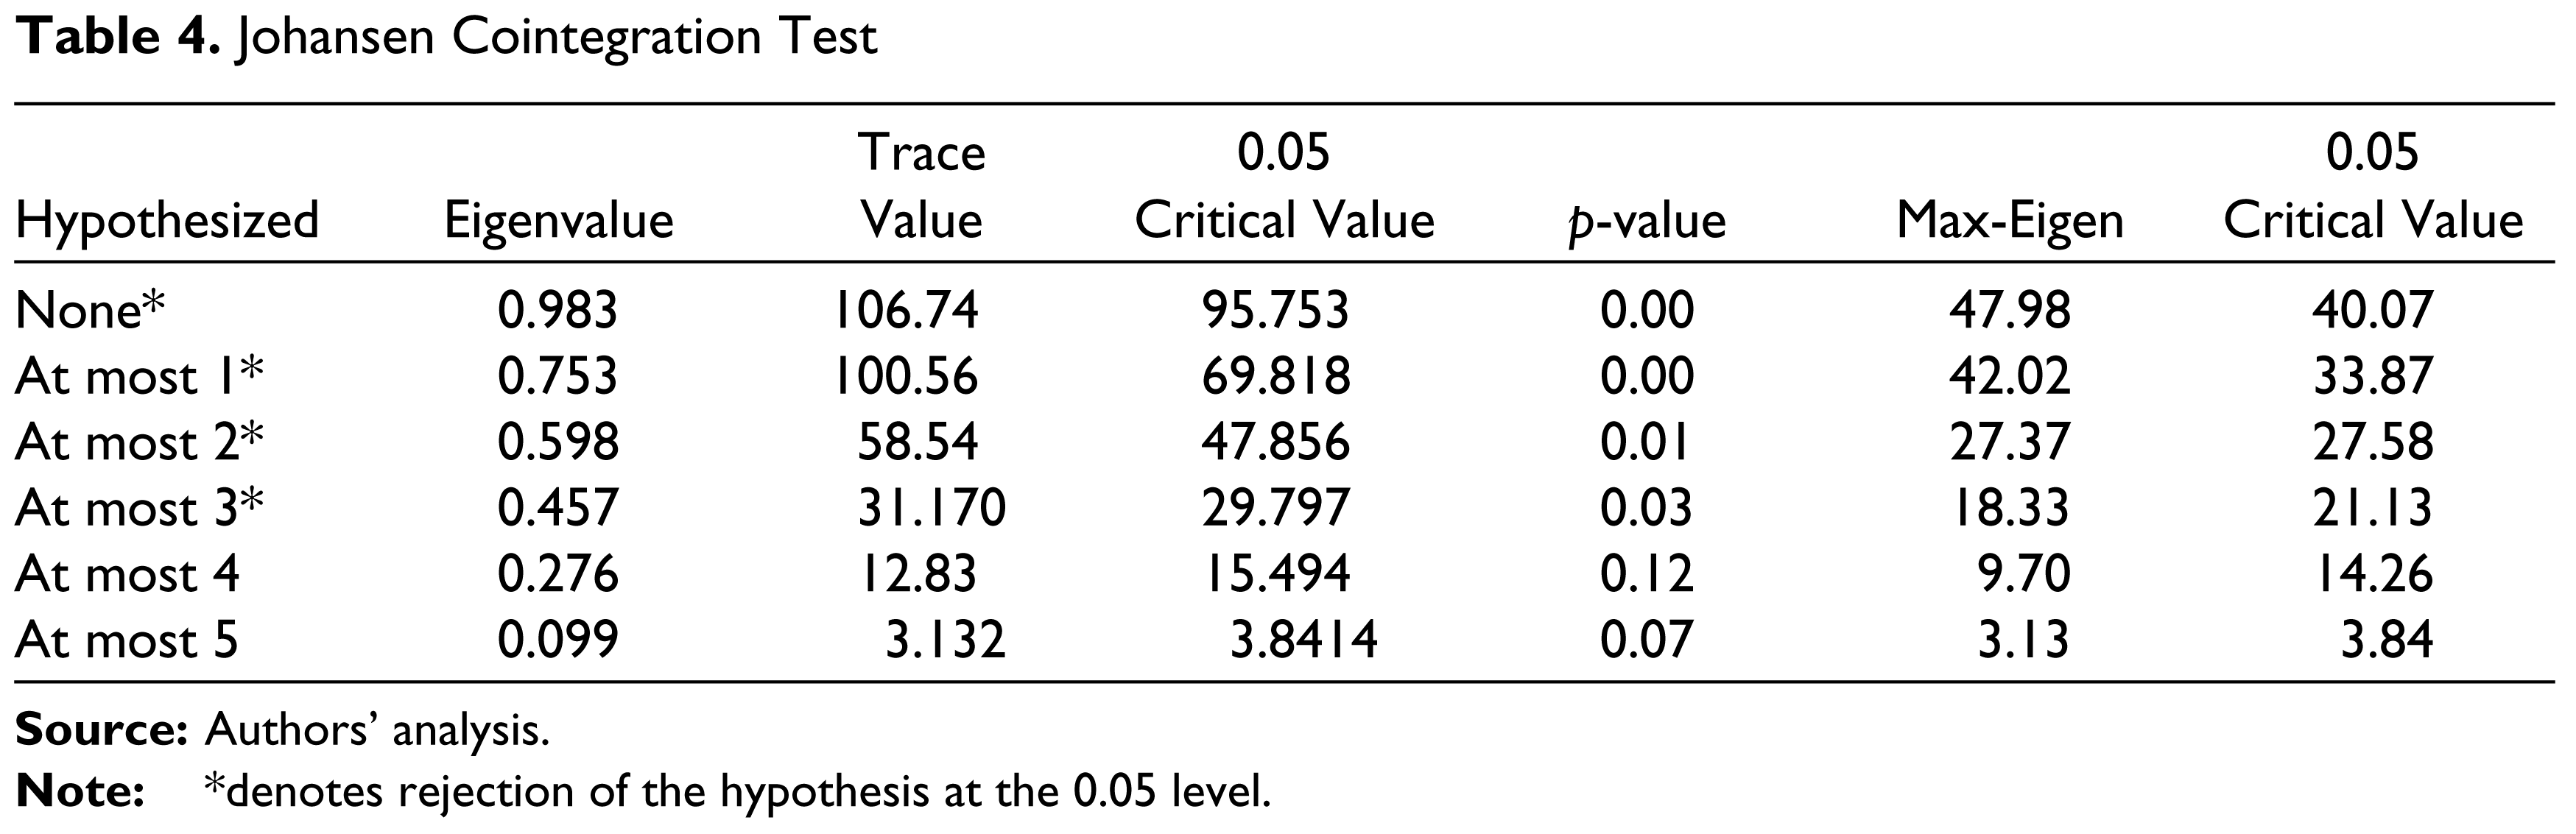
Since all variables are integrated of the same order, except inflation, Johansen cointegration test is performed and results are given in Table 4. The result showed that the trace value exceeds the critical value and there are four cointegrating equation(s) at the 5 per cent significance level, while max eigenvalue indicates two cointegrating equations.
Table 5 shows a normalized coefficient. As can be seen from Table 5, FDI is positively related to GDP per capita and resources and negatively related to inflation and degree of opens, with government expenditure insignificant.
Table 6 shows that ECT in all the equations has the negative and positive sign. However, the ECT in the FDI equation showed a coefficient of 0.361, indicating that adjustment towards the equilibrium takes place by 36.1 per cent per annum. On the other hand, the ECT for resources, inflation, openness and government expenditure shows a non-significant result, while for GDP per capita showed a significant result.
Error Correction Model

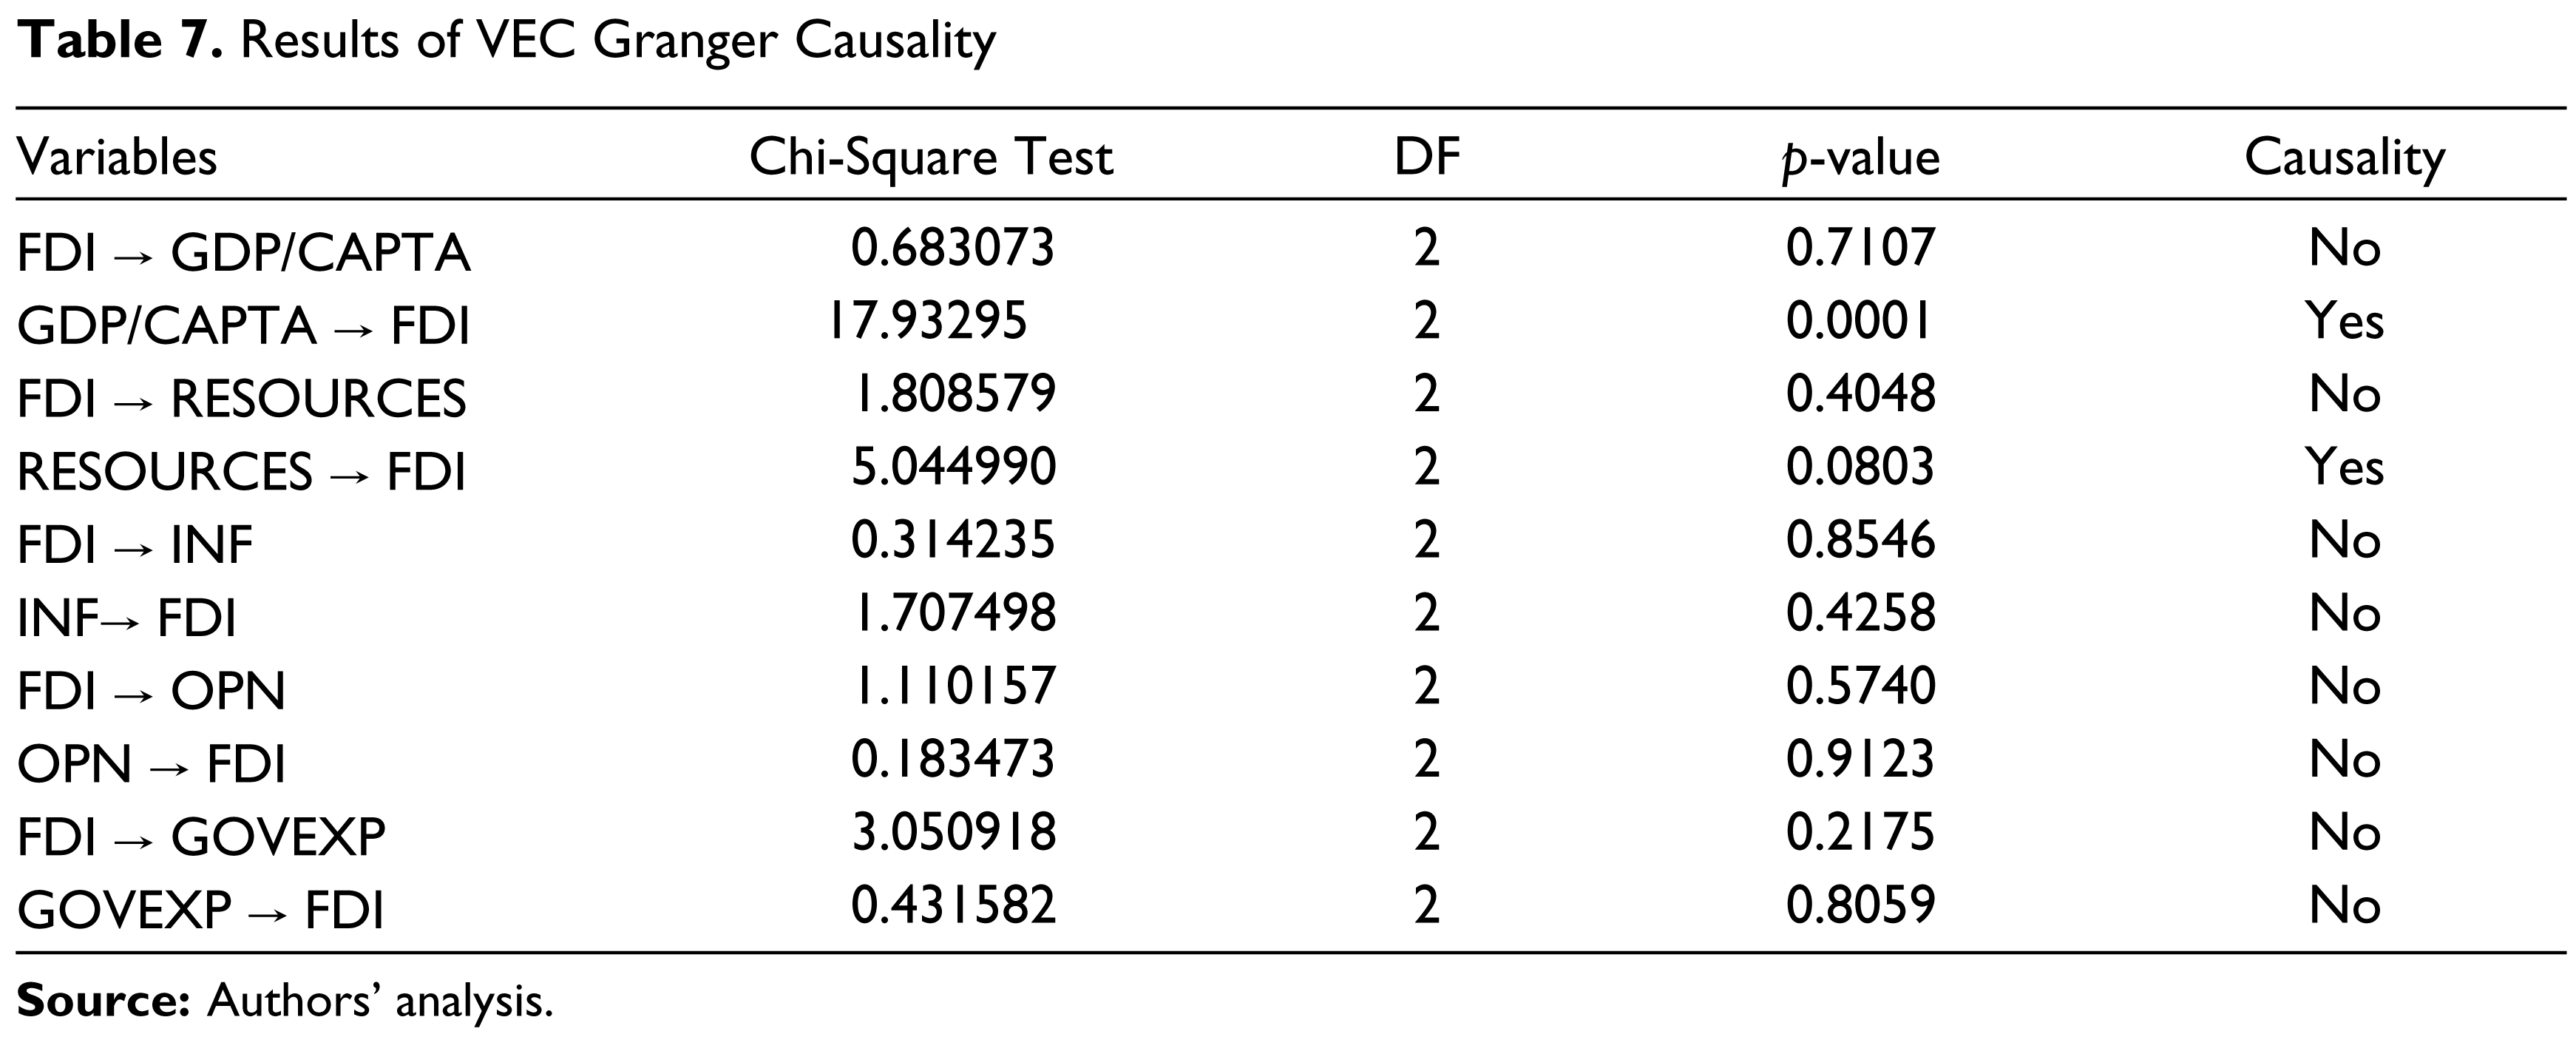
Table 7 shows the result of vector error correction Granger causality. The analysis shows that there is unidirectional causality running from GDP per capita to FDI and also from resources to FDI. This explains that the motives for FDI in Oman are both market seeking and resource seeking.
Results of VEC Granger Causality
Discussion
From the above analysis, FDI is positively related to market size and natural resources while negatively related to inflation and degree of openness. With the exception of the degree of openness, these findings are consistent with empirical literature (Mohamed & Sidiropoulos, 2010; Naeem & Azam, 2005; Sánchez-Martín et al., 2014). Although most of the literature regarding the role of the degree of trade openness demonstrated a positive link (Ang, 2008; Asiedu, 2002; Khondoker & Kalirajan, 2010; Omer & Hisham, 2012; Sánchez-Martín et al., 2014), the findings in this study are consistent with that of Seim (2009), who explained the negative relationship due to the ‘tariff jumping’ hypothesis in which trade restrictions (less openness) encourage foreign investors—seeking market—to set up subsidiaries in the host country if it is difficult to import. In fact, Oman has been adopting trade restrictions for a long time until it joined the WTO on 9 November 2000 when restrictions were gradually relaxed.
The causality analysis shows that there is unidirectional causality running from each of the GDP per capita and natural resources to the FDI. This causality result is consistent with Omer and Hisham (2012) particularly with regard to GDP per capita and FDI. The unidirectional causality implies that the motives for FDI in Oman are both market seeking and resource seeking. These results are supported by the high share of the oil and gas exploration (46.6 per cent) and manufacturing and trade projects (28.7 per cent) in the FDI (National Centre for Statistics and Information, 2014).
Conclusions and Policy Implications
The article examined the determinants of the FDI in Oman during the period 1980–2013 and revealed that the key determinants of FDI flows to Oman are size of the market, natural resources, inflation and degree of openness. Based on the analysis, FDI is positively related to market size and natural resources while negatively related to inflation and degree of openness.
The analysis also suggested that in the short run, approximately 36.1 per cent of total disequilibrium in FDI flows was being corrected each year. Moreover, Granger causality analysis indicated that there is a unidirectional causality running from each of the GDP per capita and natural resources to the FDI, implying that the motives for FDI in Oman are both market seeking and resource seeking.
Given these two motives in mind, policymakers in Oman should work to create an enabling environment that attracts FDI through undertaking good macroeconomic policies and providing preferential incentives particularly to investment projects that greatly contribute to the realization of the diversification strategy of the country.
Footnotes
Acknowledgements
The authors are grateful to the anonymous referees of the journal for their extremely useful suggestions to improve the quality of the article. Usual disclaimers apply.