



Abstract
Many firms have started investing in social media, hoping to reach and to engage their customers. However, results from social media initiatives have been inconsistent, underscoring the need to understand social media use at the individual level. We examined the impact of demographics on the attitudes of Facebook users towards the social media giant in the United States using survey data published by Pew Internet Project. Users’ perceptions of importance and continued usage were found to vary across demographic groups based on gender, age, education and income. Younger, less educated and lower-income users are expected to decrease their time on Facebook next year compared with older, more educated and higher-income users. Implications for research and practice are discussed.
Introduction
Social media is viewed as an increasingly important source of competitive advantage for businesses. The majority of the Fortune Global 100 companies use at least one social media platform to communicate with stakeholders (Burson-Marsteller, 2012). Popular press is also abuzz with stories of small businesses tapping social media for growth. Cunningham (2013) lists a number of companies that are using social media to drive sales. For example, the ‘Modern Home 2 Go’ company collects data from potential customers by asking them to fill up a contact form on their Facebook page; ‘Tate’s Comics’ uses its Twitter feed to keep its customers informed about new products; and ‘Miami Culinary Tours’ uses the Internet to promote its tours by uploading photos of tours, food and happy customers.
Companies, small and large, have been experimenting with different social media platforms for creating business value. Maltby and Ovide (2013) share the results of a study of small businesses which found 41 per cent of 835 respondents indicating LinkedIn to be the most valuable in reaching and engaging customers, while 16 per cent of the respondents chose YouTube, 14 per cent indicated Facebook and 3 per cent chose Twitter. While these results demonstrate the growing importance of social media overall, the study also highlights the uncertainty regarding which social media sites will deliver the best business benefits to firms.
Given the abundance of social media sites and the difficulties in choosing sites on which to focus a company’s social media efforts, it is important for advertisers and firms to understand that the preference and usage of any social network may change over time for different segments of users. Advertisers need to pay attention not only to the size of the user base of any social media platform but also to the profile of users in order to reach their intended audience. The providers of social media websites also need to monitor their user base to detect signs of change in users’ preferences. In this study, we investigate the impact of demographic variables on the perception of importance and continued usage of Facebook by users across gender, age, education and income. We chose to study Facebook as the social media tool because more than two-thirds of American adults who use the Internet were found to be Facebook users (Rainie, Smith & Duggan, 2013). The number of daily active users of Facebook rose by 27 per cent to 699 million from 2012 to 2013, and the number of monthly active users of Facebook rose by 21 per cent to 1.15 billion over the last year (Rusli, 2013). However, we believe that our findings are relevant for firms interested in social media in general.
Literature
Social Media
In the recent years, a number of social media websites, such as Facebook, Twitter, YouTube and Flickr, have gained immense popularity worldwide. This new breed of Internet services is characterized by the proficient use of Web 2.0 tools and dependency on user-contributed content (Kaplan & Haenlein, 2010). As these social media websites have experienced steady growth in user base, the influence of social media has expanded well beyond the personal or community level. Studies have documented the impact of social media during natural disasters such as the 2011 Thailand floods (Kaewkitipong, Chen & Ractham, 2012) and international political events such as the Arab Spring (Howard et al., 2011).
With the growing influence of social media, it is not surprising that many organizations are viewing it as a competitive tool. More than three-quarters of the companies surveyed by Harvard Business Review Analytics Services in 2010 said they have launched a social media initiative, or that they plan to do so (Harvard Business Review Analytics Services, 2010). In a survey of executives conducted by McKinsey, 83 per cent of the respondents reported that their companies used at least one social technology in 2012 (Bughin & Chui, 2013). The social tools were used for both internal interaction, as well as external communication with customers and business partners. Deiser and Newton (2013) assert that employing social media is critical for organizations and can become a source of competitive advantage. The authors emphasize the importance of leveraging social media for their businesses. Harrysson, Metayer and Sarrazin (2012) explain that social media can help organizations develop ‘social intelligence’ by mapping online conversations, engaging in conversations, tracking conversations, analyzing conversations and guiding and embedding new conversations. In practice, however, not all companies investing in social media find it easy to reap the benefits. In a survey of consumer companies conducted by Tata Consultancy Services, only 38 per cent of the companies reported positive return on investment (ROI) from social media initiatives. Negative ROI was reported by 18 per cent of the companies, with the remaining 44 per cent unsure about their social media investments (Tata Consultancy Services, 2013).
Perception of Importance
Most members of a social media site use it voluntarily for personal purposes, resembling the usage of a consumer product, rather than that of a workplace technology. Researchers have argued that perception of importance of a product varies across different consumers (Houston & Rothschild, 1978; Tyebjee, 1979). It is therefore important to understand the perception of a product’s importance for different segments of consumers. Similarly, even among regular users of a social media site, the importance of the service to individual users may vary significantly. Better understanding of users’ perceptions of importance will help social media firms and advertisers tailor strategies based on individual differences among users.
Bloch and Richins (1983) define perception of importance as ‘the extent to which a consumer links a product to salient enduring or situation-specific goals’. This definition of perception of importance of a product has two main components relevant to social media. The first component is that social media should have enduring importance, and this may differ for different segments of consumers. The second component is perception of importance due to situation-specific goals. This importance could be due to the situation variable of users’ existing network of family, friends or colleagues on a social network, or any other situation variable. Users’ perception of importance of any social media may decline with changes in situation variables. Regardless of the source of importance, firms have to be cognizant of consumers’ perception of importance of a social media site, and swiftly address any decline in interest. To our knowledge, perception of importance has not been addressed in prior research on social media. Therefore, in this study we include perception of importance as one of the outcome variables of interest.
Technology Adoption and Continued Usage
The first step towards reaping business benefits from a new technology is getting the intended users to adopt the innovation. User adoption and acceptance of technology innovations has been one of the social behaviours that interest many scholars and practitioners (e.g., Davis, 1993; Moore & Benbasat, 1991; Venkatesh & Davis, 2000). A number of theories, such as the diffusion of innovations theory (Rogers, 2003) and the technology acceptance model (TAM) (Davis, 1989; Davis, Bagozzi & Warshaw, 1989; Venkatesh & Davis, 2000), have been introduced to explain users’ decision to adopt technological innovations. These conceptual models typically include a set of user beliefs and attitudes as the determinants of user adoption. In the diffusion of innovation theory, five characteristics of an innovation perceived by the potential adopters are posited to affect the rate of diffusion: relative advantage, compatibility, complexity, observability and trialability (Rogers, 2003). The TAM includes perceived usefulness and perceived ease of use of a technology as the two main antecedents of an individual’s intention to accept the technology. Building upon these models, numerous authors have conducted empirical tests of user-related factors that influence adoption and acceptance of specific technologies (e.g., George & Kumar, 2014; Moore & Benbasat, 1991; Taylor & Todd, 1995). Based on a review of previous models in information technology (IT) acceptance literature, Venkatesh, Morris, Davis and Davis (2003) formulated the unified theory of acceptance and use of technology (UTAUT). The UTAUT includes four general constructs as direct determinants of an individual’s intention or use behaviour: performance expectancy, effort expectancy, social influence and facilitating conditions. Moreover, UTAUT incorporates four individual traits, including gender, age, experience and voluntariness to use the technology in the model, all of which contribute to the high level of variance explained (about 70 per cent) in behavioural intention (Venkatesh et al., 2003).
Although initial user adoption is unquestionably a crucial step towards overall success of a technological innovation, researchers have recognized that successful adoption does not always lead to continued usage (e.g., Bhattacherjee, 2001; Parthasarathy & Bhattacherjee, 1998). The issue of sustained continued usage is especially prominent for online services whose users are voluntary and free of any organizational mandates to continue using the service. The viability of all online virtual communities depends on sustained participation and content contribution from individual members (Butler, 2001; Chiu, Hsu & Wang, 2006; Koh, Kim, Butler & Bock, 2007). This is particularly true of social media websites, as the reliance on users to share their knowledge and experience is a defining aspect of such websites (Kaplan & Haenlein, 2010). Without the hundreds of millions of tweets made by Twitter users each day or the 100 h of new videos YouTube users upload every minute, the value of these sites would degrade rapidly. Moreover, most social media websites are free of charge to individual users, and rely on the volume of user activities to attract advertisers and generate revenue. Therefore, in social media, active users—users who perceive the service as an important part of their life, and actively contribute and consume—are much more valuable.
While continued activity from existing users is critical for any social media website, user churn is not uncommon, despite the rapid net growth of the user base. The phenomenon of ‘Facebook fatigue’ has garnered much attention recently in technology media (Van Grove, 2013). In April 2013 it was reported that that over the preceding 6 months, Facebook had experienced a decline of active users in 33 per cent of the countries where it is used. It is well understood in academic literature that continued usage of any technological innovation cannot be taken for granted (Bhattacherjee, 2001; Parthasarathy & Bhattacherjee, 1998). A growing number of studies have addressed continued use as the primary outcome variable of post-adoption user behaviour research. To date, this stream of research has not yielded conclusive results regarding the factors that explain continued use. Some scholars have found pre-adoption beliefs such as perceived usefulness to have weakened predictive power on post-adoption use (Karahanna, Straub & Chervany, 1999). Others have attempted to improve the understanding of continued use by introducing factors such as actual usage (Kim & Malhotra, 2005; Parthasarathy & Bhattacherjee, 1998; Speier & Venkatesh, 2002), satisfaction (Bhattacherjee, 2001; Thong, Hong & Tam, 2006) and user complaints (Jha, Papagari Sangareddy, Desouza, Seo & Ye, 2010). Although the results of these efforts have been mixed, they do suggest that user continuance is determined by differences among individuals rather than system-level factors.
Research interest on user continuance has been scarce, specifically with social media. A search in the Associate for Information Systems (AIS) e-Library yields a large number of articles addressing various research issues related to social media from strategic and organizational perspectives, which treat users as a homogenous group. However, a few studies have looked at social media usage at the individual level, examining impacts of individual differences such as demographics on continued usage of a social media network. In this study, we focus on the impact of demographics on the continued usage of social media (Facebook).
Demographics and User Behaviour
Demographics are the most fundamental individual-level differences in a large population. The theory of optimum stimulation level (Raju, 1980) suggests that demographics, such as age, employment, education and income, help determine the optimum level of stimulations each person prefers to receive from the environment. Individuals continuously adjust their behaviour to align the properties, such as novelty and complexity, of their environmental stimulations to their optimal levels. Therefore, demographics effectively act as the determinants of a person’s tendency to start or continue certain exploratory behaviour (Raju, 1980). Numerous studies in different disciplines of business research have demonstrated the usefulness of demographics in predicting behaviour, ranging from consumption of new products (Sondhi & Singhvi, 2006; Wheatley, Chiu & Stevens, 1980) to tax evasion (Ross & McGee, 2012). A number of researchers have also investigated the impact of demographics on technology-related user behaviour. For example, Ranganathan, Seo and Babad (2006) found that age and gender influence mobile phone users’ decision to discontinue with their current provider and switch to a different provider. Correa, Hinsley and De Zuniga (2010) also confirmed that age and gender play a role in determining the use of social networking sites and instant messaging. In a study of employees’ adoption of workplace technology, Quazi and Talukder (2011) found that individuals with higher level of education tend to have a more favourable attitude towards innovation. In summary, demographics have long been recognized as key determinants of various forms of exploratory behaviour, and we expect demographics to play a crucial role in an individual user’s decision to use a social media website.
Research Objectives
Our review of literature revealed a lack of research effort on social media from the perspective of individual users. Social media inherently depends on a large body of engaged users to survive and thrive. For any social media service, users who perceive the service as important, and continue to use it actively, are the most valuable assets. Prior research also suggests that user demographics are a reliable group of predictors of technology-related user behaviour. Therefore, in this study we investigate the impact of demographics on the perception of importance of social media. We also expect demographic characteristics to be crucial factors in users’ decisions to continue to actively use a social media website. We hope the expected findings of this study can serve as a starting point for further research on the impact of individual traits on social media user behaviour.
Methods
Research Context—Facebook
We selected Facebook, by far the largest social networking website as of early 2014, as our research setting. Founded by Mark Zuckerberg and his college friends in February 2004 as a networking site for students of Harvard University, Facebook has grown to a site available in 70 languages, with more than 1.2 billion active users worldwide. According to Alexa, Facebook ranks second, right behind Google, among all websites in worldwide traffic, as of February 2014 (Alexa, 2014). Based in Menlo Park, California (CA), Facebook employs over 5,000 people, with an annual revenue of USD 7.9 billion in 2013, making it one of the Fortune 500 companies. The company’s stock started trading on NASDAQ on 18 May 2012. As of February 2014, Facebook Inc. had a market capitalization of over USD 100 billion, ranking it one of the largest 50 publicly traded companies in the US.
Registration is required for all Facebook users before they can create personal profiles and add other users as ‘friends’ in their network. Registration is free and takes no more than a few minutes. Each user can post status updates on their profile, and receive automatic notifications when their friends update their profiles. These updates can take many forms, with short text-based posts and photos being the most commonly used formats. Facebook also offers a variety of additional features, which we will not go over in the interest of space. Users who are inactive will not be removed by Facebook, although they can request that their accounts be deactivated or permanently deleted.
Data
In this study, we used a publicly available data set, compiled by the Pew Internet & American Life Project (2012). The Pew Internet Project is one of seven projects undertaken by Pew Research Center, a nonprofit organization that conducts research on issues, attitudes and trends in the Americas and worldwide. The Pew Internet Project focuses its research on the impact of the Internet on the daily lives of people. This project collects primary data and publishes reports based on its findings, and releases their raw data sets to scholars for further analysis. For example, Sadasivam et al. (2013) used one of Pew Internet Project’s data sets to study health information-seeking behaviour on the Internet.
In this study, we use Pew Internet Project’s data set on people’s Facebook habits and attitudes. This data set contains data from a survey conducted by Princeton Survey Research Associates International (PSRAI) from 13 to 16 December 2012. The survey interview was conducted in English on a sample size of 1,006 representative adults in the United States. Interviews were conducted over the telephone: 601 interviews on landline phones and 405 interviews on cell phones. This data set has demographic variables, such as, sex, age, education and income, and variables on the usage of Facebook. We have employed a subset of variables from the data set for this study.
Results
Descriptive Statistics
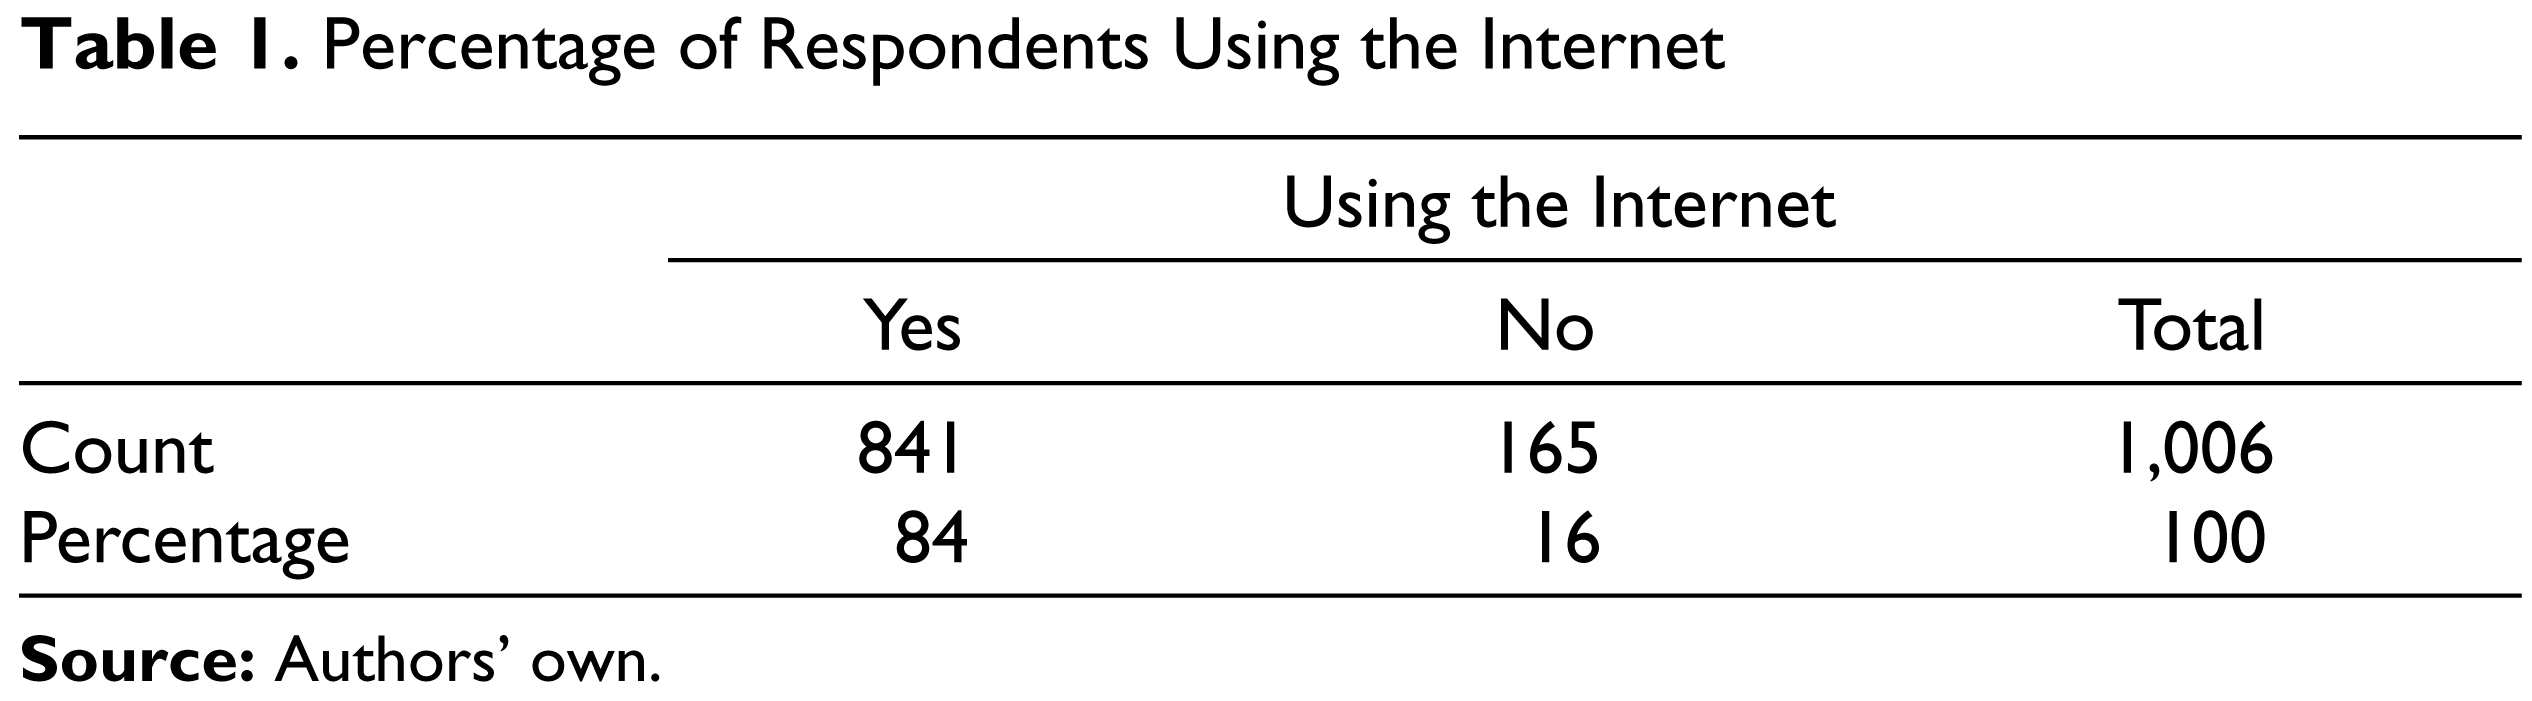
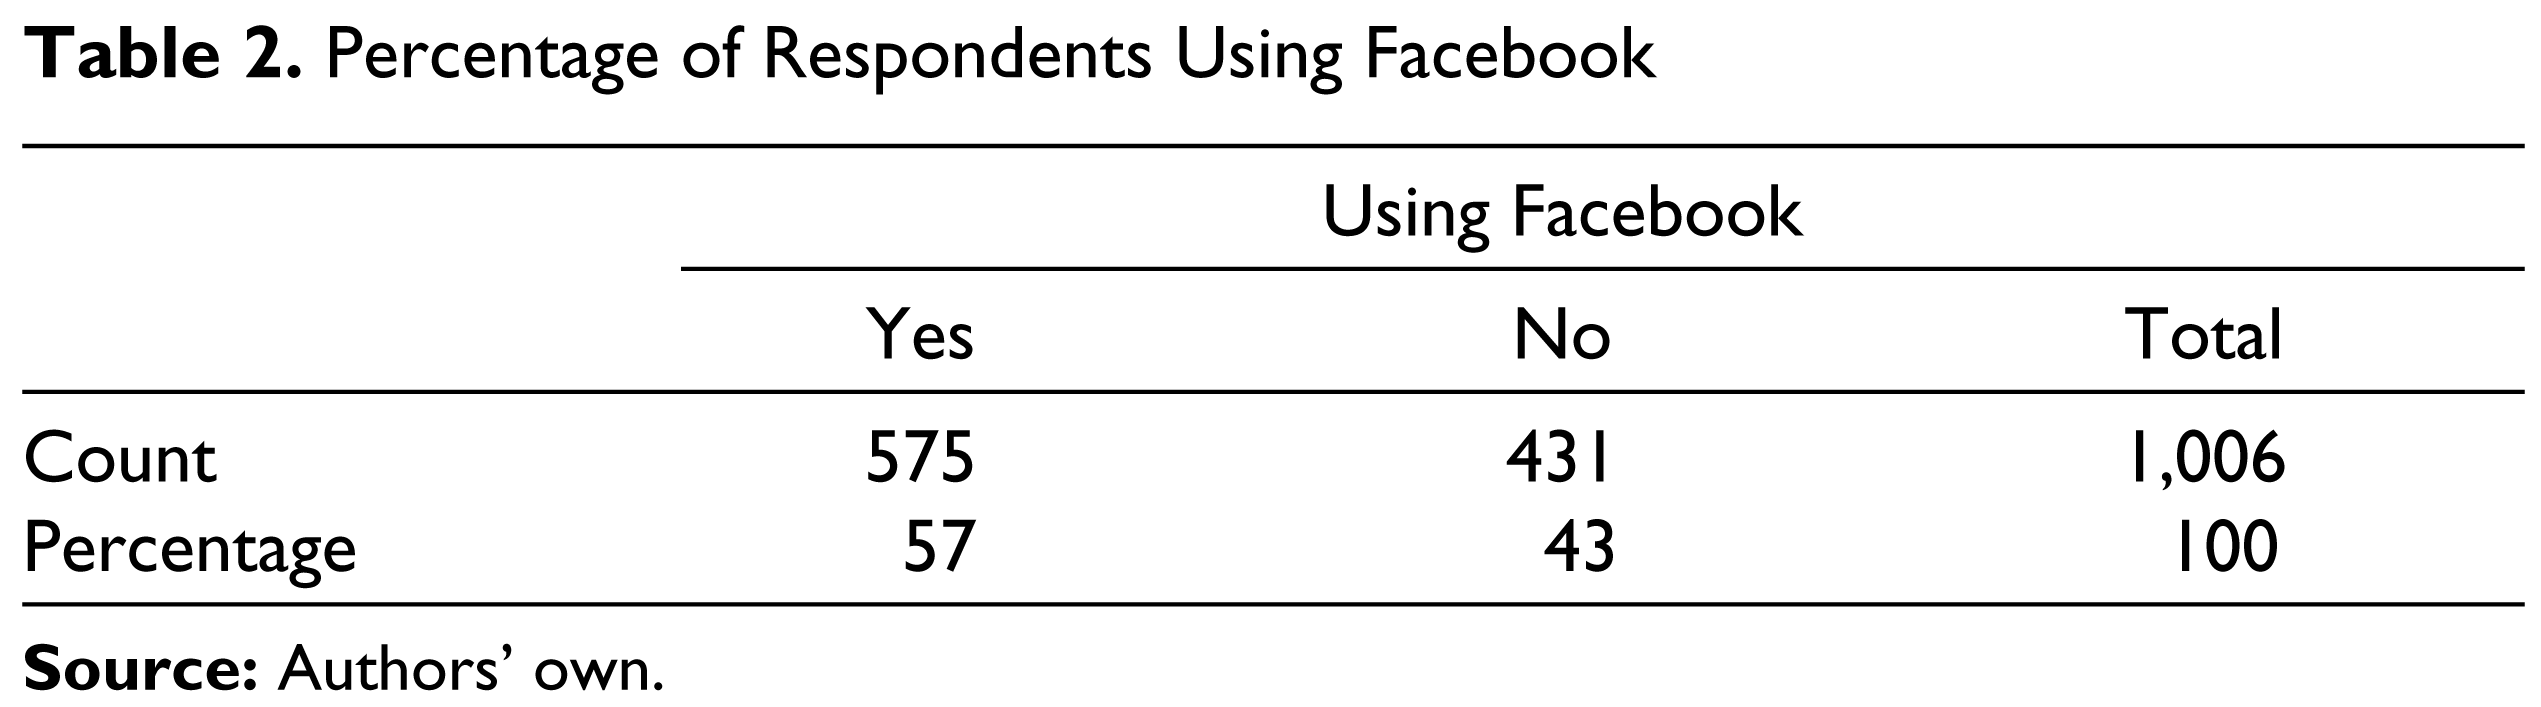
Our data file from Pew Internet included a weight variable to make the sample representative of the population from which it was drawn. We included this weight variable in our analysis for this research. We found that 84 per cent of respondents use the Internet and 57 per cent use Facebook, out of a total of 1,006 respondents (Tables 1 and 2). In this study, since we are interested in studying Facebook users, we carried out further analysis only with data on the 575 respondents who use Facebook.
Percentage of Respondents Using the Internet
Percentage of Respondents Using Facebook
Importance of Facebook over the Last Year across Gender

Importance of Facebook over the Last Year across Age
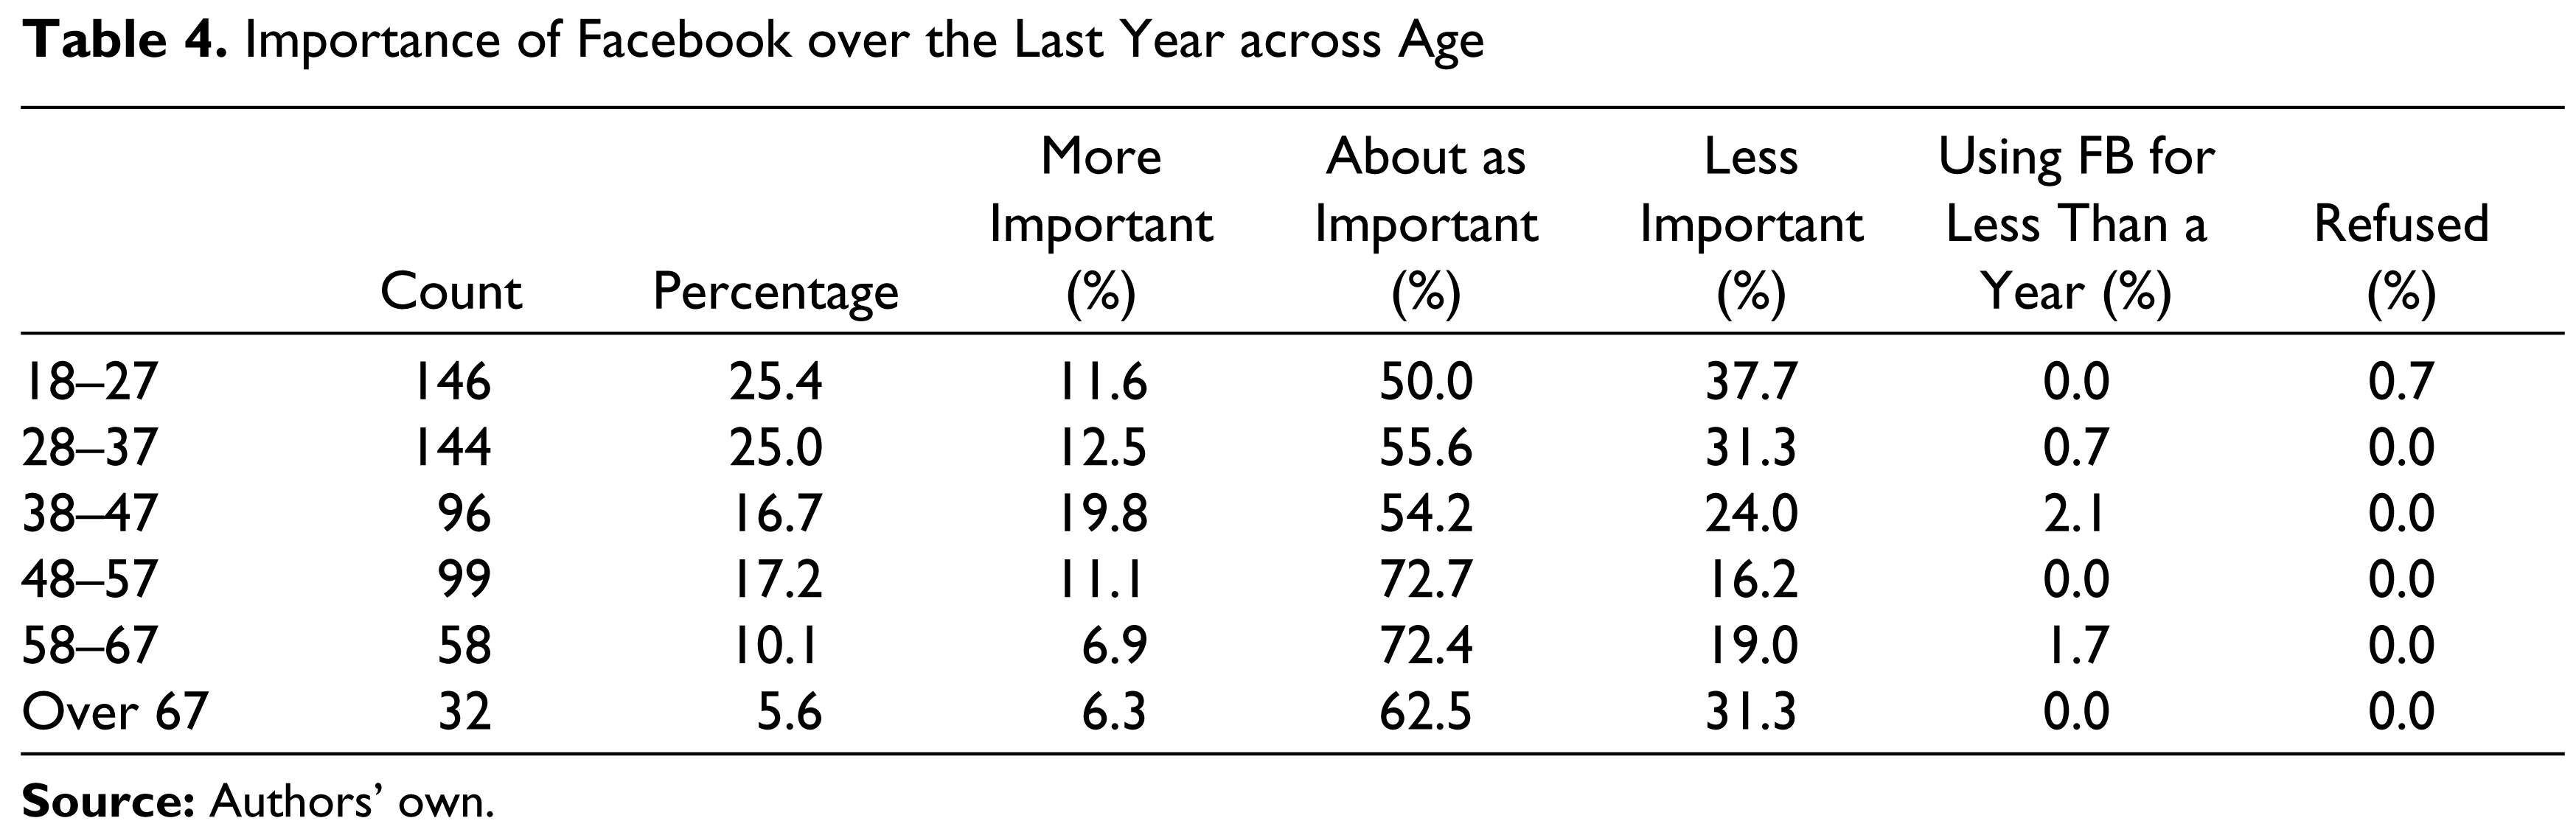
First, we analyzed the demographics of the 575 Facebook-using respondents. We found that about 45 per cent of the respondents were males and about 55 per cent were females (Table 3, columns 2 and 3). We also examined the distribution of these respondents across different age groups. We found that Facebook users in the sample spanned all age groups (Table 4, columns 2 and 3): 25.4 per cent of the respondents were in the age group of 18–27 years, 25 per cent were in age group of 28–37 years, 16.7 per cent respondents were in the age group of 38–47 years, 17.2 per cent were in the age group of 48–57 years, 10.1 per cent of the respondents were in the age group of 58–67 years and 5.6 per cent were over the age of 67. Hence, this data set covers adults, both males and females, across different age groups.
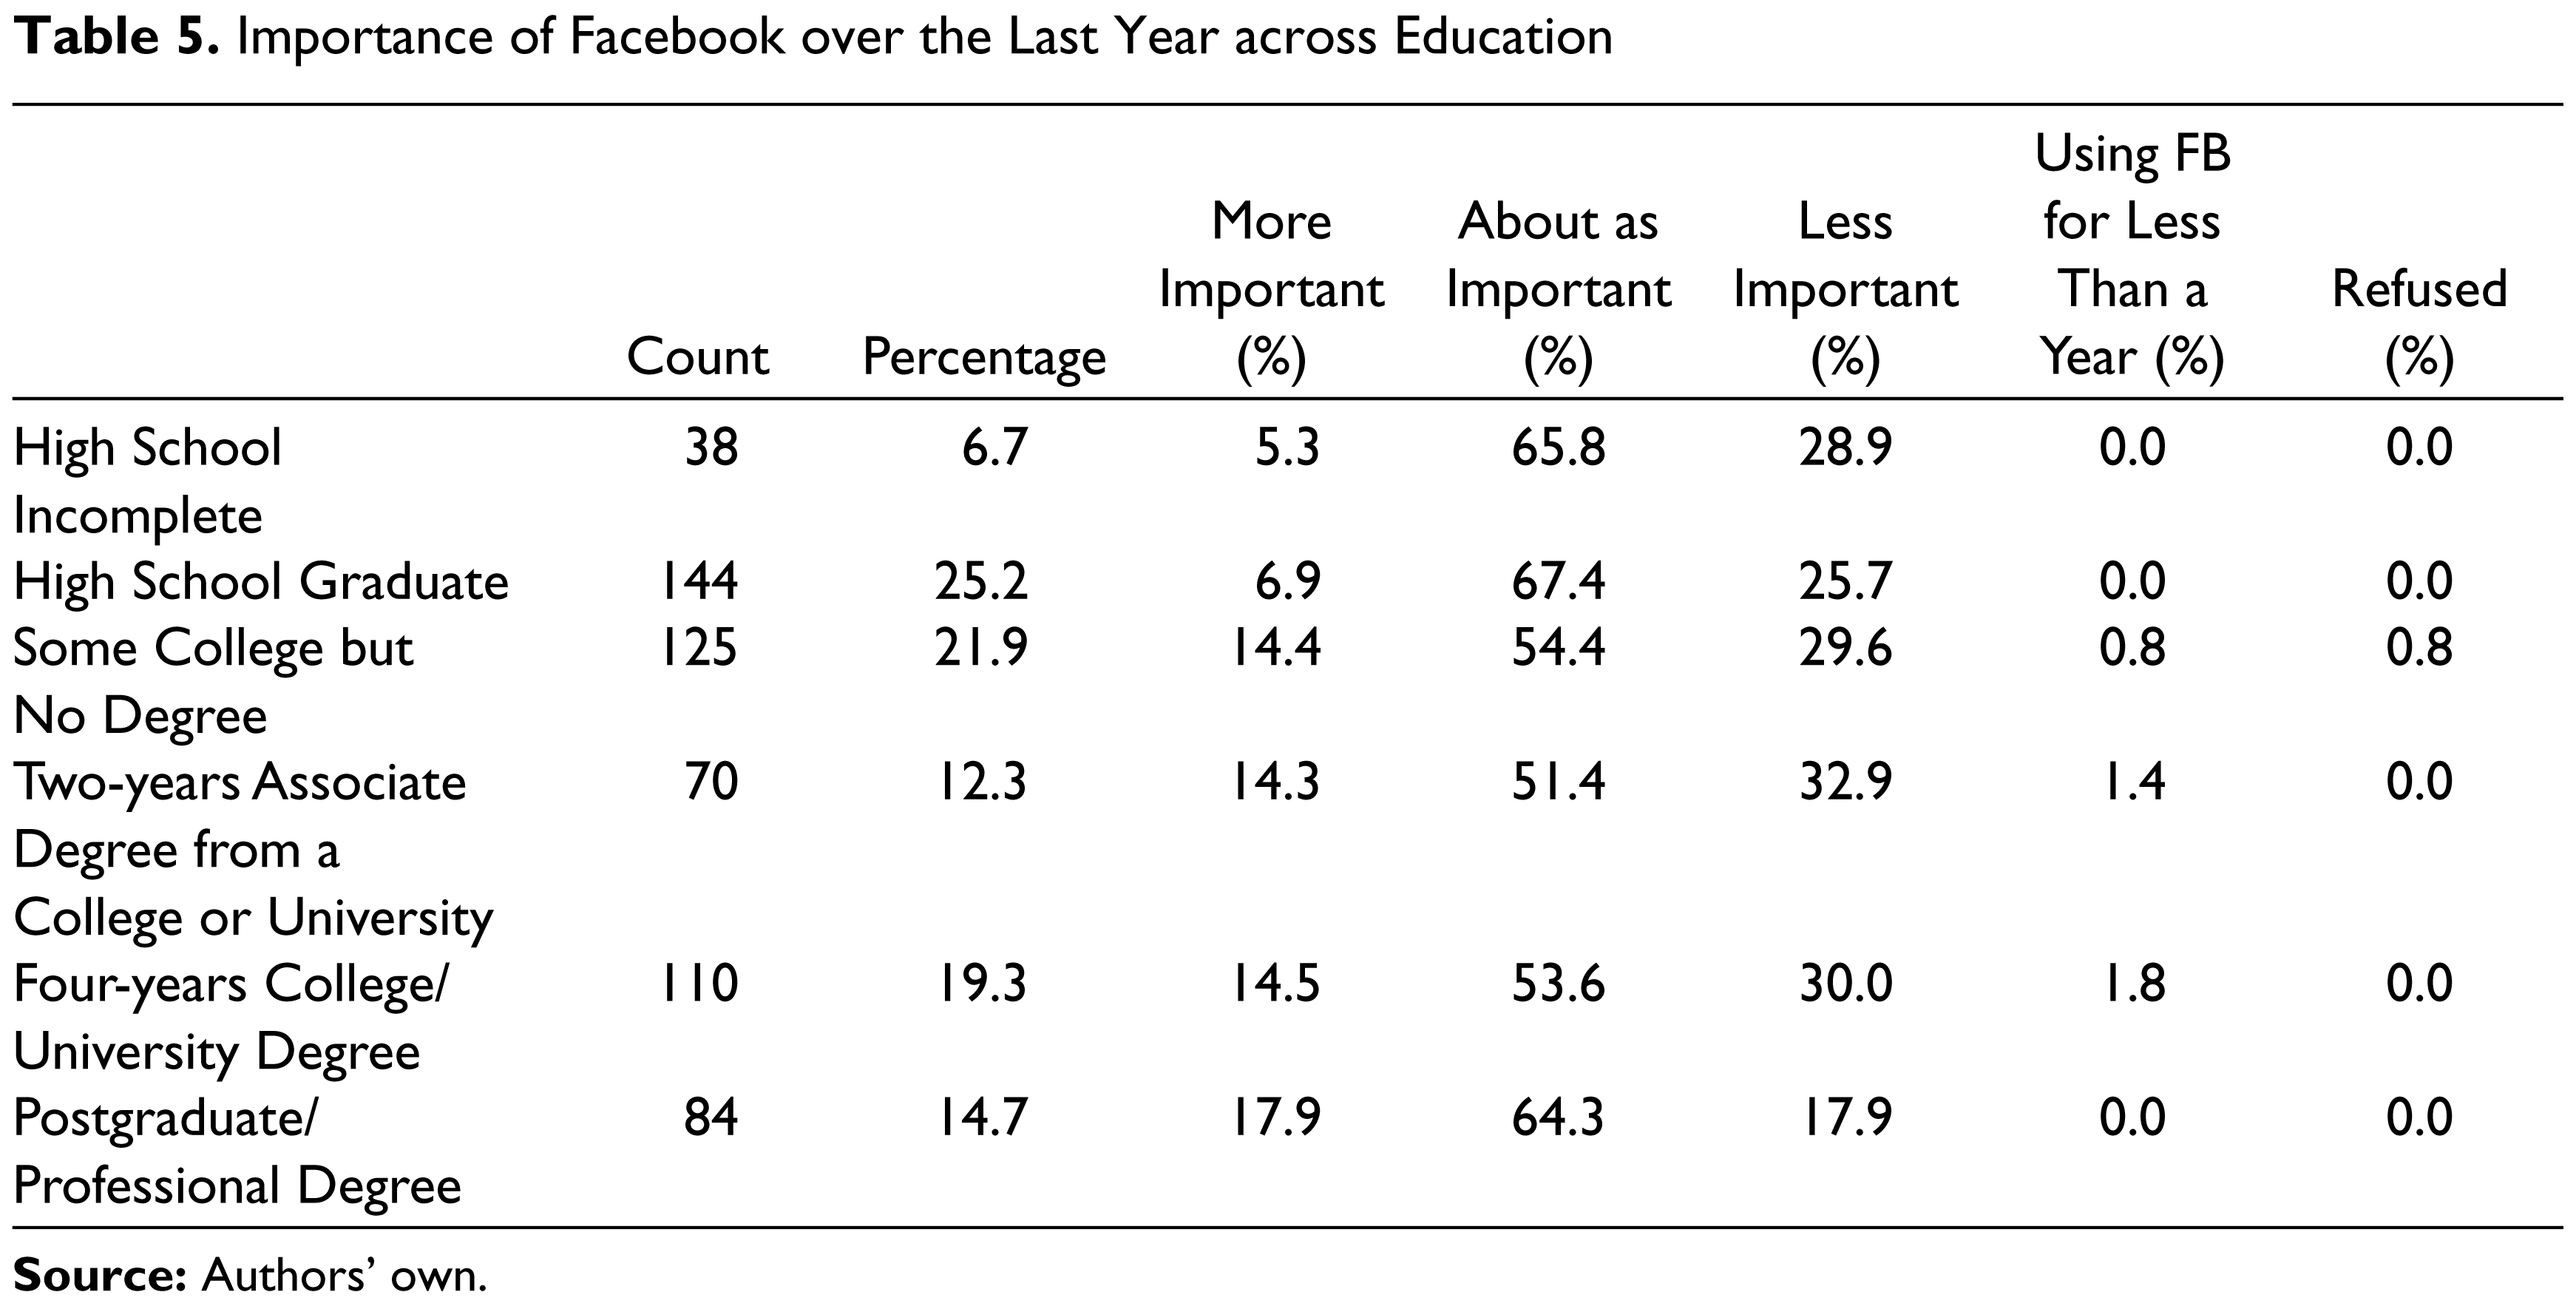
We also analyzed the distribution of these Facebook users based on their education (Table 5, columns 2 and 3). The respondents’ education ranged from ‘high school incomplete’ to ‘postgraduate or professional degree’: 6.7 per cent of the respondents did not complete high school; 25.2 per cent were high school graduates; 21.9 per cent of the respondents had some college education, but no degree; 12.3 per cent had a 2-year associate degree from a college or university; 19.3 per cent of the respondents had 4 years college or university degree and 14.7 per cent had a postgraduate or a professional degree.
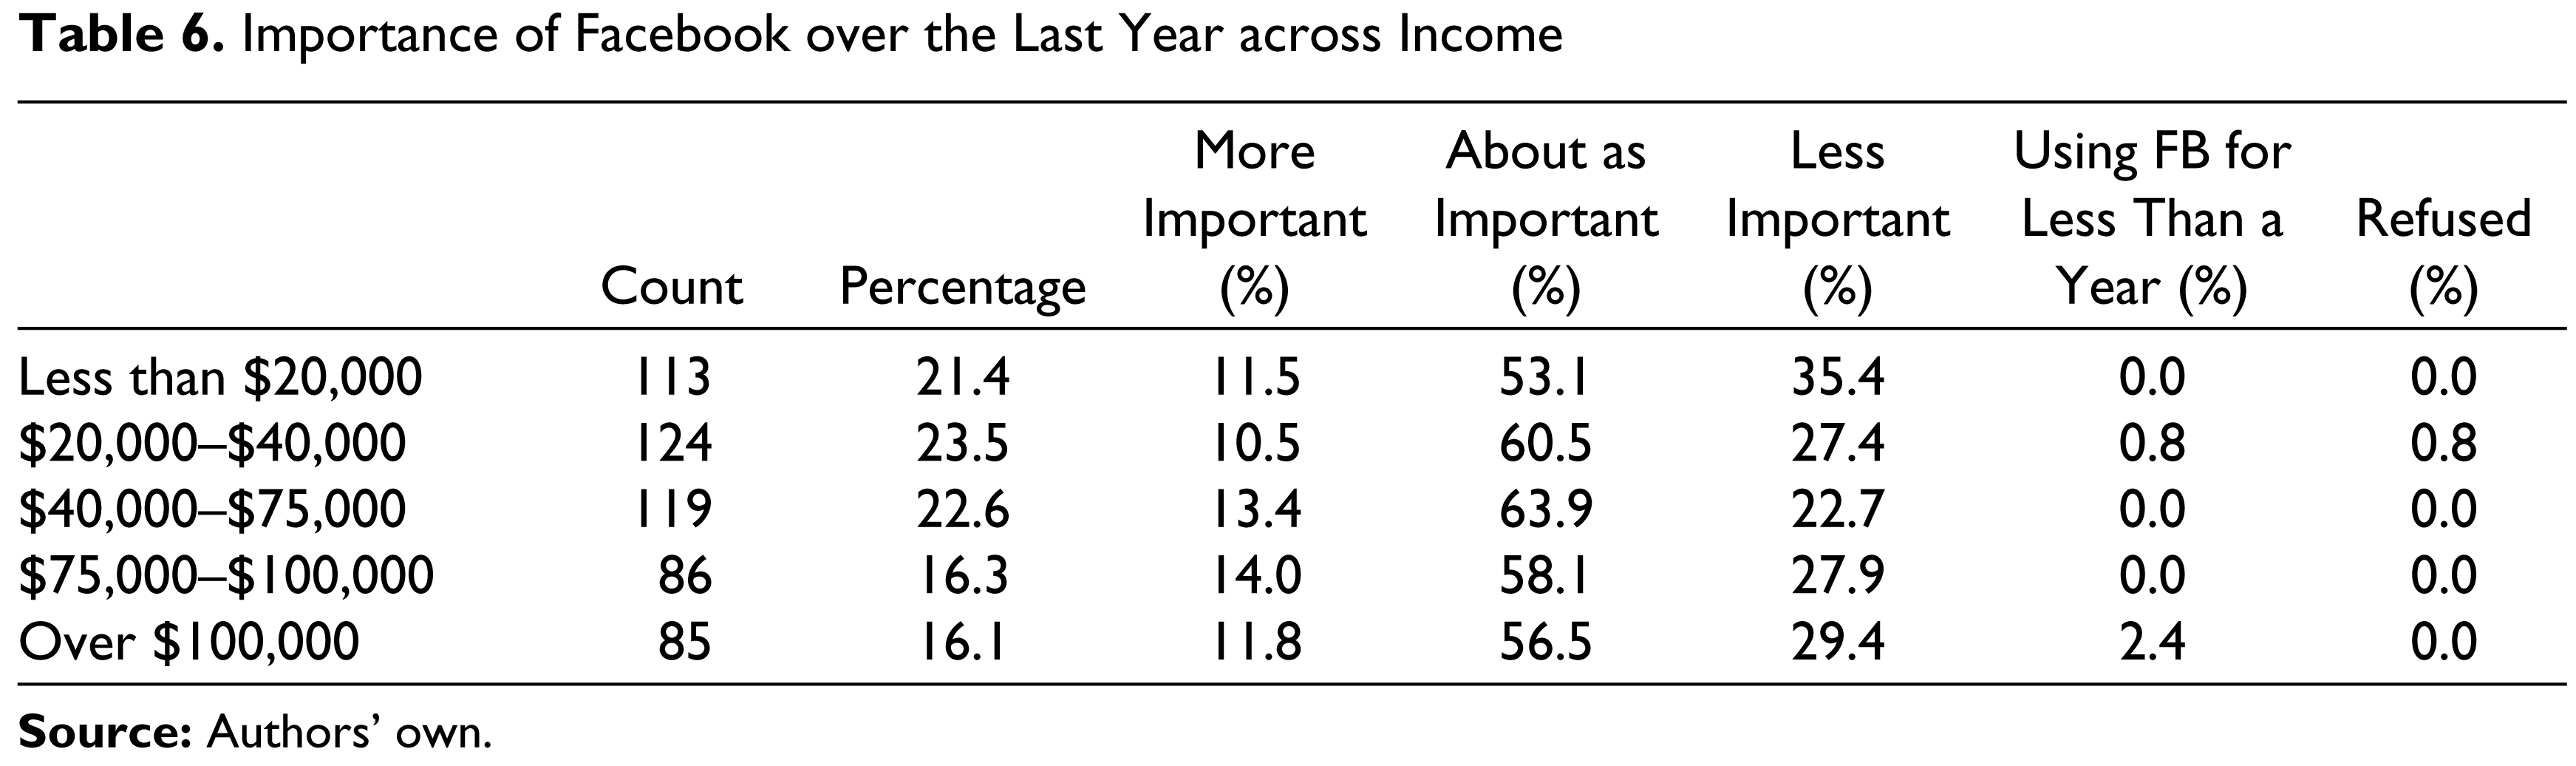
Finally, we examined the distribution of these Facebook users across different income groups (Table 6, columns 2 and 3). Facebook users seemed to come from different income groups: 21.4 per cent of respondents’ income was less than $20,000, 23.5 per cent’s income was between $20,000 and $40,000, 22.6 per cent of the respondents’ income was between $40,000 and $75,000, 16.3 per cent were earning between $75,000 and $100,000 and 16.1 per cent of the respondents’ income was over $100,000.
Importance of Facebook over the Last Year across Education
Importance of Facebook over the Last Year across Income
Perception of Importance
In the second part of our analysis, we examined Facebook users’ perceptions of importance of Facebook over the last year across gender, age, education and income. We found that about 70 per cent of males and more than 72 per cent of females indicated that Facebook was about as important or more important over the last year (Table 3, columns 4 and 5). However, about 29 per cent males and 27 per cent females indicated that Facebook was less important over the last year (Table 3, column 6).
Across the different age groups, we found a difference in users’ perceptions of importance of Facebook, compared to its importance in the previous year. Among younger users, only about 62 per cent in the age group of 18–27 and 68 per cent in the age group of 28–37 indicated Facebook to be about as important or more important over the last year (Table 4, columns 4 and 5). However, for older users, the percentage of users was higher (about 74 per cent in the age group of 38–47 years, about 84 per cent being 48–57 years, about 79 per cent in the age group of 58–67 years and about 69 per cent being over the age of 67 years) among those who indicated that Facebook was about as important or more important over the last year.
Across the different levels of education, perception of importance of Facebook over the last year was higher for users with higher levels of education. About 82 per cent of Facebook users with a postgraduate or a professional degree indicated that Facebook was about as important or more important over the last year (Table 5, columns 4 and 5). Compared to this, only about 71 per cent of Facebook users with an educational level of ‘high school incomplete’ indicated that Facebook was about as important or more important over the last year. Table 5 (column 6) shows that a higher percentage of Facebook users with lower levels of education indicated that Facebook was less important over the last year.
Finally, across the different income groups we find that about 77 per cent of users in the income range of $40,000–$75,000 indicated that Facebook was about as important or more over the last year (Table 6, columns 4 and 5). A slightly lower percentage of Facebook users in other income ranges (about 64 per cent in less than $20,000, about 71 per cent in $20,000–$40,000, about 72 per cent in $75,000–$100,000 and about 68 per cent in over $100,000) indicated that Facebook was about as important or more important over the last year. It is interesting to see that only 22.7 per cent of the respondents in the income group of $40,000–$75,000 indicated that Facebook was less important over the last year (Table 6, column 6). A higher percentage of respondents in other income groups indicated that Facebook was less important over the last year (35.4 per cent in less than $20,000, 27.4 per cent in $20,000–$40,000, 27.9 per cent in $75,000–$100,000 and 29.4 per cent in over $100,000).
Intention to Continue Usage
In the third part of our analysis, we examined Facebook users’ perceptions of their expected spending time on Facebook during the next year across gender, age, education and income. About 76 per cent of males and about 69 per cent of females indicated that their expected time spent on Facebook during the next year will be about the same or more (Table 7, columns 2 and 3). About 23 per cent of males and 30.4 per cent females indicated that they expect to spend less time on Facebook next year (Table 7, column 4).
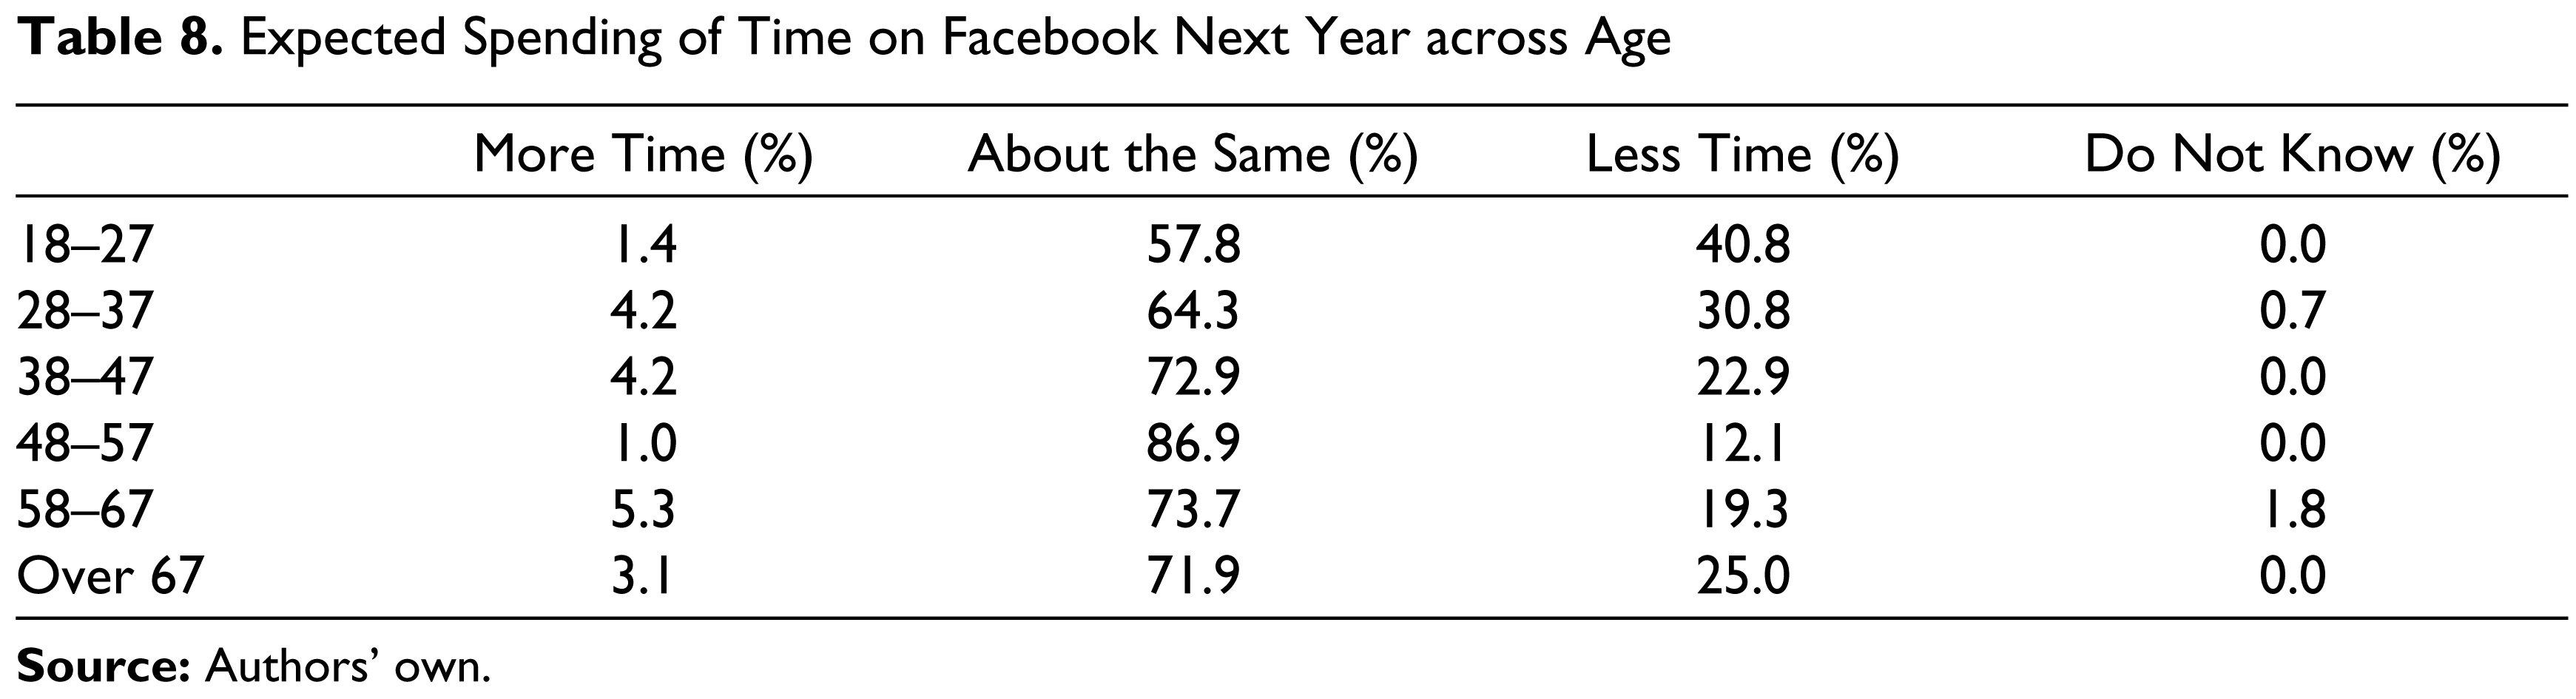
Analysis of the expected spending of time on Facebook for the next year across age revealed interesting results. Younger users expected to spend less time on Facebook next year compared to the older users. About 41 per cent of Facebook users in the youngest age range of 18–27 years indicated that they expected to spend less time on Facebook next year (Table 8, column 4). Similarly, about 31 per cent users in the next age group of 28–37 years indicated to spend less of their time on Facebook next year. But, only about 12 per cent of older users in the age group of 48–57 years indicated that they would spend less time on Facebook next year.
Expected Spending of Time on Facebook Next Year across Gender

Expected Spending of Time on Facebook Next Year across Age
Next, we analyzed the expected spending of time on Facebook during the next year across different levels of education. We found that about 80 per cent of users with a postgraduate or a professional degree expected to spend about the same or more time on Facebook next year (Table 9, columns 2 and 3). However, this percentage is lower for users in lower education levels. For example, only 72 per cent of users in the group ‘high school incomplete’ expected to spend about the same or more time on Facebook next year. Interestingly, we found users with a 2-year associate degree from a college or university to have the least percentage of users (63.4 per cent) expecting to spend about the same or more time on Facebook next year (Table 9, columns 2 and 3).
Expected Spending of Time on Facebook Next Year across Education

Expected Spending of Time on Facebook Next Year across Income
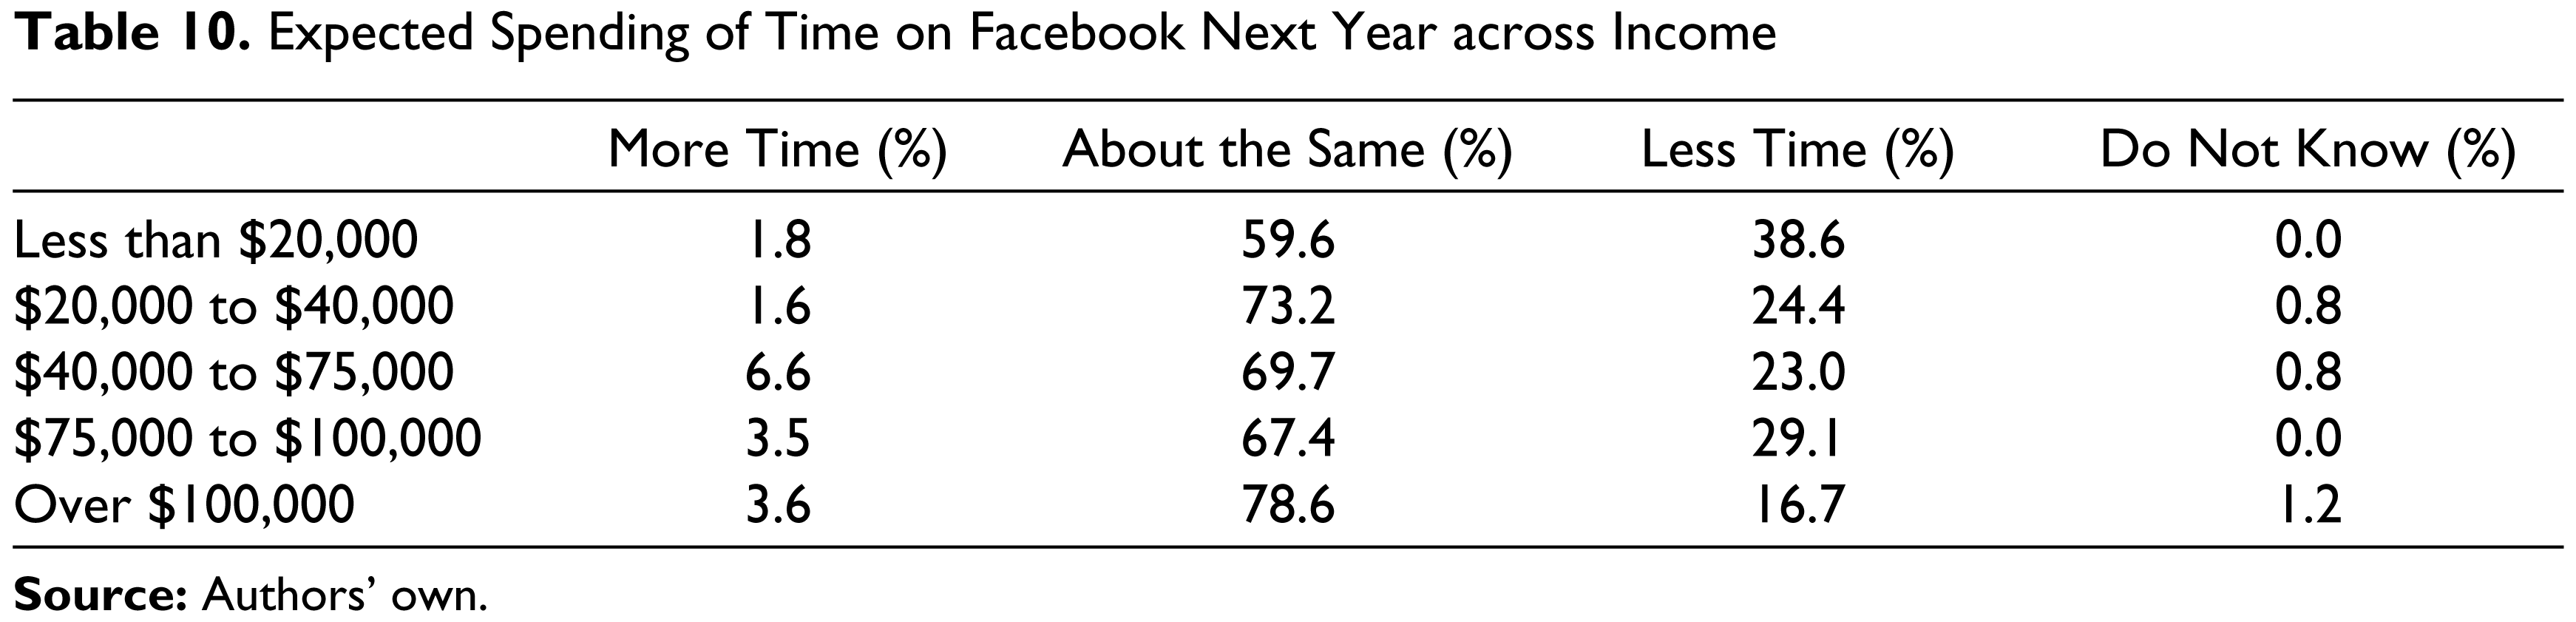
Finally, we analyzed the expected spending of time on Facebook during the next year across income. We found that about 82 per cent of users with income over $100,000 expected to spend about the same or more time on Facebook next year (Table 10, columns 2 and 3). However, only 61 per cent of users in the lowest income group of less than $20,000 expected to spend about the same or more time on Facebook next year. About 75 per cent of users in the income group of $20,000–$40,000 and about 76 per cent in the income group of $40,000–$75,000 expected to spend about the same or more time on Facebook next year. We found an anomaly in this trend, as only about 71 per cent of users in the income group of $75,000–$100,000 expected to spend about the same or more time on Facebook next year.
Discussion
In this study, using Facebook as our research setting, we examine the relationship between the demographics of social media users and their perceptions of importance and intentions to continue usage. Our analysis revealed that the data set of 575 Facebook users had a good representation of both male (45.2 per cent) and female (54.8 per cent) respondents. We also found that Facebook users came from all age groups; young as well as older respondents were found to be Facebook users. For example, more than 25 per cent of Facebook users were between 18 and 27 years old and more than 15 per cent of Facebook users were over the age of 58. Similarly, Facebook seemed to be popular with adults across different levels of educational background. However, we did find a few adult users (only 6.7 per cent) of Facebook who did not complete high school. Finally, our analysis of users in different income groups revealed that Facebook users fell in all income ranges. Adults Facebook users with income as low as less than $20,000 were in the sample as well as those with income over $100,000. Our analysis of Facebook users’ demographics showed that Facebook is being used by both male and female adults of various ages, education and income. This is an important finding for marketers who want to reach their prospective customers through this social medium.
Our analysis of perception of importance of Facebook for its users revealed that about 70 per cent of males and 72.4 per cent of females found it to be as important or more important, when compared with the previous year. However, about 29 per cent of males and about 27 per cent of females considered Facebook to be less important than during the prior year. This is an important finding and can provide useful feedback for Facebook in its efforts to stay relevant and important for its users.
Our analysis of the perception of importance of Facebook across age groups compared to the prior year revealed an interesting pattern. We found that a higher percentage of younger users compared to the older ones, perceived Facebook to be less important than during the prior year. We think one reason for this could be that younger users like to explore different social media, may therefore switch easily to different social networks and are likely to lose interest in Facebook over time. Older users are not likely to be active on many social networks simultaneously, and hence may perceive Facebook to be more important than the younger users. Facebook has a challenge in keeping younger users interested and coming back to their social networks on Facebook.
Across different education levels, we found that a higher percentage of users with higher levels of education indicated Facebook to be about as important or more than the last year. A higher percentage of users with lower levels of education considered Facebook to be less important than last year. This is an interesting and an important finding. Future research may want to investigate reasons for the difference in perception of importance of Facebook across educational levels of users.
Interestingly, across different income groups, users with income in the range of $40,000–$75,000 seemed to be the most satisfied with Facebook, as over 77 per cent of them indicated that Facebook was about as important or more over the last year. In comparison, users in the lower- and higher-income groups indicated Facebook to be less important over the last year. Researchers may want to investigate whether Facebook did not serve the purpose the users had in mind. This may help Facebook and other social networks to improve, innovate and bring in features that may attract users across all income groups.
Our analysis of users’ expected spending of time on Facebook over the next year showed that about 23 per cent of males and about 30 per cent of females expected to spend less time on Facebook, compared to the current year. This could be an area of concern for Facebook, especially with female users. More importantly, about 41 per cent of the users in the age group of 18–27 and about 31 per cent of the users in the age group of 28–37 expect to spend less time on Facebook next year. Losing young users may hurt Facebook, as younger users are usually the early adopters of technology-enabled social networks. However, only about 12 per cent of users in the age group of 48–57 years indicated that they expected to spend less time on Facebook next year. Similarly, about 19 per cent of users over the age of 58 indicated spending less time on Facebook next year. To sum up, young users expect to spend less time on Facebook over the next year compared to the older users.
Across different education levels, about 80 per cent of the highest educated users—those with postgraduate and professional degrees—expect to spend about the same or more time on Facebook. But this percentage drops for users with a lower level of education. It will be interesting for future researchers to study the reasons for this possible decline in interest in users with lower levels of educational.
Across different income groups, our results showed that more than 82 per cent of users’ in the highest income group of over $100,000 expect to spend about the same or more time on Facebook next year. In comparison to users in the highest income group, we found only 61 per cent of users in the lowest income group expected to spend about the same or more time on Facebook.
Summing up, older users, more educated users and users with more income are expected to spend about the same or more time on Facebook next year. Similarly, younger users, less educated users and users with lower income are expected to spend less time on Facebook next year. In addition, females, comparison to males, are more likely to spend less time on Facebook next year. Our analysis is in line with recent reports on decline in Facebook’s engagement with teens (Fishman, 2013).
Our findings support prior research and highlight the issue that initial adoption of a social media website does not necessarily mean continued usage. Virtual communities thrive on content created by users, and decline in active participation of users may erode the perception of importance of any given social media in the users’ lives. The UTAUT (Venkatesh et al., 2003) emphasizes the importance of social influence in the acceptance of a technology. Our findings indicate that social influence may impact users’ decisions to continue or abandon the usage of a particular technology. For example, for those ‘left behind’, having friends or colleagues move to a different social media site may decrease the perceived usefulness of their current social media. It is a challenge to maintain perceptions of enduring importance for users across different age, income and education groups. Our research did find differences in perceptions of importance of Facebook across age, income and education. Higher percentage of younger, lower-income and lower education users have indicated that Facebook is less important for them compared to last year, and have indicated the possibility of spending less time on Facebook compared to last year. Factors in the unified theory, such as, perceived usefulness, perceived ease of use and social influence, can help explain the decrease in perception of importance of a social media site among these user groups.
Our research has implications for future research on social media. Results of this study demonstrate the influence of individual differences such as demographics on social media users. Researchers may also study the impact of additional demographic variables, such as, race, and other individual-level differences such as personalities. In this study, we have employed perceptions of importance and continued usage of Facebook as a proxy for user commitment and continued engagement with Facebook. In other words, we have used measures for intention to continue and not the actual behaviour. Future research on social media may study actual behaviour to examine participation on social media across gender, age, education and income over time. The sample used in this study is limited to users residing in the US. Further research is needed to investigate how the results may vary under different national and cultural settings. We analyzed data collected from users of Facebook, the most widely used social media at the time of this study. The field of social media is still rapidly evolving, with new websites constantly emerging. Additional studies can test the generalizability of the conclusions of the current study on other social media websites, both established and new.
This study also has managerial implications. Social media networks need not only attract but also retain users across genders, age, education and income levels over time. It is difficult to measure decline in users’ engagement with any social network because discontinuance can be a gradual process and across only a segment of users. Managers need to constantly measure users’ involvement across various demographic groups, and not just focus on the aggregate number of users and their behaviour. For example, a recent report has indicated that in 2013, only 23 per cent of teenagers have indicated Facebook to be the most important social network, compared to 42 per cent in 2012. This is a steep and worrisome decline for any social network (Fishman, 2013). Examining demographics may help in understanding this shift, which may not otherwise be revealed by monitoring aggregate user behaviour. To sum up, managers need to constantly monitor changes in habits and social trends across different segments of users to establish or modify policies and features to attract and retain users. In addition, businesses strategizing to advertise on any social media website should be aware of the demographic profile of their user base in order to best reach their intended consumers.
Footnotes
Acknowledgements
The authors are grateful to the anonymous referees of the journal for their extremely useful suggestions to improve the quality of the paper. Usual disclaimers apply.