



Abstract
This study aims to undertake an evaluation and examination of the productivity change of the Egyptian banking sector, using a novel data set which covers 14 banks operating in the Egyptian market from 1997 to 2013. We use a non-parametric approach Data Envelopment Analysis (DEA) based analysis to investigate the productivity change in the Egyptian banking sector. Input-oriented Malmquist indices of productivity change are estimated with DEA to measure total factor productivity (TFP) change. The TFP changes are decomposed into the product of technological change and technical efficiency change (catch up). In the second stage, potential determinants of productivity change are studied using a regression model. We find that the Egyptian banking sector as a whole shows a productivity regress of 0.9 per cent per year, which is mainly due to the technological improvements. The estimated regression model identifies some variables which significantly influence the productivity of banks in Egypt. The banks with higher loans to deposit ratio and higher returns on equity have higher productivity growth reflecting on their strong strategic and managerial skills. The size of bank seems to be associated with an increase in productivity. The maturity of a bank (measured by age) is associated with higher productivity. The net interest margin (NIM) and non-interest expense over total assets (NIETA) variables do not seem to be affecting the productivity of banks. Surprisingly, our results reveal that the financial crisis is negatively and statistically insignificant which means there are no effects on the Egyptian banks.
Keywords
Introduction
The growing globalization of financial markets and banking industry has affected the actions of many nations especially emerging countries. The banking industry is crucial for the stability of financial systems through the efficient allocation of national savings for investments. Also, financial system stability is important for both the overall economic development and the effectiveness of the central bank monetary policy. Over the last two decades, the Egyptian government has undergone consistent and remarkable transformation from a socialist to a capitalist economy. These changes were introduced mainly to improve the economic efficiency of Egyptian banking system.
Banking industry plays a significant role in mobilizing savings to fuel different investments and growth rates. This role is particularly important for Egypt where banks dominate the financial markets and public banks dominate the banking industry (Mohieldin, 1999). The Central Bank of Egypt (CBE) seeks to achieve rapid macroeconomics growth through expansionary fiscal and monetary policies to reinforce integration, competition and economic performance. Banks are considered as the main pillar for achieving growth in Egypt and represent a key element of the financial system. The CBE has accrued unprecedented outstanding loans during the last two decades. Conversely, the ultimate consequences of the high, yet debt-backed growth were uncontrollable inflation and outstanding debts (CBE, 2005). Consequently, since 1997, the economic outlook of the Egyptian banks has been deteriorating substantially and worsened in the last few years especially after the 2011 revolution (CBE, 2013).
The productivity of banks can be measured simply as a scalar ratio of outputs to inputs that the bank uses. Bank’s productivity may vary based on differences in the quality of inputs used. However, efficiency can be measured by associating the observed and optimal values of the bank’s outputs and inputs. The question of whether banks outperform or underperform other banks has received considerable attention in the literature. There is a large body of literature dealing with the measurement of banking efficiency and productivity growth in the developed economies, but studies on banking efficiency and productivity growth relating to Middle Eastern economies are few. To the best of our knowledge, there are no single research articles related directly to the productivity growth of banks in Egypt. One of the reasons for the lack of this research is that most Middle Eastern countries including Egypt did not introduce financial and banking sector reforms until 1990s. Until then, financial system in these countries tended to be heavily regulated and dominated by the public sector (United Nations, 2005). However, over the past two decades, the majority of Middle East countries have gradually moved towards more liberalized financial systems. Moreover, this has created interest among policymakers, managers and economists to study the efficiency performance and productivity of banks in Middle Eastern countries over time.
The aim of this article is to fill the gap in the existing literature on efficiency and productivity growth in the Banking industry of Egypt. The era of our sample is very rich with many aspects that influenced the Egyptian banking system, starting with 1991 when the Egyptian government issued many new prudential measures for bank’s capital adequacy, asset classification and provisions after considering liquidity requirements for foreign and domestic banks. Also, the government introduced the international concentration limits for domestic and foreign banks in 1993. Then, the government started its privatization programme which included the banking sector. As a result, majority of foreign ownership of banks were allowed in 1996. In addition, in 2003 the Egyptian government decided to fully liberalize the currency exchange rate allowing it to be determined by the market forces. In 2004, the CB E started a new programme to restructure the banking sector and deal with non-performing loans (NPL) by encouraging a wave of mergers and acquisitions which enabled large and strong banks to acquire many small banks. The number of banks decreased from 65 banks in 1997 to only 39 banks in 2013. However, the global financial crises brought about significant changes in practices of Egyptian banks from 2009 to 2013. The study undertaken in this article will provide a new perspective about the banking sector of Egypt.
The primary objective of this article is to undertake an in-depth evaluation and examination of the productivity growth in the Egyptian banking sector. Input-oriented Malmquist indices of productivity change are estimated with DEA to measure total factor productivity (TFP) change using a balanced panel data containing 14 banks operating in Egypt (three large, five medium, three small and three foreign) for the period from 1997 to 2013. The study compares the productivity change between the foreign banks and domestic banks, between large banks, medium and small banks during the sample period. The empirical results are obtained by running an input-oriented DEA model using the software package, DEAP Version 2.1 (Coelli, 1996).
The rest of the article is organized as follows: To put the study in perspective, we provide a brief overview on financial liberalization and the banking sector in Egypt in second section. The objective and the rationale of the study are presented in third and fourth sections. Fifth section presents a brief overview of existing literature on productivity changes in the banking industry. The drivers of productivity change are analysis in sixth section. The estimates of productivity change are regressed against a vector of explanatory variables in seventh section. Eighth section summarizes and brings together the main findings.
Financial Reforms and Banking Sector in Egypt
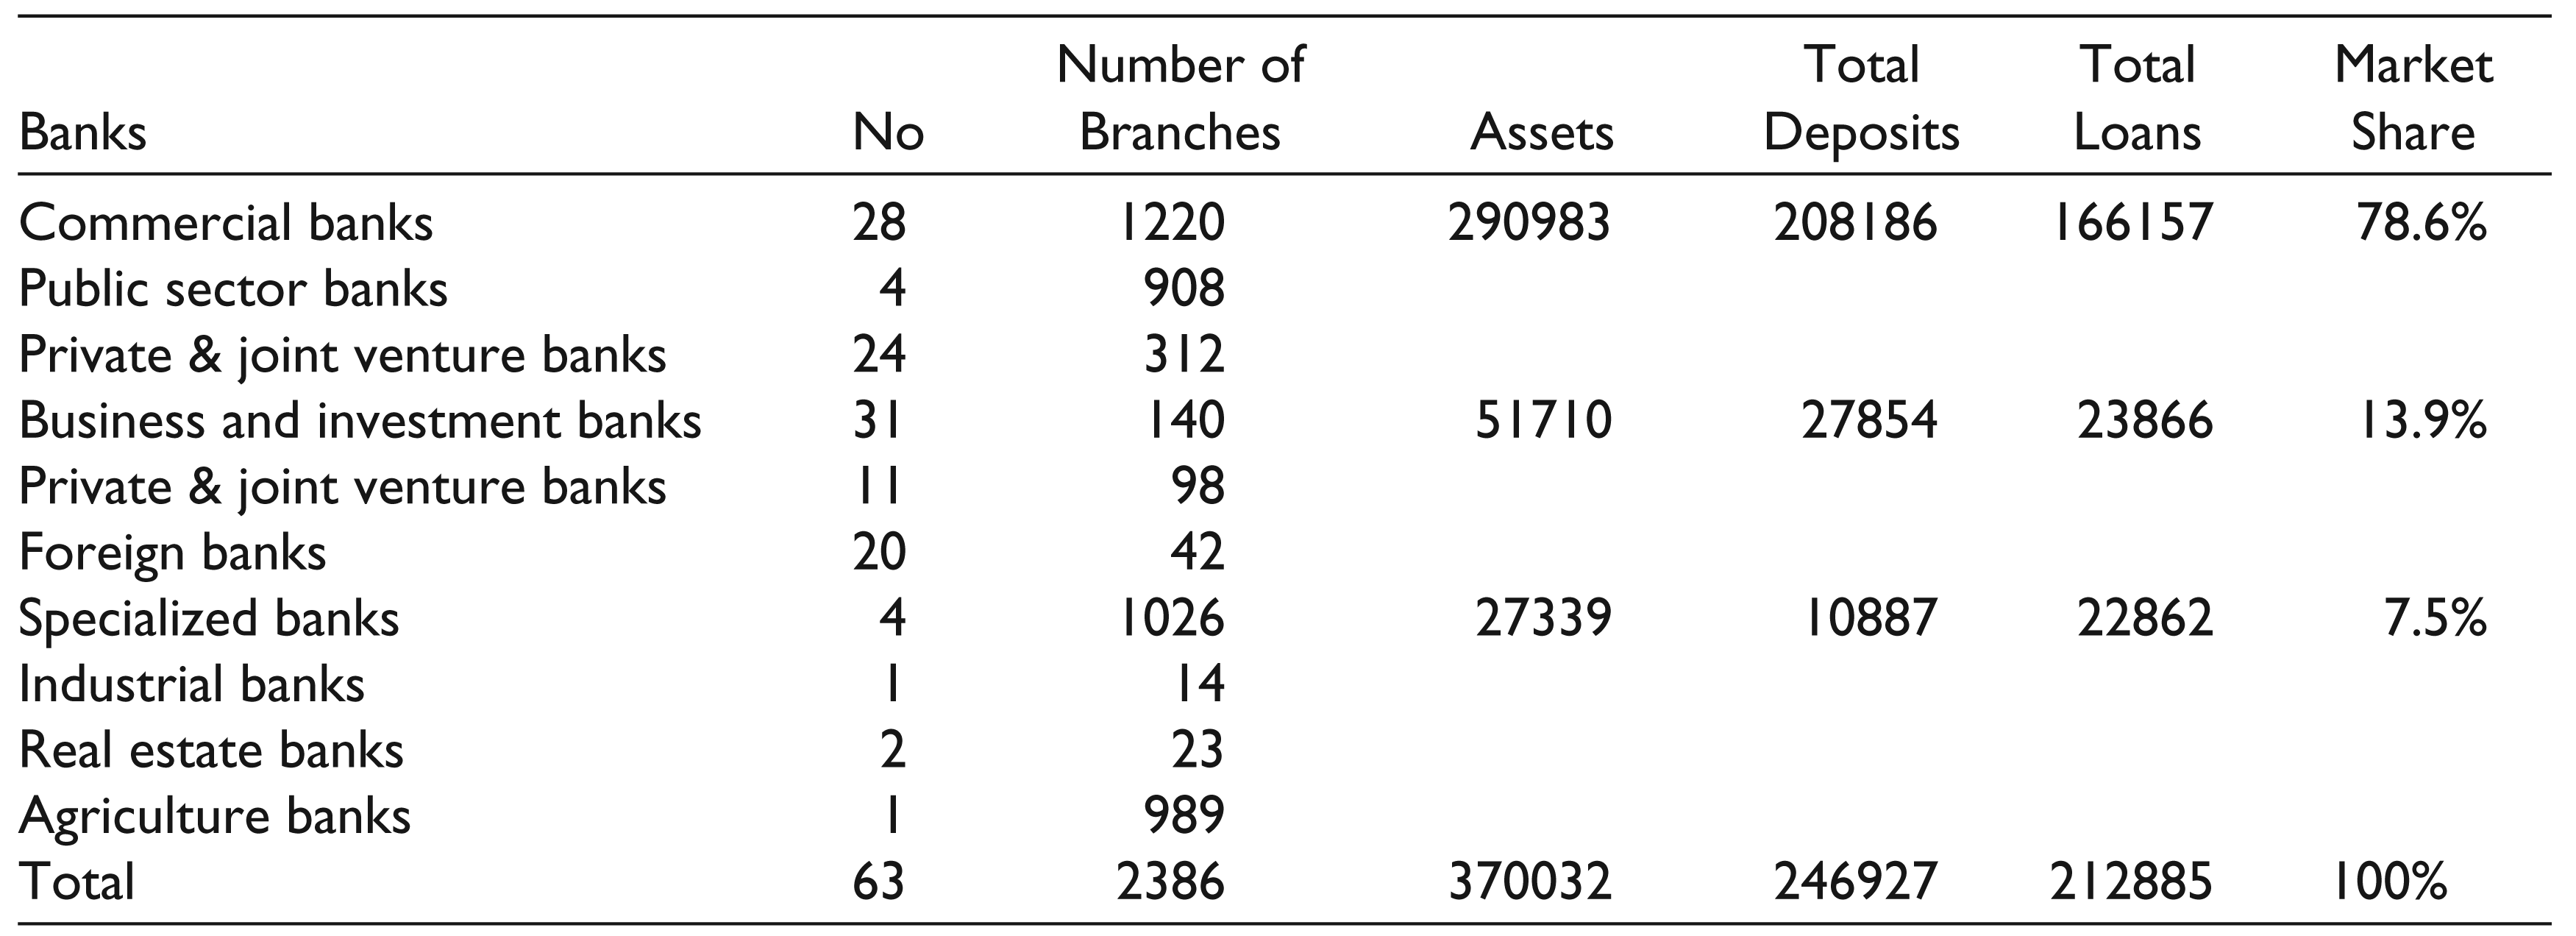
Egyptian banking sector, as in many other developing countries, experienced periods of restructuring and deregulation as the state-owned banks were gradually privatized. Undoubtedly, these changes affected both efficiency and productivity of Egyptian banks. In 1991, the Egyptian government initiated a reform process in order to transition from a centralized economy towards a market-oriented economy. Consequently, the government embarked upon a major programme to restructure the banking industry. This new programme aimed generally at (i) expanding the private sector’s ownership base, (ii) integrating Egypt into the global economy and (iii) accelerating the pace of privatization of the public sector (CBE, 1996). Consequently, the government issued Public Enterprise Companies Law (PECL) No. 203/1991 to facilitate the implementation of the privatization programme. Additionally, in 1992, the government developed the legislations and legal regulations of the Egyptian Stock Exchanges through the passage of Capital Market Law (CML) No. 95/1992. Specifically, this programme was designed with the help of International Monetary Fund (IMF) and the World Bank to decrease the government’s role in the financial sector, to encourage private sector investments, to introduce market-oriented banking mechanisms, to promote foreign direct investment in Egypt and to enhance competition in the banking sector (Euromoney, 1999). Consequently, since 1990s, the CBE has introduced a series of reforms regarding banking regulation and legal environment in order to improve the performance and development of the Egyptian Banking sector. The banking law which was enacted in 1975 (Law 120 / 1975) defined the nature and mode of operations for all banks into three main categories: (i) Commercial banks which accept deposits and provide loans for many transactions, (ii) business and investment banks which deal with medium- and long-term projects and (iii) specialized banks which deal with specific economic activity, such as agriculture, industrial development or real estate sectors. The structure of Egyptian banking sector in the 1990s can be seen in the appendix, which depicts the oligopolistic nature of Egyptian banking sector, as four state-owned banks control 50 per cent of the sectors’ assets and 53 per cent of commercial banks’ assets (CBE, 2000). However, with the exception of the big four, the industry is highly fragmented as no single bank controls more than 5 per cent of the sectors’ assets and only 14 banks control 1 per cent or more of all assets.
The first round of privatization took place from 1994 to 1998 as part of a restructuring programme with the objective to increase the efficiency of public sector. The Egyptian government privatized about 189 state-owned companies, but none of the public banks were included in this round. In 1996, the government issued new laws that permitted 100 per cent foreign ownership of banks and allowed banks to do business in both foreign and local currencies (CBE, 2001). These new laws enabled both private and foreign banks to operate in a competitive environment. Also, in 1996, the government of Egypt ordered the four public banks to reduce their majority stakes in joint venture banks to a maximum of 20 per cent ownership. However, the second round of privatization (1999–2004) started by the passage of Law 155 (Law 155/1998) allowing the privatization of state-owned banks. Moreover, the Egyptian parliament passed (Law 5/1998) a law to close a double tax loophole (this loophole allowed banks to avoid tax liability by investing in T-bills). The CBE also introduced restrictions on credit facilities for certain imports in 1999 that reduced the volume of letters-of-credit (LCs) which amounted to about 22 per cent of banks off balance-sheet positions (CBE, 2002). Immediately prior to the second round of privatization, the Egyptian economy faced a serious currency liquidity crisis in 1999. This crisis affected the performance of Egyptian banking sector due to the recessionary economic environment. In addition, at the end of 2002, the CBE raised the minimum capital adequacy ratio from 8 per cent to 10 per cent which created difficulties for undercapitalized banks and they were forced to either raise their capital or merge with other capitalized bank(s). In early 2003, many Egyptian banks, particularly those that had significant proportion of investment portfolio in foreign currency, faced foreign exchange losses immediately after the Egyptian government decided to float the Egyptian pound against the US$. As a result, the CBE reacted quickly by increasing interest rates on T-bills in order to limit the overshoot in the exchange rate (CBE, 2004). The average interest rate on T-bills rose up from around 8.10 per cent in early 2003 to around 11.30 per cent at the end of the same year. During this year, the Egyptian banks, especially state-owned banks, suffered from high NPL ratios. Consequently, in 2003, the CBE started its comprehensive reform plan to rescue the banking sector.
The government sought to enhance banking competition, reduce NPL, raise capital adequacy and enforce prudential regulations through specific banking restructuring programmes (Reda, 2013). As a result, a NPL monitoring unit was established by the CBE in 2004 to restructure the state-owned banks, consolidate banking systems through mergers and acquisitions of small and weak banks, privatize some state-owned banks, divest public sector shares in joint venture banks, resolve NPL and strengthen the supervisory authority of the Central Bank of Egypt (CBE, 2010). The CBE required the big four public banks which own more than 50 per cent of the banking sector’ assets to sell their stakes in joint venture banks and to raise paid-up capital requirements to a minimum of USD 50 million for branches of foreign banks (CBE, 2005). It also refrained from issuing new banking licenses which effectively direct foreign banks to form a partnership with a local bank. One of the major features of this new programme was the minimum capital requirement of Egyptian pound 500 million for local banks. Also, the new programme focused on lending rules to avoid future negative shocks in the asset quality for all banks. In 2005, the Egyptian ministry of finance undertook an initiative to revamp Egypt’s tax structure, both at the personal and corporate levels, with the latter constituting a reduction of the taxation rate from 42 per cent down to 20 per cent. The banking sector benefitted from this tax reform, particularly those banks that were listed in the Egyptian Stock exchange, as they got a further tax exemption of about 10 per cent.
The CBE programme helped the Egyptian banks to comply with the guidelines of Basel Accord II (CBE, 2010). Moreover, the government started to privatize state-owned banks to increase competition in the banking sector, to prevent further market fragmentation and to improve know-how through the participation of foreign banks (Mohieldin & Nasr, 2007). As a result, the banking sector consolidated to some extent and the number of banks operating in Egypt significantly dropped from 65 in 2003 to 40 in 2014 (CBE, 2014).
During the implementation of this ambitious programme to revive the Egyptian banking sector and overcome the slowdown in the preceding years, the global financial crisis started and like in many other countries, had a negative impact on the Egyptian economy in general and it is banking sector in particular. Before the global financial crisis, the Egyptian banks were more liquid, well-capitalized, regulated and closely scrutinized (CBE, 2009). However, the banks’ profitability was affected by the global financial crisis and the collapse of the local stock market. While the portfolios of Egyptian banks did not include risky instruments like derivatives and securitized bonds, the Egyptian banks suffered losses on their portfolio investments as a result of the slowdown of economy (CBE, 2009). The CBE prepared a new phase of the financial reform in order to limit the impact of global financial crisis, which included a deposit insurance plan to protect small investors and establishing the non-banking financial sector regulatory body to regulate insurance companies, capital market activities and mortgage finance companies (CBE, 2010).
Objectives of this Study
The primary objective of this article is to investigate whether the Egyptian banks have experienced any improvement in their productivity during the financial liberalization period from 1997 to 2013. The aim is to investigate whether there has been an increase and convergence of efficiency levels following the process of liberalization. The article use DEA to calculate input-oriented Malmquist productivity indices (MPI) to measure TFP change in 14 banks during the period from 1997 to 2013. The TFP changes are decomposed into the product of technological change and technical efficiency change (catch-up). We then also evaluate the main determinates of Egyptian banks’ efficiency in order to analyse the influence of various factors on bank efficiency.
Rationale of the Study
The present study overcomes the limitation in literature of productivity in the Egyptian banking studies which have not covered the entire financial deregulation and revolution period, as we encompass the entire financial liberalization period and investigating the drivers of productivity change in Egyptian banks.
A Review of Literature on the Egyptian Banking Efficiency and Productivity Change
The literature on efficiency and productivity change of banks and how productivity influenced by changes in regulations, innovation and technological processes and differences of productivity across countries are vast. Various studies conducted in the USA, Europe, Asia and a few in Africa have measured efficiency and productivity change in banking sector.
The literature on assessing the efficiency of US banks are numerous (Elyasiani & Mehdian, 1995; Ferrier & Lovell, 1990; Grabowski, Rangan, & Rezvanian, 1994; Mukherjee, Ray, & Miller, 2001; Richard et al., 2002; Seiford & Zhu, 1999; Wheelock & Wilson, 1999) and have all studied efficiency and productivity of US banks in recent years. Elyasiani and Mehdian (1995) investigated productivity, concentrating on trends in technical efficiency and technological change for small and large US commercial banks for the period from 1979 to 1986. They used DEA to measure the efficiency of US banks pre- and post-deregulation periods and found that the technical efficiency of large banks declined by 3 per cent over an 8 year period. They assert the absence of any significant difference in the technical efficiency of US banks following bank deregulation. Mukherjee et al. (2001) studied productivity growth in 201 large US commercial banks, covering the initial post-deregulation period from 1984 to 1990 and found that productivity grew by 4.5 per cent per year on average, with a significant decline in the initial years. Banks with large asset size experienced higher productivity growth overall. This study shows that larger banks and a higher specialization of products in general have higher productivity.
Ferrier and Lovell (1990) and Grabowski et al. (1994) used the DEA approach to assess the productive performance of US banks relative to the best-practice frontier and found that overall the efficiency of the US banking industry ranges from 65 per cent to 90 per cent. Following this, Richard et al. (2002) used the DEA model to evaluate the productive efficiency of US commercial banks from 1984 to 1998. Strong and consistent relationships between efficiency and independent measures of performance were found. Seiford and Zhu (1999) examined the performance of the top 55 US commercial banks using DEA. They used a two-stage [1] production process to measure profitability and marketability, with inputs and outputs in each stage consisting of eight factors. Their results indicated that relatively large banks exhibited better performance on profitability, whereas smaller banks tended to perform better with respect to marketability.
Among the many researches that focus on the European banks (e.g., Berg et al., 1992; Berg, Forsund, Hjalmarsson, & Suominem, 1993; Casu & Girardone, 2002; Casu, Girardone, & Molyneux, 2004; Chaffai, Dietsch, & Lozano-Vivas, 2001; Grifell-Tatje & Lovell, 1996; Noulas, 2001). Berg et al. (1992) analysed the performance of 346 Norwegian banks from 1980 to 1989 using the Malmquist index and found that productivity regress before deregulation and progress after deregulation. They conclude that productivity change was mainly due to relative efficiency gains instead of frontier shifts. Berg et al. (1993) confirm the same results in the Finnish and Swedish banking sectors using data for a single year. Grifell-Tatje and Lovell (1996) found that Spanish commercial banks have lower productivity changes than Spanish saving banks in the period between 1986 and 1993. Chaffai et al. (2001) investigated productivity gaps in banking industries across four European countries using Malmquist decomposition and separated productivity differences into purely technological differences and differences attributed to external factors.
Other streams of research have focus on the Asian and Australia regions, many authors have carried out studies (e.g., Batchelor & Gerrard, 2004; Fukuyama, 1995; Gilbert & Wilson, 1998; Kourouche, 2008; Kumar, Malathy, & Ganesh, 2010; Lim & Chu-Chun-Lin, 1998; Lin & Zhang, 2009; Neal, 2004; Ram Mohan & Ray, 2004; Rezvanian & Mehdian, 2002; Rezvanian, Rao, & Mehdian, 2008; Sathey, 2002; Yeh, 1996).
For example, Gilbert and Wilson (1998) employed DEA to measure the effects of deregulation on the productivity change of South Korean banks for the period from 1980 to 1994. Their findings indicate that deregulation had led to an improvement in the productivity levels of large banks, which recorded strong productivity growth, whereas the regional banks recorded productivity regress or no change.
Bhatia and Mahendru (2016), they evaluate technical efficiency scores of public sector banks (PSBs) in India. Their study also determines the nature of return to scale (RTS) of individual banks and thereby identifies the leaders and laggards in the PSBs. Non-parametric approach, that is, DEA is used to determine the causes of inefficiency. Their sample of the study includes 26 PSBs operating in India during the time period from 2007–2008 to 2011–2012. Their results show that although the PSBs have more or less similar efficiency scores, that is, higher than 0.900, still out of 22 banks falling in the category of efficient banks in 2007–2008, only seven of them were left by the year 2011–2012. Overall analysis of PSBs during the time period of the study explains that a greater part of inefficiency among PSBs is attributed to scale inefficiency. In addition, the number of banks operating at constant return to scale (CRS) came down to nine in 2011–2012 from 23 in 2007–2008. In addition, there was a reduction in leaders and increase in laggards. It is suggested that banks must optimize their scale of operations and adopt technological innovations. Kourouche (2008) investigated the efficiency and productivity of 10 Australian banks during the period from 1995 to 2005. Technical efficiency levels of the banks were examined using DEA; and TFP change was estimated using MPI. The results revealed that the efficiency and productivity change varied across the banks and over the years. The results suggested that the banks needed to control their costs and invest in new technology and capital equipment to improve efficiency and productivity levels.
The Egyptian studies on measuring efficiency and productivity change of banks are limited. However, those are a few studies on measuring productivity and efficiency on the Middle East area. One of the studies recently done on Jordanian banks, Paul and Jreisat (2012) used input-oriented DEA model is to compute Malmquist indices of productivity change using data for 17 banks for the sample period from 1996 to 2007. Their results reveal that over the sample period which covers the entire deregulation era, the Jordanian banking sector as a whole shows a productivity growth of 3.5 per year which is largely due to the technological improvement. The productivity change among the domestic banks is much higher than the foreign banks.
Jreisat and Paul (2010) provided a review of banking efficiency in the Middle East economies with a special emphasis on measuring the efficiency of banking sector in Jordan. These studies have revealed that banks have achieved some levels of efficiency. Also, they presented a detailed analysis of banking efficiency in Jordan using data for the period from 1996 to 2007. The input-oriented DEA methodology is applied to obtain estimates of technical efficiency decomposed into pure technical and scale efficiency. Their analysis reveals that the Arab bank which is one of the large banks has performed at the highest level of technical efficiency during the sample period. The small banks are found to be more efficient than the medium-sized banks. The foreign banks have shown the lowest technical efficiency indicating a large scope for cost reduction.
More recently, Jreisat (2012) has investigated the efficiency and productivity growth of the Jordanian banking sector, during the period of financial deregulation, from 1996 to 2007. It begins with analysis of technical efficiency based on DEA, followed by measuring cost-efficiency, finally, the MPI are computed to examine the TFP change.
Reda and Isik (2006) examine the efficiency and productivity of commercial banks in Egypt from 1995 to 2003 using the DEA and Malmquist productivity index. They find the commercial banks are technically inefficient and productivity deteriorating annually over the period of study. Badreldin and Kaloefer (2009) examine the effect of mergers and acquisitions on Egyptian banks’ performance by employing the return on equity (ROE) scheme during the period from 2002 to 2007. They find that there is insignificant positive relationship between mergers and acquisitions and profitability of banks. They conclude that banking industry reforms had not have any effect on profitability.
None of these studies have covered the entire financial deregulation and revolution period. The present study overcomes this limitation by encompassing the entire financial liberalization period and investigating the drivers of productivity change in Egyptian banks.
The Malmquist Total Factor Productivity Index: Decomposition and Measurement
The Malmquist TFP index was first introduced in two very influential papers by Caves, Christensen and Diewert (1982a, 1982b). These authors define TFP index using Malmquist distance functions; hence, the resulting index is known as Malmquist TFP index. One of the important features of these distance functions is that they allow description of a multi-input, multi-output production technology without the need to specifying a behavioural objective, such as cost minimization or profit maximization. Distance functions are of two types: the input distance functions and the output distance functions. Input distance functions look for a minimal proportional contraction of an input vector, given an output vector and output distance functions consider the maximum proportional expansion of output with a given set of inputs. Since the banks have better control over the inputs, we adopt an input-orientated approach for computing TFP. The mathematics underlying the estimation procedure is outlined in Färe, Grosskopf, Yaisawarng, Li and Wang (1990) and Coelli, Rao, O’Donnell and Battese (2005).
The Data and Estimates of Malmquist TFP Change
The Farrell (1957) approach to frontier estimation was not given much attention until a paper by Charnes, Cooper and Rhodes (1978) in which the DEA approach was introduced for the first time. Many other researches have applied and extended this methodology (see Lovell, 1993) and Seiford (1996) for extensive reviews of the related literature). Data Envelopment Analysis is a mathematical method that uses a linear programming procedure to determine the efficiencies of decision-making units (DMUs) with multiple inputs and multiple outputs. Many other researches have applied the DEA approach in different industries, such as banking, airlines, hospitals, hotels, sports, etc. The DEA approach is a unique method that needs neither a specified functional form nor the weights of inputs and outputs, but can measure the efficiency of different units relative to other units used as comparators (Lovell, 1993).
For our article, we follow same methodology carried out by Paul and Jreisat (2012) for the Jordanian banks. We used input-oriented DEA model to compute Malmquist indices of productivity change. For finding TFP variables, we employ two inputs, labour (x1) and total deposit (x2), to produce two outputs, total loans (y1) and other investments (y2). Labour is measured in terms of full-time workers, total deposits are customers’ deposits. Total loans are the total credit facilities that appear in the balance sheets of the banks. Other investments consist of investments in bonds and securities, shares, treasury bills, governmental bonds and investment in affiliate and subsidiary companies. For a comprehensive analysis, the domestic commercial banks are classified (based on their assets size in 1997) into three categories: (i) Large banks, (ii) Medium banks and (iii) Small banks, (Table 1). It should be noted that the banks’ assets have changed over the years but none of the banks crossed their categories. This facilitated their comparison over the sample period.
The data used in this study cover 1997–2013 period and are taken from, auditing annual report of individual banks, CBE. The data were collected from 14 banks operating in Egypt: 11 domestic banks, and three foreign banks.
Results of Malmquist TFP Change
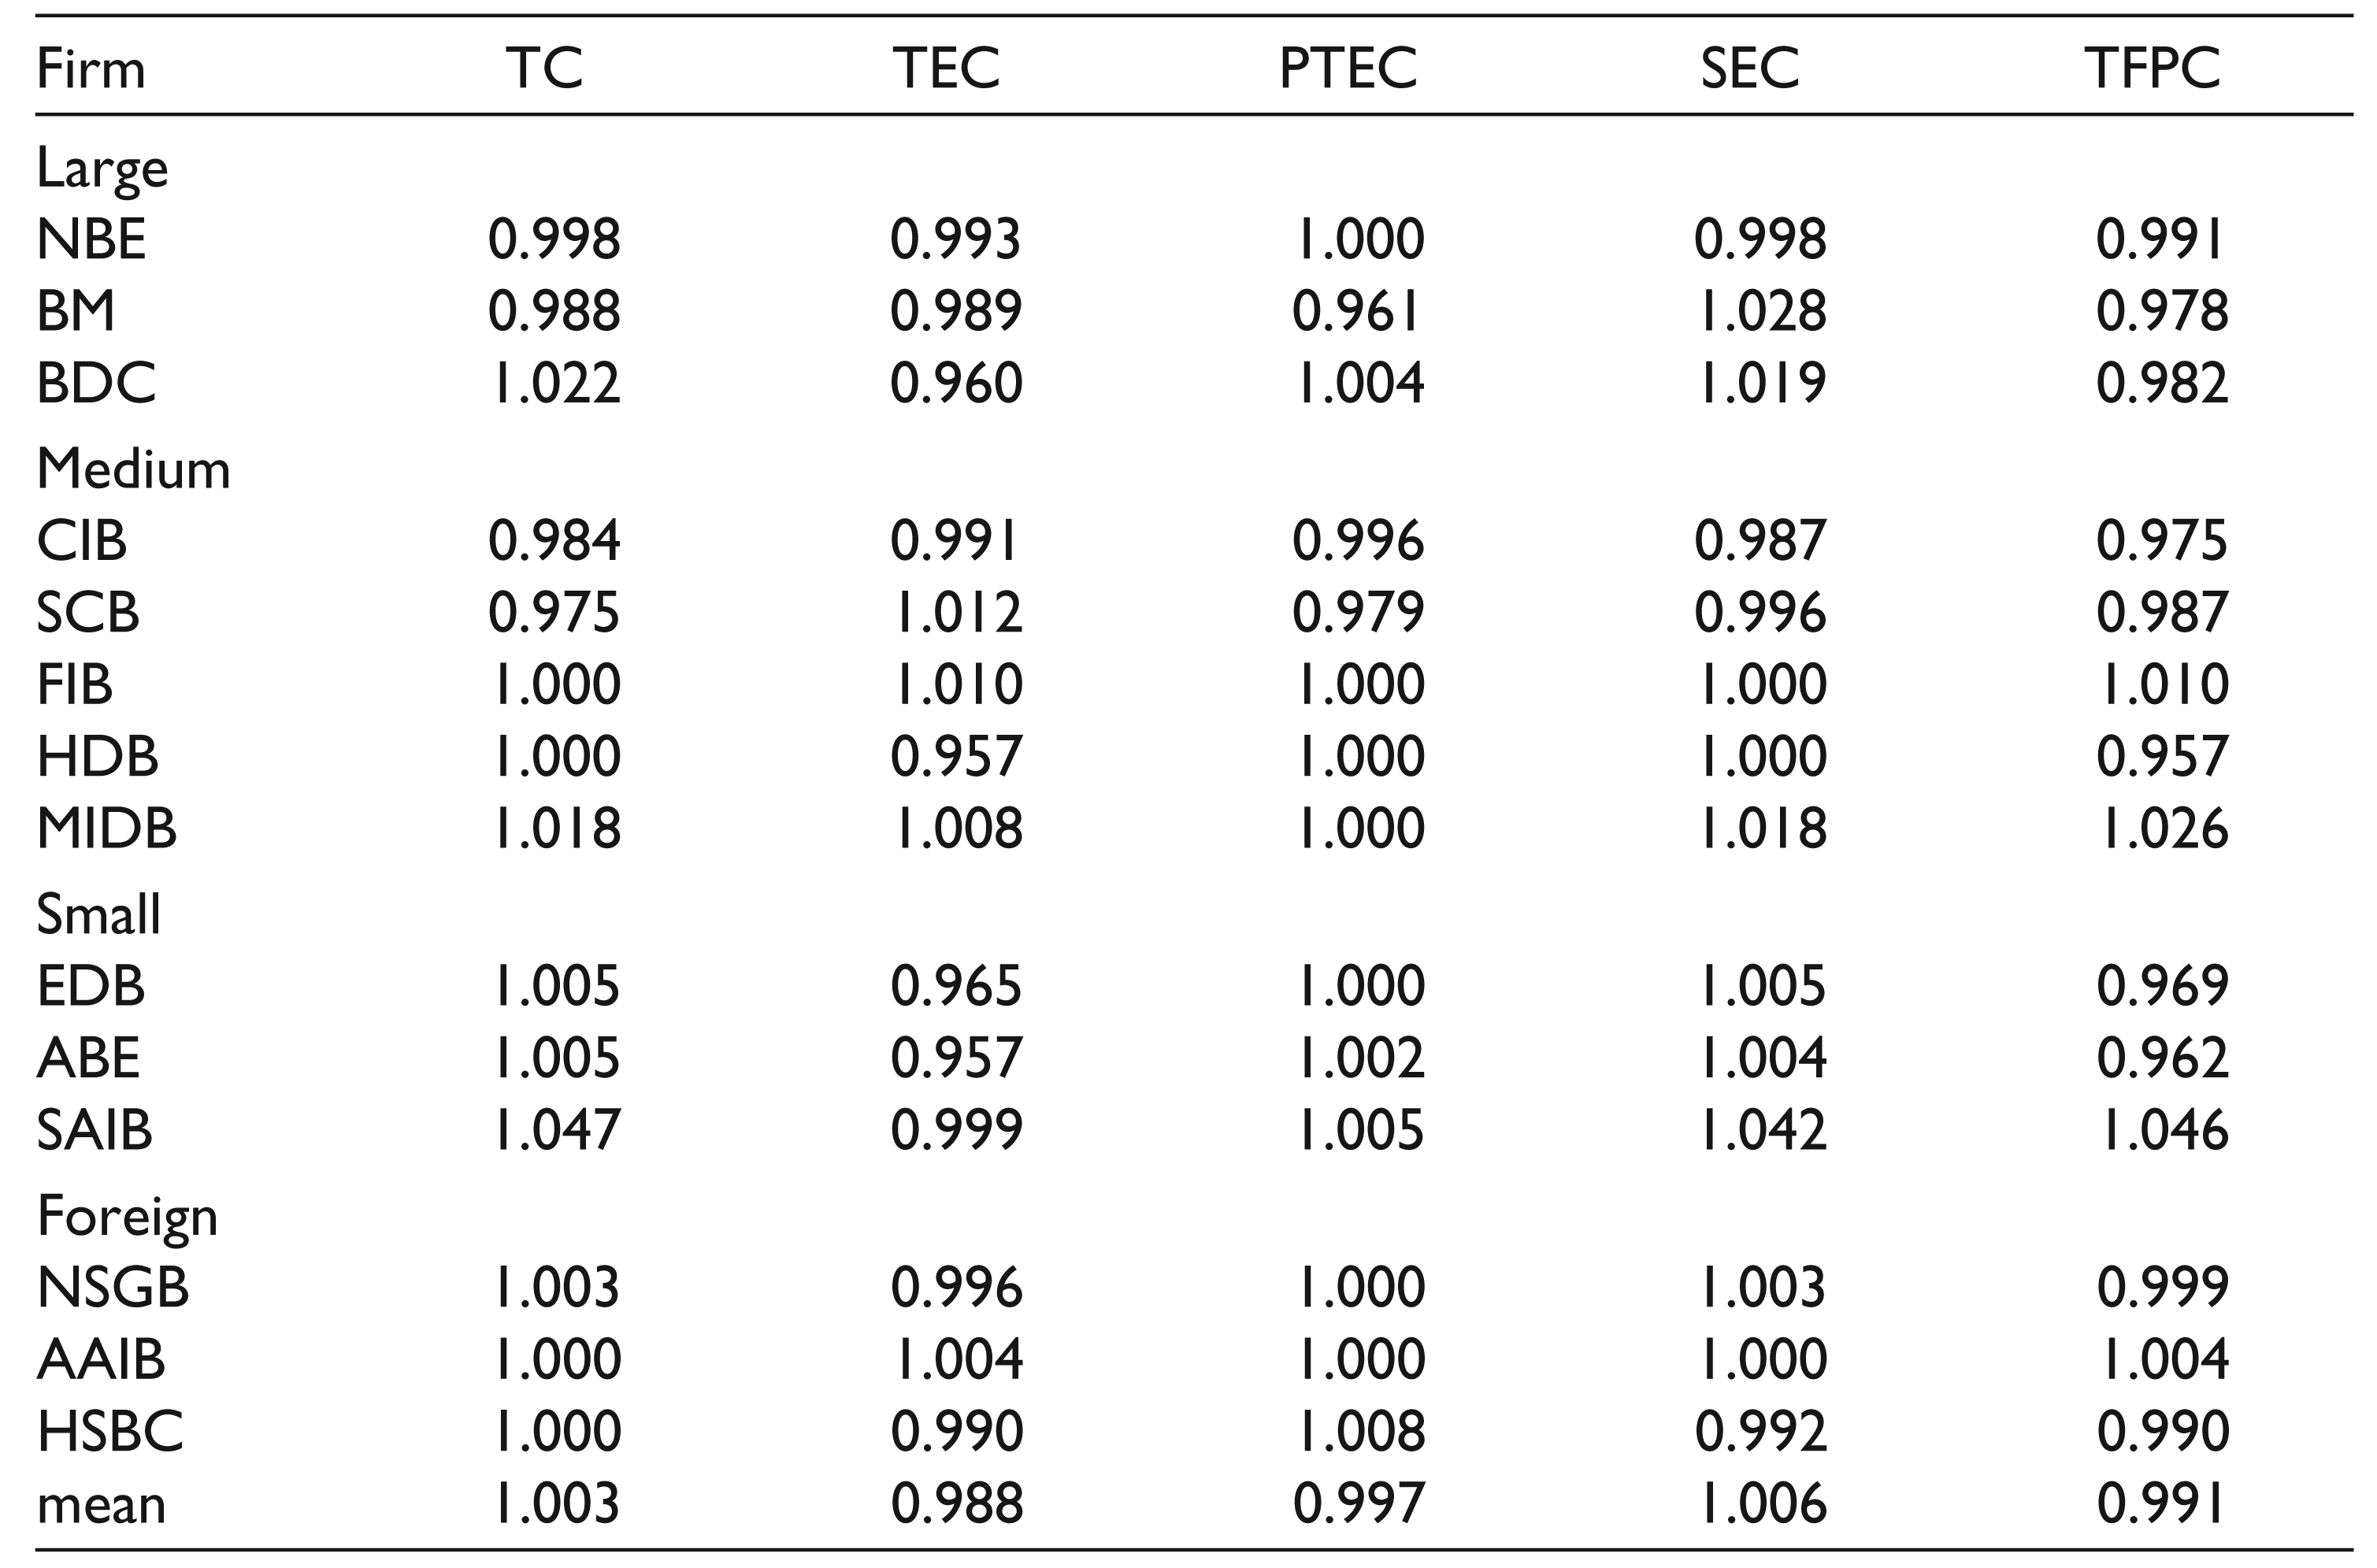
We have used non-parametric data envelope approach to compute the input-oriented Malmquist indices of productivity change based on the panel data which cover 14 banks operating in the Egypt from 1997 to 2013. The computer software DEAP (Coelli, 1996) is used to calculate these indices. The value of the MPI greater than one indicates positive productivity growth or productivity progress while a value less than one productivity decline or productivity regress. Percentage change in productivity is given by (productivity change – 1) × 100. Where mean aggregate indices are reported for the different groups of banks, these are weighted geometric means using the shares of individual banks in the group output as weights. Similarly, the indices aggregated over the period are also weighted geometric means, where shares of yearly outputs in the total output for the period are used as weights. The sample period mean of TFP change and its components of technical efficiency change, pure technical efficiency change, scale efficiency change and technological change indices for each bank are presented in Table 2. The results reveal that the two medium-sized banks, one small-sized bank and one foreign bank have shown productivity improvements and for the remaining banks (10) productivity has declined over the years. The highest mean TFP growth per annum has been shown by Societe Arabe Internationale de Banque (SAIB) as 4.6 per cent and lowest by the Arab African International Bank (AAIB). The observed improvement in mean TFP is largely attributable to technological progress. About nearly half of the banks have shown a decline in their technical efficiency.
Assets of Domestic and Foreign Banks, 1997

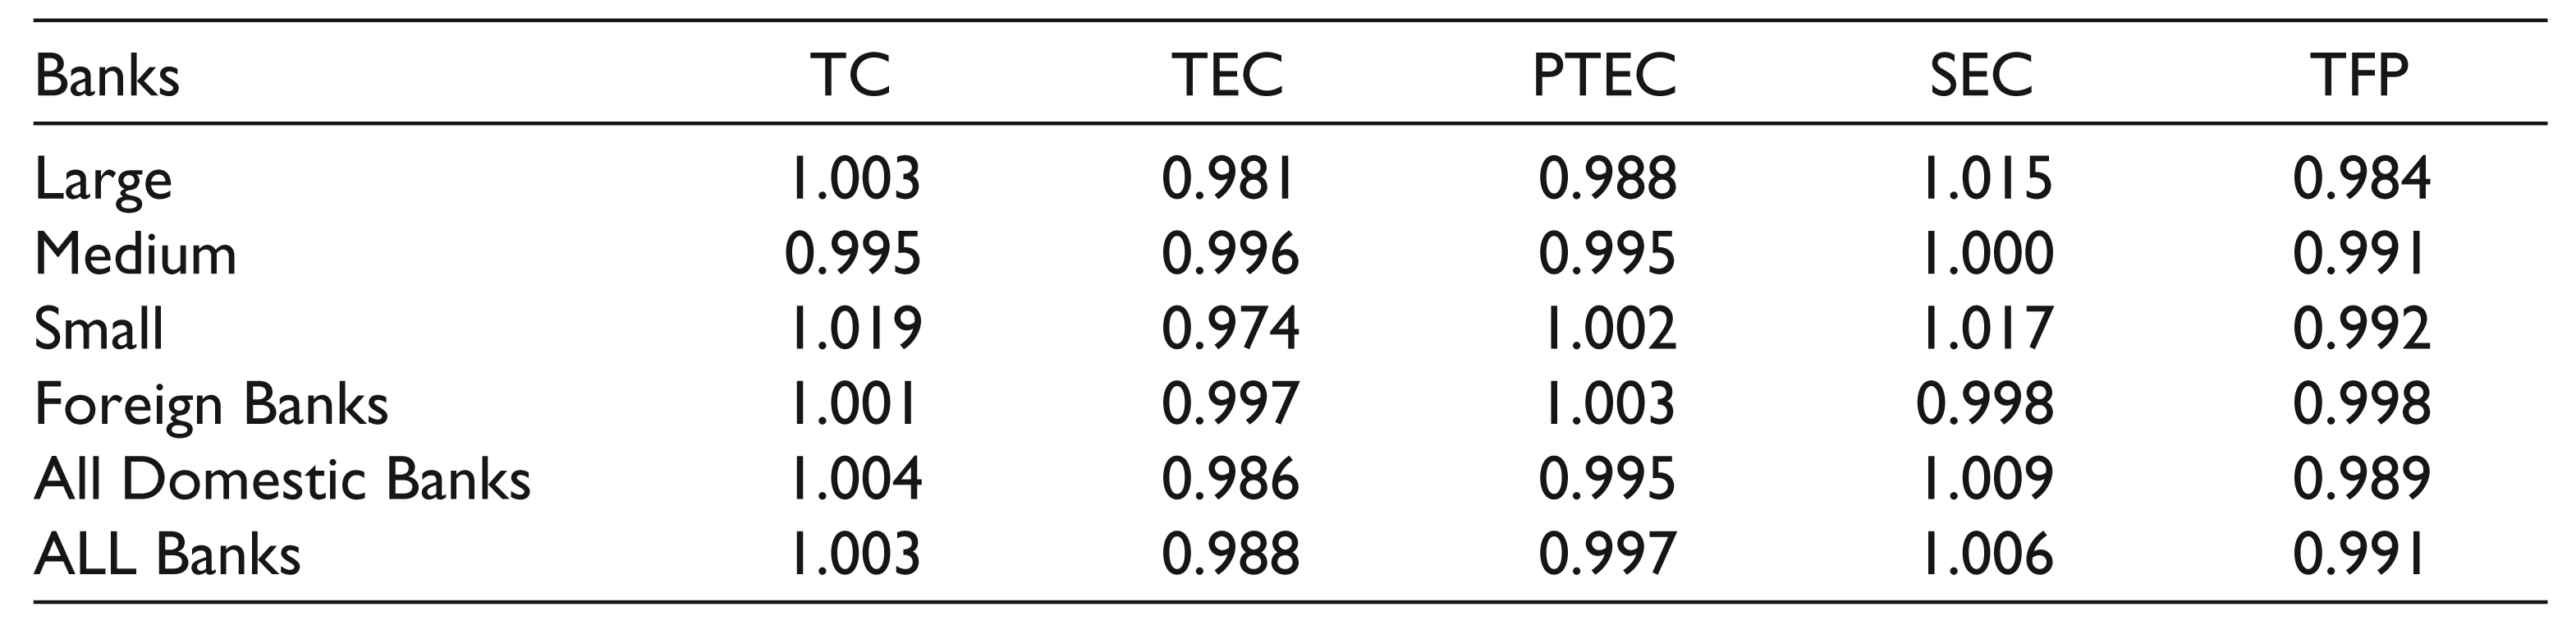
Table 3 records mean MPI estimates for the broad groups of banks and the banking sector as a whole. The Egyptian banking sector as a whole shows the productivity decline of 0.9 per cent per year which is largely due to the technological decline. The productivity change among the domestic banks is less than the foreign banks. The time series estimates of the productivity growth of the whole sample banks are presented in Table 4. The productivity growth has dropped during the sample era and the reason may be due to the weak economic growth as a consequence of several economic and political shocks during the period from 1997 to 2013 (Dobronogov & Iqbal, 2005).
To check how productivity has changed over the sub-periods of financial reforms, we present the estimates of TFP for all banks for three sub-periods (Table 5), 1997–2003, 2003–2008 and 2009–2013, which represent, respectively, the early, middle and later phases of financial liberalization in Egypt and the estimates of TFP for all banks for the whole period are also provided.
Estimates of Malmquist TFP Change and its Components, Egyptian Banks, 1997–2013
Estimates of Malmquist TFP Change and its Components, by Bank Categories, 1997–2013
Yearly Malmquist Indices of Productivity Change, 1997–2013

Average Annual Growth Rates of Productivity Growth by Sub-group, 1997–2013 (Percentage)
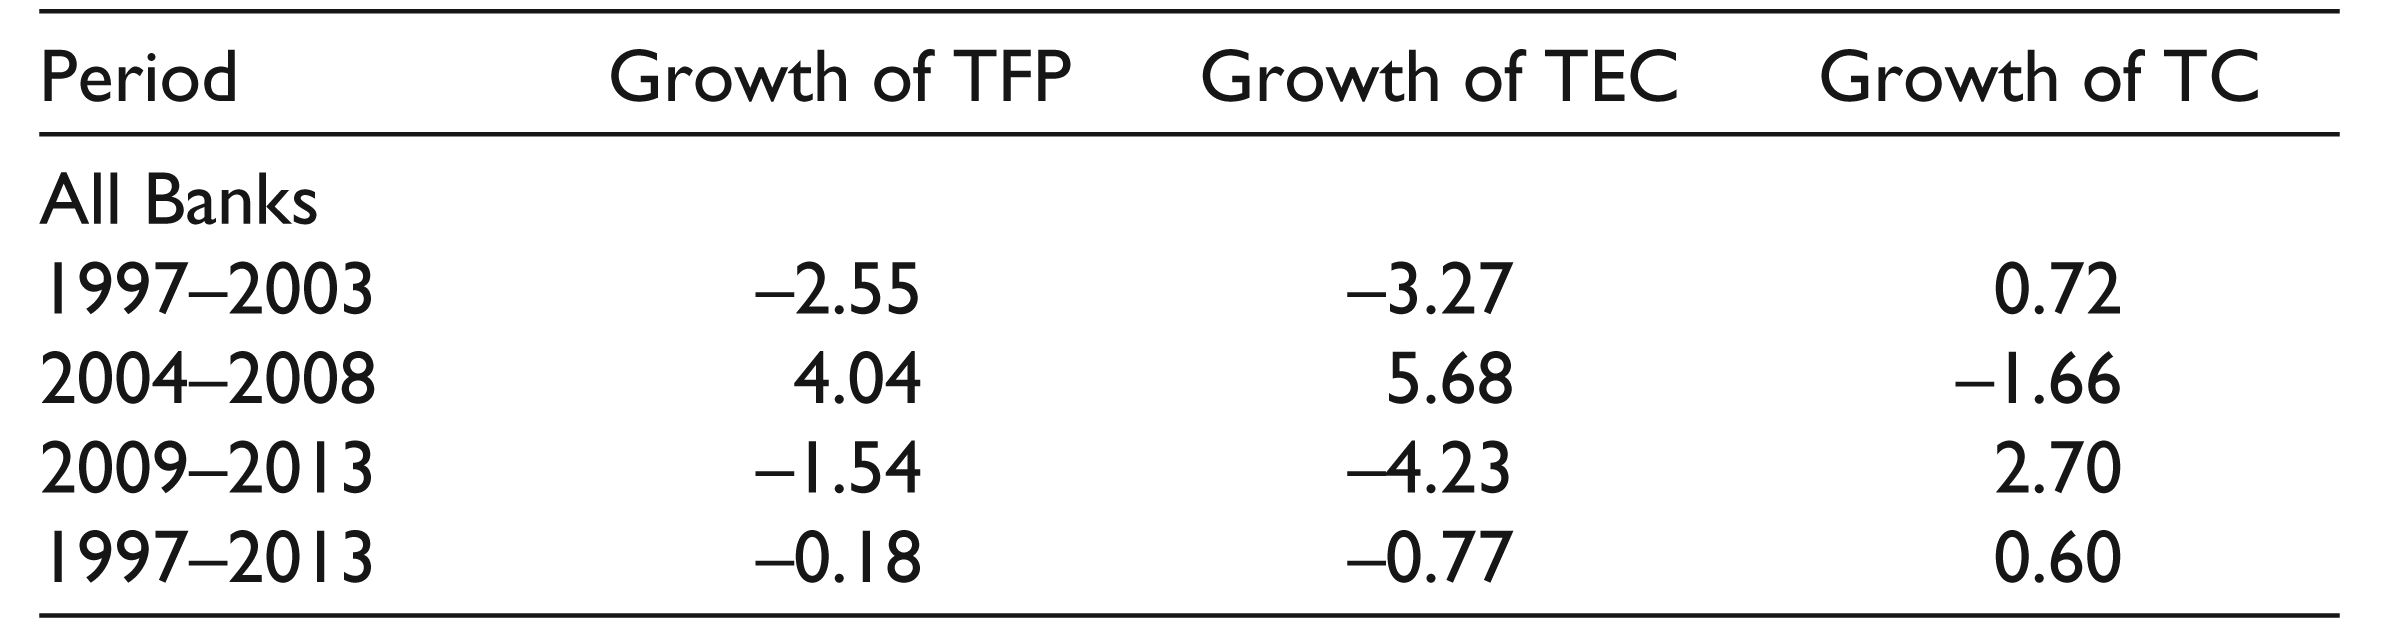
The results reveals that TFP growth in the banking sector experienced a decline in TFP growth at the rate of 2.55 per cent in the early phase 1997–03, the reason may be due to several factors affecting the banking performance, first, the Egyptian economy faced a serious currency liquidity crisis in 1999 prior to bank privatization. This crisis affected the performance of Egyptian banking sector due to the recessionary economic environment. Second, at the end of 2002, the CBE raised the minimum capital adequacy ratio from 8 per cent to 10 per cent which created a problem for undercapitalized banks that have to raise their capital or merge with another capitalized bank. Third, in the early 2003, the Egyptian government decided to float the Egyptian pound against the US$ which increased the banks’ foreign exchange losses, particularly those that have significant proportion of their investment portfolio in foreign currency. As a result, the CBE reacted quickly by increasing interest rates on T-bills so as to limit overshoot in the exchange rate (CBE, 2004). The average interest rate on T-bills rose up from around 8.10 per cent in early 2003 to around 11.30 per cent at the end of the same year. During this year, the Egyptian banks, especially state-owned banks, suffer from high NPL ratios.
In the middle phase 2004–2008, TFP growth increased at the rate of 4.04 per cent per annum, implying that banking sector has responded positively to the financial liberalization policies initiated by the Egyptian government. In 2004, the CBE started a new programme to restructure the banking sector and deal with NPL by encouraging a wave of mergers and acquisitions which enabled large and strong banks to acquire the small banks. As a result, the banking sector consolidated to some extent and the number of banks operating in Egypt plunged from 65 in 2003 to 40 in 2014 (CBE, 2014). Simultaneously, in 2005, the Egyptian minister of finance affirmed a revamp of Egypt’s income tax structure, on the personal and corporate levels, with the later constituting a unification of the taxation rate at 20 per cent down from a 42 per cent levy on service entities.
In the later phase 2009–13, TFP growth declined at the rate of 1.54 per cent per annum. There are several potential reasons for this decline. First is the impact of the global financial crisis on the Egyptian banking sector. Before the global financial crisis, the Egyptian banks were more liquid, well-capitalized, regulated and closely scrutinized (CBE, 2009). However, the banks’ profitability was negatively affected by the global financial crisis and the collapse of the local stock market. While the portfolios of Egyptian banks do not include risky instruments, such as derivatives and securitized bonds, the Egyptian banks suffered losses on their portfolio investments as a result of the slowdown of economy (CBE, 2009). Second, the CBE prepared a new phase of the financial reform plan after the global financial crisis which included a deposit insurance plan to protect small investors and establishing the non-banking financial sector regulatory body to regulate insurance companies, capital market activities and mortgage finance companies (CBE, 2010). Finally, the operating macroeconomic environment for Egyptian banks became more challenging, characterized by lower per capita GDP, high unemployment and soaring consumer price inflation.
Determinants of Total Factor Productivity Change
The annual estimates of productivity change for each bank presented in the appendix show yearly changes in productivity. In this section, we discuss a number of possible factors that might have affected the changes in productivity. The estimates of productivity change are regressed against a vector of explanatory variables (x). The explanatory variables are drawn from previous studies in banking efficiency literature (Cavallo & Rossi, 2002; Hermes & Nhung, 2010; Pasiouras, Tanna, & Zopounidis, 2009; Casu & Girardone, 2004; Vu & Turnell, 2011).
Specifically, the variables that are widely used in the banking efficiency and productivity literature are as follows:
LTA: It is the logarithm of total assets. It is used as a proxy for the growth of banks. It is thought of to be positively related to productivity. If the bank becomes too large to manage efficiently, the productivity may decline. LTD: It is the ratio of loans to deposits. It assesses a bank’s ability to transform deposits into loans. A higher LTD indicates a more productive process of financial intermediation provided by the bank. ROE: It is the return on equity. The higher the ROE for a given set of inputs, the more productive the banks are. NIETA: It is the ratio of non-interest expense over total assets. The NIETA measures the magnitude of administrative expenses. Banks that employ good management practises should be able to achieve lower administrative costs thus productivity may increase. Thus, it is expected that the higher the NIETA, the higher the bank management risks, and the less cost-efficient the bank is, thus productivity may increase. NIM: Net interest margin. This variable is defined as the difference between interest income and interest expenses divided by total assets. It is expected that this variable will be positively related to the efficiency, as that the higher the NIM, the more efficient banks are thus productivity may increase. Financial crises (GFC): We use it as a dummy variable, to find out if the financial crisis has affected the Egyptian banking sector negatively.
We consider the following model which assumes that TFPC depends on LTA, LTD, ROE, NIM, NIETA and a dummy variable of financial crisis.
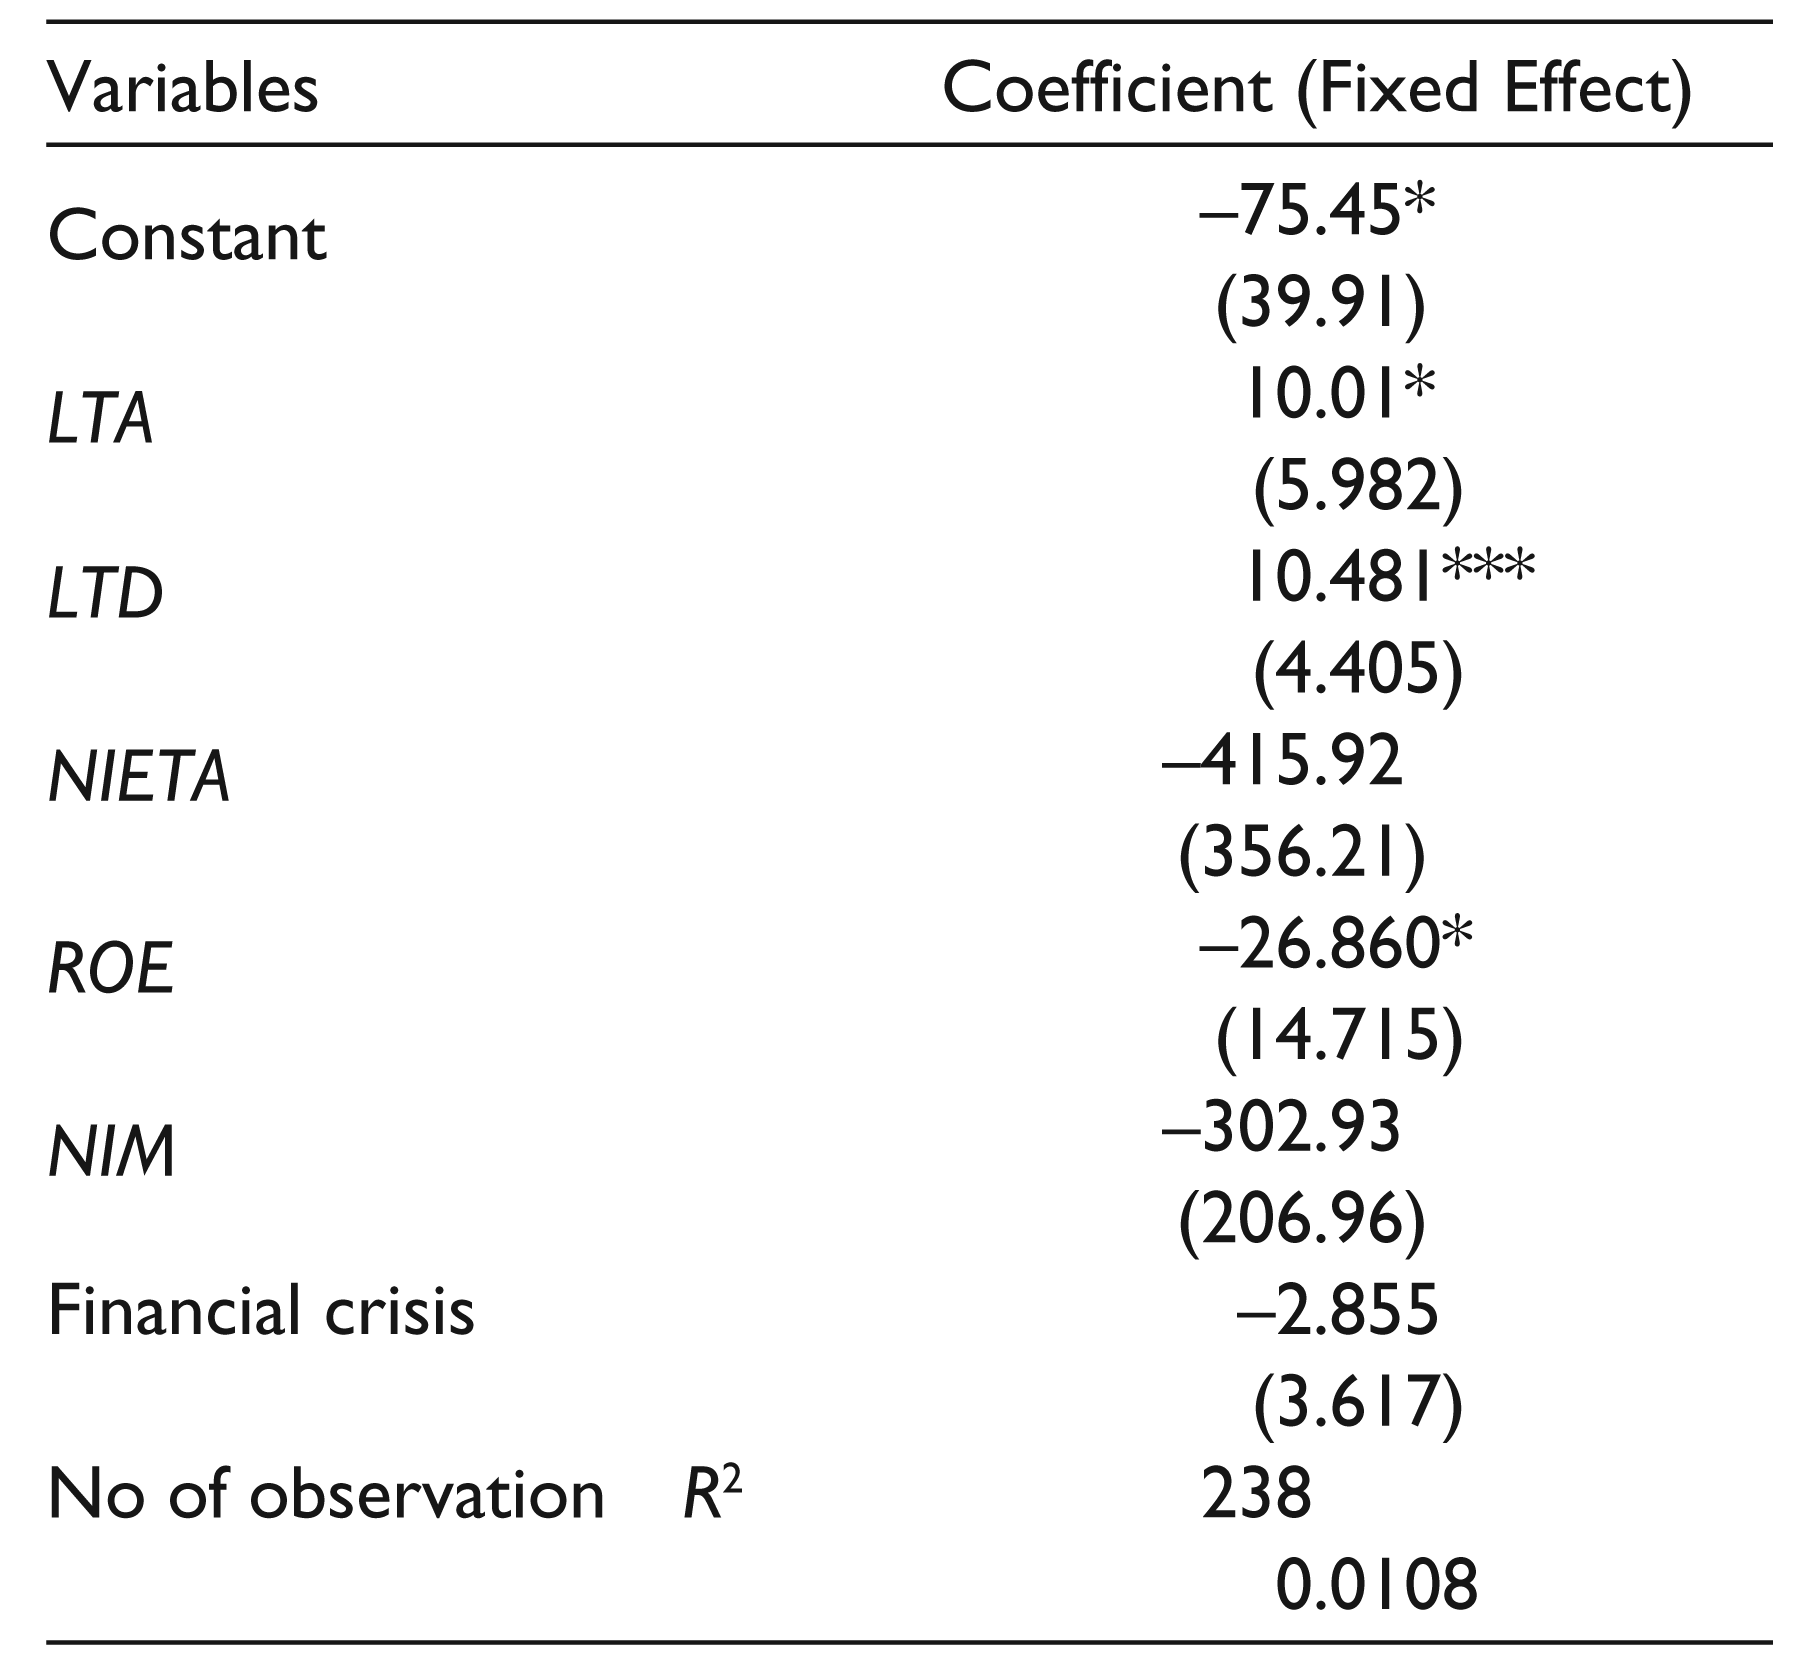
Given that our data set consists of balanced panel of banks, we use fixed effects estimator for estimating the model in linear form. The results are presented in Table 6. The estimated model seems to give a reasonable fit to data in terms of R2. Most of coefficients are statistically significant at conventional level of significance. The coefficients for LTA is positive and significant suggesting that, other things remaining the same, growth of the bank is accompanied by an increase in its productivity, this means that larger banks are on average more efficient. Positive and statistically significant coefficients on LTD suggest that banks with a higher ability to transform deposits into loans (i.e., that maintain a high ratio of loans to total deposits) would have more TFP gains than their counterparts. This finding is reasonable because a higher ratio of loans to deposits means that inputs are utilized more productively; ROE is positively and statistically significant coefficients related to TFP change. This finding is reasonable because the higher the ROE for a given set of inputs, the more productive the banks are. The coefficients for NIETA are positive and statistically insignificant indicating that this variable does not have any influence on the productivity growth of the Egyptian banks. Negative and statistically insignificant coefficients on NIM suggest that there are no effects of this variable on the productivity of the banks in Egypt. The coefficients of financial crisis are negative but statistically insignificant, implying that these variables do not have any influence on the productivity growth of banks in Egypt.
Results of the Second Stage Regression
2. Asymptotic standard errors in parentheses.
Conclusion and Managerial Implications
This article has used DEA model to estimate input-oriented Malmquist indices to examine TFP changes in the Egyptian banking sector during the entire deregulation period and the period of several crisis in Egypt, 1997–2013. The TFP changes were decomposed into the product of technological change and technical efficiency change (catch up). The technical efficiency change is further decomposed into product of pure technical efficiency change and scale efficiency change. To the best of our knowledge, this is the first attempt to examine TFP changes in the domestic and foreign banks in Egypt during the entire deregulation period, not encompassed in the earlier studies.
The results reveal that over the sample period for the Egyptian banking sector as a whole show a productivity regress of 0.9 per cent per year, which is largely due to the technological decline. The productivity change among the domestic banks is less than the foreign banks. However, both had productivity regress.
Over the entire sample period, the estimates of TFP for all banks indicates that the TFP growth declined at the rate of 0.18 per cent per annum, the reason may be due to factors affecting the banking productivity as a whole. First, the Egyptian economy faced a serious currency liquidity crisis in 1999 prior to bank privatization. This crisis affected the performance of Egyptian banking sector due to the recessionary economic environment. Second, at the end of 2002, the CBE raised the minimum capital adequacy ratio from 8 per cent to 10 per cent, which created a problem for undercapitalized banks that have to raise their capital or merge with another capitalized bank. Third, in the early 2003, the Egyptian government decided to float the Egyptian pound against the US$ which increased the banks’ foreign exchange losses, particularly, those that have significant proportion of their investment portfolio in foreign currency. Four, the global financial crises and the Egyptian revolution affected the productivity growth of Egyptian banks negatively, which seriously affected the Egyptian economy.
The estimated regression model identifies some variables which significantly influence the productivity of banks in Egypt. The banks with higher loans to deposit ratio and higher returns on equity have higher productivity growth reflecting on their strong strategic and managerial skills. The size of bank seems to be associated with an increase in productivity. The maturity of a bank (measured by age) is associated with higher productivity. The NIM and NIETA variables do not seem to be affecting the productivity of banks. Surprisingly, our results reveal that the financial crisis did not have significantly adverse impact on the productivity of Egyptian banks.
Footnotes
Acknowledgements
The authors are grateful to the anonymous referees of the journal for their extremely useful suggestions to improve the quality of this article. Usual disclaimers apply.
Structure of the Egyptian Banking system as at 31 December 1999 (LE Million;US$ = 3.4 at 31 December 1999)
| Banks | No | Number of Branches | Assets | Total Deposits | Total Loans | Market Share |
| Commercial banks | 28 | 1220 | 290983 | 208186 | 166157 | 78.6% |
| Public sector banks | 4 | 908 | ||||
| Private & joint venture banks | 24 | 312 | ||||
| Business and investment banks | 31 | 140 | 51710 | 27854 | 23866 | 13.9% |
| Private & joint venture banks | 11 | 98 | ||||
| Foreign banks | 20 | 42 | ||||
| Specialized banks | 4 | 1026 | 27339 | 10887 | 22862 | 7.5% |
| Industrial banks | 1 | 14 | ||||
| Real estate banks | 2 | 23 | ||||
| Agriculture banks | 1 | 989 | ||||
| Total | 63 | 2386 | 370032 | 246927 | 212885 | 100% |