



Abstract
Focusing on the US, Japan, Germany and China—four large economies that make up almost half of the world’s GDP—this article analyses each of their growth stories independently and comparatively. None of these economies were doing well by historical measures, years after the financial crisis of 2008. The article addresses possible reasons for this slow growth, and which country might lead growth into the future. The results of our review suggest that rapid growth is not likely to return to most parts of the world. Similar growth trends are apparent across our four economies despite clear differences in institutions and circumstances. The 2008 financial shock was a turning point in terms of how these economies function, but we see long-term trends that began before the crisis. Of the four economies, China is likely to increasingly become a key determinant of global growth—at least until its aging demographics kick in.
Introduction
Recent global economic trends have been worrisome, especially for the four large economies that are responsible for just under half of world GDP production in 2015 (World Bank, n.d.a.). In this article, we investigate the economic situation for the US, Japan, Germany and China within a macroeconomic framework. We focus on the current situation with a short-run horizon, but draw evidence from their long-run growth records and processes. The results provide a basis for thinking through what these four key countries might do to overcome their current difficulties, in addition to gaining insights into which countries could be the next leaders of growth.
There are other challenges to the world economy as well: (a) changing weather patterns are altering coastlines, undercutting the basis for former comparative advantages, and causing expensive destruction and mitigation strategies; (b) increasing inequalities of gender, income and race in many countries are creating political challenges as well as undermining formerly accepted institutions and policies; (c) environmental decay, contagious diseases and significant water shortages have created more problems that spill across borders; and lastly, but most importantly, (d) terrorist activities are spreading in the world with destructive weapons on both sides.
The global economy, therefore, faces tremendous challenges. One positive factor is the ability of the private sector historically to respond to such challenges. This positive response has been accomplished with innovation of new technology that not only produced goods and services more cheaply but also created better living conditions. The improvements in the last 50 years have been remarkable indeed. Maintaining the incentives and conditions that will continue to promote these types of solutions will be critical to our future. The results of our review, however, suggest that rapid growth is not likely to return to most parts of the world. The trends are apparent across our four economies, despite clear differences between them in terms of policy, history, external shocks and institutions. China, although slowing, is growing faster than the others and will continue to do so for a while. However, declining shares of the working age population are expected to affect China very seriously and fairly soon.
The trends of low growth, slowing productivity and, most recently, falling trade pose a challenge to policymakers. One question is to what extent the challenges are cyclical or structural. Our analysis points to structural, primarily. One possible cyclical factor is lack of confidence that may be behind low investment rates. Here too, however, we see falling investment over the long term and not as a new phenomenon. A second question is whether the 2008 financial shock is a real turning point in terms of how these economies will function going forward. While we see long-term trends that are evident before as well as after 2008, the verdict is still out on whether a major global structural change has occurred.
After discussing the literature, objectives and methodology, the following four sections will point out significant aspects of economic change and challenges for the individual countries. In the next section, we look comparatively at long-term economic trends. The last section concludes with a discussion of what country is likely to lead future growth.
Background Literature, Objectives and Methodology
This study relates to two bodies of literature focusing on economic growth. The first is work on business cycles, and especially those that consider serious downturns and recoveries. The 2008 financial crisis in the US has naturally generated renewed interest in these questions. Although the official bottom of the crisis has been established as June 2009 by the National Bureau of Economic Research (n.d.), recovery to historical growth rates has taken much longer. The interconnections between economies have also meant that cycles in individual economies can be affected by, or can instigate instability in, others (Fernandez, Schmitt-Grohé, & Uribe, 2016). Global contagion can also reach deep into economies affecting, for example, small- and medium-size enterprises (Chowdhury, 2011).
The second body of literature that is relevant here is the distinction between structural and cyclical factors in growth, or in other words, the effects of long-run versus short-run factors. These questions have also received renewed attention since 2008 because the recovery has been relatively sluggish. The framework of ‘secular stagnation’, for example, attempts to explain the lack of response to monetary policy (Blecker, 2016; Karabell, 2016; Summers, 2014, 2015, 2016). New studies on trade and on the US economy find that both short- and long-run factors matter, but that structural factors seem to be rising in importance, and began before the 2008 crisis (Constantinescu, Mattoo, & Ruta, 2015; Keightley, Labonte, & Stupak, 2016).
This study adds to both of these literatures by taking a comparative approach across four major economies, and by looking at both short- and long-run data. We use descriptive data in our analysis applied to a macroeconomic framework. Our goal is to better understand why growth is slow across these economies, and what could turn this around.
Country Case Analysis
The US: Low Expectations and Growing National Debt
The US has not been the same country since the terrorist attack of 9/11 in 2001. The World Trade Center Twin Towers by themselves were worth roughly US$100 billion, and the businesses linked to them worth an estimated US$200 billion. The value of lives as well as property damage and lost production of goods and services exceeded US$100 billion. When the loss in stock market wealth—the market’s estimate arising from expectations of lower corporate profits and higher discount rates for economic volatility—is included, the price tag approaches US$2 trillion (IAGS, n.d.). The attack also hurt business and consumer confidence, and started the Iraq war that resulted in heavy war and recovery expenses. The economic slowdown in 2001 began immediately. Overall growth in that year was 3.3 per cent, falling from 6.5 per cent in 2000. Third quarter growth was quickly brought down to zero, with fourth quarter recovering to only 2.3 per cent (BEA, n.d.).
As part of the economic recovery from that crisis, there was tremendous activity in the financial assets markets (Dolan, 2013). The continuous lowering of the interest rate from 9 per cent in 2001 to 4.5 per cent by 2005 was the result of expansionary monetary policy, which was coupled with easy credit availability and incentives for financial institutions (FIs) to carry out investment activities via the Financial Services Modernization Act of 1999, or Gramm–Leach–Bliley Act, FIs were allowed to expand into investment activities. To generate the additional revenue to carry on these activities, FIs competed with each other to give loans to the public. Moreover, they came up with new financial instruments such as mortgage-backed securities (MBS), derivatives and subprime loans to attract more borrowers. Unethical, illegal and outright unhealthy competition underlay the housing and stock market bubbles, ending in a dangerous climax in 2008. By September 2008, the financial crisis had put the whole financial market under the dark cloud of bankruptcy, and some big financial investment firms, such as Smith Barney, declared bankruptcy shocking markets further.
The response to the 2008 financial crisis via monetary and fiscal policy was to become even more expansionary. The Troubled Asset Relief Program (TARP) that was hurriedly passed by the Congress, and signed by President Bush in 2008, increased government expenditure by US$650 billion in one bill and in one day. This move created a special loan programme to help struggling big banks such as Citibank and Bank of America, and allowed some private enterprises such as Ford and Chrysler to stay afloat. A second big increase in government expenditure via the stimulus package, called the American Recovery and Reinvestment Act (ARRA), was implemented in March 2009, approving another round of government expenditure of roughly US$630 billion. Still much uncertainty prevailed in the banking system. Therefore, in 2010, the US banking system, and FIs in particular, were further regulated heavily by the Dodd–Frank Wall Street Reform and Consumer Protection Act. Hence, the response of policymakers was to be expansionary and, at the same time, regulatory at an unprecedented level (Dolan, 2013).
The other response to the crisis was via monetary policy. The Federal Reserve kept the interest rate (discount rate that is charged by the Federal Reserve Banks for their loans to the FIs) at 0.25 per cent, yielding almost a free supply of loans to the FIs. This reduced interest rate was thought to be insufficient. In 2009 and 2011, a new programme called quantitative easing (QE1 and QE2) was adopted that increased the treasury bonds buying by several hundred billion. In fact, the idea of continuous purchase of treasury bonds (roughly US$80 billion per month) was started in 2013 (some economists called it QE3), and it was tapered off after much controversy only in late 2015 (Dolan, 2013).
As can be seen in Table 1, M1 money supply more than doubled in the eight years from 2008 (US$1,371 billion) to 2015 (US$2,931 billion). What is remarkable (and somewhat surprising to monetarists and conservatives) is that this tremendous increase in the money supply has not been inflationary. Table 1 further shows the highest inflation level in this period was 3.82 per cent (measured by CPI in 2008) and the lowest being negative. Despite (or because of) these expansionary policy attempts, the unemployment rate in the US has declined from 9.6 per cent in 2010 to 6.2 per cent in 2014. As of October 2016, the rate had fallen to 4.9 per cent (BLS, n.d.). Policymakers could pat themselves on their back for this amazing and somewhat confusing economic performance, except for the fact that this economic recovery has given only a small boost to real GDP.
As a result of expansionary government spending, the US national debt has increased substantially. In 2007, just before the crisis, the national debt stood at US$9 trillion, but by 2015, it had doubled to US$18 trillion. In October 2016, it had reached US$19.7 trillion, according to the independent organization US Debt Clock.org. Conservative economists argue that these policy steps have created the possibility of higher interest rates and inflation in the future. Moreover, there is less incentive for the private sector to invest, if interest rates go up and budget deficits stay high. There is, therefore, a big question of how to repay the national debt that is also now accompanied by student loan debt (of US$1 trillion in 2015) and consumer loans (roughly US$1 trillion in 2015). One of the key questions facing the future of the US economy is how and when these debts be repaid. This has created additional uncertainty. The trends in the political sphere are not very encouraging either with the election of Donald Trump as president causing uncertainty across the business environment in addition to policy suggestions that would increase the US budget deficit and debt. The business sector in general, therefore, is adopting a ‘wait and watch’ approach leading to a slower rate of investment, innovation and technological transformation. Wide fluctuations in policy as well as economic performance are expected in near future.
Japan: Slow Growth for Over Two Decades
Japan’s growth was driven by post-war industrialization. In 2014, industrial output constituted 27 per cent of GDP, concentrated in the production of vehicles, vehicle parts, machine tools, ships, textiles, processed foods and electronic equipment. While the Japanese manufacturing miracle of the 1970s and 1980s is well known, the largest contribution to GDP, 72 per cent, is in the service sector, concentrated in banking, insurance, retailing, transportation and telecommunication. With capitalization worth US$3.3 trillion, the Japanese stock Market (Nikkei) is the third largest in the world; it hosts 326 companies of the Forbes Global 2000 (OECD, 2014). Agriculture contributes less than 2 per cent of GDP, but based on per hectare output, Japan leads the world in agricultural productivity.
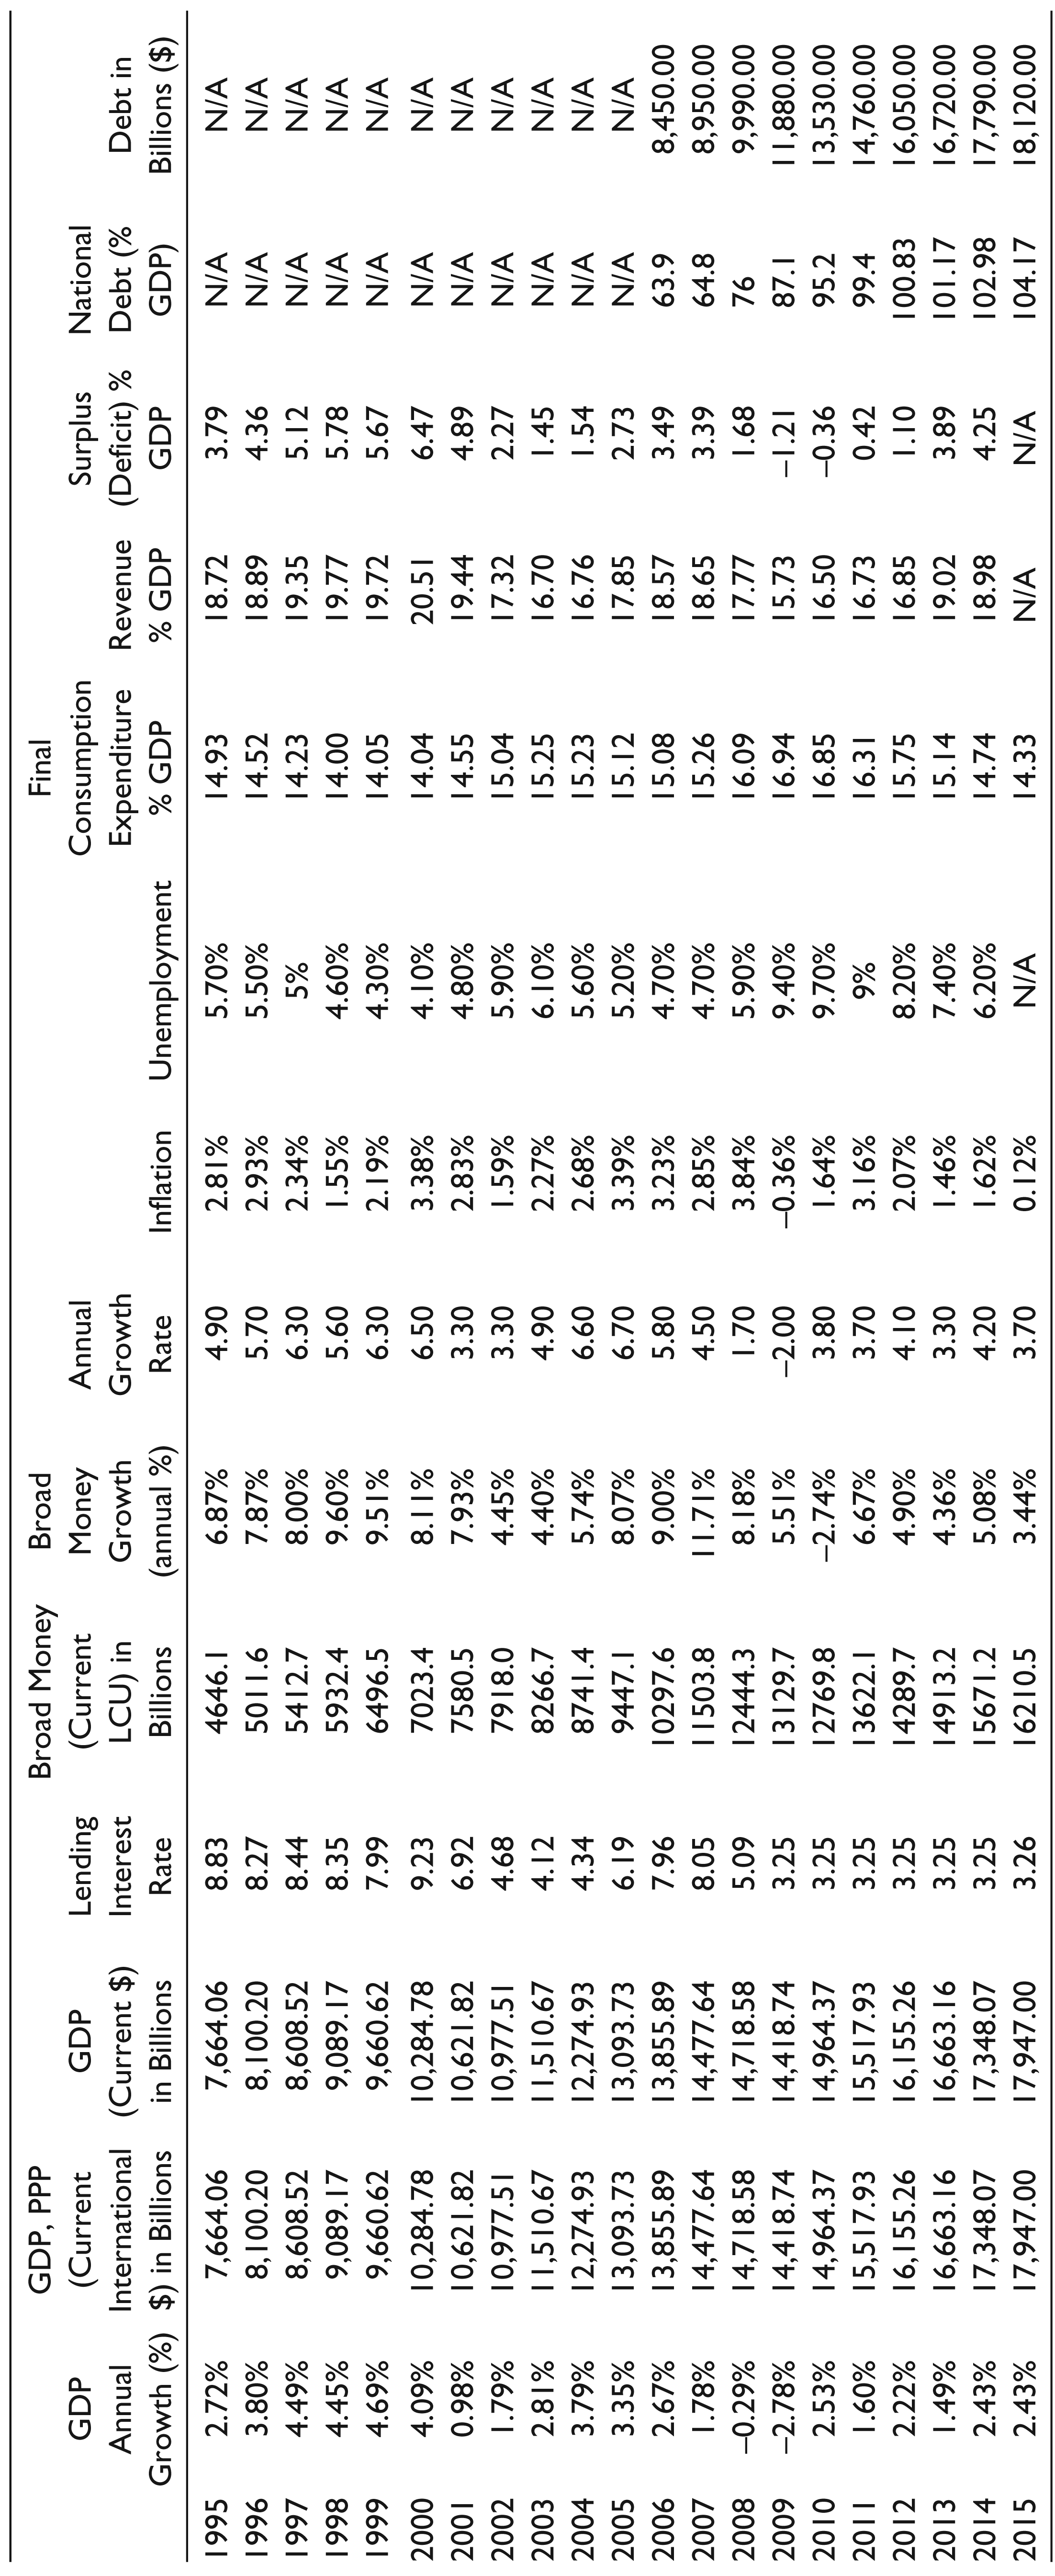
Japan’s growth has been surprisingly low over the last two and half decades, given that it is one of the high-tech, advanced economies of the world (Table 2). As can be seen in Figure 1, since the peak of US$6,203 billion in 2012, GDP has fallen to US$4,383 billion in 2015, representing a drastic 30 per cent decline in 4 years in dollar terms. While some of this decline can be attributed to the increased value of the US dollar relative to the Japanese yen, it is clear that there is a major slowdown of the Japanese economy.
U.S. Macroeconomic Performance: 1995–2015
Japan Macroeconomic Performance: 1995–2015


Japan has always been challenged by geography. Seventy per cent of the land is forested and unsuitable for agricultural, industrial or residential uses. This forces high population density in the other parts of the country. Moreover, the lack of agricultural production means the country imports 60 per cent of grains, meat, fuels and chemicals as well as some textiles and raw materials (OECD, 2014).
By developing human capital, the country compensated for the lack of other resources; however, the composition of the Japanese labour force and the overall population growth, creating more aging population, have increasingly become a challenge. Out of 130 million people in Japan, 65 million form the labour force and population growth is negative, creating a growing percentage of elderly individuals. In 2015, people of age 65 and older as a share of the labour force was 47 per cent, and this is estimated to rise to 77 per cent by 2050 (OECD, 2016). This is the highest percentage anywhere in the world. With an unemployment rate of 3.4 per cent in 2015, the per capita income has declined to US$32,484 as compared with US$46,440 in 2011 (Amadeo, 2016, p. 2).
A striking phenomenon in the Japanese labour market is the low rate of female labour force participation, especially after getting married. The OECD Survey (2014) reports that only 38 per cent of women in the Japanese labour force go back to work after getting married. Moreover, there is a wage gap of roughly 27 per cent between men and women for the same profession. Further, the retirement age for Japanese workers is low at only 60 years. There is also no incentive, and some constraints, for foreigners to work in Japan. Only about 2 per cent of the total labour force is from abroad.
Another element of concern, also mentioned in the OECD Survey (2014), is the weak links between academic research and business entrepreneurship. The rate of innovation and technology improvement has declined. The role of the government sector in research and development activities has increased without much positive effect. In fact, the Japanese economy has slowed down in part due to the mismanagement of the public sector. As can be seen in Figure 2, Japan’s debt far exceeds that of the other three countries analysed in this study, with debt reaching 230 per cent of GDP in 2015. This is a result of a continuous deterioration in debt servicing as the debt rises faster than re-payments, as well as a sign of mismanaged fiscal budgets. Even if 90 per cent of the Japanese debt is domestically held, this increasing debt to GDP ratio is a concern. Reduction in this ratio is possible only when economic growth starts picking up and tax revenues increase. As many economic crises have indicated, increasing government debt is unsustainable.

The recent rash of natural calamities since 2011 have added to Japan’s economic difficulties, including the 100-foot tsunami, the Fukushima nuclear power radiation leak and the 9.0 magnitude earthquake. The Great East Japan Earthquake is considered the worst natural disaster in the post-war period. It resulted in a 5 per cent loss of GDP and put further pressure on government finances. Further, the tsunami of 2011 was estimated to cost US$300 billion. The ‘triple disasters’ devastated Japan’s economy by destroying 138,000 buildings and costing US$360 billion in economic damage. This is more than the US$250 billion cost estimate for Hurricane Katrina. The quake hit Japan’s northeast section, responsible for 6–8 per cent of the country’s total production (Amadeo, 2016).
Another challenge for Japanese policymakers has been deflation. Consumer confidence and purchasing power of the Japanese yen have been on decline. As the OECD survey mentions, ‘Deflation is responsible for declining nominal GDP, thereby boosting the government debt ratio and threatening the fiscal sustainability’ (2014). This has put the Japanese government in a difficult dilemma. The only benefit of the declining value of the yen has been the strong performance of exports to the world. The Trans-Pacific Partnership (TPP), if it had been approved by the major trading partners of Japan, would have provided a stimulant for the economy.
Policy changes initiated by Prime Minister Shinzo Abe have attempted to pull Japan out of this malaise (McBride & Xu, 2013). In 2013, he introduced a three-pronged attack on three economic troubles (sometimes called Abenomics). It consisted of monetary policy easing, a flexible but an adventurous fiscal policy and expenditure on structural reforms. In 2013, the results of this ‘three arrow’ attack were positive, as Japanese GDP increased by a substantial margin. However, the overall effect of ‘Abenomics’ has not been very effective (Lyons & Inada, 2017). This is primarily because deflation has become entrenched, so that consumer expenditure remains low and private domestic investment is still very meagre. So, despite very low interest rates, the private sector does not have great expectations that the economy will recover soon, resulting in a self-fulfilled prophecy.
The Saga of the Liquidity Trap
There has been much discussion and debate about the existence of a liquidity trap in Japan (see, e.g., Ip, 2002; Krugman, 1998) and for the last 8–10 years in the US (e.g., Eggertsson & Krugman, 2011; Pollin, 2012; Reynolds, 2009). In the old Keynesian framework, a liquidity trap takes place at extremely low interest rates, and since increases in the money supply cannot bring down interest rates any further, it no longer has the power to raise investment and real GDP. This is the famous explanation for the ineffectiveness of monetary policy in the Keynesian model (Kulkarni, 2014). In the case of a liquidity trap, therefore, the so-called ‘Keynesian chain’ of monetary policy effectiveness breaks down, and as Keynes put it in 1936, in the case of a liquidity trap, ‘money does not matter’.
From 2006 onwards, comparable events were happening in the US and Japan. As mentioned, interest rates have been kept very low in the US since 2008. The attempts of QE in 2009, 2011 and 2013 onwards have not brought about significant increases in private domestic gross investment, and the real GDP is increasing at a low pace. So, some signs of a Keynesian liquidity trap can be observed in the US after 2008.
Based on data from the Global Economic Monitor (2016) and Table 2, in Japan with unemployment rate of 3.7 per cent in 2014, which has steadily decreased from the five years earlier, but with inflation at only 2.75 per cent in 2014 and 0.79 per cent in 2015, there is a little doubt that increases in the money supply have not done much to affect prices. Further, the inflation rate was negative in 2010, 2011 and 2012 (averaging about 0.2 per cent over these three years). This was also reflected in interest rates: from 2006 to 2014, the Japanese lending interest rates have been well under 2 per cent, reaching about 1.9 per cent in 2007 and 2008, but declining to closer to 1 per cent by 2013 and 2014. Interest rates on deposits have been even less than that: reaching to 0.7 per cent in 2006 and 2007, but declining further to 0.5 per cent and staying there until 2014. While the US inflation rate has been low, the Japanese inflation rate has been even lower. With the ‘peak’ of 2.5 per cent inflation rate in 2014, Japan struggled to keep it above 1 per cent in 2015 and 2016. The goal of the Bank of Japan is to increase the inflation rate to 2 per cent by 2018. Hence, there are severe challenges for monetary policy in Japan and the US, and despite higher growth rates, Germany and China have some surprisingly similar trends.
Germany: Recovery Results in Higher Trade Surpluses
Germany is considered the powerhouse economy in Europe. In addition to being the largest economy, growth has been high relative to others in the EU, and the country’s fiscal position is strong due to balanced budget policies (see Table 3). Interest rates are determined by the European Central Bank (ECB), and therefore have been low and falling as the ECB tries to forestall deflation across the Eurozone. Some analysts believe the ECB policies are making some positive difference, albeit not quickly or robustly (Wolf, 2016).
Germany Macroeconomic Performance: 1995–2015
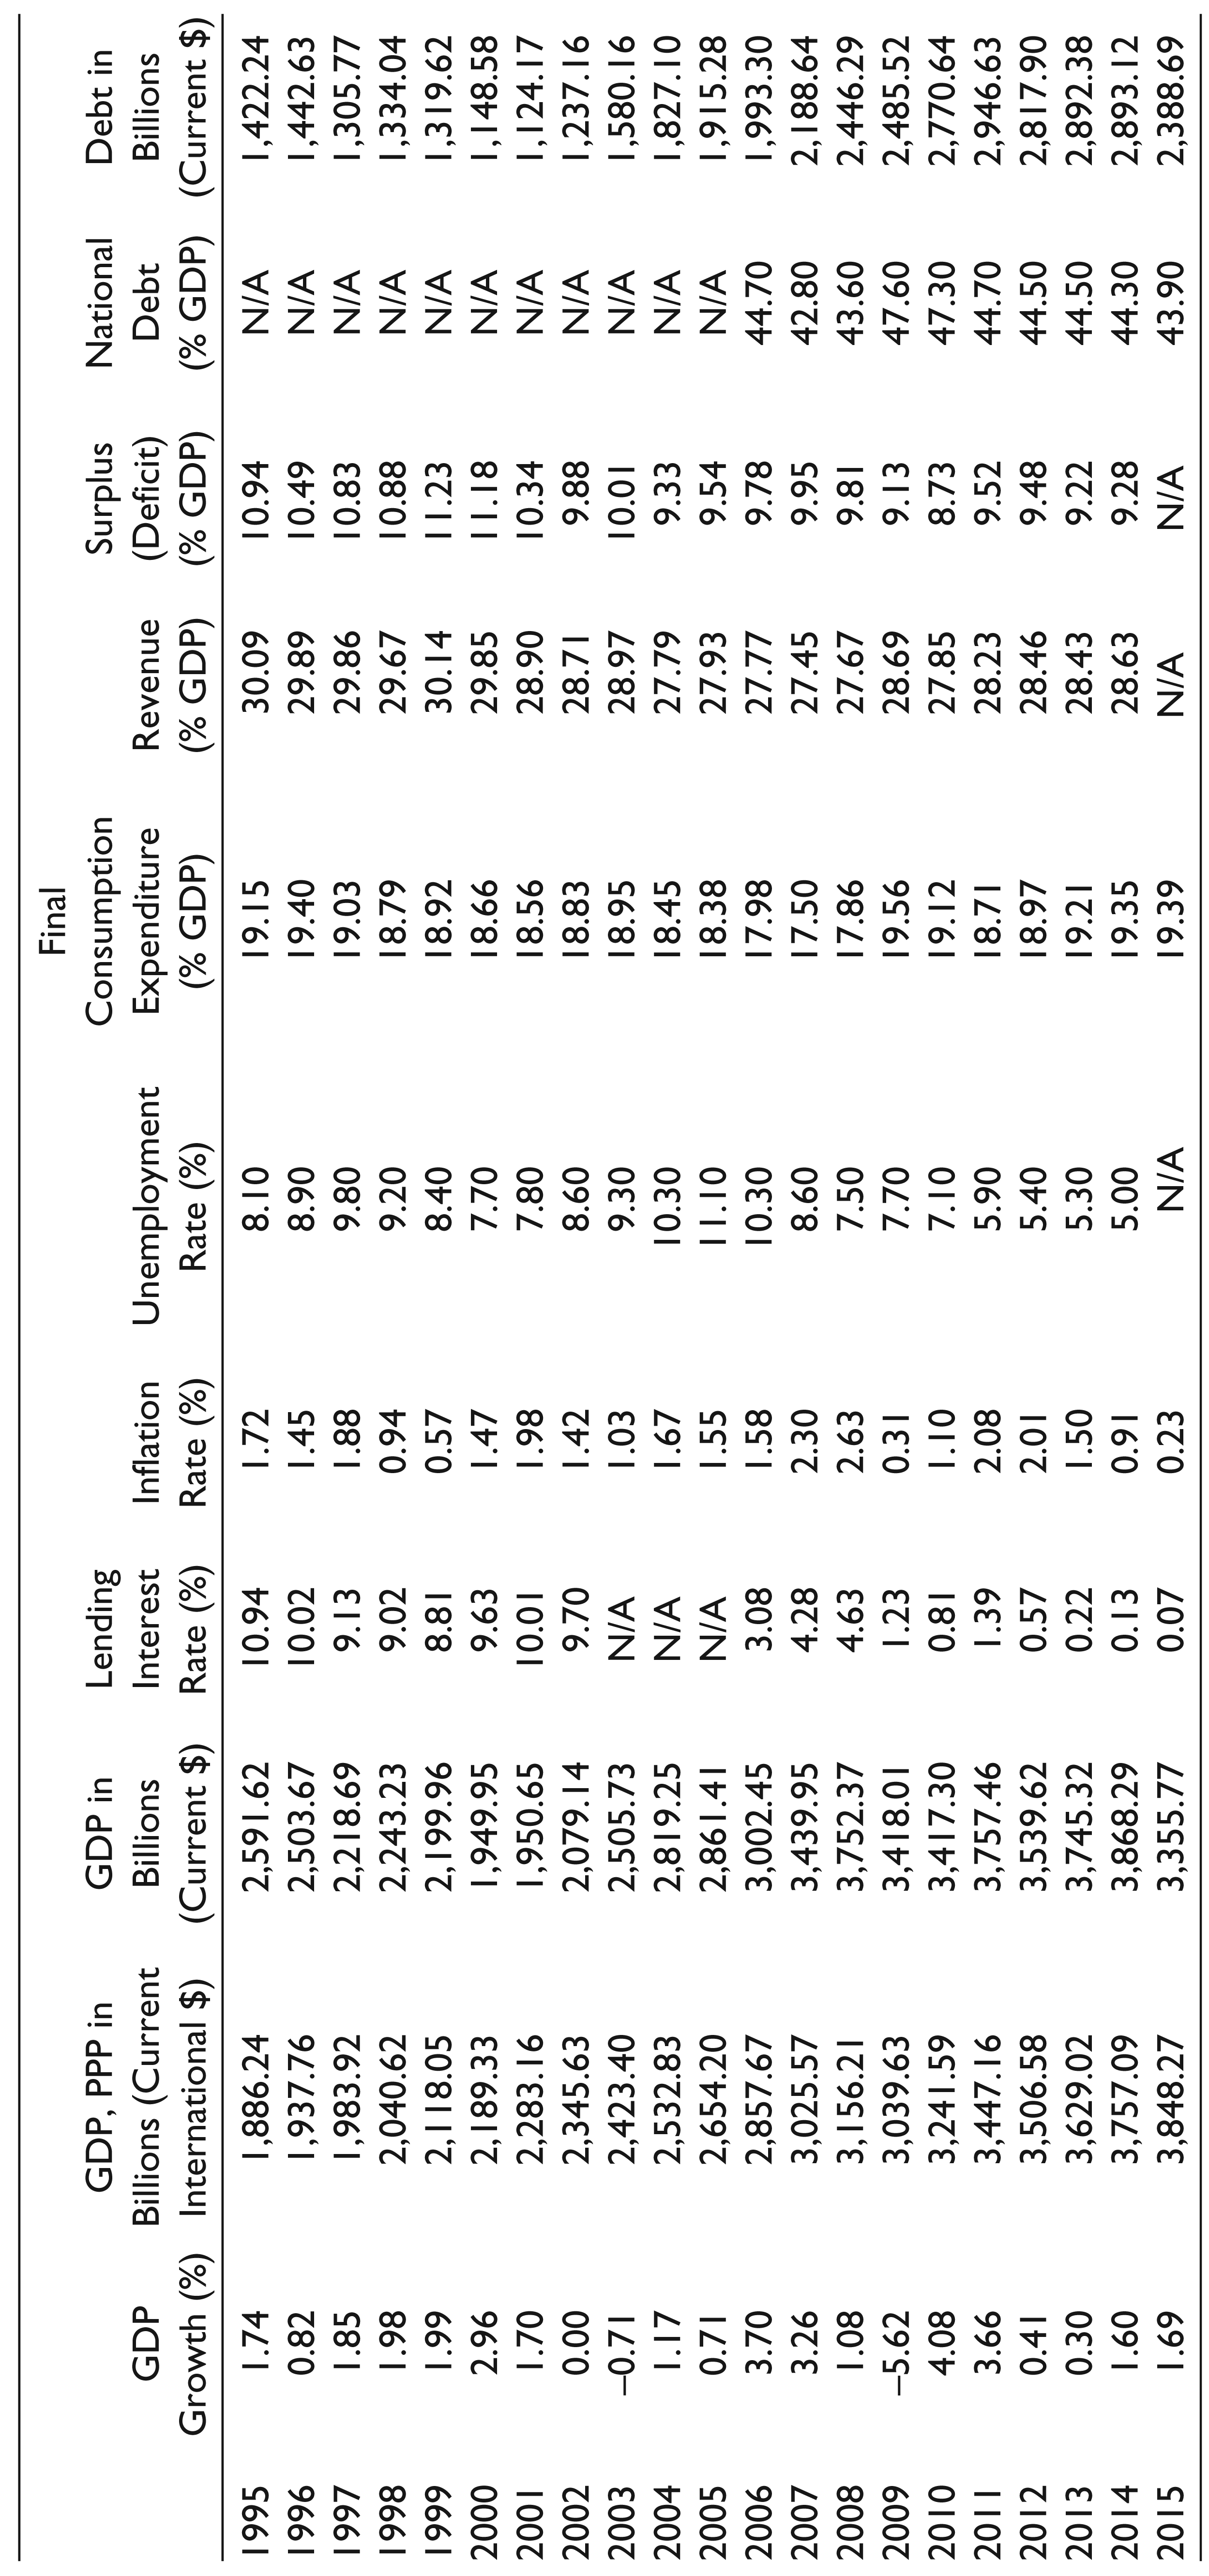
Policymakers in Germany, however, do not welcome low or negative rates (Chazan, 2016), in part because Germany’s economic structure is different from the other EU countries with its high savings coupled with high exports. Low rates do not reward savers, and do not matter to government spending since the country maintains a balanced budget. Germany also depends relatively more on external demand than its neighbours—or as compared with the US or Japan. Germany has run a trade surplus for many years, and is currently very high, reaching over 7 per cent of GDP in 2015, based on World Bank data. The trade surplus continued to climb to 9 per cent by early 2017 (The Economist, 2017). Trade surpluses have been the norm for Germany, but especially large surpluses began in the early 2000s. Looking forward, with exports already at 47 per cent of GDP, increasing them to promote growth is not likely. In addition, demand for its exports across the globe has been falling, both due to cyclical downturns and more long-term shifts in demand in China and elsewhere.
Hence, growth in the long run in Germany will depend on shifting away from export dependence (Bornhorst & Mody, 2012). This shift, in turn, will depend on substantial structural change within the economy. Such deep change is never easy to implement. Germany’s turnaround from anaemic growth in the 1990s to a leading global economy is attributed to reforms carried out by Schröder in 2003. ‘Agenda 2010’ involved deregulating the labour market, lowering corporate tax rates and re-structuring unemployment benefits (Zhong, 2012). The German manufacturing sector maintained a comparative advantage and the economy weathered the 2008 crisis and its aftermath fairly well. However, analysts argue that further reforms and public investment are needed, but so far the current government under Merkel has not moved in this direction and by some measures has moved backwards (The Economist, 2014). Once the US President Trump entered office, the pressure on Germany to lower its trade surplus increased (Donahue & Delfs, 2017); however, Germany’s high savings and relatively slow wage growth do not bode well for a turnaround in the external balance any time soon (The Economist, 2017).
Germany is challenged with an aging population. This process is not as far advanced as Japan, but in 2015 it had one of the highest old-age dependency ratios at 35 per cent, which is estimated to rise to 64 per cent by 2050 (OECD, 2016). Measures to lengthen the years people work have been proposed, including raising the retirement age and changing the tax laws as to not penalize retirees from going back to work.
The overwhelming issue currently occupying German attention and resources is the immigrant crisis. Over one million people arrived in 2015 alone (BBC, 2016). To some extent, the immigrants could help alleviate labour force shortages. However, there is a costly process of assimilation, language training and skills matching that needs to happen for the crisis to pay off in positive ways.
Despite the pressure on the government budget to deal with the immigrants, Germany is committed to a balanced budget (Spahn, 2016). As of 2016, debt as a per cent of GDP is about 71 per cent (Trading Economics, n.d.). This is one of the strongest debt positions of the OECD countries, as Germany has lowered its debt substantially since its peak after the financial crisis. There is pressure throughout the EU for Germany to run budget deficits, which would increase the debt but help to lower the trade surplus. Since Germany uses the Euro, their currency will not appreciate in response to the trade surplus. The flipside, however, is that Germany’s trading partners in Europe run trade deficits and are building foreign debt, in addition to domestic debt, as a result (Münchau, 2016). So, while data imply that Germany has a healthy economy, its strength is at the expense of the very trading partners that drive its export demand.
China: Slowly Falling Growth
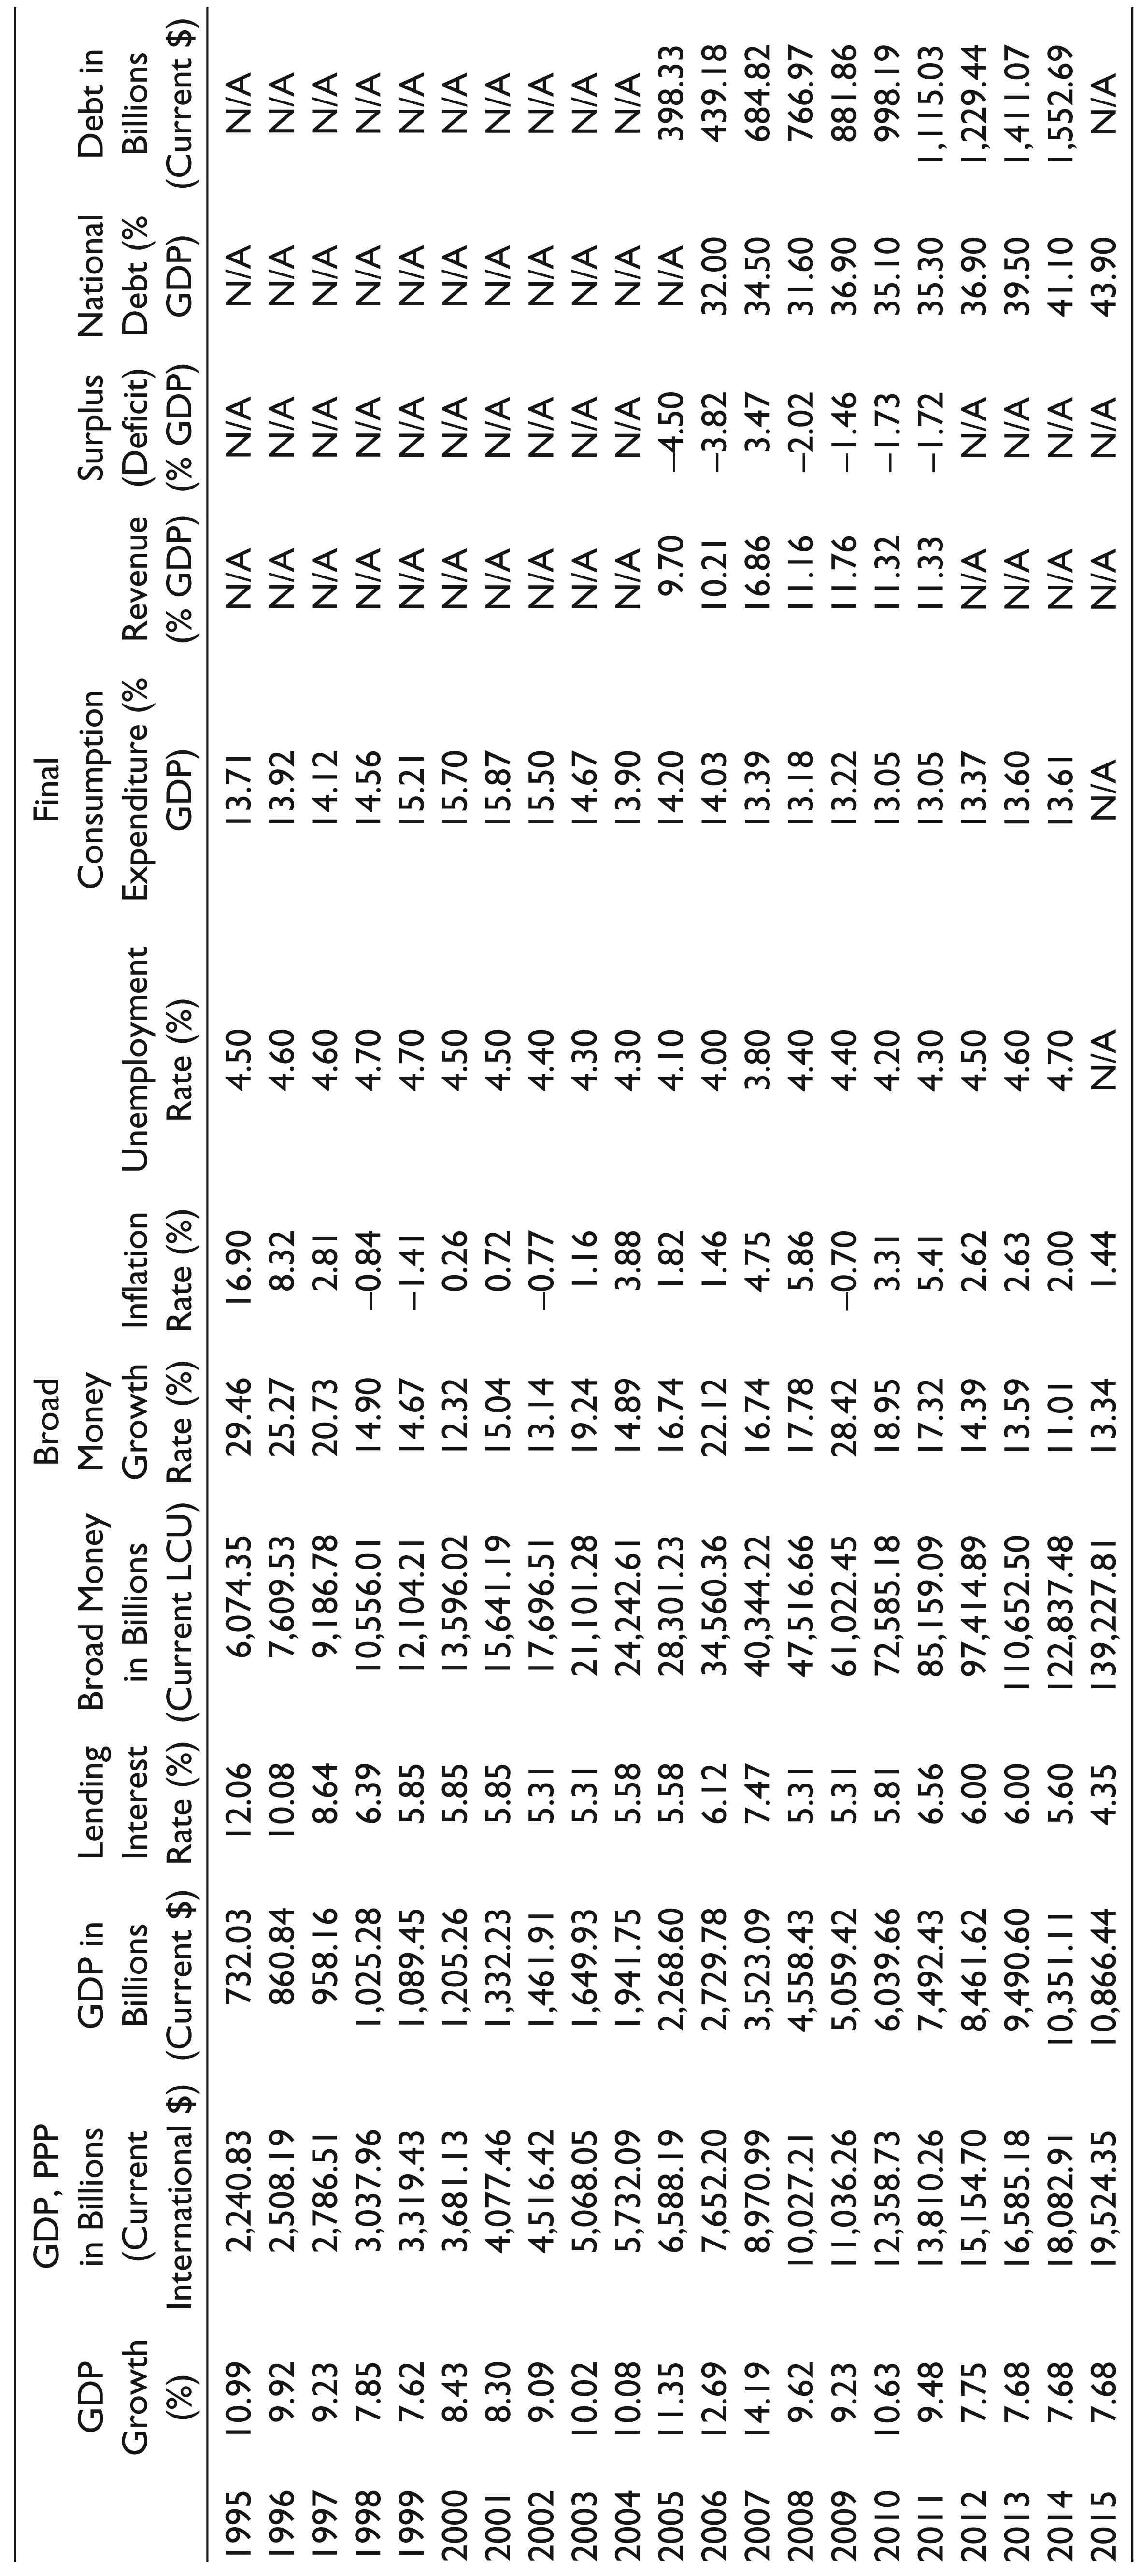
China has been the fastest growing economy for some time now (Morrison, 2015). Its major institutional reforms from planning to markets over the last 40 years created incentives for entrepreneurs to start new businesses that increased competition, leading to lower resource costs, and helped to improve the performance of many stated-owned companies as well. Central and local governments invested heavily in infrastructure of all kinds, upgrading China to a modern capital base. Simultaneously, China’s reforms encouraged foreign firms to invest in China with the dual objectives to export to earn foreign exchange and to upgrade China’s technological capabilities. Foreign direct investment grew and exports followed. FDI reached over 4 per cent of GDP in the late 1990s, with exports reaching 19 per cent of GDP. By the 2000s, China’s export share reached 30 per cent of GDP (World Bank, n.d.a).
The result was rapid growth for many years, averaging 9–11 per cent (Table 4). This growth is now slowing. Figure 3 shows quarterly growth since the first quarter of 2010, revealing a gentle downward trend ever since. This slowing growth—the so-called ‘soft landing’—is not surprising and is in line with government policy to lessen the country’s growth dependence on investment and exports (Prime, 2012a). As in Germany, major structural change is required for this transformation to be successful. Positive signs of progress are evident, such as increasing contributions to growth from retail and other services (Mitchell & Yang, 2016). Other signs are worrisome, such as the fall in private investment (Magnier, 2016).
While maintaining 6–7 per cent growth is the target and is considered by Chinese policymakers the necessary rate to employ the new entrants into the labour force, there is some worry that growth could continue to decline, and even collapse—this is the so-called ‘hard landing’. The central government has hedged its bets by lowering interest rates and encouraging bank lending to corporations, and by increasing its own investment in infrastructure, especially in Western China and in connecting the west to the east coast and to Southeast Asia and Central Asia. These policies seem to be working to some extent, but the high public expenditure behind them may not be sustainable long term.
China’s domestic debt grew quickly since 2008. Central government debt is not very large at 44 per cent of GDP, but when local government and corporate debt is added, estimates suggest the percentage rises to 170. If all credit is considered, according to the Bank of International Settlements, the total is 255 per cent of GDP.
On the positive side, the private sector has gained more traction and is finally getting access to capital via the banking system. R&D, innovation and entrepreneurship are being promoted by the Chinese government at all levels. R&D spending as a percentage of GDP has grown to over 2 per cent by 2014 (World Bank, n.d.a). Many companies are also pursuing technology and learning through investments abroad, which are expected to eventually influence productivity back home.
China’s population is aging quickly. Of the four countries analysed here, in 2015, China’s ratio of people of age 65 or older as a share of the working age population was very low at only 14 per cent. However, by 2050, it is estimated that this ratio will rise to 51 per cent and to 67 per cent 10 years later (OECD, 2016). This is also a concern in the other countries in this study, but for China it may be even more of a challenge since living standards are still far below those of the US, Japan or Germany. There will be large costs in terms of health care and caring for the elderly, in addition to a shrinking labour force. In response to the latter, many companies are investing in robotics and other forms of mechanization.
China’s slower growth is probably here to stay. While this reflects China’s new development stage, it is negatively affecting many markets around the world. For example, commodity-driven economies such as Brazil have seen their growth severely affected as China has cut back on its purchases of agricultural products and minerals. China’s contribution to global growth through imports has been substantially reduced, with little sign that this will reverse. Chinese contribution to global growth through outward foreign investment, on the other hand, is expected to continue to grow.
China Macroeconomic Performance: 1995–2015

The Four Countries’ Big Picture
As the discussion so far makes clear, each of these economies is unique. In addition, China has reached middle-income status by the World Bank’s definition, but is still a developing country by many measures, while the other three are advanced, developed economies. One major difference not yet mentioned is with respect to institutions. Despite substantial changes towards a market economy, China continues to rank far below the other three in terms of freedoms and openness to business and competition. China falls into the ‘not free’ category of the Freedom House (2016) index, while the other three have a ‘free’ ranking. These differences also appear in the Heritage Foundation (2016) Index of Economic Freedom and the World Bank’s (n.d.b) Doing Business rankings, and so span economic and business freedoms as well as political and civil.
Despite these institutional and circumstantial differences, the similarities in economic trends across the four economies are striking.
All four have experienced falling growth, low and falling price levels, and falling unemployment (Figure 4). All have implemented low interest rate policies to try to fend off slowing growth and deflation. All four have had limited success at best with the short-run strategies, except, surprisingly, that unemployment has improved since the crisis.
As a result, the view that monetary policy has run its course is gaining supporters. While there is extensive debate about whether to raise rates, few argue that lowering them more will help. Rates in some countries are negative already, after all.
Simultaneously, there are increasing suggestions that more fiscal spending is needed and is affordable since interest rates are low. While the already high national debt levels create obvious objections to more government spending, increasingly focus is turning to spending for long-term goals rather than short-term stimulus. Long-term challenges are investment, population and, ultimately, productivity.
Table 5 provides a long-run view since 1995 of the growth paths of the four countries. Looking at growth in GDP per capita as a rough measure of productivity, only China looks impressive. The 1990s were good years for the US, but since then productivity growth has slowed down considerably. Germany’s was relatively weak throughout the 20 years, as was Japan’s.

Four Country Comparison of Long-run Trends: 5-year Averages
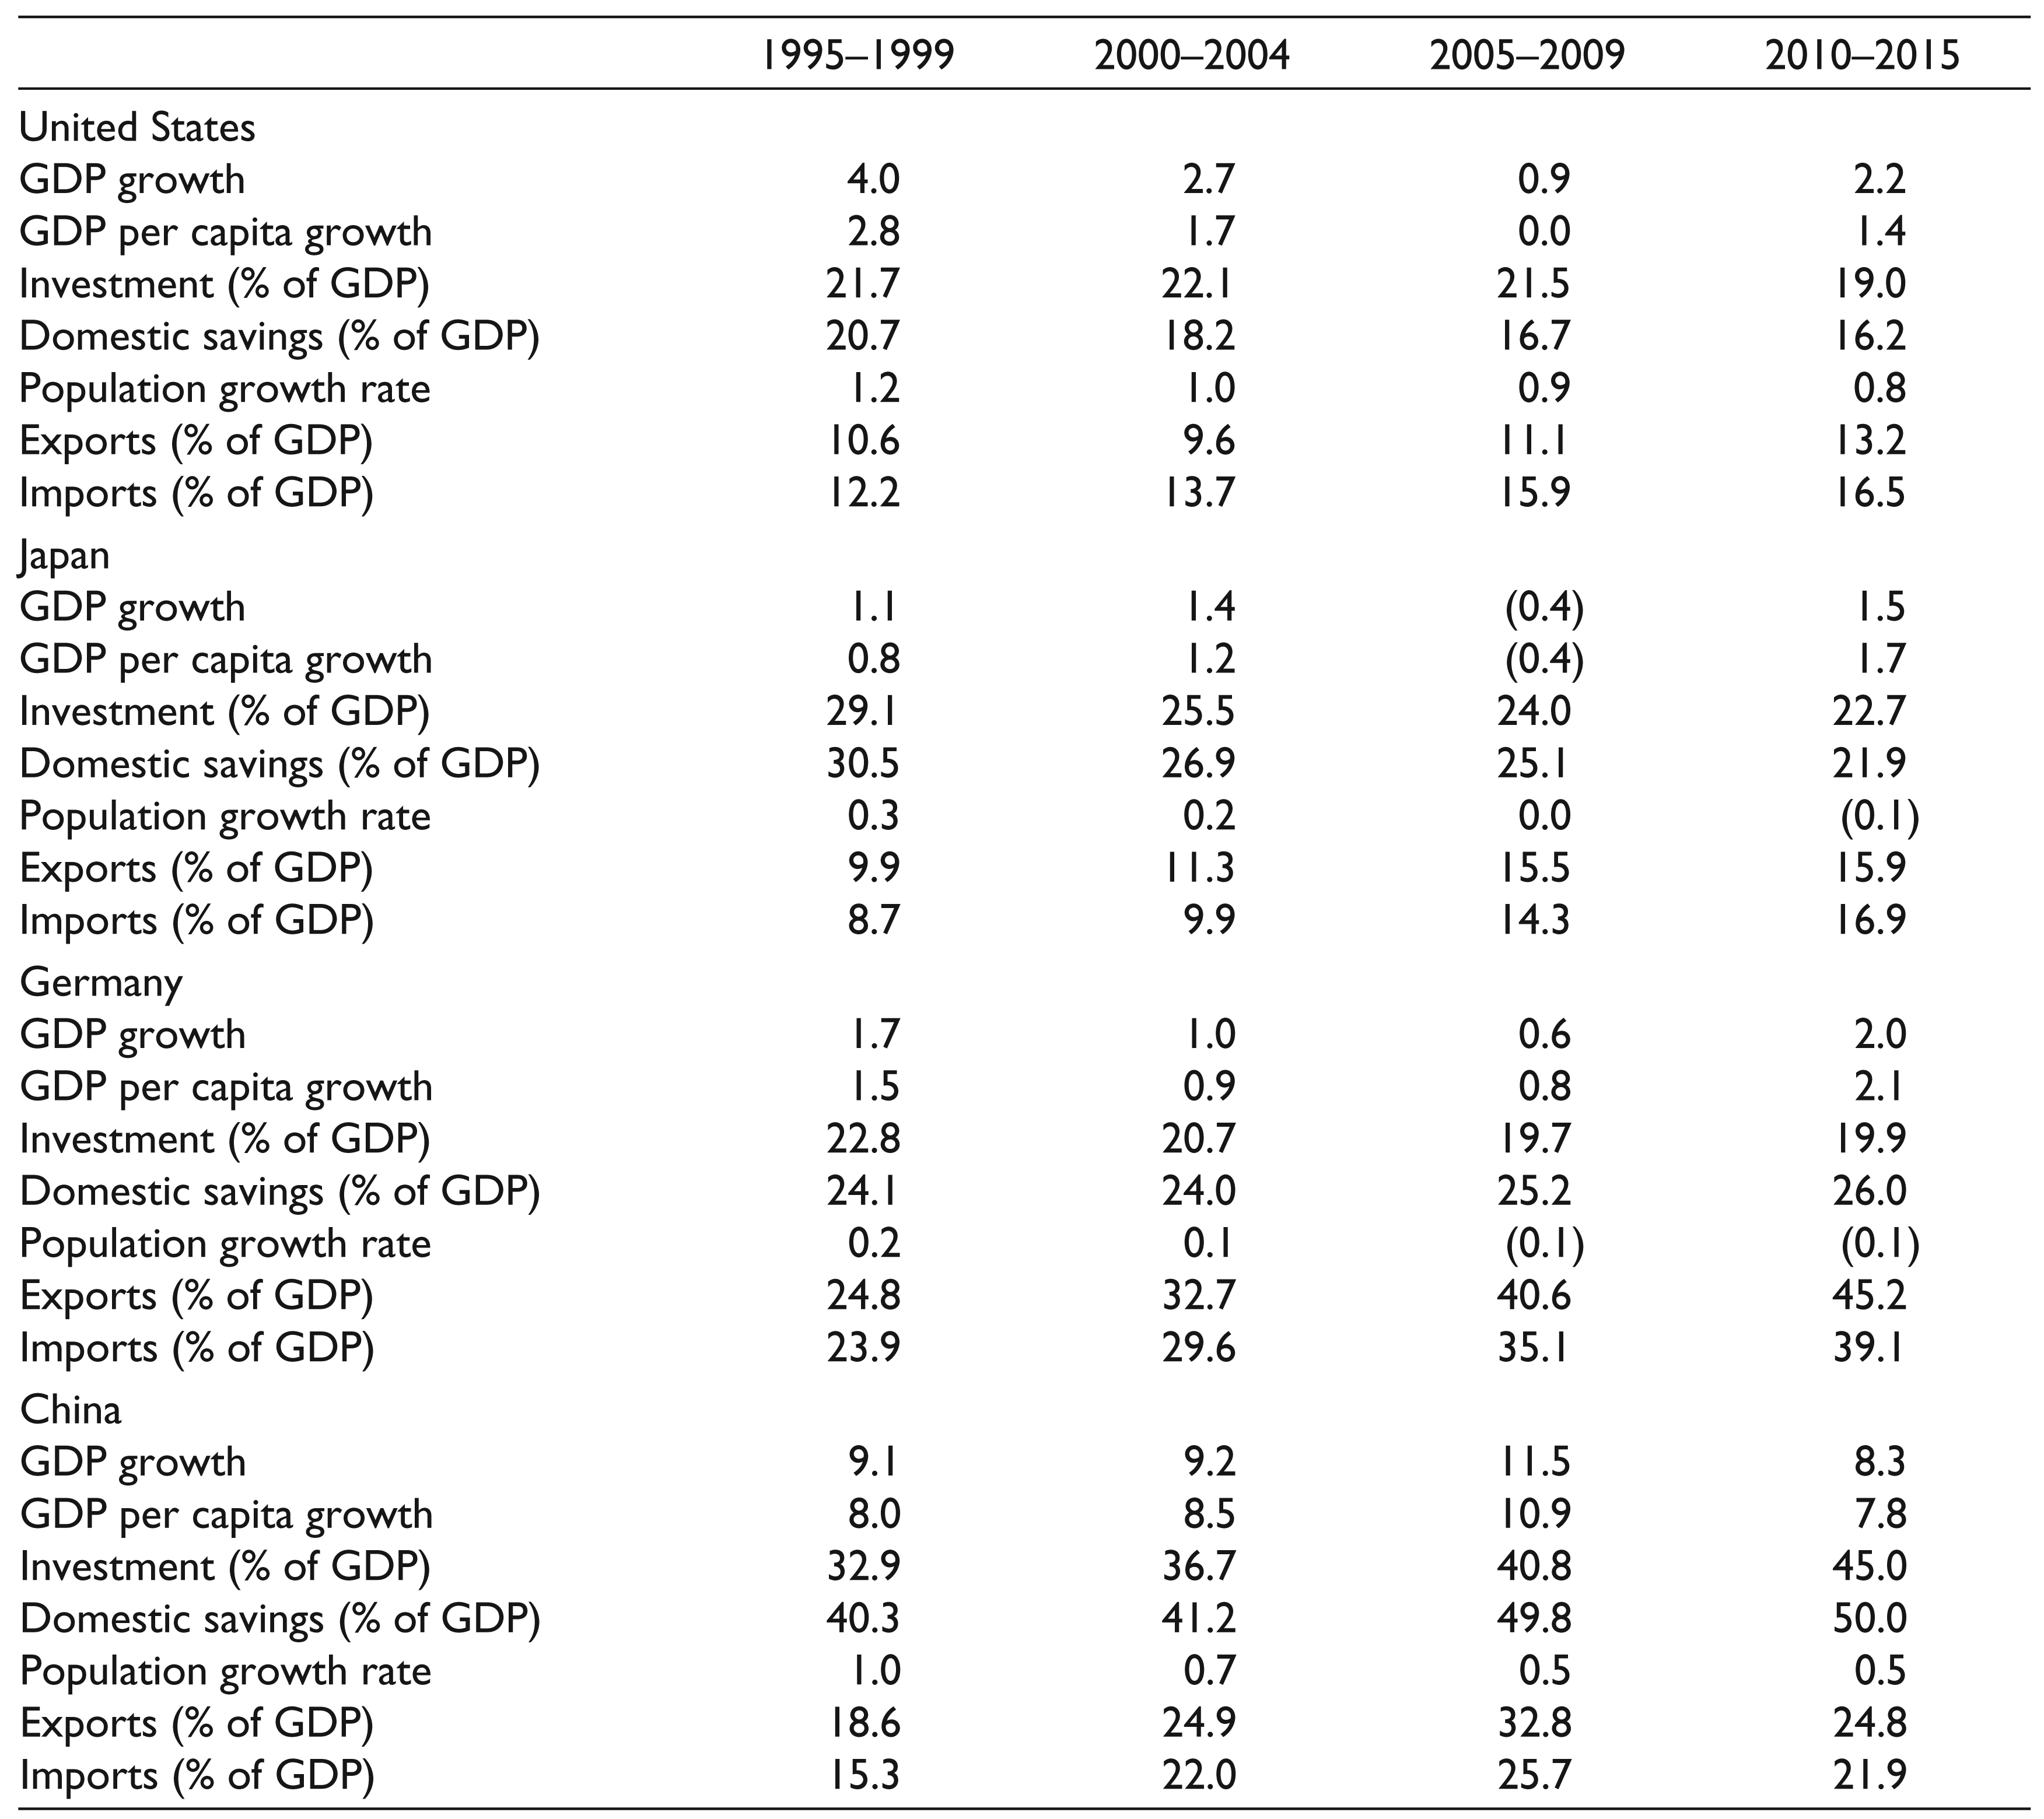
All four countries need rising productivity to keep their growth rates up to historical levels. But productivity increases have become elusive. In the US, productivity growth has fallen over the decades despite a start-up culture led by Silicon Valley. Berlin is a start-up centre, but productivity is also weakening in Germany. Japan has been known for its innovation edge for decades, but as discussed in the section on Japan, innovation has weakened and does not seem to be making enough difference as the country is struggling to keep growth barely positive. China has the highest growth rates still, but the returns to capital are falling. Table 5 shows a rising share of GDP being invested in China—reaching 45 per cent of the economy—but with a corresponding falling growth rate. Supporting growth is requiring higher and higher savings and investment rates. In response, China, in addition to trying to shift the driver of growth to domestic demand, is racing to create an innovative economy to increase productivity and support long-term growth.
Economists have been debating what lessons can be drawn from these trends, and therefore what policies might return growth to levels of earlier decades. There has been a shift towards thinking that more fiscal stimulus is needed, despite the debt levels (Sindreu, 2016). Lawrence Summers (2014, 2015, 2016), using the concept of secular stagnation, posits that there is insufficient demand to bring the economy back to its potential output and is one of the most influential scholars calling for renewed fiscal stimulus.
In a similar vein, Catherine Mann (2016) refers to the current global conditions as a ‘low-growth trap’. She emphasizes the slowing of global trade, especially in the last two years, which is both a result and a cause of weak growth. She argues that monetary policy has reached its limits and is causing financial distortions, and therefore recommends a combination of fiscal spending with structural reform as a way forward. A 2015 IMF working paper analysing trade and income data from 1987 to 2013 also concluded that slowing trade is only partly due to slow growth, and the slowdown in trade began in the 2000s, well before the financial crisis (Constantinescu et al., 2015).
Taking a more long-term view, Marc Levinson (2016), former economics and finance editor of The Economist, argues that the advanced world economies have run out of steam after the post-war reconstruction from 1948 to 1973. In other words, these economies are now growing at their normal rates, which is much slower than their recovery rates. This is consistent with a simple Solow model that predicts economies will grow in a steady state equal to their population growth rates, leaving GDP per capita growth at zero. The only factor that can support higher growth above steady state in the long-term is technological change. The slow population growth in our four economies, along with the low GDP growth rate, is consistent with lack lustre improvements in technology (Table 5).
Modern growth theory extends the traditional factors of production model to explain the mechanisms behind technological change, and by refining the definition of inputs in the production function. Fernald and Jones (2014), focusing on the US economy, note that the majority of growth since the 1950s can be attributed to education and research—or new ideas. These factors have supported an average of almost 2 per cent growth in GDP per capita for a hundred years. Despite the long-term trends, there is no guarantee that this rise in living standards will continue, at least at that rate, since the contribution of these factors is now diminishing. Using an ‘idea’ production function based on Romer (1990), they argue that the share of the population who create ideas—the researchers—and the size of the population (since this will determine the number of researchers) are the two factors that matter in the long run.
With the slowing of population growth and the resulting aging, then, based on Fernald and Jones (2014), we might expect slowing technological change from that factor alone. Another perspective on aging based on work conducted at the US Federal Reserve and reported in the Financial Times (Authers, 2016) is that aging shifts and economic downturns are closely correlated across countries. The data indicate that at the turning point of dependency, that is, when the number of workers per dependent began to fall in Japan, the US and Europe, is when each of those economies suffered a major crisis. In addition, low interest rates may be related to high savings (and lower consumption) due to the number of people getting close to retirement. This underlying, structural characteristic of the four economies studied here could be one reason for the lack of effect of traditional monetary and even fiscal policies. Even if the worker-dependent ratio is not the main cause of crises, it will be a factor in slower growth in the future. Sharma (2016) estimates that 2 per cent growth in the working-age population is needed (but is no guarantee) for economies to grow relatively fast, which is very rare today.
Conclusion and Implications
The main objective of this article is to review the macroeconomic performances in the four major economies of the world—US, Japan, Germany and China— to understand the magnitude of current global economic challenges and to explore suggestions to improve the outlook. For policymakers and managers alike, understanding the growth drivers in the global economy is crucial for decision-making. Our results can be summed up in the rhetorical question: who will lead the future growth of the world economy?
While each country’s historical and institutional situation is different, we find a surprising collection of common trends and challenges. Improved technology is a catch-all solution, but creating an environment to ensure widespread technological progress is illusive. We suggest that policy begin with targeting ways to improve the ‘quality’ of investments in capital and labour. Singapore has one of the best track records in this regard and is a key reason that economy was able to join the club of high-income countries (Maitra, 2016; Prime, 2012b). Targeting the quality of labour and capital will take initiative from both the public and private sectors. Since the private sector seems to be hesitating to invest due to a lack of confidence and low expectations, it may be that the public sector will need to make the first moves.
In terms of which country of the four will lead global growth, the most likely candidate continues to be China. China’s growth is still far faster than the other three economies. China has some major unknowns in terms of whether it can avoid a serious downturn—which would be its first since beginning its reform in the late 1970s—but barring that, it is still the largest economy with the most room to grow. The US is growing more slowly, but by some measures continues to influence the economic well-being of many other countries (Dees & Saint-Guilhem, 2011). Although the US’s role has decreased some, as China and others’ share of the world output have grown, the idea that economies were ‘de-coupling’ from the US has not panned out since the 2008 financial crisis. Dees and Saint-Guilhem (2011) argue that this is partly due to the deep financial and capital links that the US has with the global economy, in addition to the trading relationships. As China continues to develop these new linkages via outward FDI, use of the renminbi for trade, and opening its financial markets to global players, China is likely to increasingly become a key determinant of global growth—at least until its aging demographics kick in.
Except for pockets of relatively fast growth, the outlook is for slower growth in GDP across the globe. China’s leaders refer to this as the ‘new normal’. Policies to help societies adapt to slower growth will be needed—perhaps thinking about maintaining what has been achieved and improving the quality of living within the new, ‘maintenance’ society. Contributions to progress could come from new technology that lowers the costs of living and improves the quality of life for many, as described by Karabell (2016, p. 35), rather than increasing GDP. As he suggests, ‘growth is not the sole pathway to prosperity’.
Footnotes
Acknowledgements
The authors are grateful to the anonymous referees of the journal for their extremely useful suggestions to improve the quality of the article. Usual disclaimers apply. The authors would also like to thank Kailun Chen for her research assistance.