



Abstract
In this article, we look at the determinants of the new technology adoption by consumers in the case of mobile telecommunications. The dynamic nature of the telecom industry is a result of the frequent technological change. Consumers witness different technology standards in mobile communications, starting from the first generation (1G) to second generation (2G) subsequently to third (3G) and now experiencing fourth (4G) in some countries such as Norway, Sweden, South Korea, and the USA including ours. The movement from one standard to the other has been predicted to be smooth as all of them are vertical substitutes for each other. Given the various dimensions such as price, requirements, utility and so on, these technology standards are not perfect substitutes. The article investigates the prospect of a new technology standard roll out in India. A survey of 400 mobile phone customers in metro telecom circles has been carried out for this purpose. The study applies structural equation modeling (SEM) and explores the adoption intention of this new technology among the respondents. Results show that the presence of low-cost alternatives that is the availability of a lower technology standard poses a significant hurdle to the adoption of new technology services.
Introduction
Mobile technology has been evolving from first-generation (1G) mobile technology, voice-only cellular telephone standard developed in the 1980s to second-generation (2G) mobile standard based on digital technology and further to a more modern third-generation (3G) technology and now to the latest fourth-generation (4G) technology. The 2G technology allows consumers to avail the facility of text messaging, but unlike 1G here semi-global roaming facility is also available, based on circuit-switching standards. These standards are now being replaced by the packet-switching standards of 3G and the newly emerging 4G technology. In addition to the verbal communication, new technologies are including data services and access to television/video, categorized into a triple-play service. High-speed Internet service and video chatting are the prime features of new technologies. However, despite the advent of these new technologies, a mass adoption was not observed due to the compatibility problem and absence of the ‘killer application’ (Funk, 2007) like short messaging service in the case of 2G.
The peculiarities of the sector itself creates problems for the mass acceptance of an emerging technology. Attraction towards new needs that can be satisfied by the latest technology can decline due to difficulty in adapting it. Moreover in order to enjoy the services the consumers have to invest in accessories. This may affect the adoption rate. The pecuniary factors and extrinsic cues are important in understanding the purchase behaviour. Veblen effect of conspicuous consumption is visible for commodities like mobile phones given the societal structure in our country. Latent demand exists for several value-added services. To attract this segment of consumers, the service providers articulate the benefits of the technology, features, price and availability of the new technology enabled handsets. But both the preference and the adoption are affected by not only the service charges for the data transfer using the new technology but also dictated by the expenses associated with the accessories needed to adopt the technology. The mass adoption would depend on the willingness to pay for the services added to voice telephony and purchase of handsets. Apart from pecuniary aspects, a country-specific ethnocentric behaviour is also worth considering while estimating the potential demand for such services.
New technology services provided by this particular technology standard are vertically substitutable. This may lead to a smooth shift from one generation to the other. But from our analysis, it has been found that the presence of alternatives played a vital role and is a crucial hindrance to the acceptance of the technology. In what follows, with the help of a manageable theoretical model we address the issue of the adoption behaviour. In the first section, we start with the extant literature. Thereafter, we explain the objective of our study in the second section and the rational of the study in the third section. The fourth section deals with the methodology. Analyses of constructs and empirical model estimations are discussed in the fifth section. We conclude the article in the final section.
Review of Literature
Several theories and models have tried to explain or predict a person’s technology acceptance, for example, the theory of planned behavior (TPB) (Ajzen & Fishbein, 1980), the technology acceptance model (TAM; Davis, 1989) and the unified theory of acceptance and use of technology (UTAUT) (Venkatesh, Morris, Davis, & Davis, 2003). Among them, TPB and TAM are generic models and have been used to study various technology acceptance phenomena that differ in terms of technology, target users and context.
According to TPB, an individual’s acceptance of a technology can be explained by his or her intention, which is jointly determined by an attitude, subjective norms and a perceived behavioural control. Attitude refers to a person’s positive or negative evaluative affect about his/her behaviour (Ajzen & Fishbein, 1980); subjective norms denote the person’s perception of relevant others’ opinions about whether he or she should perform the focal behaviour (Ajzen & Fishbein, 1980) and the perceived behavioural control is the person’s perception of the presence or absence of required resources for performing a behaviour (Ajzen & Fishbein, 1980). This theory has been tested in a wide variety of settings, for example, health care (Conner & Sparks, 1996), consumer decision-making (Fortin, 2000) and technology acceptance/adoption (e.g., Chau & Hu, 2001). The existing empirical evidence reveals the theory’s explanatory power and predictive ability (refer Venkatesh, Davis, & Morris, 2007). Indeed, Ajzen (1991) describes that the model is open to further modification if more important proximal determinants can be identified.
The TPB is, in principle, open to the inclusion of additional predictors if it can be shown that they explain a significant proportion of the variance in the intention or behaviour after current variables have been taken into account. We have introduced an economic factor that is presence of alternatives, which has cost implications.
The perceived usefulness refers to the degree to which a person believes that using the focal technology would enhance his or her performance; whereas the perceived ease of use denotes the extent to which a person believes his or her use of the technology would be free of effort (Davis, 1989). The TAM has been empirically examined across a variety of technology acceptance scenarios that include email (e.g., Gefen & Straub, 1997) and enterprise systems (Venkatesh et al., 2003). According to Chau and Hu (2002), to examine the technology acceptance by working individuals, it is essential to include factors that pertain to the individual (e.g., attitude, perceived behavioural control) and the technology (e.g., perceived usefulness, perceived ease of use). Their results show that TAM applies for both the USA and Switzerland but not for Japan. This finding suggests that this model might not predict the technology acceptance equally well across different sociocultural contexts.
Several researchers have replicated Davis’ original study (Davis, 1989) to provide an empirical evidence on the relationships that exist between usefulness, ease of use and system use (Adams, Nelson & Todd, 1992; Davis, 1989; Hendrickson, Massey, & Cronan, 1993; Segars & Grover, 1993; Szajna, 1994). Venkatesh and Davis (2000) extended the original TAM model to explain the perceived usefulness and usage intentions in terms of the social influence and cognitive instrumental processes. Kassim and Ramayah (2015) have used this method to explain the perceived factors that influence Internet banking in Malaysia.
Nathan Rosenberg (1972) argued about the supply side factors of diffusion and the acceptance of new technology. In his view the slow diffusion of new technologies was due to their relatively poor performance in their initial stage, and suppliers of these new technologies should improve the quality of performance and lower the cost over time for successful rolling out. He identified several factors that are important on the supply side: the improvements made to the technology after its introduction, the invention of new uses for the technology (consider, e.g., laser technology) and the development of complementary inputs such as user skills and other capital goods. He also pointed out the role of induced improvements in older competing technologies in retarding the shift to newer technologies (New Economy Handbook: Hall & Khan, 2002). In this article, we limit our scope to demand-side factors only.
With least developed countries (LDC) 2G systems established, the question naturally arises as to the size and nature of the incremental benefit from introducing 3G platforms. Importantly, from an LDC public policy perspective, 3G systems probably represent the most effective means to deliver the broadband (through broadband wireless access) or even Internet access to masses (Waverman & Dasgupta, 2010). Further, 3G technology enables the introduction of increased enterprise mobility via high-speed Internet connectivity, video calling, mobile email, digital photo and voice sharing and location-based services. Additionally, from a mobile network operator’s point of view, with mobile voice services getting commoditized and facing increasing price competition, these new data services are critical for generating the revenue and profit growth.
Objective of the Study
The objective is to examine key factors that influence the new technology use, specifically, the new technology usage through mobile phones. Given the kind of inter- and intra-competition between various technologies, the study seeks to shed light on key factors influencing such competition. This has been done on the basis of consumers’ perception about adoption intension of the new technology, given both cost and utility dimensions.
Rationale of the Study
The mass adoption will be possible if the consumers weigh the incremental benefits of adopting the new technology against the cost of change in the environment of uncertainty and limited information. The ultimate decision is made on the basis of consumer preferences, and the actual purchase or demand will also be influenced by offerings of the new technology. So while setting the price of the service and promoting the product, suppliers must get a clue about the determinants of demand for such services which can be gauged from the perceptions of the potential consumers. In this article, we try to identify the drivers and inhibitors of preference for the new technology adoption.
At this point, the question which concerns both economists and those interested in encouraging the spread of new technologies is what factors affect the rate at which technology adoption occur. A major point of concern in India today is the prospect of death of 3G being squeezed between 2G and 4G (Business Today, 2015). The major reasons being cited are the availability of infrastructure supporting 4G and the lack of investments in towers supporting 3G. On the other hand, government has allowed the telecom firms to provide services falling under any of the standards, 2G, 3G or 4G from the allocated spectrum. Thus from firms’ point of view, deciding on future investments related to standard demand-side factors assume a lot of importance. Factors influencing the technology adoption can give some perspectives on consumer choices regarding the new technology. The study has been conducted keeping this basic premise in mind.
Methodology
Data Source and Sample Frame
A survey was conducted to collect data to test the proposed model. The survey was conducted from June 2014 to February 2015. A total of 400 completed questionnaires were collected, and it was taken care that none of the respondents are already using new technology enabled phones. The reason for this is that the study has been designed to estimate the mass adoption of the new technology enabled phones, and early adopters could not be considered as valid respondents as we are interested in ascertaining the mass adoption behaviour with uncertainty. The survey was conducted through direct interview method. The area selected for survey was the city of Kolkata. Interviewers randomly picked people and administered the questionnaire, provided the initial enquiry revealed they were the intended consumers. Around 60 per cent of the respondents were male. The sample mainly consisted of people with a monthly income of more than ₹10,000 and who has studied in college. Around 70 per cent of the respondents were working in the services sector, followed by 20 per cent self-employed and around 5 per cent from the manufacturing sector. Rest of the sample were categorized as others including traders. In terms of age, a majority 70 per cent of the sample belonged to the category, 25–40 years.
Empirical Model
We employ structural equation modeling (SEM) to test our theoretical model. This technique provides an appropriate framework for modelling of a multivariate data having mixed categorical and continuous measurement scales.
Our work follows TAM developed by Davis (1989) and Chin (1998). Figure 1 presents our model structure according to the relationships to be tested. Our objective is to examine key factors that influence the new technology use, specifically, the new technology usage through mobile phones. Therefore, factors related to such adoption behaviour have been considered for developing our theoretical model. These factors were then associated with the actual new technology usage and with individuals’ perceptions about such a behaviour to form our research model.
In equation form, the model for adoption intention can be represented as follows:
where Di is the adoption intention. The coefficients β1, β2, β3 and β4 are assigned to the latent constructs, perutilnt (perceived utility of new technology), perutnser (perceived use of new service), prealt (presence of alternatives) and perexp (perceived expense), respectively.
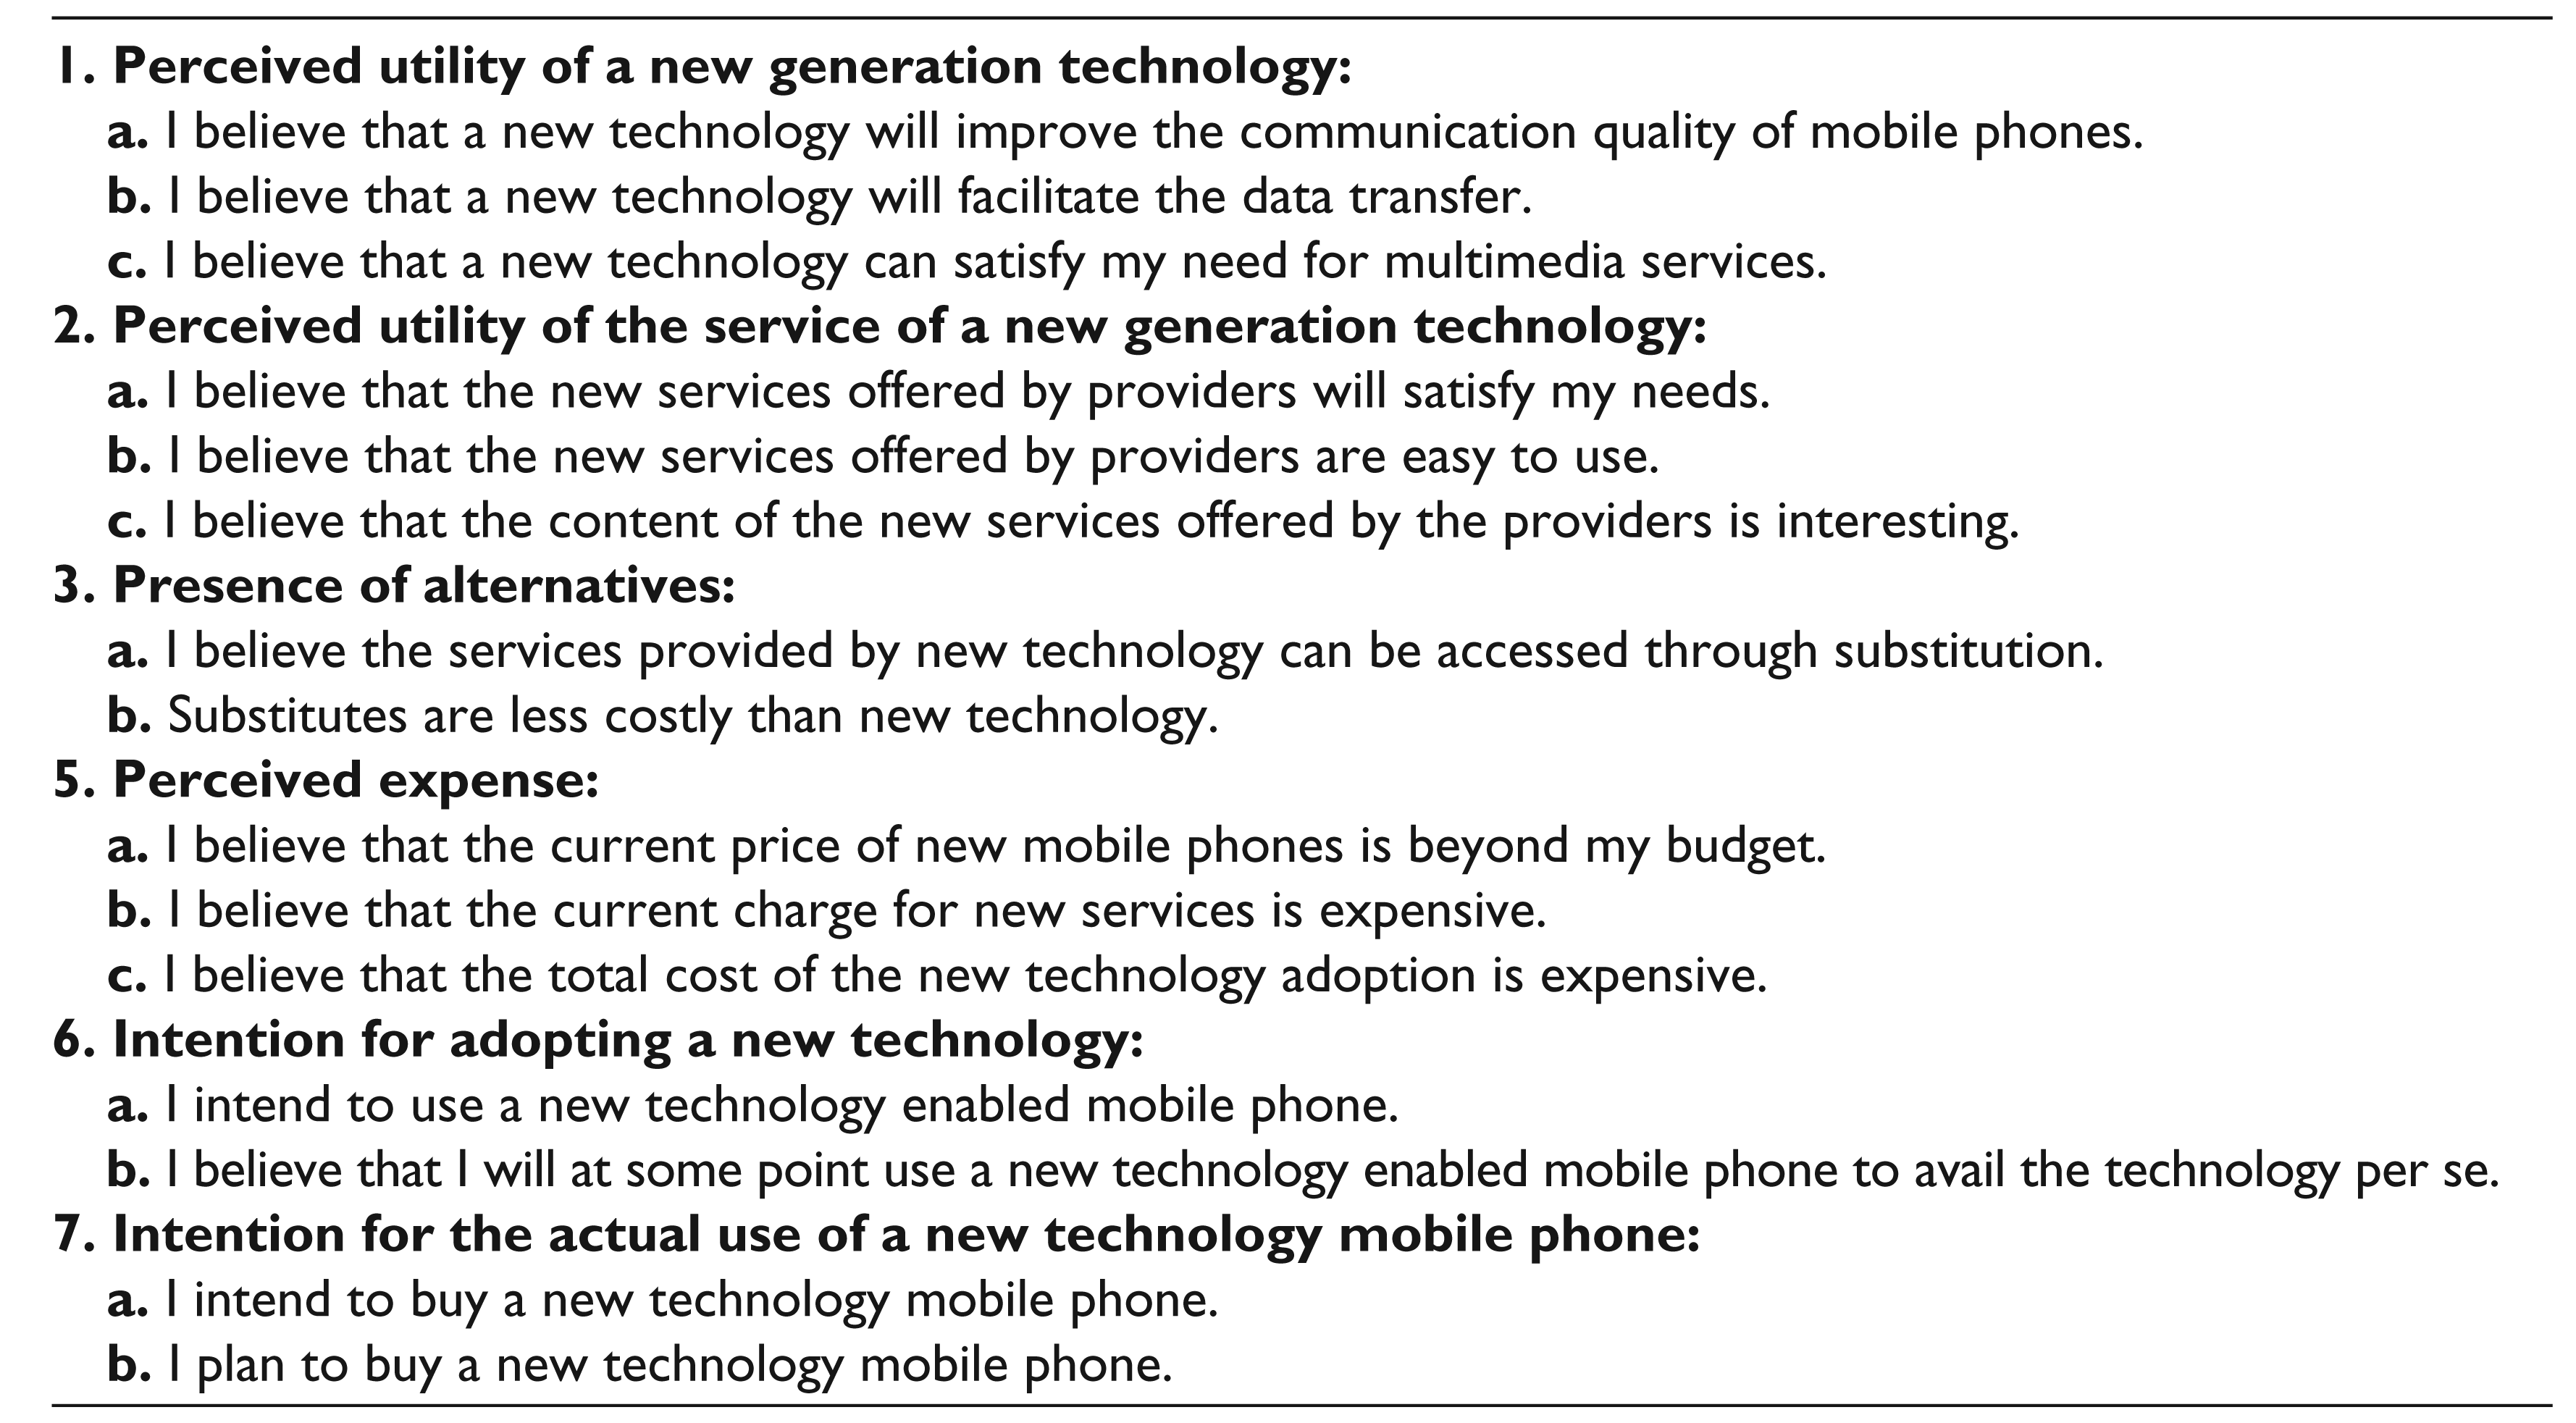
Apart from ‘age’ and ‘mobility’, all the other constructs are obtained from responses to Likert-scaled questions (see Appendix A). The extent of measurement error may be very high for such factors. Hence SEM is used. In this approach, in the first stage the relationship between indicators and latent factors is established through a factor analysis. Further, the indicators are used in a regression like framework to estimate the structural coefficients taking care of measurement errors. Apart from the above equation, the relationship between the adoption intention and the actual use is also estimated, taking the former as an independent construct.
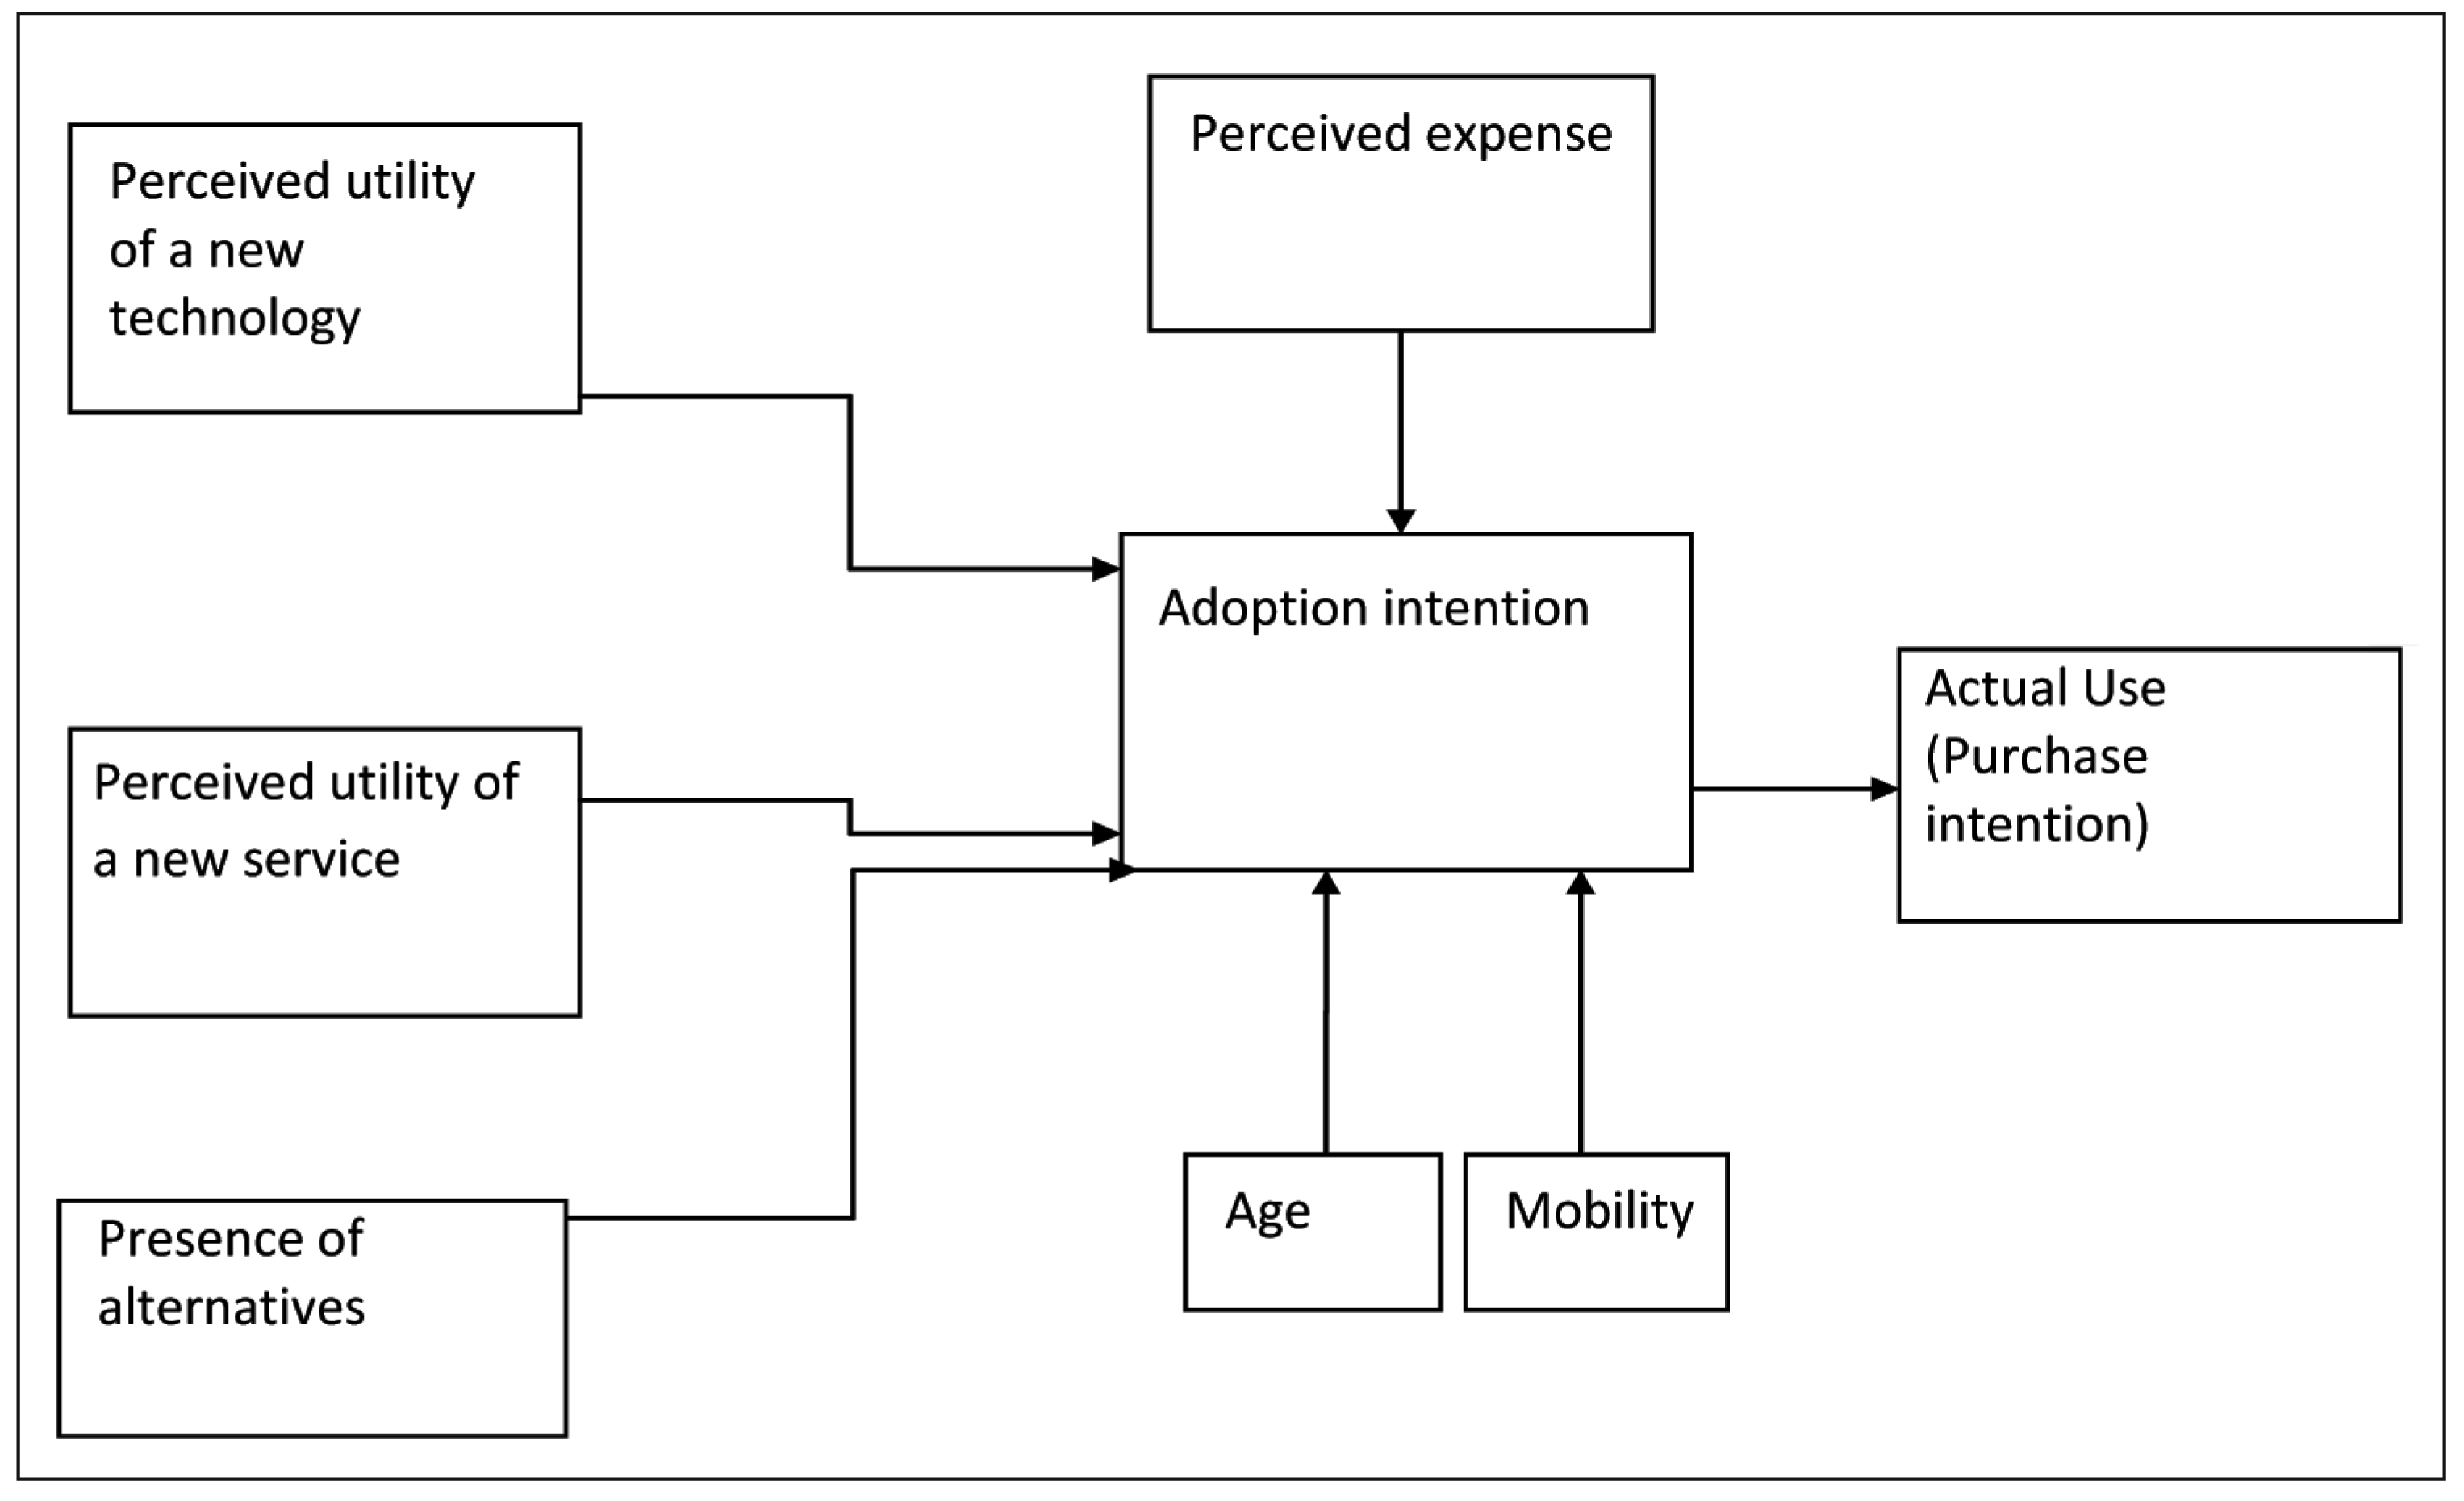
In the above model, the intercept term α captures the influence of external factors such as the effect of advertisement, societal influences, peer group pressure and so on. Testing the model with this intercept term can thus control for the influence of these factors on adoption decision. We define them more formally in the next section.
Adoption intention in our study is an endogenous variable, and the actual use is the outcome variable.
The SEM is a widely used technique for estimating a system of equations with latent variables. In consumer behaviour studies, the technique has been used to estimate the reciprocal relationship between the evaluation of a product and beliefs about it (Lehmann, 1975; Moore & Mckenna, 1999). Since belief and evaluation have a reciprocal relationship, a simultaneous structural equation model was used to estimate the relationship (Johansson, Johny, Douglas, & Nonaka, 1985). Measurement error in constructs formed through Likert scales justifies the use of such a method even in case of non-reciprocal relationships.
Analysis
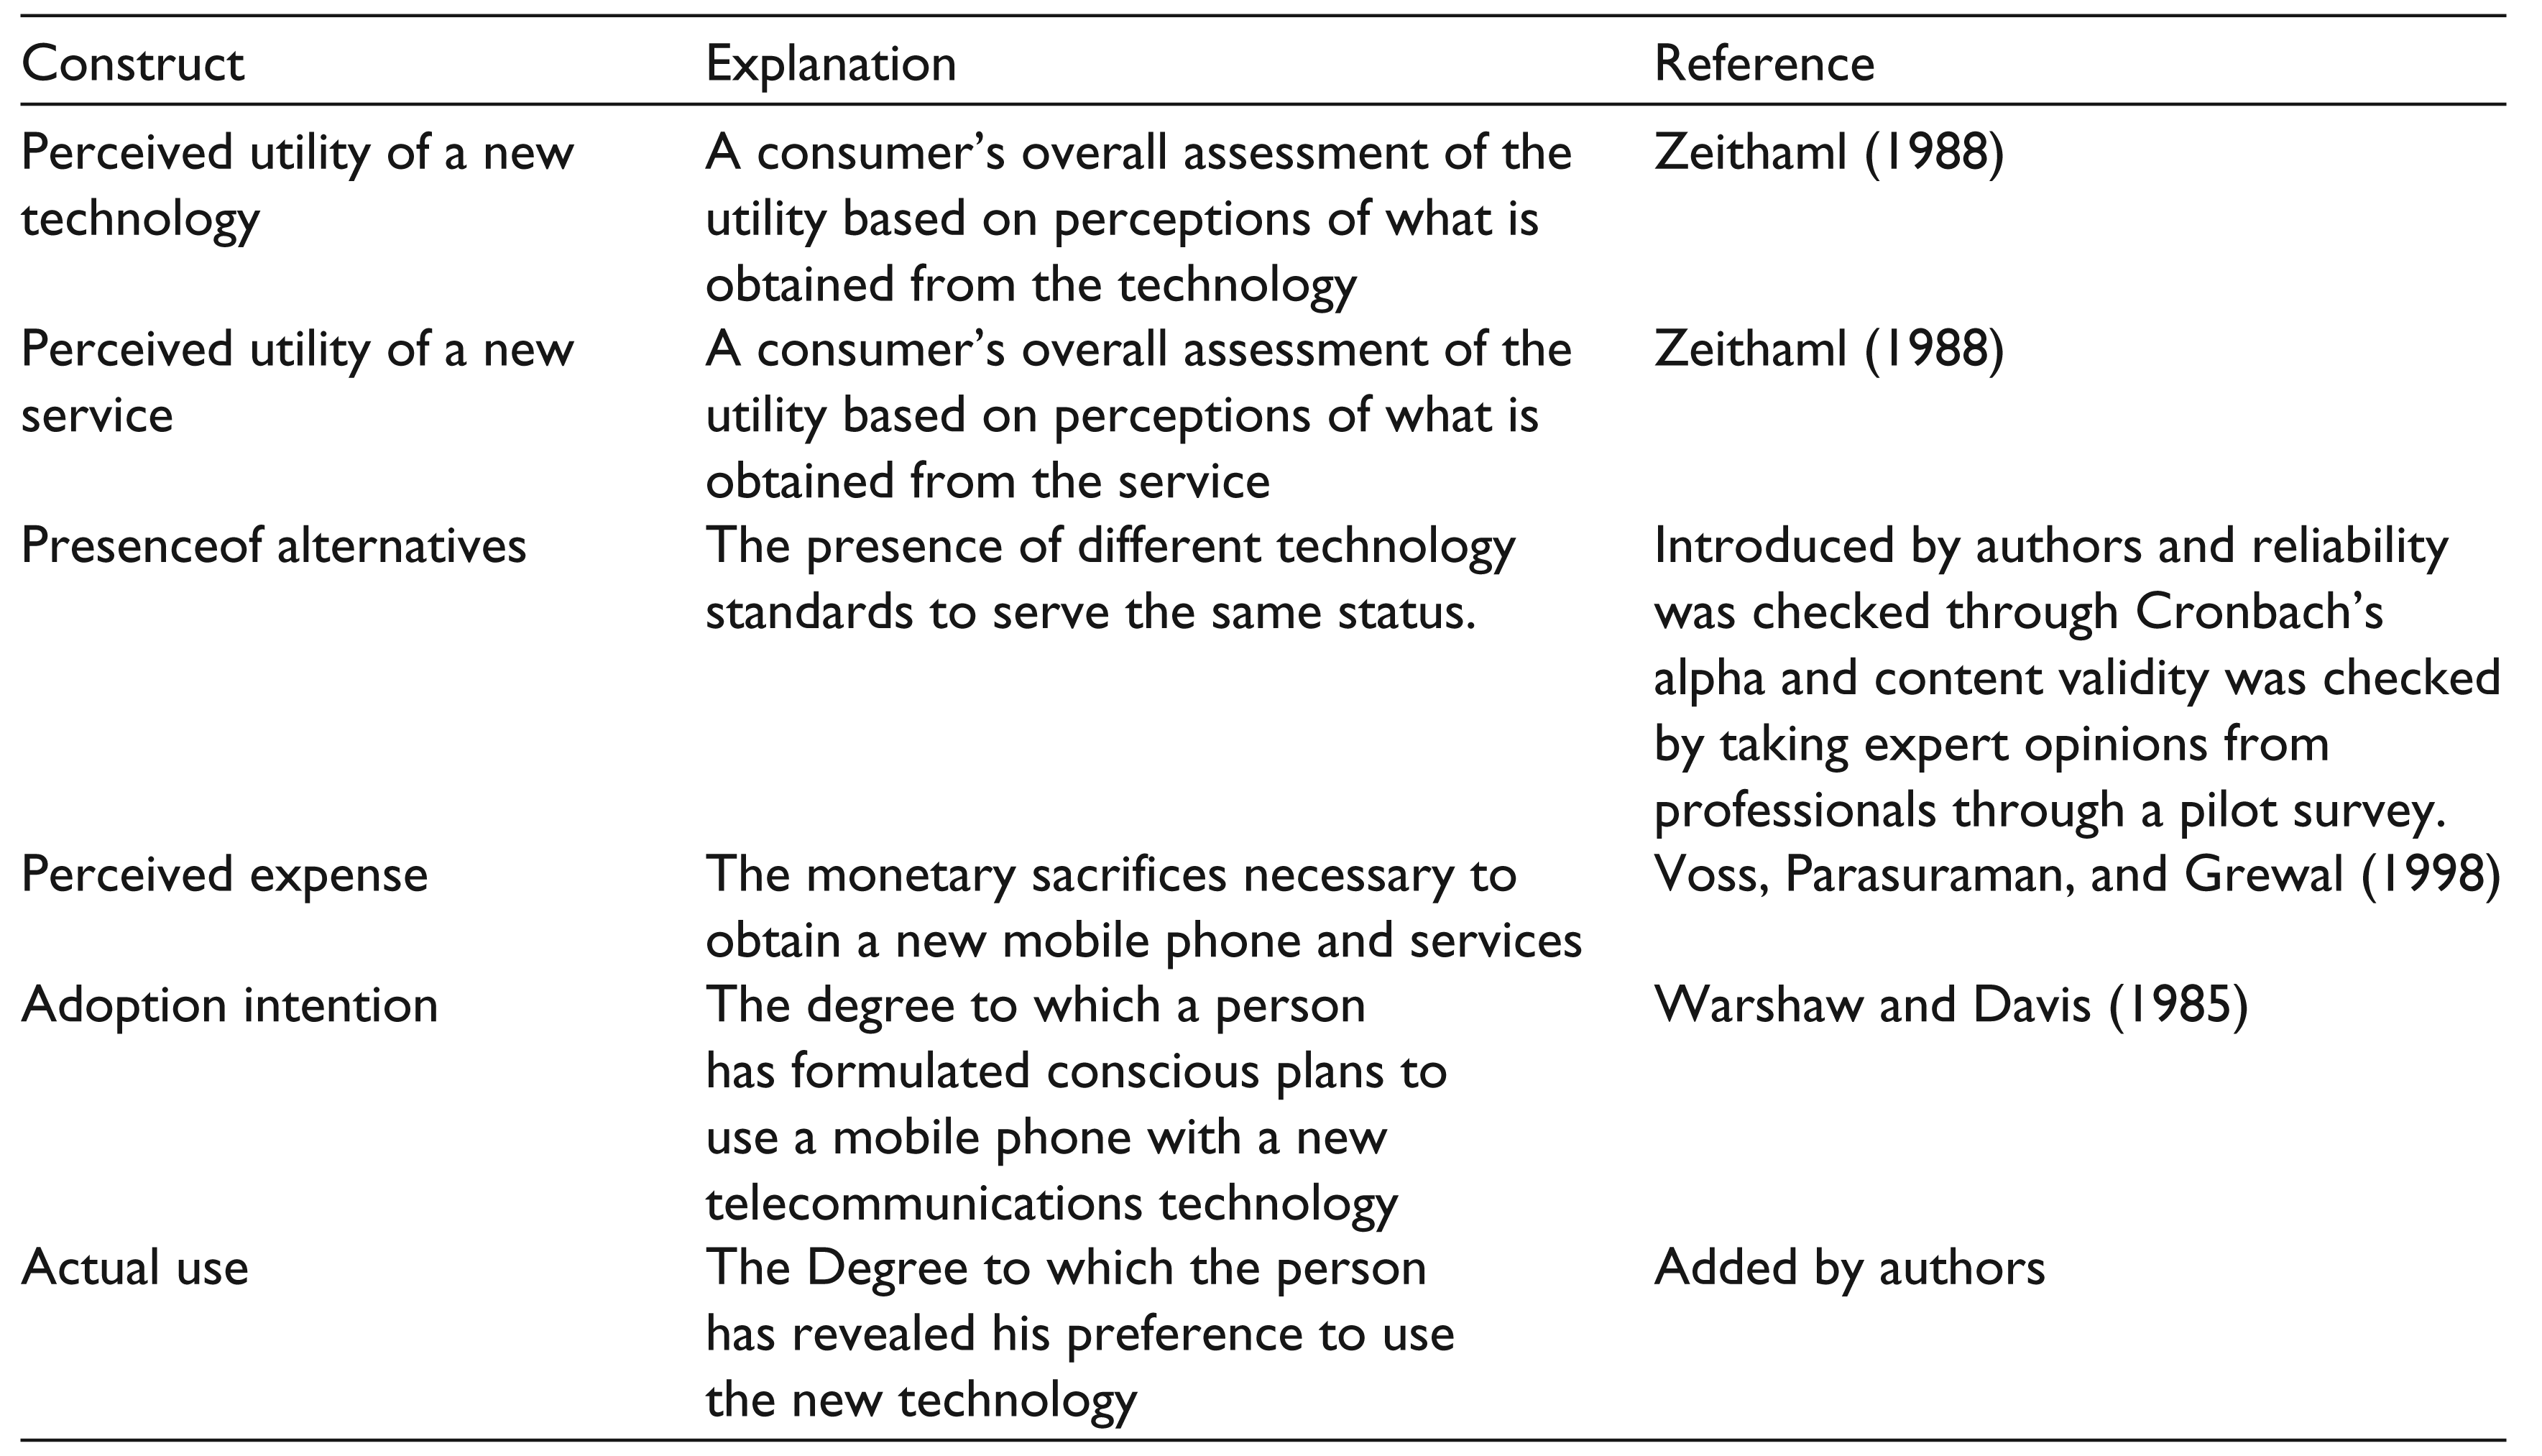
The definition and sources of the constructs are mentioned in Table 1. All the constructs are based on existing scales. Their internal consistency though has been checked before, the analysis as the context in which they are used is different in this article (from earlier studies).
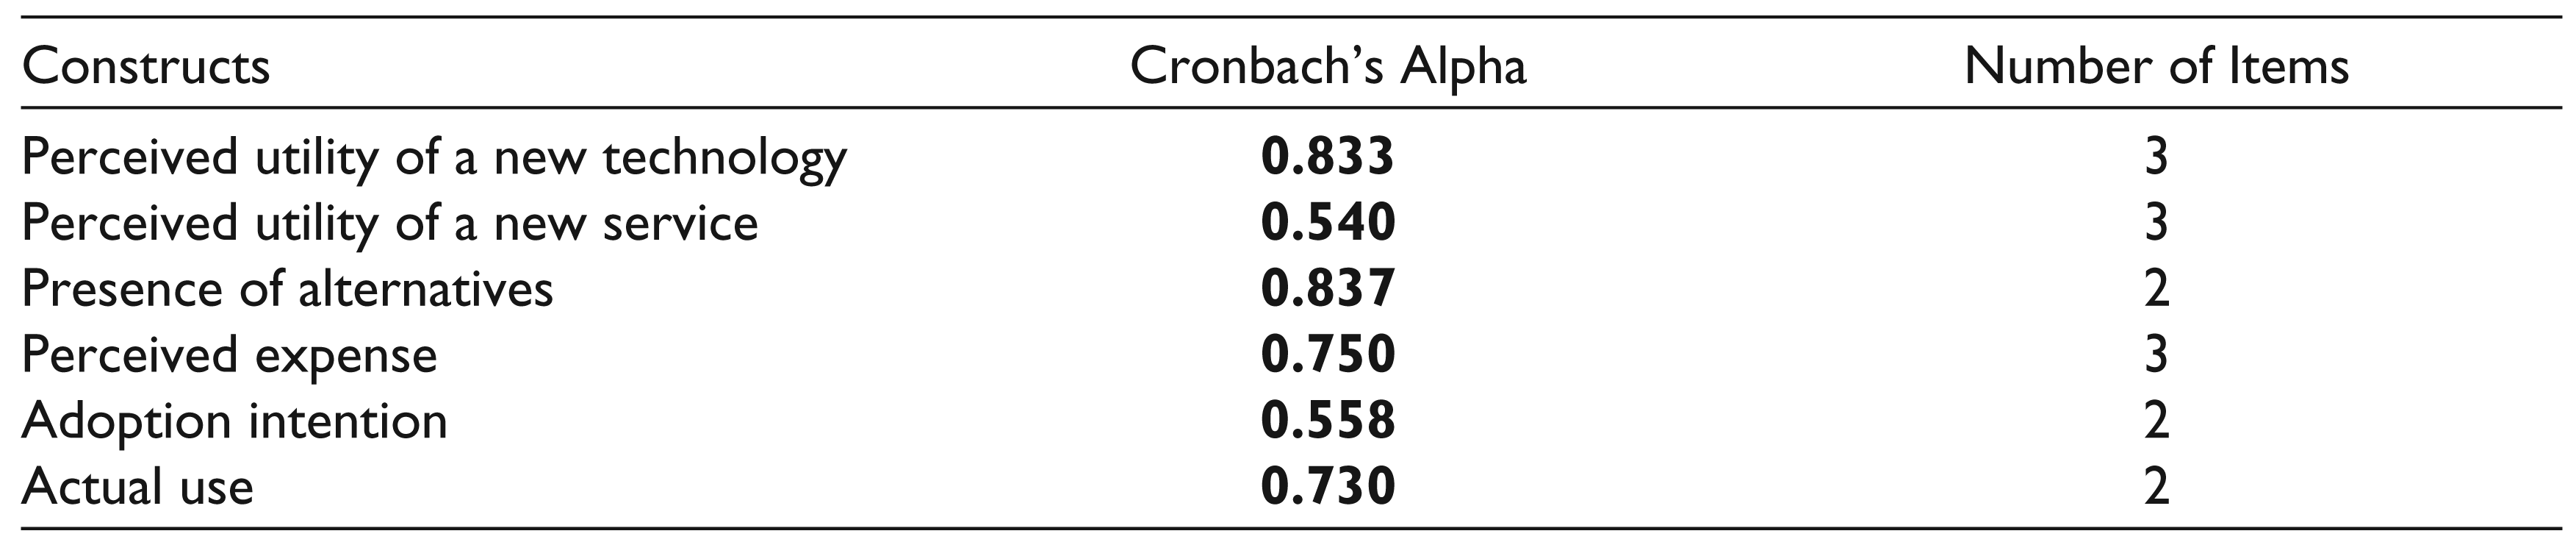
The Reliability and internal consistency of the responses were checked through Cronbach’s alpha (Cronbach, 1951; Peter, 1979). Table 2 lists Cronbach’s alpha values for instruments used in this study.
It is seen that the internal consistency of all the constructs in the model is in the acceptable range except for ‘perceived utility of a new service’ and ‘adoption intention’.
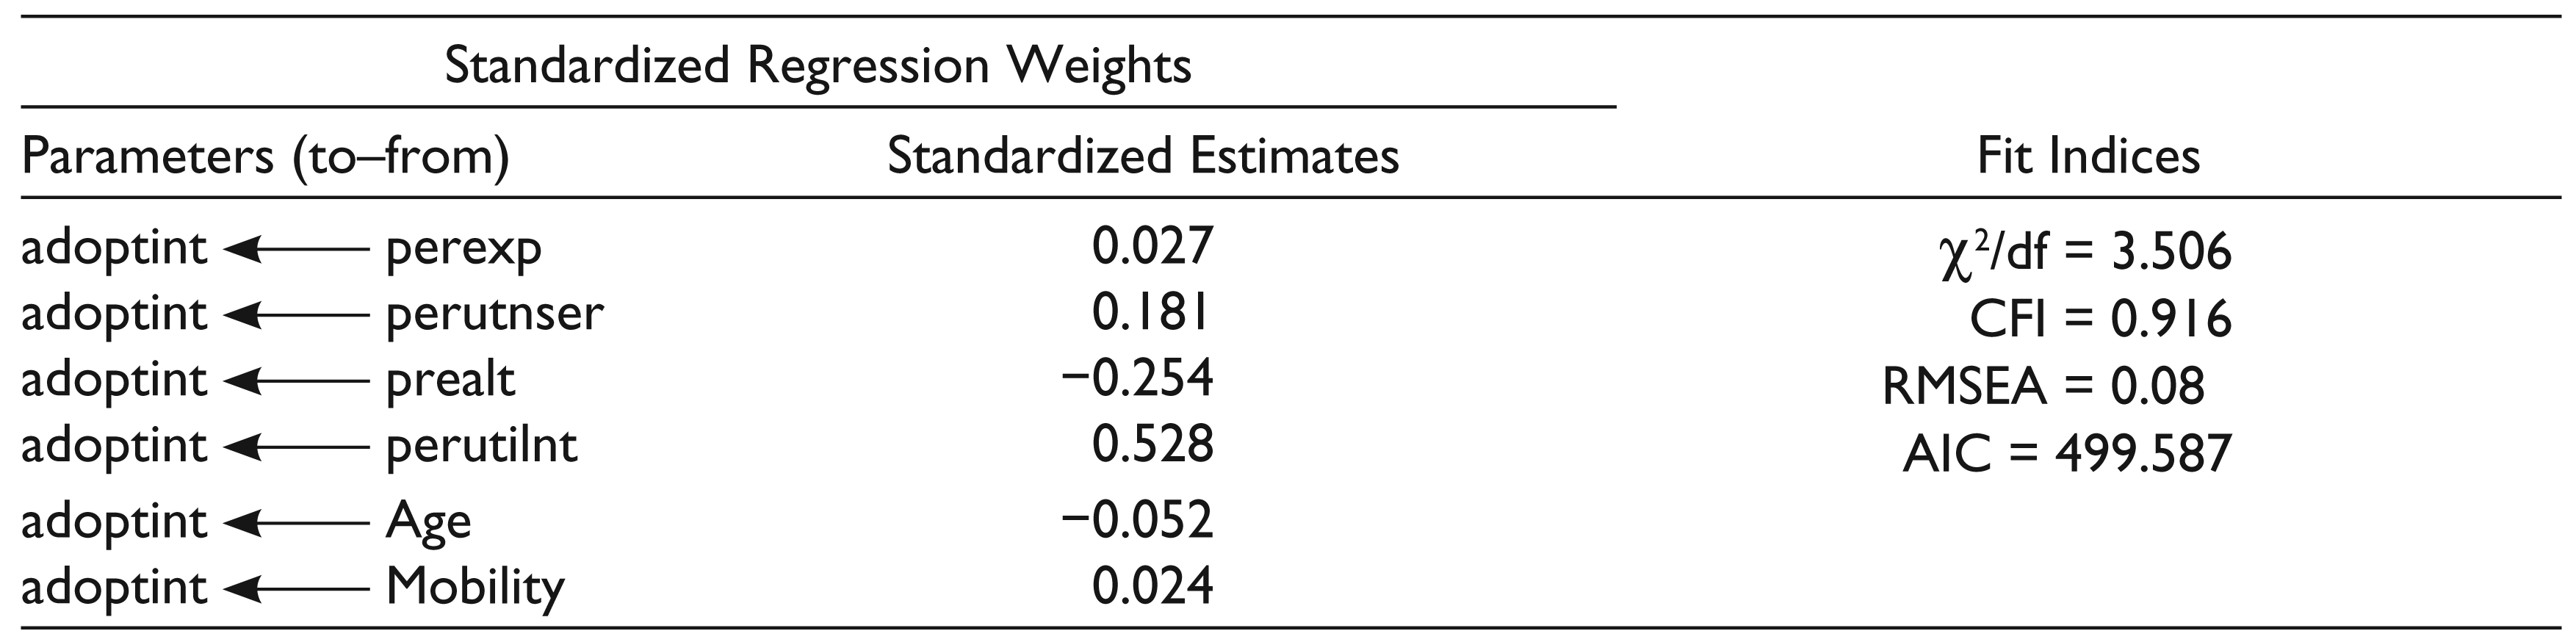
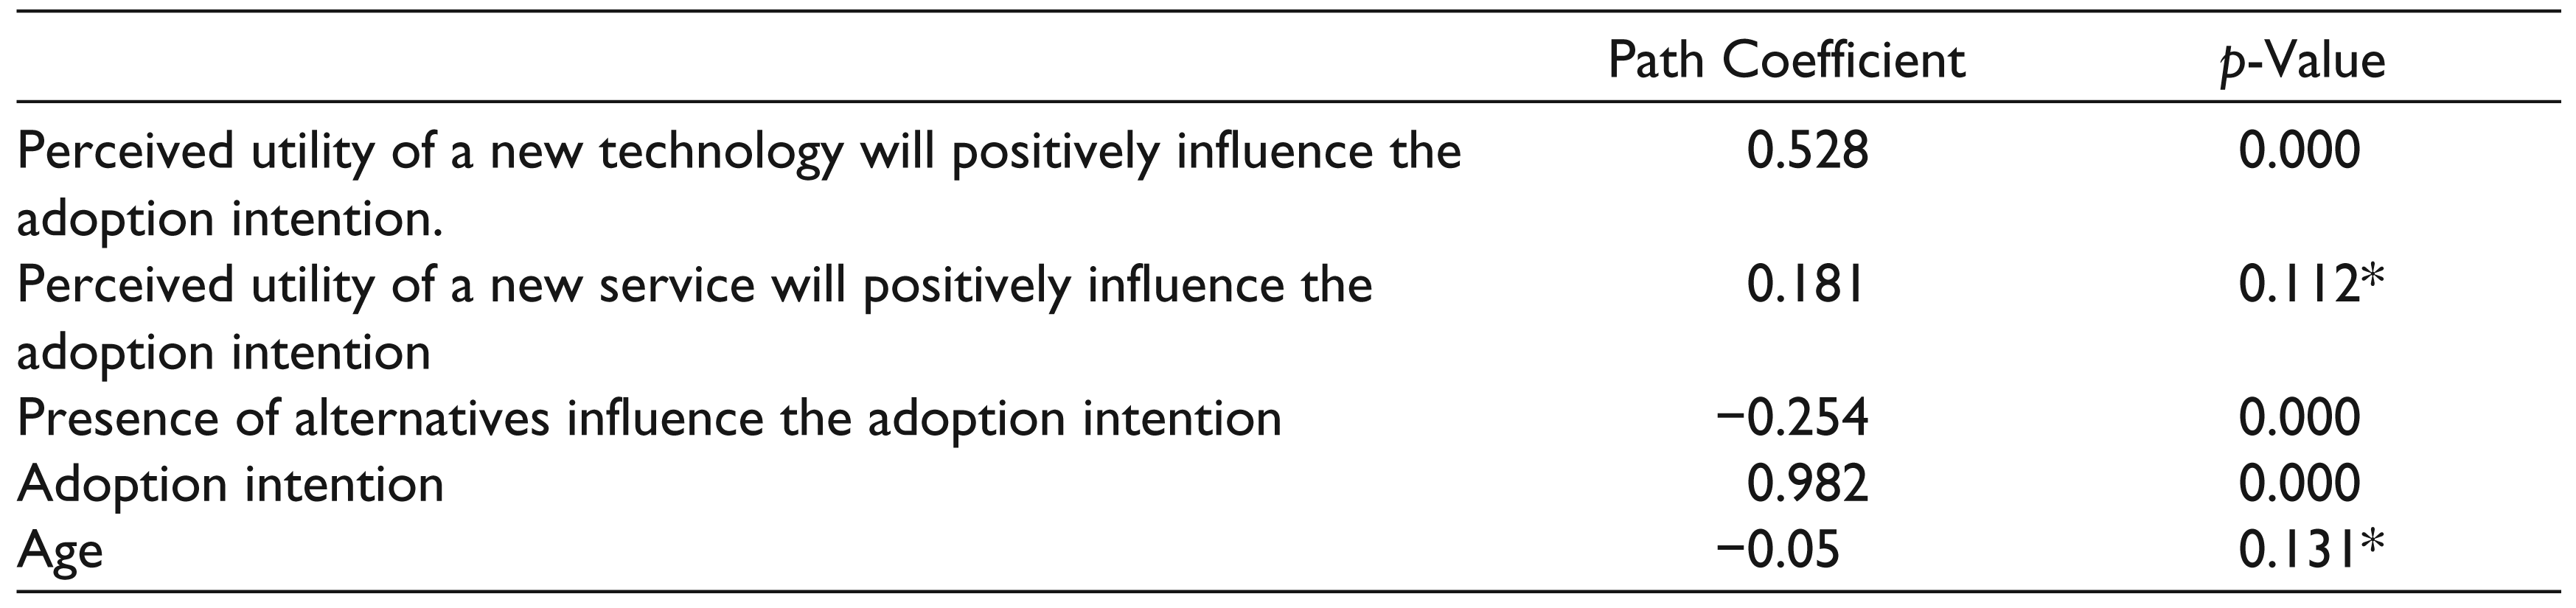
The SEM uses the maximum likelihood method for estimating the path coefficients. It was found that the perceived utility of a new service positively influences the adoption behaviour with the path coefficient value, 0.528 (p-value 0.000) (see Table 4). The adoption behaviour is influenced by the presence of alternatives with the path coefficient value, −0.254 (p-value 0.000). Regarding the issue of the influence of the perceived utility of a new service on the adoption behaviour, we found that the coefficient is significant at 10 per cent level. Interestingly, the result obtained for the path coefficient (0.027 with p-value > 0.10) between the perceived expense and the adoption intention contradicted the expected theoretical relationship. We are going to discuss the implications of these results in the ensuing section. The association between the adoption intention and the actual use was supported, given the estimated path coefficient (0.928) and the p-value (> 0.000). Influence of extraneous variables such as ‘age’ and ‘mobility’ was also tested, and we found that age influenced the adoption intention negatively, but the result is not statistically significant (p-value > 0.131). The variable ‘mobility’ had no influence on the adoption intention with path coefficient of 0.024 and the p-value > 0.15.
As can be seen from Table 3, the chi-square to degrees of freedom statistic is found to be 3.506 pointing to a good overall fit. Comparative fit index (CFI) of the model is found to be 0.916. Parsimony-adjusted CFI is also found to be at a satisfactory level. Root mean square error of approximation (RMSEA) is 0.08 that showed a moderate fit of the model. Akaike information criterion (AIC) value is slightly more than the saturated model but is significantly less than that from the independence model. Ideally, for the hypothesized model it should be less than that of both the saturated model and the independence model. Complexity of the model may have affected the parsimony of the model fit. Modified expected cross-validation index addresses the generalizability of the obtained results in competing samples. The value obtained for this index for the default model is substantially less than that for the saturated and the independence model. This suggests that the hypothesized model is well fitting and represents a reasonable approximation to the population.
Definition of Constructs
Reliability Analyses by Constructs
Structural Equation Estimates
Summary Listing of Supported Path Coefficients of Different Constructs with the Adoption Behaviour
Conclusion
The telecom sector is intensely competitive. Large fixed costs have to be incurred for technology implementations including the cost of accessing the licence (spectrum fees). The telecom operators are trying to capture the market with different service promises. The services are primarily related to data transferring. To do this, the aspiration of the general mass should be assessed beforehand. Our study shows that the presence of alternative technologies is a significant inhibiter of adoption of the new technology. On the other hand, the perception about the utility of the technology is a significant driver of the adoption more than the perceived utility of service. Expenses related to the adoption have not been found to be a significant determinant of the adoption. Hence the strategy should be to showcase unique features of the technology, and the segmentation should be based on the need of new features among the consumers. Pushing it by low prices may not be a prudent strategy. Moreover, companies providing both 2G and 3G or 4G should be careful about the inter-technology competition. Thus adopting an overall strategy to cater to different segments attracted towards different technologies may result in roping in additional new consumers without a migration of existing consumers from one platform to the other.
Implications, Future Research and Limitations
Adoption or the attitude towards a new technology includes consumers’ perceptions on the technology and service: Two constructs, namely, the perceived utility of a new technology and the perceived utility of a new service were used to capture the consumer’s perception about the adoption and ultimately to look at the actual intention to use. These constructs are sometimes overlapping in nature, but through discriminant validity we have checked for the distinctiveness of these two constructs. The common perception of a new technology adoption is related to higher quality of voice communication and speedy data transfer than the existing technology, thereby allowing for more services through the mobile phone and features built in it. The adoption of the technology is related to its utility and when the consumers think that this technology will really improve their work quality and standard of life. However, the service obtained by the application of a technology standard is explicit in nature, and consumers can evaluate the service according to their needs. To understand the consumer behaviour for mass adoption, a discrimination between constructs of the technology and service is essential (Teng, Lu, & Yu, 2009).
The mass adoption behaviour of a technology is determined by the perceived utility of a new service, but its role is found to be less important than the perceived utility of a new technology: The construct, the perceived utility of a new service, according to the existing literature should be the most important for mass adoption. In our study, it has the expected positive impact, but its importance is less than the impact of the perceived utility of a new technology. This may be due to the sample group’s perception about the service being ambiguous in nature and the technology itself carrying more importance while determining their behaviour. The market practitioners often opine that a pure technical approach is irrelevant to detect drivers and inhibitors in the market (Antoine, 2004). Our study reveals that the perception of a new technology is the major driver of the adoption intention. In the Indian context, it can be seen that telecom operators highlight the technology itself, and branding is mostly technology driven. They do not explicitly market the services in their advertisements. So the sample respondents are more certain about the technology and service, and this is the next important driver of the adoption intention.
The economic factor like the perceived expense is not a major factor in influencing the adoption behaviour and actual use or purchase, though the service may be price elastic in nature at the firm level. Manoeuvring this factor will be ineffective in the diffusion of the technology and capturing the market: This study revealed that the perceived expense is not a significant factor with regard to the attitude building or the adoption intention. At an early stage of adoption in many countries, the price for the service is kept low to facilitate a business rollout. The perception is that a low price would attract customers. Thus, for telecom firms, this study suggests that collaboration with complementary service providers like content providers will make the business attractive. Along with this, providing several data-oriented services with a market potential will attract new customers and aid in the mass adoption.
Presence of low-cost alternatives to this technology and service will create an inter-technology competition and the diffusion of a new technology will face hurdle due to this factor: The diffusion of the 3G technology may be affected by the existence of the 2G technology in mobile communications. This may be on account of the fact that telecom services are offered at various quantities, and therefore consumers may think that they will be able to choose the suitable package. Adoption of the 3G technology suffered because of the continuous growth of the 2G usage. The reason is that the technologies were competing for a common customer base (Gruber, Jansen, Marienhagen, & Altenmueller, 1995). According to Shapiro and Varian (1999), the competition between technologies should be conducive to a rapid innovation, while the competition within a technology should lead to lower prices. However, the overall performance of the 3G market was disappointing: services started late, and there was generally much less demand for them than originally expected. Hence, the speed of the diffusion of 3G subscribers was much slower than earlier generations (Gruber, 2007). In Japan, the success of the 3G business was due to the fact that people were using the 3G-enabled mobile phones at the time of commuting. The popularity of NTT DoCoMo’s i-mode mobile Internet system in Japan, with over 25 million data subscribers in June 2001, has been cited as the evidence that consumers want a sort of always-on services that 3G can offer and that 3G services will be commercially viable. 1
Indeed, out of the 65 million mobile subscribers in Japan at the year-end of 2000, the rapidly growing browser or mobile Internet subscriber base accounts for over 31 million or almost a half. 2 There is another belief that the i-mode business model is specifically Japanese and cannot be easily replicated elsewhere (Dux, 2001). It is also pointed out that i-mode is not burdened by high-licence fees. On the other hand, there are analysts who maintain that even with high-licence fees paid in countries such as the UK and Germany, 3G is a commercially viable service (Biddlecombe, 2001). 3 Michael Fitzpatrick (2000; 2001, April 4; 2001, June 29) warned that 3G may be in danger of being squeezed between evolving technologies. The existing upgraded version of the 2G network (able to handle data but slower than 3G) such as general packet radio service and the advent of the 4G technologies can impact adoption of 3G. Further, wireless computer networking technologies such as Blue tooth and 802.11b (also known as Wi-Fi) that link laptop computers to office networks at high speeds can also impact adoption of 3G.
The study conducted by Economides and Grousopoulou (2009) and Pagani (2004) demonstrated that the age and income level might be a moderator of the relationship between the perceived expense and the adoption intention. Dhananjay Bapat (2012) also found age as a moderator while assessing key attributes of electronic payments. In this study, we proposed an extraneous variable, mobility, along with the age as moderators. The respondents of this survey are adults (90% are over 23 years old), and mobility was not found to be a significant factor in explaining the adoption intension. This study also explores the impact of the perceived expense on the adoption intension. Results fail to reject the hypothesis that the coefficient of this variable is zero. Our result resembled with Teng, Lu, and Yu (2009) for the mass adoption behaviour in Taiwan which found a similar relationship.
The major limitation of the study is ignoring the supply-side factors. A comprehensive study on the subject based on both demand- and supply-side factors should be done to pin point the factors important for the new technology adoption. The survey should also be more broad-based including non-metro circles and separate questionnaires for service providing firms and regulators.
Declaration of Conflicting Interests
The author declared no potential conflicts of interest with respect to the research, authorship and/or publication of this article.
Funding
The author received no financial support for the research, authorship and/or publication of this article.
Footnotes
Acknowledgements
The authors are grateful to the anonymous referees of the journal for their extremely useful suggestions to improve the quality of the article. Usual disclaimers apply.
Appendix
Latent Constructs Obtained from the Questionnaire
|
|
| |
| |
| |
|
|
| |
| |
| |
|
|
| |
| |
|
|
| |
| |
| |
|
|
| |
| |
|
|
| |
| |