



Abstract
The current article aims to identify important macroeconomic variables that could indicate the likelihood of financial distress among 294 Indian firms included in the BSE 500 index. Twelve years of financial data and macroeconomic indicators were analysed through a logit model. The study applied a synthetic measure of financial distress adopted from Bhattacharjee and Han (2014, China Economic Review, 30, 244–262.) which is based on the interest coverage ratio. A significant negative relationship is reported between the likelihood of financial distress among firms and three macroeconomic indicators, namely, the index of industrial production (IIP), exchange rate and a 10-year bond yield. Accordingly, the classification accuracy reported for the full, training and testing samples was 75.51, 79.49 and 70 per cent, respectively. With respect to theoretical contribution, the study has underlined the difference between financial distress and bankruptcy. An additional classification test was conducted wherein the harmonic mean based on the current dataset characteristics was the discriminating score. A prediction accuracy of 76.92 and 70 per cent with respect to the training and testing sample was reported.
Introduction
The history of credit, without any doubt, is as old as the human civilization. Debt covenants between parties are built on timely transfers of credit. Delay in collection and disbursement of funds cause misbalances in the books of accounts. Managing such misbalances and ensuring they do not create a ripple effect remain the priority of managers. Failure to contain such ripples puts firms in an unwanted position and creates a form of financial distress. Either the firm could survive by restructuring itself or the firm could move further on the path of insolvency.
Continuous evaluation of a firm’s financial well-being and prediction of the firm’s future prospects are of profound importance. Shareholders and investment managers can utilize this information to anticipate potential setbacks. For bankers, creditworthiness of clients is an a priori issue. In addition to them, parties like suppliers can also assess their customers’ pay-back ability.
In the firms’ context, the prime application of financial ratios put forward a few concerns. These ratios are considered to be the scorecard of firms. However, if firms still fail without warnings, then this form of measurement may not be enough. Studies on firm failure have been anecdotal (Crutzen & Van Caillie, 2008) highlighting the symptoms rather than the causes (Ooghe & De Prijcker, 2008). Right from the groundbreaking work of Altman (1968) till date, the ideal research techniques and financial ratios have not really gained a consensus. Moreover, the innumerable research articles have majorly focused on accounting-based models, where the focal point was the firm-specific factors. However with time, a burgeoning section of the academia argues that the economic conditions of a country cannot be overlooked too far in this domain. For instance, Balcaen and Ooghe (2006) reinstated that sole inclusion of financial ratios into a failure prediction model clearly implies that the researcher presumes that all annual accounts incorporate both the internal and external pertinent failure or success indicators. Prior to them, Gudmundsson (1999) conducted an exploratory research based on qualitative and quantitative data using a logit model. It was reported that as the time period extended to 2nd and 3rd years prior to bankruptcy, the qualitative model provided better results. Tirapat and Nittayagasetwat (1999) studied financial distress in Thai firms and stated that firms’ accounting variables alone were not enough to explain the bankruptcy concept.
In another study, Beaver, McNichols, and Rhie (2005) clearly stated that the greater the volatility in the economy, the higher the likelihood of bankruptcy. Their study which included both financial and non-financial information was robust over time in terms of predictive ability of their models. Wu, Gaunt, and Gray (2010) constructed five bankruptcy models and emphasized that the model based on firm-specific and market data outperformed the models which were based only on accounting data. Figlewski, Frydman, and Liang (2012) reported a considerable increase in the explanatory power of their models when macroeconomic factors were added to their study. Jenkins, Kane, and Velury (2009) added another dimension to this theme. Their results ascertained that since both effects of firms’ activities and the consequences of general economic conditions are reflected in the accounting information, its information content might differ across the business cycle. Similarly, it has been reported that financial distress in firms has been notably explained by the macroeconomic factors, particularly for those firms where earnings were quite susceptible to changes in the business environment (Filipe, Grammatikos, & Michala, 2016; Lagesh, Srikanth, & Acharya, 2018; Tsai, Lee, & Sun, 2009). Further, Dash (2017) reinstated that distress prediction is usually the outcome of the complex interplay between macroeconomic and financial variables in a dynamic setting.
Generally, this very theme of research is usually reopened by consequential changes in the economy. Almost 4 decades of innumerable research had North America and Europe (advanced economies) as the focus of the study. Work with respect to the emerging economies like India is vital as there has been an increasing demand for capital by the Indian firms. This sustained flow of foreign capital can only be maintained if investors have requisite information through which they can analyse and take financial decisions. Moreover, with India’s economic growth projected to outshine China’s in 2018 and 2019 (United Nations World Economic Situation and Prospects, 2018) as the fastest growing emerging economy, it seems crucial to identify and understand the true status of firms forming and leading the very premises of the country’s growth. This makes it pertinent for the current study to address the abovementioned issue.
Thus, our study starts by outlining the theoretical difference between financial distress and bankruptcy. It aims to assess the relationships between macroeconomic indicators and the likelihood of financial distress among Indian firms. We also seek to infer whether the determining variables with respect to financial distress in an emerging market economy like India are similar to those of the developed ones or not. Lastly, we try to reinstate our results by testing the predictive accuracy of our models.
A synthetic measure to identify financial distress, on the lines of Bhattacharjee and Han (2014), was adopted. Research tools include a cross-sectional (logit model) technique. Unlike the existing literature where both firm-specific and macroeconomic indicators have been included in models, this study only uses the latter variables and drops the firm-specific data (refer to Tirapat & Nittayagasetwat, 1999). We perform a two-step procedure wherein annual changes in macroeconomic indicators are first incorporated as independent variables against the annual stock returns of firms on an individual basis to generate sensitivities. 1 These sensitivities are then regressed against the binary dependent variable, using a logit model. Also, a firm’s annual stock return echoes both the systematic and firm-specific risk. This work only aims to capture the former since we are more concerned about how the economic forces affect firms as a whole.
The composition of the article is as follows. In the following section, we present earlier research done on the current theme. The third section highlights the dataset and the methodology applied. Results and analysis are reported in the fourth section. The last section of the article presents a brief conclusion.
Review of Literature
The literature on the financial distress theme has been extensive and dates back to the 1930s. Right from the individual ratio analysis to complexities of the artificial neural networks, there have been valuable contributions. Articles majorly have focused on empirical predictions and theoretical models and their overlapping differences (Scott, 1981).
Authors have defined the term ‘business failure’ in several ways. Due to the lack of a uniform definition and the availability of different types of financial distress data, a consensus has not been reached (Crutzen & Van Caillie, 2008). Some of the criteria adopted by previous studies, for instance, are firms delisted from the exchange, breach of debt covenants, credit ratings by agencies, late filing of IT returns, growing concern qualifications by the auditor, inability to pay preferred dividend and a negative net assets value.
With respect to the financial distress definition, we refer to the work of Bhattacharjee and Han (2014). They constructed a synthetic measure of financial distress built over the debt sustainability aspect, along with the criterion to judge any changes (decrease) in assets and equity levels of firms. Data consisted of 1,609 Chinese listed firms from 1995 to 2006. In line with past research, they found gearing and cash flow factors as significant in predicting financial distress likelihood. Other than Shanghai Stock Exchange, which featured majorly large state-owned enterprises, the remaining stock exchanges reported a higher level of financial distress. Results also revealed that weak as well as some private firms were state protected.
Next, we present studies where the importance of macroeconomic changes has been highlighted with respect to the bankruptcy theme. A review by Caves (1998) on firm exits asserted that studies conducted in this theme overlooked the impact of macroeconomic changes deeming it as insensitive. Alternatively, studies measuring firm performance and changes in the macroenvironment of the UK claimed that firm failure and exit highly overlap with changes in the economic environment (Hudson, 1986; Robson, 1996).
From a vast list of macroeconomic indicators, some of the indicators have been found noteworthy, time and again. Liu (2009) applied a vector error correction model and found that firm failure was influenced both in the short and in the long term by bank credit, inflation, profits, interest rate and business births. They reported that monetary policy changes and dealings in the financial and real sector impacted the likelihood of firm failure. Alternate shocks coming from big business houses also caused fluctuations in the overall macroeconomic aggregates. The study by Giesecke, Longstaff, Schaefer, and Strebulaev (2011) applied the regime-switching model and reported that stock returns, stock return volatility and changes in GDP were strong predictors of default rates. Unexpectedly, credit spreads were found non-impacting.
Another article by Carling, Jacobson, Lindé, and Roszbach (2007) found that the output gap, the yield curve and consumers’ expectations added significant predictive power to distress models. Jacobsen and Kloster (2005) intended to identify the macroeconomic indicators that could possibly explain the rise and fall of bankruptcy in Norway. They applied an error correction model over quarterly macroeconomic data of 1991–2004. Results showed that the rate of bankruptcies went high because of changes in profit margins, competitiveness, real interest rate and cyclical fluctuations in the domestic and international economy. Specifically, there was deterioration in competitiveness because of the appreciation of Krone and a strong wage growth. Nam, Kim, Park, and Lee (2008) compared two dynamic models, one with only firm-specific variables and the other that also incorporated the volatility of the exchange rate as a main macroeconomic driver and found that the second was more accurate. On the contrary, Nouri and Soltani (2016) reported an insignificant impact of macroeconomic indicators on the probability of default. Their study was based on a sample size of 53 companies of Cyprus spread over a 5-year period (2007–2012) modelled through a logit model.
The theme of financial distress over time has adopted a number of different techniques. Beaver (1966) laid the foundation of classical cross-sectional statistical methods. These include univariate analysis, multiple discriminant analysis (MDA), linear probability model, cumulative sums procedure, partial adjustment processes and risk index models. Frydman, Altman, and Kao (1985) introduced techniques of artificial intelligence systems to the current theme and recursively partitioned decision trees, neural networks, genetic algorithms and rough sets model were among the most popular ones (Li & Sun, 2009; Liang, Tsai, & Wu, 2015; Zhou, Lai, & Yen, 2012). Overall, the logit model and MDA have been extensively used, despite the availability of several other techniques. The works of Ohlson (1980), Zavgren (1985) and Lennox (1999) reported the logit model being more efficient than MDA, while Gu (2002) and Aziz and Dar (2006) show that both techniques were uniformly good. Notwithstanding some of its limitations and the availability of several advanced techniques, Bhunia and Sarkar (2011) backed the application of MDA in cases where the classification accuracy was given importance. Besides, a recent study by Zhou, Lai, and Yen (2010) reinstated that macroeconomic information improves the prediction accuracy even for studies based on traditional statistical techniques.
In the Indian context, Bandyopadhyay (2006) worked on the corporate bond default data considering only the financial ratios. They obtained a high classification accuracy exceeding 80 per cent both in the estimated sample and in the holdout sample, using a z-score model. Another work by Kasilingam and Ramasundaram (2012) applied Springate’s z-score and Fulmer H-score models to investigate financial statements relating to 124 Indian firms spread over a 5-year period (2005–2009). Nine variables were grouped into three factors using factor analysis. These explained more than 90 per cent variance in the Fulmer H-score model. They concluded that both models predicted bankruptcy in a likewise manner on the basis of a correlation coefficient of 0.81. A more recent work by Agrawal and Maheshwari (2014) analyzed 12 years data using a matched pair sample of 135 defaulted and 135 non defaulted Indian listed firms. They applied two alternative statistical techniques, viz., logistic regression and multiple discriminant analysis. Results reported that stock market sensitivity had a significant positive relationship with the probability of default, and CPI sensitivity had a significant negative relationship with the probability of default.
Data and Methodology
This section has three subparts. First, financial distress as the dependent variable is discussed. Next, we draw attention towards the dataset used in the study. The financial and macroeconomic variables considered are mentioned, along with their sources. The last subpart details the research techniques adopted.
Financial Distress as a Dependent Variable
In this subsection, we first highlight how the concept of financial distress differs from bankruptcy. Second, we focus on the synthetic measure adopted as our dependent variable and why it is preferred over and above other financial distress measures used in the previous studies.
Financial Distress and Bankruptcy: The Difference
This article aims to distinguish between these two terms, bankruptcy and financial distress. The two terms—financial distress and bankruptcy—have been interchangeably used in the literature. Singling out the thin line of difference between the two would assist in understanding them clearly. Financial distress is the temporary inability of a firm to fulfil its debt commitment. On the other hand, bankruptcy filing is a legal course undertaken by a firm to free itself from debt obligations. It is the next step after a firm has been in financial distress for a considerable period of time, and it fails to get reorganized despite of repetitive attempts. Clearly, the time period and involvement of legal authority are the two major points of difference between a financially distressed firm and a bankrupt firm. This study has adopted a synthetic measure of financial distress keeping into consideration the aforementioned definition.
Financial Distress: The Synthetic Measure
There has been a lack of reliable databases with respect to the Indian bankruptcy data. The Reserve Bank of India (RBI, 2017b), in the month of June 2017, came out with its first list of 12 big loan defaulters. 2 The list as per the Insolvency and Bankruptcy Code, 2016, was duly handed over to National Company Law Tribunal (NCLT) (formed under the provisions of the Companies Act, 2013) which is the refereeing authority for insolvency and liquidation matters of corporate entities. A similar list comprising 26 defaulters was released in August 2017. Only those firms in total, as per the literature, is relatively low. Besides, it would be statistically inconsistent if we extrapolate results from these low numbers of firms to a general level.
The Ministry of Corporate Affairs, Government of India, also publishes the defaulters list of private firms. These private firms are not in a compulsion to mandatorily file their annual accounts. Thus, availability of their financial data on a public domain is unsure.
The peculiar nature of the Indian market has witnessed rare exits which can be accounted with respect to the present study. Hence, to realize the general level of financial distress in the economy, we adopted a synthetic measure following Kam, Citron, and Muradoglu (2008) and Bhattacharjee and Han (2014). The measure states that a firm could be in a situation of financial distress if the three next-listed conditions are met:
Interest cover <0.7 (in the current year or the previous year) Decline in fixed assets (in the current year or the next year) Decrease in the share capital (in the current year and the next year)
The base criterion indicates the repayment capacity or solvency status, assessed by the interest coverage ratio (EBIT to interest expense). The higher the ratio, the less the firm is troubled by debt expense. The ideal cut-off is 1.0, while we put a more stringent choice of 0.7 that would ensure that the number of distressed firms is neither too many nor too small.
Nevertheless, a low interest cover could be due to capital accumulation through borrowings which would substantially build up fixed assets in a firm. Likewise, a low interest cover could also be attributed to debt equity swaps, but this sort of retirement of share capital is not likely to go along with a concurrent decline in fixed assets. Therefore, we combine our interest cover measure with the identification of a shrinking firm, taking one from the assets side (a decline in fixed assets) and the other from the liabilities side (a decline in share capital). So, a firm would be designated in the category of financially distressed in a given year if all the three conditions are met. 3
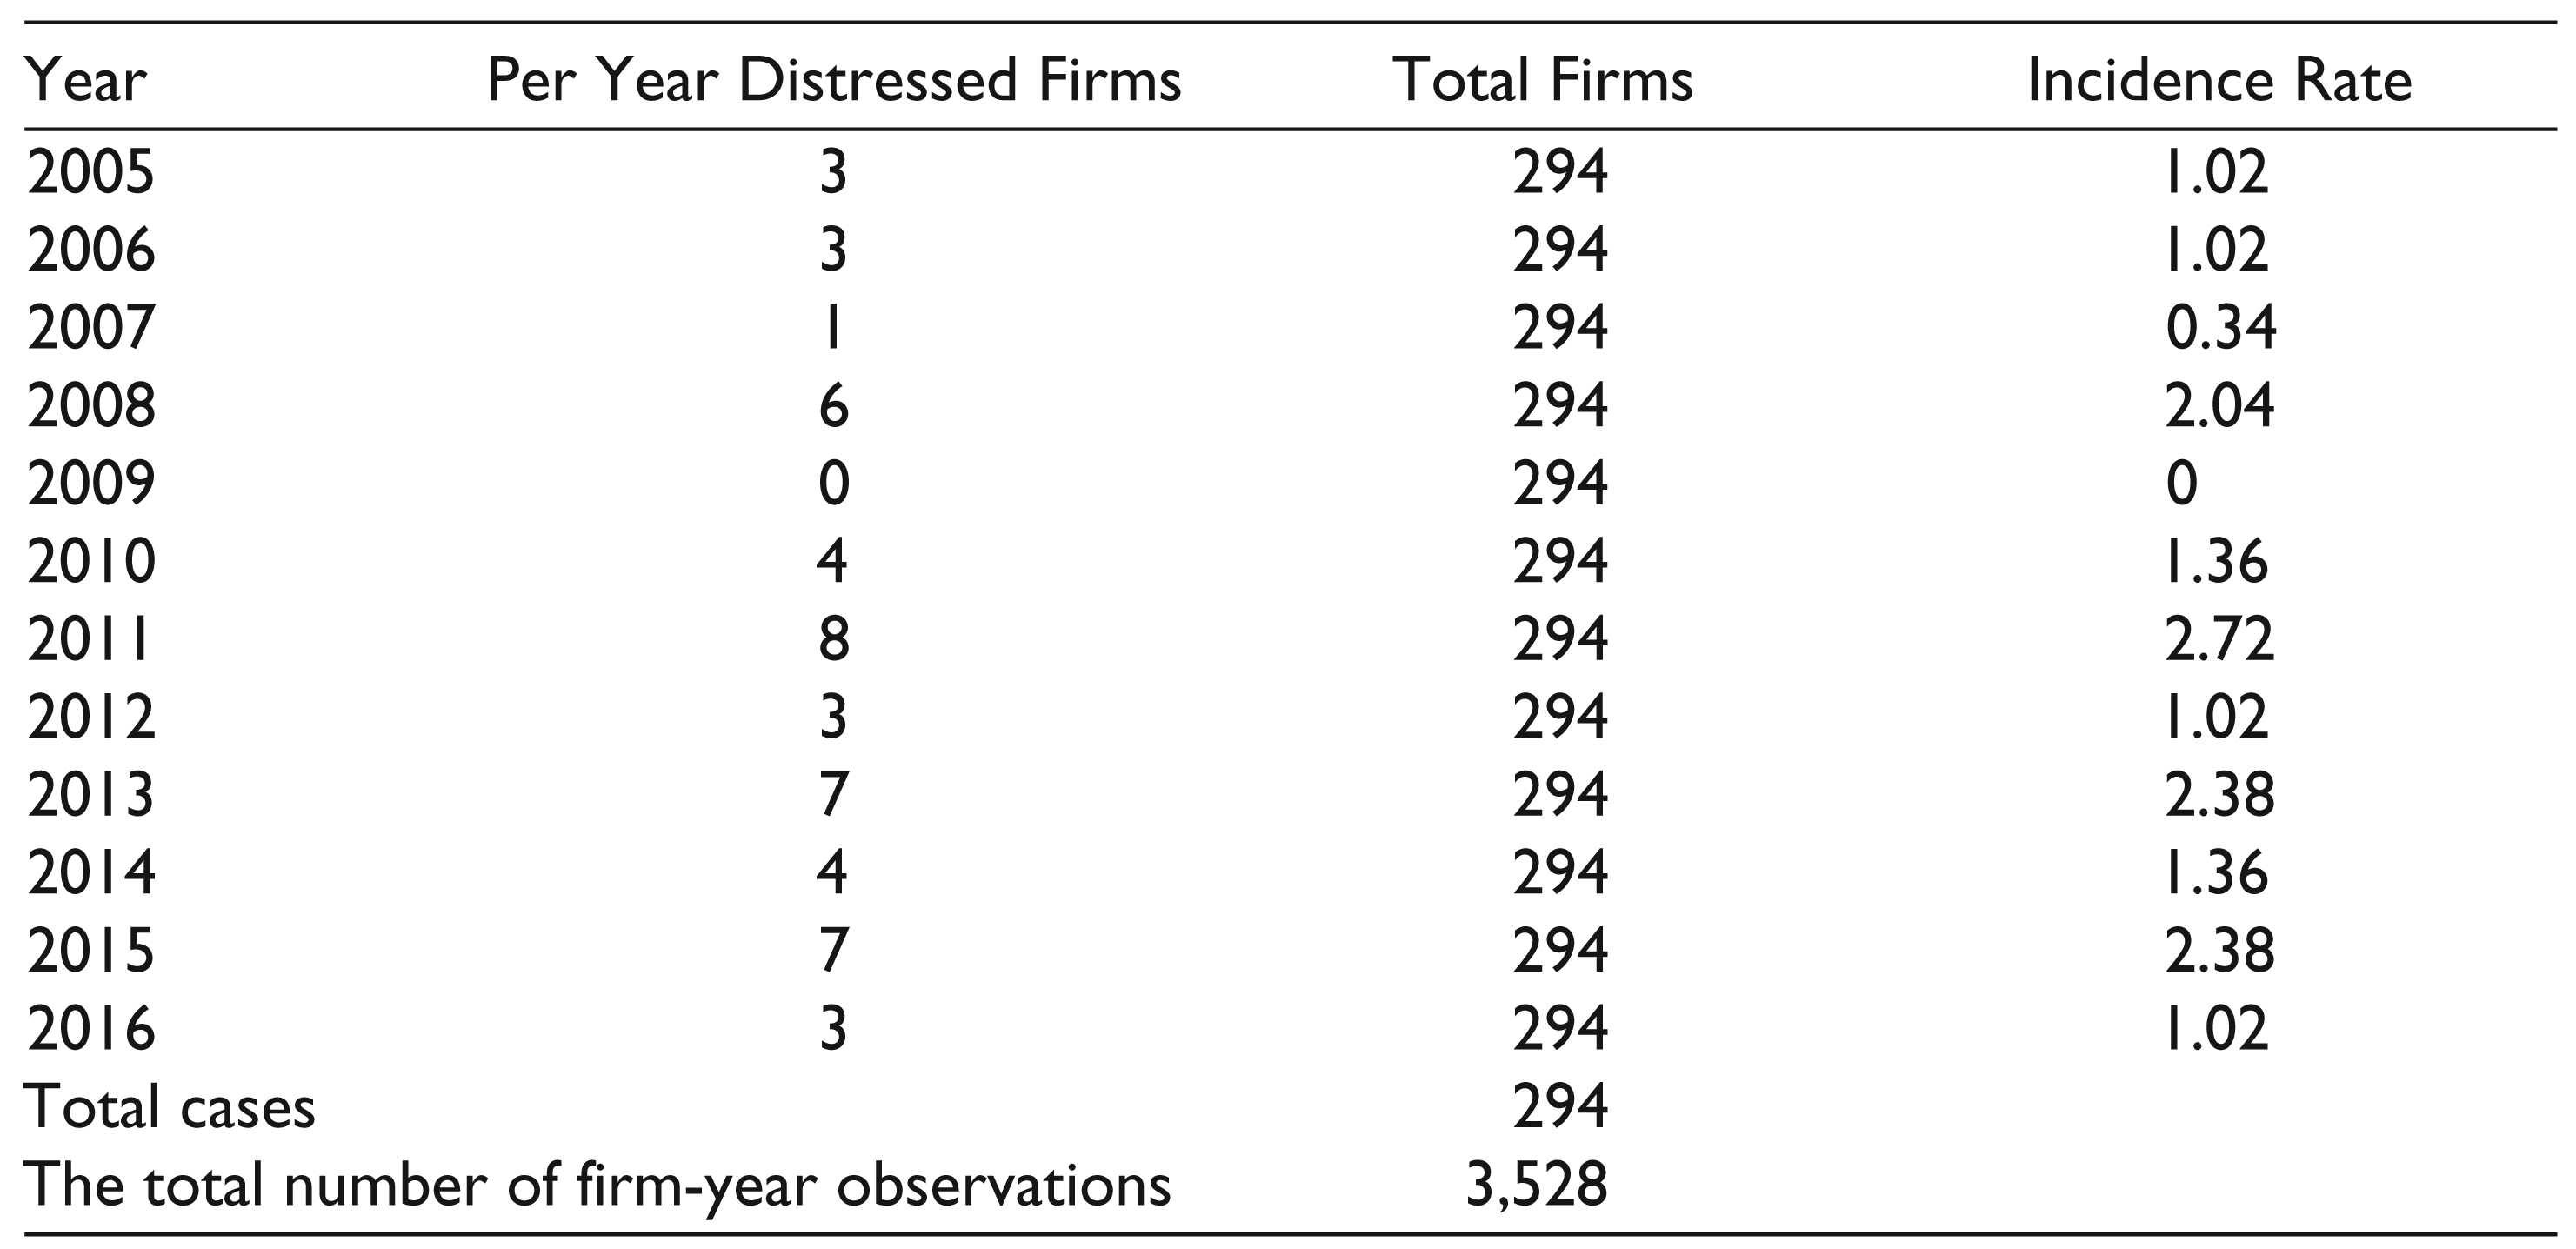
Based on the above measure, 49 instances of financial distress are found in 3,528 firm-years over the 12-year period (2005–2016) as evident in Table 1.
Financial Distress Incidence Rate
Data Source
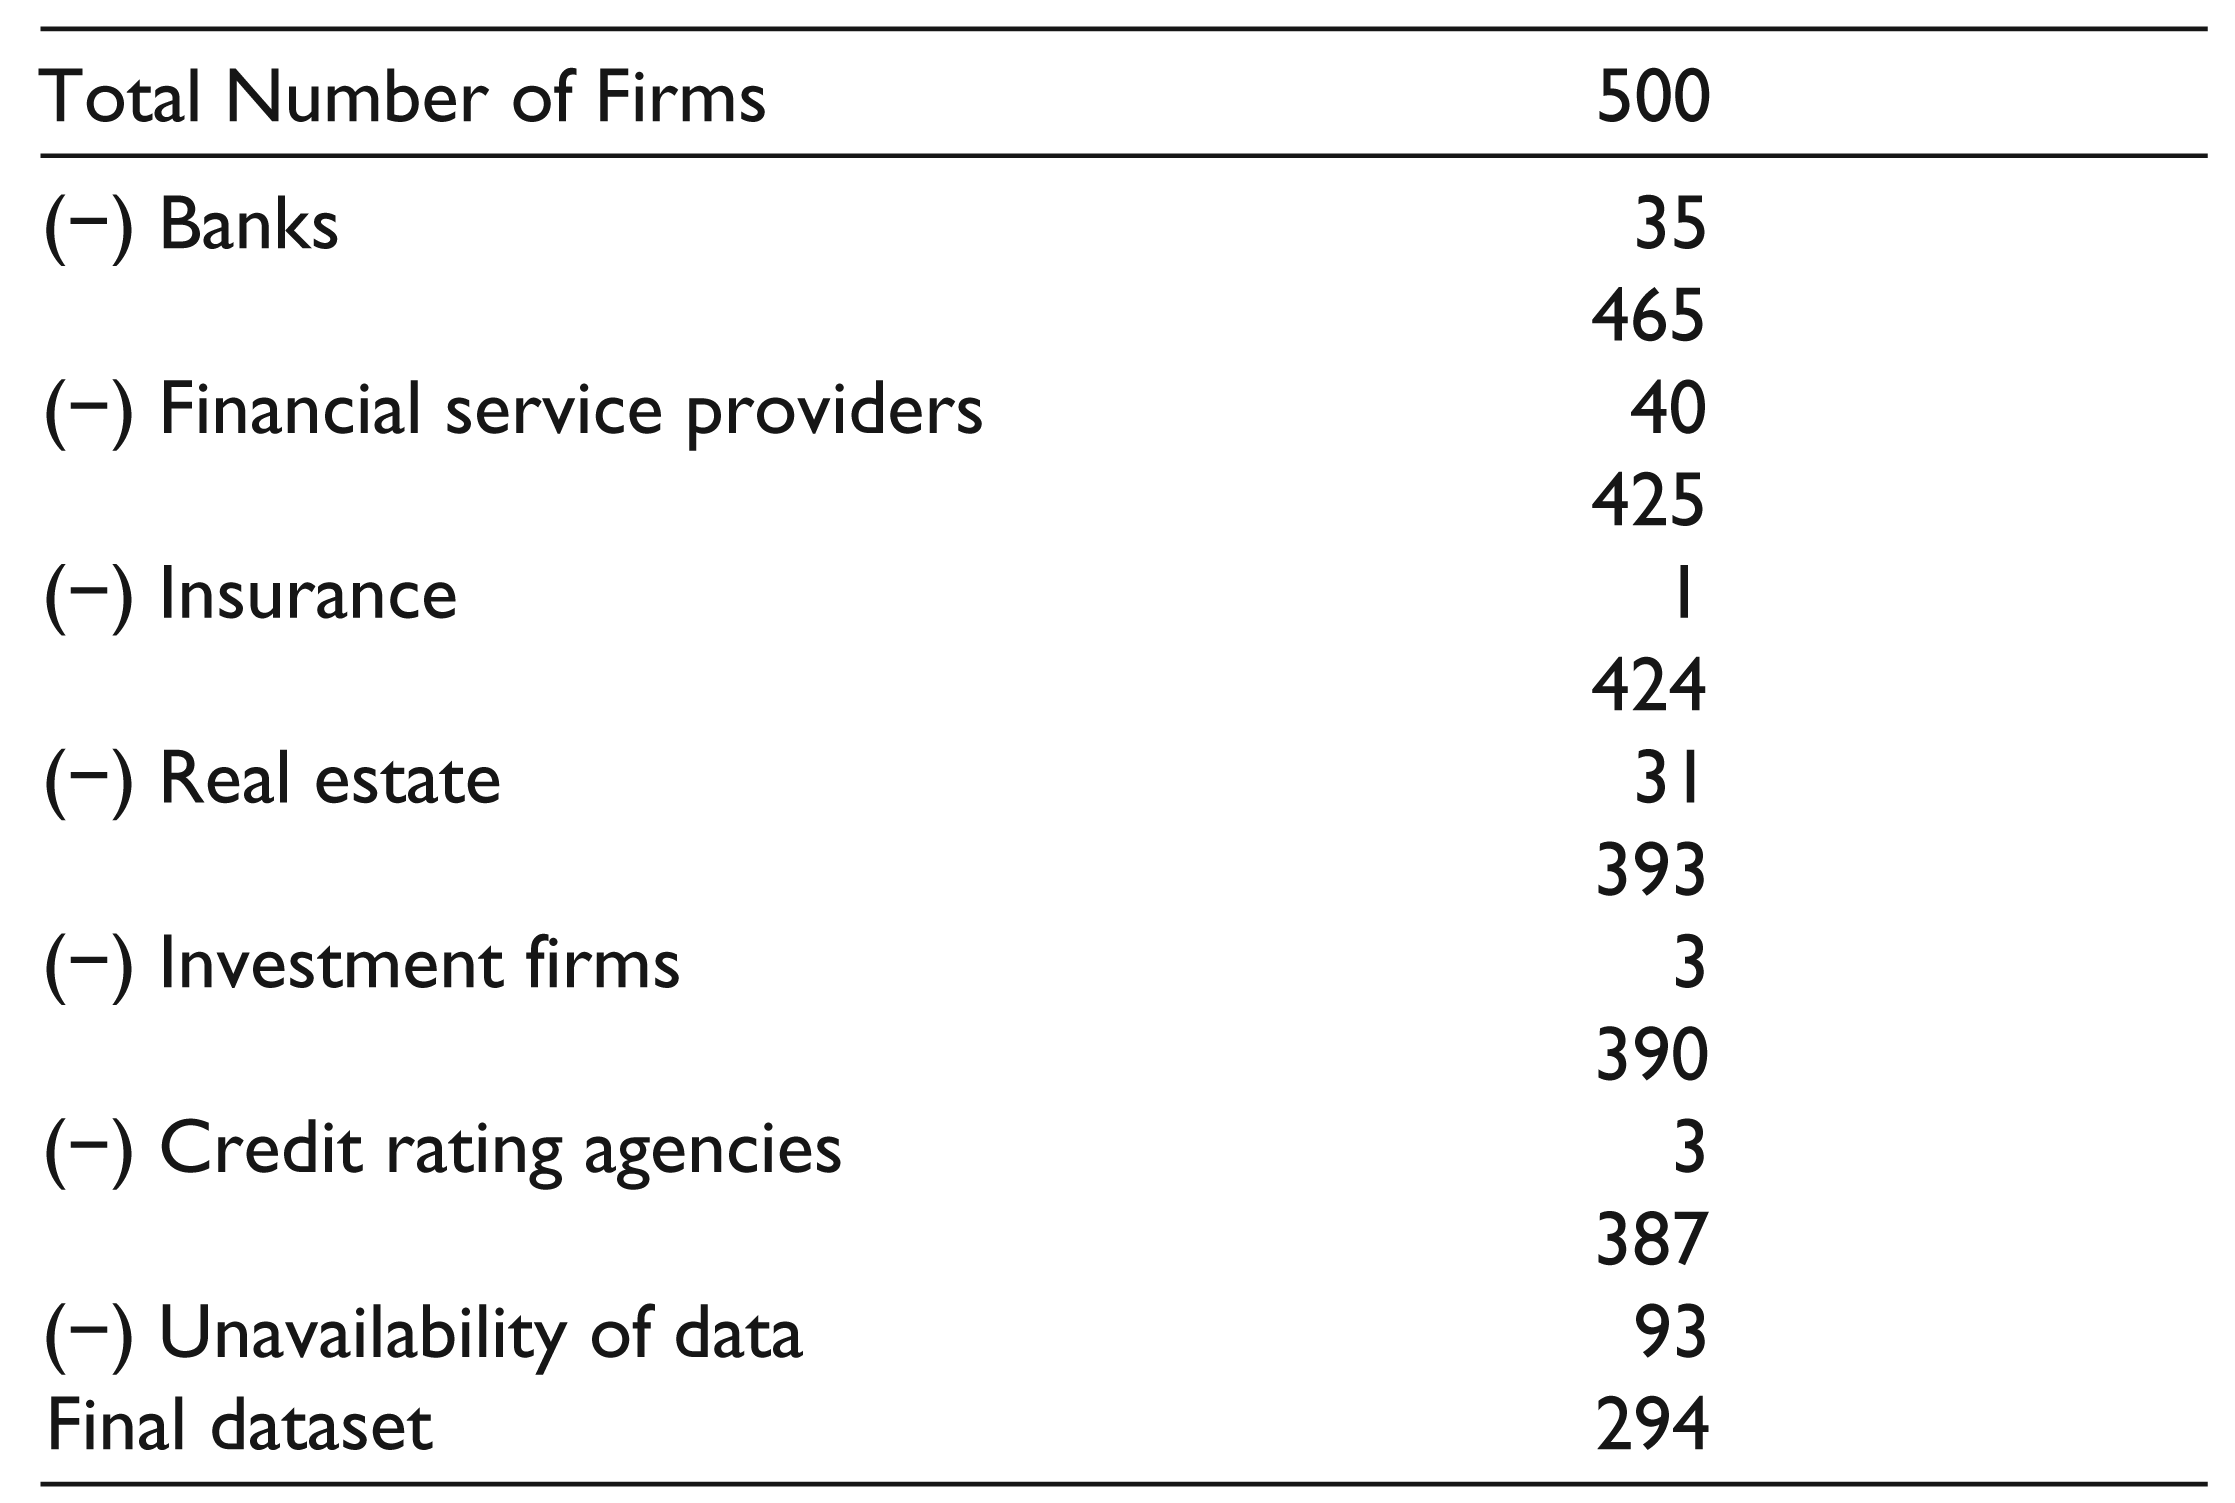
Our dataset comprised information related to annual stock returns and macroeconomic indicators for 2005–2016. The data period was divided into two sets—training (2005–2014) and testing (2015–2016) datasets. We began by considering annual stock returns of all the companies included in the BSE 500 index which represented 93 per cent of the overall market capitalization on BSE. However, financial institutions such as insurance and real estate firms, financial service providers and banks have a different mechanism for maintaining books of accounts which decrease the homogeneity of the dataset. Therefore, they were excluded as a preliminary step. Non-availability of data further reduced our sample size. Finally, a total of 294 firms were taken up for the study. Table 2 presents a break-up of the same. Data was extracted from Prowess IQ database.
Dataset Sample Size
Macroeconomic variables included in the previous research in the financial distress domain have been considered. The variables included are gross domestic product (GDP) at market prices (current price), money supply (both M1 and M3), index of industrial production (IIP), repo rate, exchange rate, 10-year bond yield, bank rate and wholesale price index (WPI). All of these have been rebased at 2011–2012 prices. Data have been taken from the RBI database (RBI, 2017a).
Empirical Model
A logit model was first applied to the theme of financial bankruptcy by Ohlson (1980). It involves the dependent variable to be binary (default/non-default) and groups to be discrete, identifiable and non-overlapping. Given a firm with set predictors, it assumes that there would be a certain likelihood of the firm to default. The binary dependent variable receives the value 0 in the case of a healthy firm and 1 for a distressed firm. The outcome of the model is in the form of a score between 0 and 1, which denotes the extent of default probability. Above that, the interpretation of each of the estimated coefficients can be done individually, thus highlighting each variable’s significance in the model. It does not require the fulfilment of the restrictive assumptions of MDA, and also proportionate samples are not a prerequisite condition.
The logit model can be stated as:

where
P (Y) = probability of the occurrence of the event Y
z = B0 + B1X1 + B2X2 + B3X3 + ……… + BnXn + ε
where Bi = 0, 1, …, n are the estimated parameters, Xj = 0, 1, …, n are the independent or predictor variables and ε is the error term.
B1X1 + B2X2 + B3X3 + ……… + BnXn = regression coefficient multiplied by the value of the predictor.
Analysis
The data is primarily winsorized at the 5th and 95th percentile in order to correct for measurement errors due to the presence of outliers. Then, variables are checked for multicollinearity by calculating the variance inflation factor (VIF) and tolerance. Several threshold limits are set with respect to VIF. A VIF value of less than 10 and the tolerance above 0.1 or a VIF value of less than 5 with tolerance above 0.2 is acceptable.
The VIF and tolerance values presented in Table 3 indicate that our model seems to be unaffected by issues of multicollinearity.
Variance Inflation Factor and Tolerance

Empirical Results
The results of the logit model presented in Table 4 report a significant chi-square value at the 0.01 level. Out of a possible seven macroeconomic variables, IIP sensitivity, exchange rate sensitivity, 10-year bond yield sensitivity and bank rate sensitivity are significant. However, in line with the prior studies, we would consider only the first three variables because of the acceptable 0.05 or below significance level. IIP is a composite indicator which computes the short-term changes in the production volume of a basket of industrial products during a specific period in relation to a chosen base period. Around 40.27 per cent of the weight of items that comprise the IIP are from the eight core industries, namely, cement, coal, crude oil, electricity, fertilizers, natural gas, refinery products and steel. A negative relationship is found between IIP sensitivity and the probability of firms being in financial distress, similar in the lines of Figlewski et al. (2012). This simply implies that as the IIP boosts, the likelihood of firms being in financial distress decreases.
Logit Model Results

We obtained a negative relationship between the exchange rate and the likelihood of financial distress, similar to the works of Jacobsen and Kloster (2005) and Fung (2008). The reason behind the negative relationship could be deterioration in the competitiveness due to factors like strong domestic exchange rate and high wage growth.
A significant negative relationship is reported between the 10-year bond yield and the likelihood of financial distress. A plausible explanation for this negative relationship is as follows. The 10-year bond yield is the return on the government debt obligations. It has an indirect positive influence on other interest rates, including the rate individuals and firms pay while borrowing money for their capital expenditures. Thus, if these rates rise, the cost of capital to firms would also rise. This additive increase would only pressurize those firms’ balance sheets, which have a higher sensitivity to this variable, thereby exposing those firms which have a higher likelihood of being in financial distress. Overall, it could be inferred that the higher the sensitivity of a firm to these variables, the lower would be their likelihood of being in financial distress because of the negative relationships observed.
Classification Matrix
It is one of the standard tools for the evaluation of statistical models. It helps in assessing results obtained by determining whether the predicted values matched the actual ones.
The estimated parameters, along with the predictor values, form Equation (2). This equation is in turn used to calculate the individual default probabilities of firms according to the following:


Prior research have considered a default cut-off probability of 0.50 (Kim & Gu, 2006; Lenard & Alam, 2009; Tseng & Hu, 2010). Accordingly, firms with financial distress likelihood greater than 0.50 are sorted into the financially distressed group, while firms having likelihood lower than 0.50 are classified as healthy. However, we have let the cut-off to be determined by the data characteristics.
Tables 5–7 present various cut-off rates, along with their prediction accuracy. For instance, Table 5 depicts the full-sample classification accuracy of financially distressed and healthy firms. Crucial points to be mentioned here are the type I and type II errors. 5 Tirapat and Nittayagasetwat (1999) argued that type I errors are costlier than type II errors. 6 Therefore, we emphasize more on decreasing the type I error by identifying the ideal cut-off point that can correctly differentiate the financially distressed firms, rather than the healthy ones, at a superior rate.
Full Sample Classification Accuracy
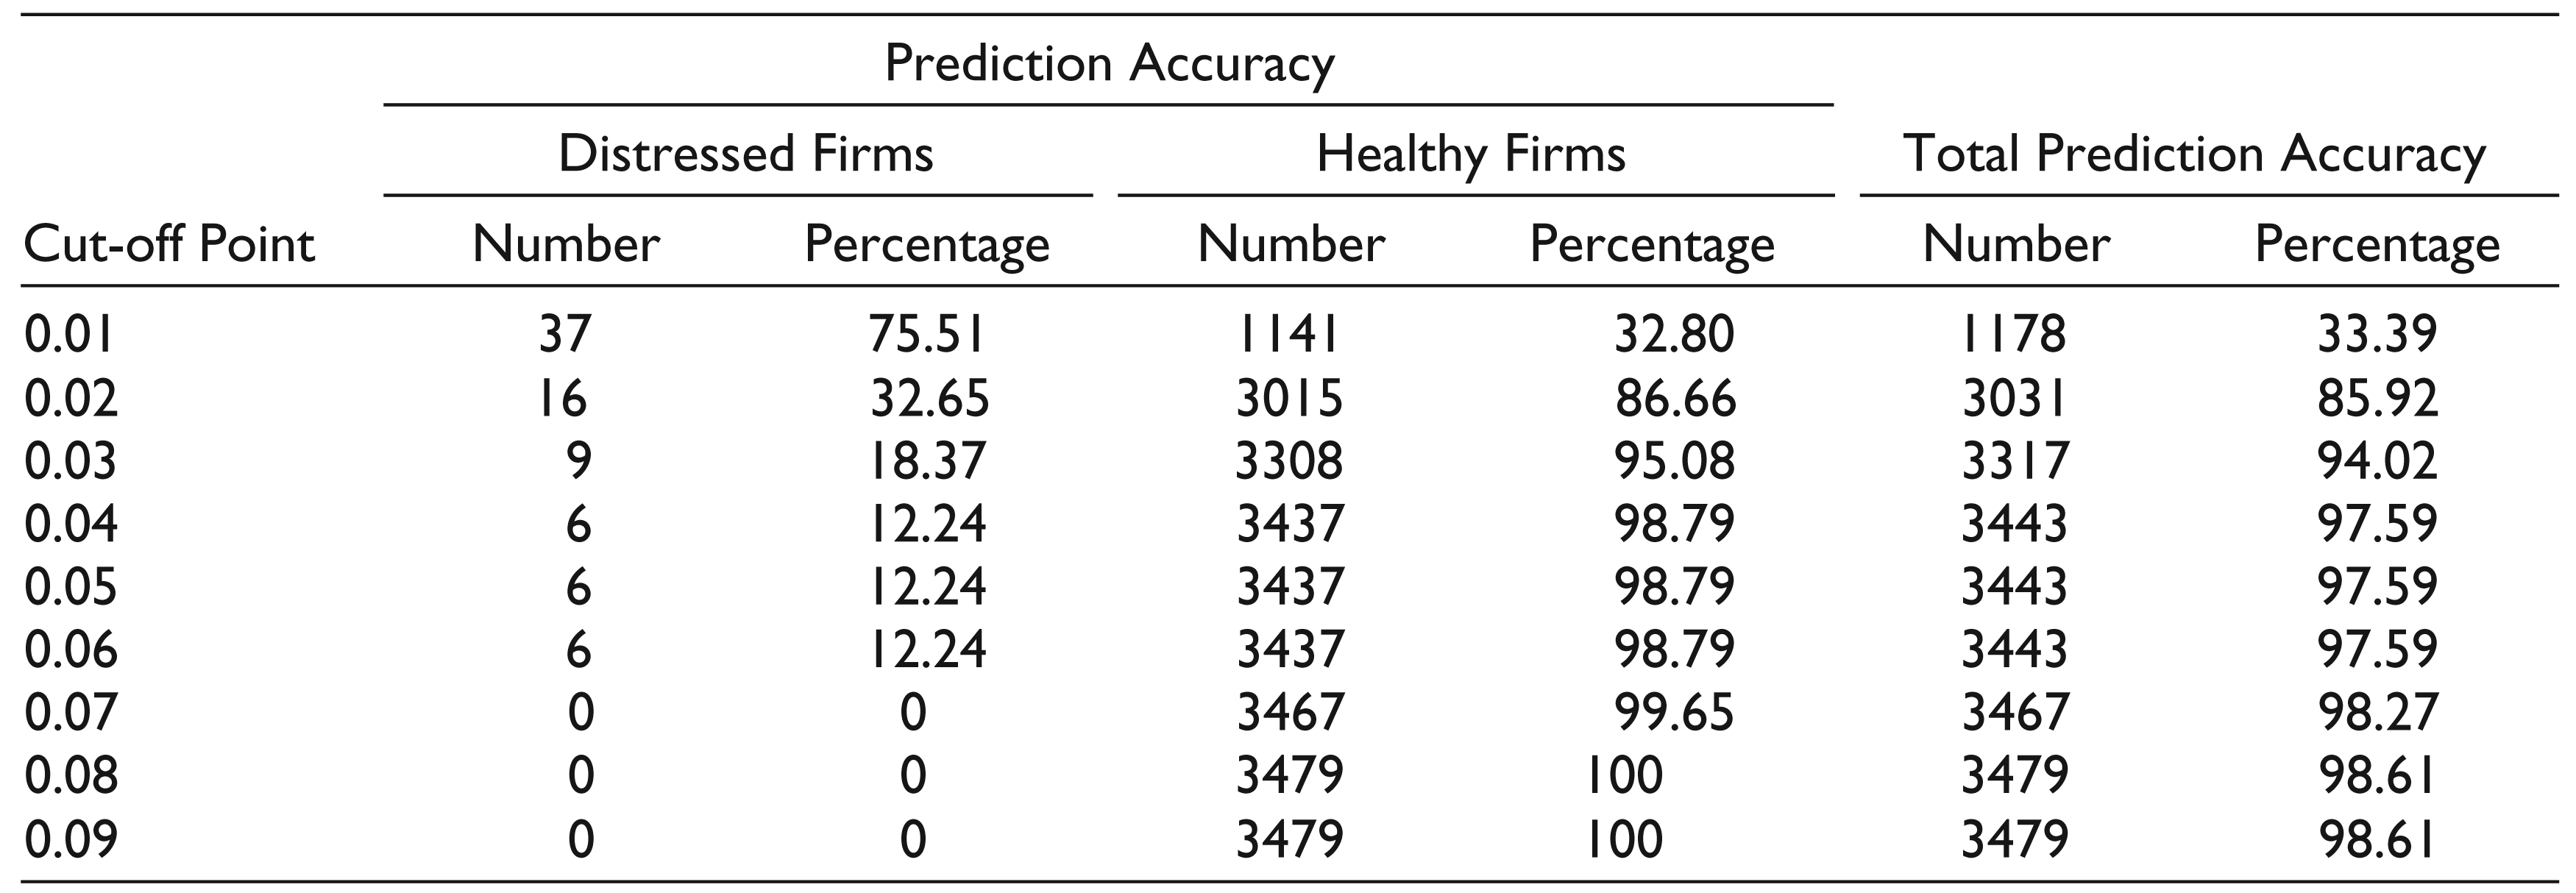
Also, since we aim to emphasize more on optimizing the type I error, we focus majorly on how accurately the financially distressed firms are categorized into their original grouping. As the cut-off rates increase, the classification accuracy for the distressed firm groups decreases.
Evidently, the 0.01 cut-off rate in Table 5, reports the best prediction accuracy. This implies, that around 75.51 percent of the financially distressed firms are correctly categorized into their original group.
The complete sample is divided into two—training and testing datasets—in order to validate the test results. Classification accuracy has been calculated using the same steps and is presented in Tables 6 and 7, respectively.
Training Dataset Classification Accuracy

Similarly, Table 6 presents the training dataset wherein the highest prediction accuracy is accounted at the 0.01 cut-off. Using the coefficients and predictors obtained from the results, 79.49 per cent firms in the training dataset were correctly classified as true positive. However, the testing dataset reported a classification accuracy of 70 per cent (refer to Table 7) accounted at a 0.01 cut-off level.
Testing Dataset Classification Accuracy

The Hosmer and Lemeshow test is a goodness of fit test for the logit model, especially for risk prediction models. Given that the null hypothesis is that the ‘observed and expected proportions are the same,’ a significant chi-square value rejecting the null hypothesis might indicate some form of misspecification in the model. As per Table 8, our model accepts the null hypothesis. This implies that our model has been effective in predicting the behaviour of the data, and the three variables found significant have decent explanatory power to discriminate between financially distressed and healthy firms.
Goodness of Fit Test

Harmonic Mean
An additional classification test was performed wherein the classification cut-off for segregating the financially distressed firms from the healthy ones was the harmonic mean of the probabilities. The harmonic mean was considered as the data characteristics highlight two major points. Our sample first consists of fractions, and second it has extreme values (either too big or too small). 7
Results for the training and testing datasets are reported in Table 9. Keeping in view the motive of optimizing the type I error, we focus on the prediction accuracy of distressed firms in both datasets. A classification accuracy of 76.92 and 70 per cent was reported from the training and testing datasets. The results with respect to the harmonic mean cut-off were closely similar, if not better from the 0.01 cut-off.
Classification Accuracy with Respect to Harmonic Mean
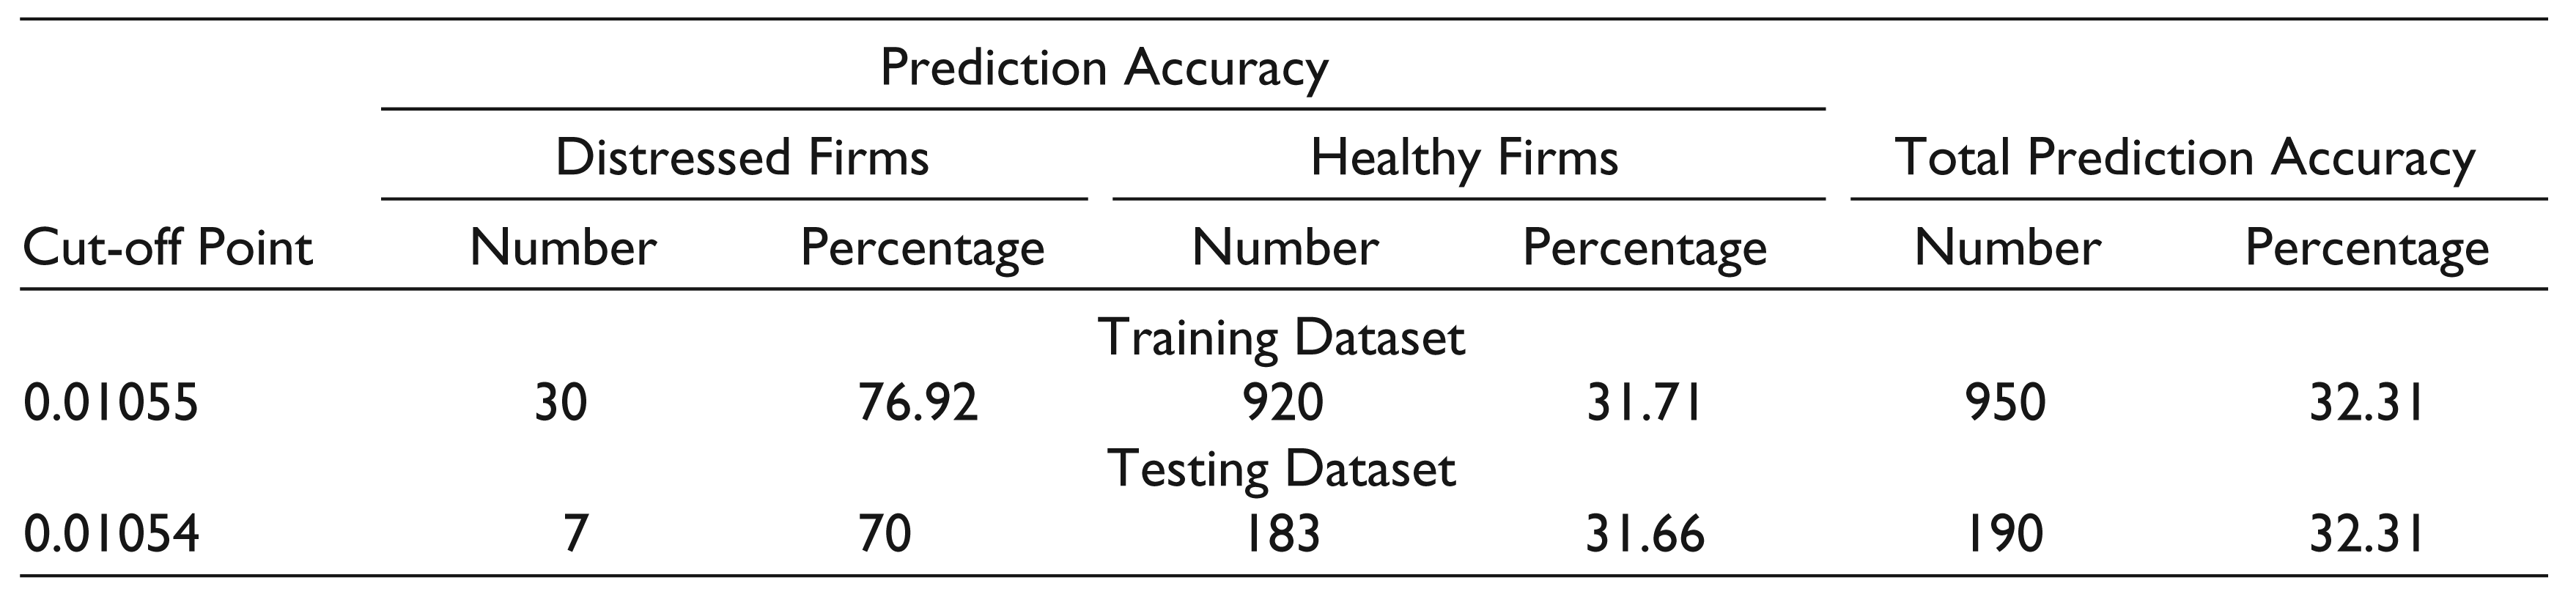
Testing dataset sample size = 588, distressed firms = 10 and healthy firms = 578.
Conclusion
The current study aims to identify the macroeconomic indicators which could impact the likelihood of financial distress among the 294 firms included in the BSE 500 index. Twelve years of data (2005–2016) were analysed using a logit model. A more robust measure which focused on the repayment capacity of firms, along with eyeing the assets and liabilities sides of the balance sheet, was adopted from the work of Bhattacharjee and Han (2014). This dependent variable was a binary, considering 1 in the case of financial distress and 0 otherwise.
The study involved a two-step procedure. Primarily, the impact of macroeconomic indicators was examined by incorporating them in the form of sensitivities against the annual stock returns of individual firms. In the second step, the coefficients obtained from above were then drawn against the binary dependent variable explaining financial distress. In other words, the macroeconomic indicators were first aligned against firms’ stock returns to generate sensitivities and then these sensitivities were regressed against the binary dependent variable that would segregate the financially distressed firms from the healthy group of firms.
IIP, the exchange rate and a 10-year bond yield have been found significant in impacting the likelihood of financial distress. Investment managers and regulators could find value in integrating these macroeconomic indicators while considering the credit risk. They would need to consider their trend as movements in these indicators could result to the extent of causing variations in returns. Also, since we have considered an aggressive cut-off of 0.7 with respect to the financial distress definition, users of this information could identify signs of financial distress well in time.
An important observation that could be drawn from our results is that the macroeconomic indicators found in our study have also been reported significant in studies based on advanced economies (refer to Figlewski et al., 2012; Fung, 2008). Thus, it could be inferred that the macroeconomic indicators determining financial distress likelihood might not be very different across the developed and emerging economies.
The results from our work emphasize the importance of macroeconomic indicators against the financial distress backdrop in an emerging market context. This work could further be extended to several other dimensions. Particularly, an in-depth survival analysis could be conducted with respect to the exchange rate indicator, as different firms get affected to different degrees based on their affiliated industry’s dependence on exports and imports. The role of internal information (corporate governance mechanisms) could be examined individually as well as with the macroeconomic and financial data. While our work has been confined to a single emerging economy, similar efforts with respect to other emerging nations could substantiate the importance of macroeconomic indicators in this theme.
Footnotes
Declaration of Conflicting Interests
The author(s) declared the following potential conflicts of interest with respect to the research, authorship and/or publication of this article: On behalf of all authors, the corresponding author states that there is no conflict of interest.
Funding
The author received no financial support for the research, authorship and/or publication of this article.
Acknowledgements
The authors are grateful to the anonymous referees of the journal for their extremely useful suggestions to improve the quality of the article. Usual disclaimers apply.