



Abstract
This research aims to develop an integrated model for assessing island destination service quality, maritime passenger transport service quality, destination environmental competitiveness and their direct/indirect effects on tourist satisfaction and behavioural intentions, and further assess the cyclic nature of behavioural intentions in destination e-image formation. The study adopted the convenience sampling method, and the data were collected from 384 visitors at Koh Larn Island in Pattaya City, Thailand. The survey questionnaire was developed based on the literature review and expert opinion and tested for validity and reliability by using reliability statistics, exploratory factor analysis and confirmatory factor analysis; and achieved the required model fit. Further, the causal impacts were tested using structural equation model. The study confirmed the cyclical effects of behavioural intentions and its influence on destination e-image formation; and such destination e-image has a positive relationship in creating the visitors’ perception towards the destination environmental competitiveness and quality of all the services consumed during their trip. Thus, the results revealed that the model is suitable as an integrated approach for assessing tourists’ satisfaction and behavioural intentions towards the island destination. Further, this study extends the behavioural intentions literature based on changing modern-day service consumption patterns.
Keywords
Introduction
Easily accessible, ‘not so far away’ small island destinations offer a unique travel experience. Though the geographical location and natural resources are the major ‘pull’ forces, the infrastructure such as accessibility, transportation, activities and socio-economic factors are also major determinants of destination development (Sharafuddin, 2015a; Yang et al., 2016). Therefore, effective destination management must adopt a widely integrated approach by covering all the service aspects to be successful in tourism (Jones & Haven-Tang, 2005). Hence, maritime passenger transport systems such as shuttle ferry services play a vital role in the sustainable development of island destinations. However, to the best of the authors’ knowledge, the literature on the role of maritime passenger transport systems on visitor satisfaction and island destination loyalty is scarce (Sharafuddin & Madhavan, 2020b). This is because, in academia, researchers in the transportation and engineering domain study transportation service quality while researchers in the tourism domain pursue destination and hospitality-related service quality. However, in a real-world situation, a visitor views all the services including the transportation and hospitality services in a destination as a whole element of their trip (Kim, 2018; Sharafuddin & Madhavan, 2020a). Thus, there lies a literature gap in research related to destinations such as islands and remote locations, where transportation and accessibility play a vital role. Hence, this research aims to develop an integrated approach for assessing the ‘maritime passenger transport service quality,’ ‘island destination service quality’, ‘Destination environmental competitiveness’ and their relationship with the visitor satisfaction, and behavioural intention. It further explores the affective relationship of visitors’ behavioural intentions in co-creating destination e-image through user-generated contents in various social media networks. The rationale for including the visitor’s behavioural intentions and its affective relationship in co-creating destination e-image is due to the evolving changes in tourist behaviour and consequently rising academic interest in the ‘digital behavioural intentions’ of tourists. Several studies in recent years, particularly since the COVID-19 pandemic, have focused on the ‘digital behavioural intentions’ of tourists (Al-Bourini et al., 2021; Choirisa et al., 2021; Noviyati Nabila et al., 2021; Ruhamak et al., 2021; Tavitiyaman et al., 2021) But the majority of the studies are limited towards the user generated contents, widely coined as ‘electronic word of mouth’ (e-WOM). Such studies ignore the role of digital marketing investment and the efforts of several tourism entities working to build the destination image. Therefore, this study coined the word ‘destination e-image’ to define the overall psychological image formed through electronic contents either produced (own digital contents, both published and unpublished) or accessed (both commercial and non-commercial digital contents produced by others) by visitors and framed the hypotheses based on available literature. Further, precise qualitative research was also conducted using the conversational interview technique with tourists visiting Koh Larn Island to identify the cyclic causal relationship between behavioural intentions and destination e-image formation. The results of the qualitative study revealed that there is a cyclic relationship between digital behavioural intention and the actual behaviour of revisiting the destination (Sharafuddin et al., 2021). But the study was based on random sampling and conversational interview approach; hence the statistical relationship of the cyclic effects was not studied. Therefore, in continuation with the recommendations from the previous study, this study adopts a quantitative approach of questionnaire-based data collection and statistical technique of structural equation modelling to test the hypotheses.
The literature review, methodology, descriptive statistics and hypotheses testing using a structural equation model, discussion, conclusion, implications, limitations and directions for future research in this domain are presented in the following sections.
Literature Review
The intensive literature review was conducted with the following inclusion and exclusion criteria. The inclusion criteria of the articles reviewed in this study are (a) Peer-reviewed academic articles published from 1970 to 2021. This broad range of time-period is due to the need to review the origin of classic theories such as service quality and their adoption in tourism studies. (b) Articles written and published in English language. (c) Studies that either develop and test a new scale or explicitly test the causal relationship between the latent variables of destination e-image, maritime passenger transport service quality, destination service quality, destination environmental competitiveness, tourist satisfaction and behavioural intentions. (d) Studies that focus on island destinations. The exclusion criteria for the articles were (a) grey literature, (b) articles not published in the English language, (c) literature review and commentary articles, and (d) full articles not accessible.
Destination E-image and Its Relationship with Behavioural Intentions
The ‘destination image’ in the tourism marketing context is the complex psychological image of products and services formed in the minds of tourists and potential tourists. This can be a pre-visit destination image and post-visit destination image (Beerli & Martín, 2004b). The pre-visit destination image is the influencer of the potential visitors’ expectations. Such expectation formation towards a destination image is related to motivation, experience and other socio-demographic characteristics of individuals (Beerli & Martín, 2004a; Sharafuddin & Madhavan, 2020a). In addition, external factors such as marketing efforts by tourism authorities, travel agencies, tour operators, hotels, restaurants, influence marketers, referrals and word-of-mouth also influence the expectation formation. In recent years, since the rise of social media platforms and high-quality camera smartphones, the expectation formation of destination image in the minds of potential visitors is highly influenced by the digital marketing efforts of the tourism organizations and digital footprints of the earlier visitors. Such digital footprints vary from simple geo-tagged locations with visitor sentiments through emojis to 4k full-length videos with detailed experience. Walden-Schreiner et al. (2018) used user-generated spatial data to assess the visitor distribution and movement patterns in Hawaii Volcanoes National Park. It was evident from the research that the visitor’s movement pattern was near the natural environment and infrastructure. The researchers reported the similarity in the pattern of visitor movement and photos taken at geo-tagged locations. This also proved the influence of user-generated Flickr photos on the visitors’ movement and behaviour. Hence, it is obvious that the user-generated digital content influences the perception towards a destination and further influences similar activities of visitors during their visit. Though the photos taken by the visitors are influenced by the previously seen images of the destination; they all do not mean the same (Caton & Santos, 2008). Because Stepchenkova and Zhan (2013) compared the destination marketing organizations (DMO) projected image of the destination and tourists’ user-generated destination image and their study found that the user-generated content offers a more eye-for-detail of the tourists’ interests and it directly reflects the visitors’ perceptions. Such factual photographs form certain expectations in the minds of potential tourists, which further affects their perceptions during the moment of truth (Kim & Stepchenkova, 2015). In addition, Dinhopl and Gretzel (2016) addressed the growing dominance of individual representation in photographs taken by visitors at the destination. However, similar to other tourists who take photographs of the destination (Rakić & Chambers, 2012), self-representative tourists, with their selfie images, also construct the meaning of the destination through various self-indulged activities (Dinhopl & Gretzel, 2016). Månsson (2011) documented the cyclical relationship between destination-image production process and replicative consumption. From the above literature, it is clear that the digital footprints of visitors play a crucial role in continuously reshaping the destination image. Since it is replicative in nature, the activities and images take snowball effects, and the positive destination image will further lead to high expectations whereas a negative destination image will lead to low expectations which will further affect the perception during the visit. Hence, the overall service quality of the destination is one of the crucial elements reshaping the destination image. Though there are several computer science-related studies for assessing the user generated destination image (Bastidas-Manzano et al., 2021; Cao et al., 2020; Marine-Roig & Anton Clavé, 2015), research on the psychological factors that drive the psychical destination image formation through digital user-generated contents is relatively new. A recent study by Wang et al. (2021) found that tourist perception on destination image changes during on-site visit and post-visit through the specific process of each tourist visit. Therefore, in this research, we adopt the keyword ‘destination e-image’ to mention the digital destination image formed through various sources, including user-generated content in various social media platforms such as Facebook, Twitter, Instagram, Flickr and other digital platforms. Hence, the destination e-image formed by the visitors’ user generated contents acts as a strong digital-word-of-mouth influencer in potential visitors’ decision-making choices. Therefore, the following hypothesis was formed.
Destination E-image, Destination Service Quality and Destination Environmental Competitiveness
The destination e-image influences the destination service-quality expectations of potential visitors. If the user-generated-contents of the previous visitors project a high quality of environment and services, the potential visitors surfing and gaining knowledge of earlier visitors’ experiences from the internet will also develop similar expectations for their visit. But the quality perception of the destination’s natural attractions and services also significantly differ based on the tourists’ social-cultural factors, such as country of origin (Dedeoğlu et al., 2020). In tourism marketing literature, the concept of service quality is inspired by the early marketing literature and the conceptual service quality models of Parasuraman et al. (1985), Zeithaml et al. (1996). Babakus and Boller (1992) suggested that the service quality dimensions depends on the type of service industry and service under study. Hence, the variables selected, and statistical tools used within the tourism industry vary due to the dynamic nature of the industry. There are several research conducted in the past to assess sectors within the travel and tourism industry, such as SERVQUAL for airlines (Chou et al., 2011; Tsaura et al., 2002), hotels (Akbaba, 2006; Wilkins et al., 2009), restaurants (Ryu et al., 2012; Stevens et al., 1995), ECOSERV for ecotourism (Khan, 2003) and tour operations (Hudson et al., 2004). However, potential tourists will view the destination from their consumption point of view. Hence, various factors such as individual stimuli, features, facilities and overall attributes of the destination influence the pre-purchase destination selection process of potential tourists (Sharafuddin & Madhavan, 2020a). Thus, the consumption of services at a destination is not limited to one particular product or service but the essential tourism-related services of the whole tourist destination itself. However, limited research is available from the potential tourists’ consumption point of view. Wang et al. (2007) adopted a multi-stage approach for assessing the quality of group tour packages with ‘transportation’, ‘hotel accommodation’, ‘shopping arrangement’, ‘optional tour’, ‘tour leader’ and ‘local guide’ as variables. Tosun et al. (2015) adopted the ‘destination benchmarking’ concept of Kozak and Rimmington (1998) and the ‘destination product’ concept of Murphy et al. (2000) to develop the ‘destination quality’ model. They argued that all organizations in a destination offering tourism services are ‘interlocked’ and together form the destination service quality and thus measured the destination quality with ‘destination service quality’ (‘accommodation’, ‘local transport’, ‘cleanliness’, ‘hospitality’, ‘activities’, ‘language’ & ‘airport’) and ‘destination natural quality’ (‘location’, ‘culture’ & ‘pure beauty’). Several researchers viewed the natural quality of nature-based tourist destinations as the major element of destination competitiveness (Hu & Wall, 2005; Lundie et al., 2007; Mihalič, 2000; Murphy et al., 2000). Because a well-maintained sustainable natural environment will lead to tourist satisfaction and further lead to long-term positive appeal for selected target market segments (Hassan, 2000). Geographical research areas like the one in this research, that is, small islands, are unique in the environment, and the majority of the service providers are MSMEs (micro, small and medium-sized enterprises) in nature. Haven-Tang and Jones (2005) summarized the coherence between the ‘public-sector interventions’, ‘tourism SME (small and medium enterprise) approaches’ and ‘destination coherence.’ Other than the periodic approaches such as framing policies for operations, quality, standards, budgeting, funding, human resource development and skill training, visitor-based approaches such as marketing and market intelligence are crucial to take advantage of the full potential of the near real-time situation and maximize the destination competitiveness; especially, the public-private interventions in managing the destination e-image (Arlt, 2005; Getz et al., 2005). However, the visitors’ perception of the quality of tourism SME services is significantly different from that of large enterprises such as five-star chain hotels (Michael Hall & Rusher, 2005). Service providers’ knowledge and skills’; ‘business behaviours’ such as personalized sales and service; and ‘service attitude’ were the pre-dominant factors determining tourism SME service quality (Jones & Haven-Tang, 2005), which will collectively lead to destination service quality. Surprisingly, there is very limited research which discuss the relationship between the quality of services offered on an island and the destination environmental competitiveness. Mechinda et al. (2010) investigated the competitiveness factors of Koh Chang Island in Thailand and found that both quality of service and natural resources significantly influence tourist loyalty. However, the causal relationship between the destination environmental competitiveness and island destination service quality has not yet been studied.
Therefore, the construct for assessing the destination e-image, destination service quality and destination environmental competitiveness was adopted from the above literature, and the following hypotheses were formed:
Maritime Passenger Transport Service Quality (MPTSQ)
Maritime passenger transport systems such as ferry services play a vital role in island destination development. They are also an integral part of passenger transport systems in Southeast Asian countries and other archipelago regions. One of the earliest studies in assessing the service quality of maritime passenger transport services with special reference to ferries can be traced back to Pantouvakis (2007). The author assessed the service quality of ferry services using (a) Quality of Service (‘Confidence’, ‘Empathy’, ‘Viability’, ‘Politeness’, ‘Safety’, ‘Local’, ‘Speed’) and (b) Convenience (‘Departure’, ‘Arrival’), (c) Price (‘Cheap’, ‘Value’) and (d) ‘Availability’ and found them to be the determinants of satisfaction. Mathisen and Solvoll (2010) assessed the maritime passenger-transport service quality using 16 service elements such as (a) ‘frequency’, (b) ‘opening hours’, (c) ‘Schedule’, (d) ‘Fare’, (e) ‘Discount’, (f) ‘Regularity’, (g) ‘Punctuality’, (h) ‘Capacity Summer’, (i) ‘Capacity Winter’, (j) ‘Ferry Size’, (k) ‘Comfort’, (l) ‘Speed’, (m) ‘Information’, (n) ‘Service’, (o) ‘Cleaning’ and (p) ‘Catering’. They segmented the respondents into enterprises, household commuters, Business travellers and leisure travellers and found that comparatively, leisure passengers gave less importance to all the service elements. However, they were more satisfied with the capacity. Tanko et al. (2019) assessed the satisfaction of passengers using an urban water transit system. The authors used three attributes and related variables as; (a) service (‘frequency’, ‘network’, ‘access’, ‘punctuality’), (b) comfort (‘cleanliness’, ‘calmness’, ‘open marine environment’, ‘view from the boat’) and (c) productivity (‘ability to work’, ‘space to work’, ‘smoothness of the ride to work’) and found that the comfort attributes were more appropriate in assessing the passenger satisfaction. However, those studies were more precise towards the core operations of the vessel but did not include the services such as ease of booking, waiting area and jetty services. Hart et al. (2020) assessed the ferry services using ‘jetties facilities’, ‘Fare’, ‘Safety & security’ and ‘comfort’ and found that jetty infrastructure, ease of booking online, ambience and on board convenience were the most important determining factors of service quality. Chan (2017) adopted the modified SERVQUAL model of Cavana et al. (2007) with ‘Assurance,’ ‘Empathy,’ ‘Reliability,’ ‘Responsiveness,’ ‘tangibles,’ ‘Comfort,’ ‘Connection,’ and ‘Convenience’ as dimensions to assess the passenger ferry service quality and found it to be suitable for identifying the most and least important factors of maritime passenger transport service quality (MPTSQ). Abdullah and Wahab (2010) used Fuzzy multi-criteria Decision-making approach with (a) On-board Comfort (Cleanliness & Noise level of ferry, On-board facilities), (b) Ferry Employees (Helpful attitude, attentiveness, service efficiency) and (c) Handling of abnormal conditions (Security, Safety, and on-time performance) and found service efficiency as the highest-ranked attribute. Marissa et al. (2019) built a scale with 12 vessel-related variables and 32 port-related variables to assess five satisfaction-related variables. There is a strong relationship between maritime passenger transport service quality, tourist satisfaction and behavioural intentions. (Dewaayusastagayatri Dewi & Respati, 2020). But the contribution of MPTSQ to the overall IDSQ in not studied separately. Also, the mediating role of IDSQ on the relationship between MPTSQ and TS and the mediating role of TS in the relationship between MPTSQ and BI remain unexplored. In addition, the role of destination e-image in visitor’s perception formation towards the maritime passenger transport system also remains unreported in academic research. Therefore, the construct for assessing the MPTSQ was adopted from the above literature, and the following hypotheses were formed.
Destination Service Quality, Tourist Satisfaction and Behavioural Intentions
The influential relationships between service quality, tourists’ satisfaction towards the destination and their behavioural intention is well documented (Prayogo & Kusumawardhani, 2016; Stylos et al., 2017; Whang et al., 2016). However, the influential relationship between these three is not limited to individual entities such as hotels and restaurants. It also includes the activities undertaken by the visitors at the destination (Sharafuddin, 2015a). Sangpikul (2018) investigated the destination attributes as dimensions of travel experience (beach attractions, people, valued destination, services & facilities, safety & cleanliness) and their effects on tourist satisfaction and behavioural intention. The research found that the people (local hospitality of service providers) other than the natural environment also influences the tourist satisfaction and behavioural intentions in island destinations. Several studies (Fernaldi & Sukresna, 2018; Majeed et al., 2020; Prayag et al., 2013; Vega-Vázquez et al., 2017) also proved the mediating effects of tourist satisfaction between the tourist experience and behavioural intention. Hence, the following hypotheses were formed based on the above literature.
Conceptual Framework
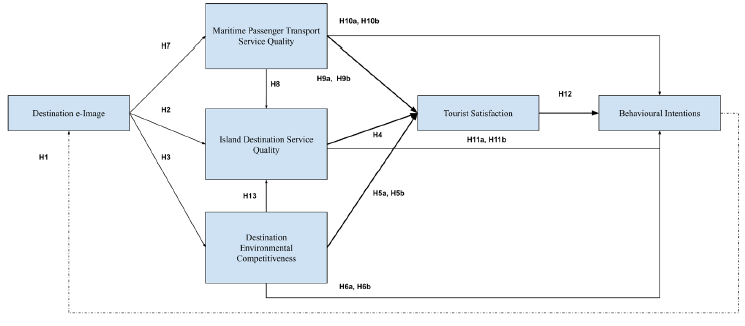
The following conceptual framework was derived from the qualitative study (Sharafuddin et al., 2021) and literature review, and the following hypotheses were formed (Figure 1).
Methodology
Scale Development
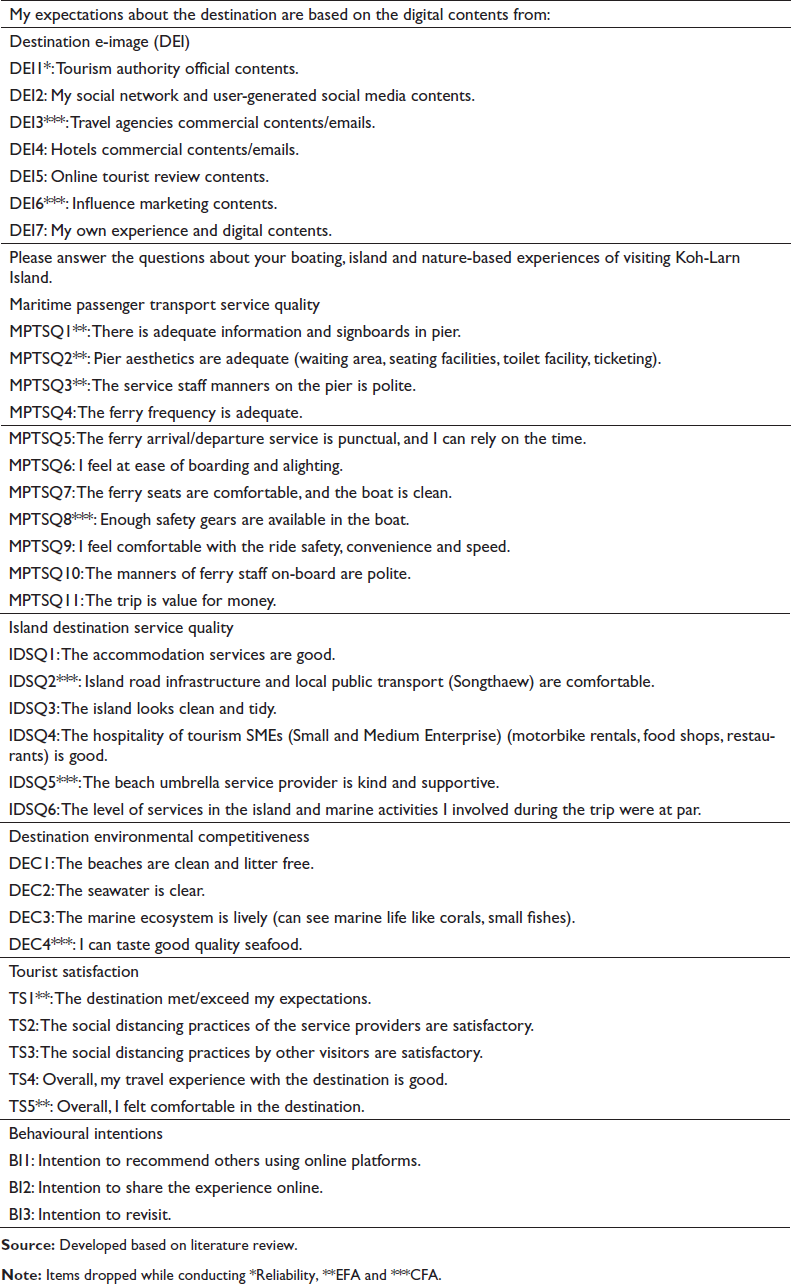
This research adopted an empirical approach by using a survey instrument to investigate the causal impacts among destination e-image (DEI), maritime passenger transport service quality (MPTSQ), island destination service quality (IDSQ), destination environmental competitiveness (DEC), tourist satisfaction (TS) and behavioural intentions (BI). The survey instrument was designed based on the qualitative study (Sharafuddin et al., 2021) and literature review, which was subsequently discussed with the three subject-matter experts. The survey instrument is comprised of two sections; the first section consisted of questions related to the demographic profile of the visitors, and the second section intended to measure the perception of visitors related to their experience and satisfaction with the destination. The survey instrument consisted of 36 items on a 5-point Likert scale ranging from 5-strongly agree to 1-strongly disagree. The scale items are related to destination e-image (7 items), maritime passenger transport service quality (11 items), island destination service quality (6 items), destination environmental competitiveness (4 items), tourist satisfaction (5 items), and behavioural intentions (3 items). The survey instrument was presented again to the same three subject-matter experts to evaluate the item constructs in terms of five aspects, that is, research domain, research theme, its importance to the concept, suitability and compatibility to the study’s purpose. The experts suggested changing the wordy sentences to ease the understanding of the respondents, and subsequent paraphrasing was done to the few questions; thus, it helped to achieve and ensure the content validity of the survey instrument. Thus, the final survey instrument consisted of 36 items.
Data Collection
This study included only repeat visitors to test the cyclical influence of their behavioural intention and destination e-image formation. The survey instrument (Refer to Annexure 1) was distributed to the repeat visitors visiting Koh Larn Island in December 2020 using the convenience sampling method. Both ‘paper-pen’ approach and an online survey form were used to collect data in Bali Hai Pier (Pattaya City) from the visitors returning from Koh Larn Island. The survey instrument was distributed to 600 respondents; out of 600 respondents, 542 respondents filled the survey forms. In 542 responses, 158 responses were partially incomplete/day-time visitors and hence omitted from the study. Thus, the remaining 384 complete responses were included in the study. With a 5% margin error and 95% confidence level and 50% response distribution, the minimum sample size required from a population size of more than 20,000 is 377 (Raosoft, n.d.). Also, as a rule-of-thumb (Comrey & Lee, 1992) suggested that 300 cases are good for conducting factor analysis, whereas on the other hand, the minimum sample size based on the number of variables was suggested by (Gorsuch, 1983), that is, at least five cases per variable. The author (Kahn, 2006) suggested that the sample of 300 cases is sufficient and safe to have communalities in an appropriate range for a good solution. Russell (2002) stated that the sample size should be greater than 100 to conduct a confirmatory factor analysis (CFA). MacCallum et al. (1999) has recommended that a higher sample size would lead to less sampling error and reduce items’ misclassification into different factors. Hence, the sample size of 384 is sufficient to test the hypothesis. The confirmatory factor analysis was conducted to test the validity and reliability of the survey instrument. Consequently, the causal impact was measured using the structural equation model. The EFA, CFA and SEM model was performed using the statistical programming language R (R Core Team, 2020) and the Lavaan package (Rosseel, 2012).
Scale Reliability and Validity
The scale reliability was assessed for all the six factors (destination e-image, maritime passenger transport service quality, island destination service quality, destination environmental competitiveness, tourist satisfaction, and behavioural intentions) with 36 items. The internal consistency and reliability can be assessed through the score of Cronbach’s alpha and corrected item-total correlations. Table 1 presents the values of Cronbach’s alpha and corrected item-total correlation (CITC). The Cronbach’s alpha values are greater than the threshold value of 0.70 (Nunnally, 1978; Nunnally & Bernstein, 1994), indicating good reliability; and the CITC values of all the items were above 0.50 (Iacobucci & Churchill, 2010) except one item in DEI; thus it (DEI1) was subsequently removed from the model.
Reliability Test

The number of factors for EFA was estimated as six based on the conceptual framework and scree plot (Costello & Osborne, 2005). Further, 384 responses to 35 items in the survey instrument were subjected to exploratory factor analysis (EFA) with principal axis factoring and promax rotation. Researchers in the field of social sciences have suggested that principal axis factoring (PAF) extraction with promax/direct oblimin rotation is more appropriate (Brenner, 2019), and PAF extraction is more accurate than principal component analysis (Kahn, 2006). The communalities extracted for all the 35 items ranged from 0.420 to 0.696, which is greater than 0.40 and acceptable in social sciences (Costello & Osborne, 2005). The factor model accounted for 56.39% of the variance explained, which is greater than 50% (Streiner, 1994). The first factor accounted for 30% of the total variance. The KMO measure of sampling adequacy score was shown at 0.897, which is also greater than 0.50 (Kaiser, 1974). However, few cross-loadings of items were found as we used Promax rotation and allowed them to correlate as there are possibilities for the items to be correlated in a related construct. Thus, the cross-loadings were verified and the items MPTSQ1, MPTSQ2, MPTSQ3, TS1 and TS5 were loaded high in another factor, so these items have been subsequently removed. The exploratory factor analysis was conducted again using principal axis factoring and Promax rotation with six factors. The factor model accounted for 56.887% of the total variance explained, which is also greater than 50% (Streiner, 1994). The first factor accounted only for 29.918% of the total variance, indicating that most of the variance is not accounted by one general factor; hence, the common variance problem was addressed and alleviated in this study (Podsakoff et al., 2003). The KMO measure of sampling adequacy score was shown at 0.890, which is also greater than 0.50 (Kaiser, 1974). Hence, to confirm the factor structure and to verify the discriminant validity, the final 30 items were subjected to confirmatory factor analysis.
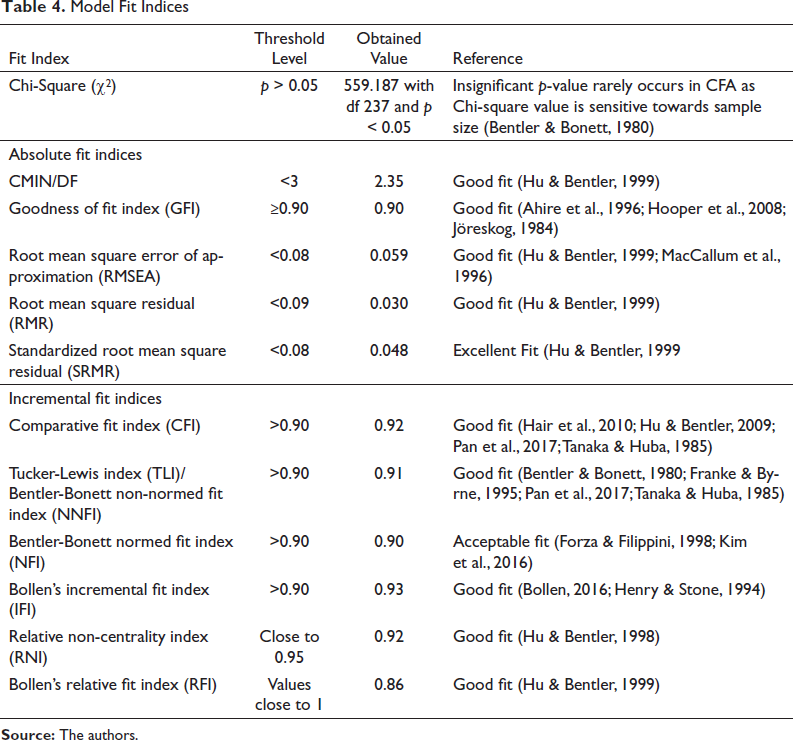
The initial measurement model was assessed for convergent validity and discriminant validity using confirmatory factor analysis with all 30 items of the scale construct. The measurement model was converged with the Chi-square value of χ2 = 1178.846 with degrees of freedom (df) 390, p ≤ 0.01, where root mean square approximation (RMSEA) = 0.073. The factor loadings of all items were > 0.5, with z-values ranging from 11.038 to 20.139 and a significant p < 0.05. Though, the model yielded required factor loadings with significant z-values, the model achieved only the marginal fit (CMIN/DF = 3.02, RMSEA 0.073, standardized root mean square residual [SRMR] = 0.058, GFI = 0.83, CFI = 0.872, TLI, 0.858, NNFI = 0.858, NFI = 0.822, IFI = 0.873). The model fit indices indicate that the model could be improved further by inspecting the modification indices and standardized residuals to identify the potential items for deletion (Pattnaik, 2019). The modification indices (MIs) were carefully reviewed by giving due consideration to theory, as MIs are completely data-driven (CenterStat, 2019). The MIs and standardized residuals pointed out the items/pairs with high correlated error terms. These items were prudently checked from a theoretical perspective, including language, wordiness, and its suitability to the present pandemic situation, so that there will not be much changes to the hypothesized model. The error items MPTSQ8, DSQ2, DSQ5, DEI3, DEI6, DEC4 were dropped and revised in the model based on the recommendations of Hair et al. (2010). The final model was converged with the Chi-square value of χ2 = 559.187 with degrees of freedom (df) 237, p ≤ 0.05, where root mean square approximation (RMSEA) = 0.059. The R2 values are greater than 0.25 with factor loadings of all items were > 0.5 (Hair et al., 2010), and z-values ranged from 10.905 to 19.991 with a significant p-value of <0.05 (Table 2). The model yielded required factor loadings with significant z-values and achieved a good fit (CMIN/DF = 2.35<3, RMSEA = 0.059, RMR = 0.030, SRMR = 0.048, GFI = 0.90, CFI = 0.92, TLI = 0.91, NNFI = 0.91, NFI = 0.90, IFI = 0.93), which is presented in Table 4. Further, the data were tested to check the risk of common method bias. Common method bias such as ‘transient mood state’ may occur while collecting data from tourists because there is a possibility of the respondents’ previous moods to affect their responses. Also, there are possibilities of ‘consistency motif’ and ‘leniency biases’ in research where respondents are asked to fill in their experience and behavioural intention. Therefore, the data were tested for the effects of common method bias. Harman’s single factor test is the one-factor exploratory analysis of all the variables used in the study to identify the presence of common method bias in the research data. The results of the proportion variance from the factor analysis should be less than 0.50 (50%) (Harman, 1967). Therefore, the single factor exploratory analysis was carried out with all the 24 variables included in this study to test the hypothesis. The proportion variance of the single-factor analysis result was 0.30 (30%). Hence, the common method bias does not affect the data.
Results of Measurement Model
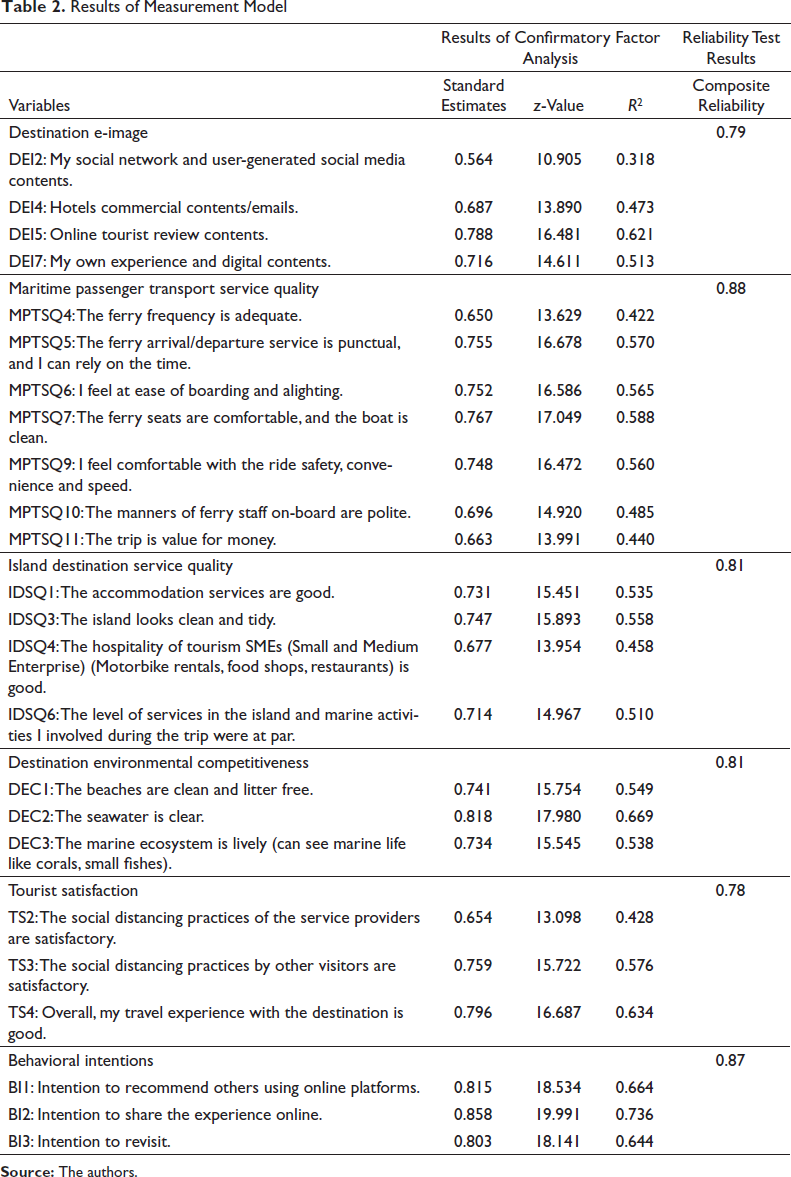
Composite Reliability, Convergent Validity and Discriminant Validity
The composite reliability of the latent constructs is depicted in Table 2. The composite validity of the latent constructs was obtained through confirmatory factor analysis and the observed composite reliability (CR) values ranging from 0.78 to 0.88 (which is greater than 0.7), indicated good reliability, and the factor loadings of few items between >0.5 and <0.7 does not affect the internal consistency of the scale constructs (Hair et al., 2010). The CR values greater than 0.70 are considered as an indicator of convergent validity, and it is evident that the measurement scale met the criteria of convergent validity (Table 2), that is, composite reliability >0.7 (Hair et al., 2010). The idea of discriminant validity was prompted by Campbell and Fiske (1959) and a few other experts in the field. The discriminant validity measures the ‘similarity between latent variables’ (Henseler, n.d.). The discriminant validity was assessed using the novel and stringent measure Heterotrait-Monotrait ratio of correlations (HTMT) (Henseler et al., 2015) in R studio using Lavaan as the traditional Fornell and Larcker criterion (Fornell & Larcker, 1981) is purely criterion-based and not based on the statistical test (Henseler et al., 2015). Table 3 presents the HTMT results of the six latent variables and demonstrates the evidence of discriminant validity where the HTMT values between the latent variables are <0.85, according to the HTMT0.85 criterion (Henseler et al., 2015).
HTMT Results Discriminant Validity
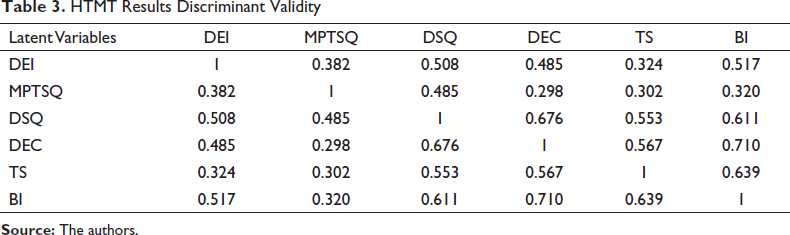
Table 4 presents the obtained value and threshold level of model fit indices. In general, the researchers consider other indices as the chi-square value is sensitive to sample size (Bentler & Bonett, 1980); hence other fit indices should be considered for assessing the model fit (Hooper et al., 2008). According to Hair et al. (2010), as a rule of thumb, if at least one absolute and incremental fit index meets the threshold level apart from the Chi-square test statistic, the model is said to be a good fit. Thus, from Table 4 it is evident that the measurement model satisfied the threshold levels of major indices, which indicates a good fit.
Model Fit Indices
Descriptive Analysis
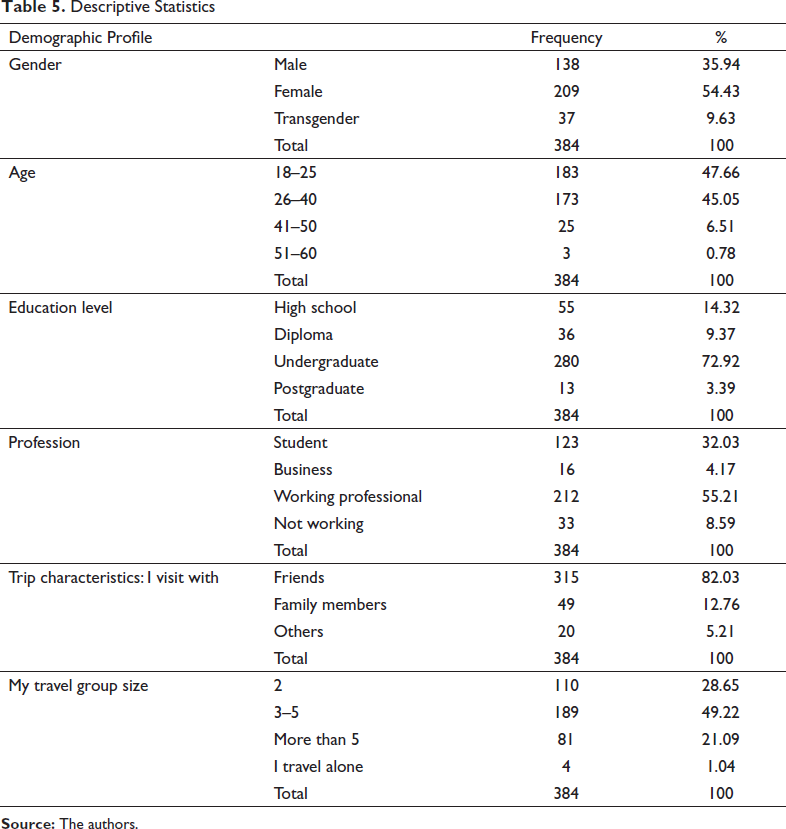
The results of the descriptive analysis (Table 5) revealed that the majority, 54.43% of the respondents, were women. A major proportion (92.71%) of the respondents fall in the age group of 18–40 category. The majority, 72.92% of the respondents, were graduates, and the least 3.4% of the respondents were postgraduates. The major proportion of the respondents who visited the island were working professionals (55.21%) and students (32.03%), and the least number of respondents were businessmen/women (4.17%). Most of the respondents (82.03%) visited the island destination with their friends, and their travel group size was 3–5 (49.22%).
Hypothesis Testing using Structural Equation Model (SEM)
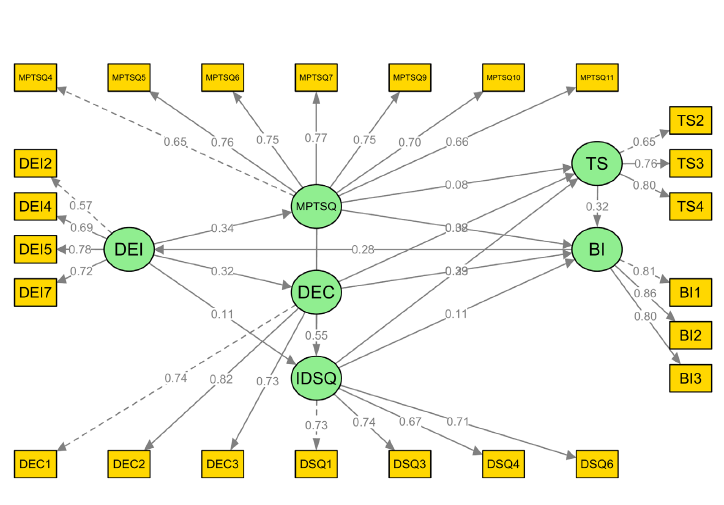
The structural equation model (SEM) was performed to test the hypotheses. The conceptual model and hypotheses probed in this study consisted of both direct and indirect paths. The mediation effects were identified, and the indirect paths that are theoretically valid are considered and reported. To estimate both the direct and indirect effects and to substantiate indirect paths are statistically significant, the SEM was estimated (Tables 6 and 7 and Figure 2). The final model was converged with the Chi-square value of χ2 = 566.345 with degrees of freedom (df) 239, p ≤ 0.05. The z-values range from 9.493 to 18.196, with a significant p-value of < 0.05. Table 6 demonstrates the estimates of all the paths and revealed that the effects of destination e-image (DEI) on maritime passenger transport service quality (MPTSQ), destination e-image (DEI) on destination environmental competitiveness (DEC), island destination service quality (IDSQ) on tourist satisfaction (TS), destination environmental competitiveness (DEC) on tourist satisfaction (TS), tourist satisfaction (TS) on behavioural intentions (BI), destination environmental competitiveness (DEC) on behavioural intentions (BI), destination environmental competitiveness (DEC) on island destination service quality (IDSQ), maritime passenger transport service quality (MPTSQ) on island destination service quality (IDSQ), and behavioural intentions (BI) on destination e-image (DEI) were statistically significant at p-value < 0.05, except the effects of destination e-image (DEI) on island destination service quality (IDSQ), maritime passenger transport service quality (MPTSQ) on tourist satisfaction (TS), island destination service quality (IDSQ) on behavioural intentions (BI), and maritime passenger transport service quality (MPTSQ) on behavioural intentions (BI) were non-significant (p-value > 0.05). Hence, the indirect paths were considered to identify the mediation effects.
Descriptive Statistics
Estimates

Causal Paths and Hypothesis Summary
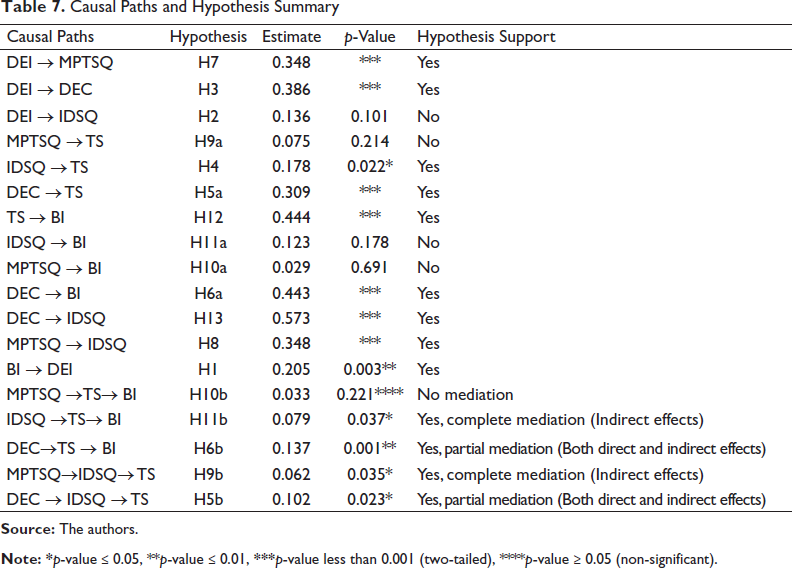
The indirect effects were identified for the paths MPTSQ ↓ BI, IDSQ ↓ BI, DEC ↓BI, MPTSQ ↓ TS, and DEC ↓ TS. The indirect effects of maritime passenger transport service quality (MPTSQ) on behavioural intentions (BI) exhibited the estimate of b = 0.033, SE = 0.027, and the p-value of 0.221 ≥ 0.05. Hence, the indirect effect of maritime passenger transport service quality (MPTSQ) on behavioural intentions (BI) is statistically non-significant. Further, the direct effects were verified to examine the type of mediation present in the model. The direct effects of MPTSQ on BI revealed b = 0.029, SE = 0.072, and a p-value of 0.69, which is ≥ 0.05. Thus, both the direct and indirect effects are not statistically significant, implying that there is no influence of MPTSQ on BI, and it is evident that tourist satisfaction (TS) does not mediate the relationship between MPTSQ and BI.
The indirect effects of island destination service quality (IDSQ) on behavioural intentions (BI) exhibited the estimate of b = 0.079, SE = 0.038, and the p-value of 0.03 ≤ 0.05. Hence, the indirect effect of IDSQ on BI is statistically significant. Further, the direct effects were verified to examine the type of mediation present in the model. The direct effects of IDSQ on BI revealed b = 0.123, SE = 0.091, and the p-value of 0.178, which is greater than 0.05. The direct effects are not statistically significant. Hence, it is evident that tourist satisfaction (TS) completely mediates the relationship between IDSQ and BI.
The indirect effects of destination environmental competitiveness (DEC) on behavioural intentions (BI) exhibited the estimate of b = 0.137, SE = 0.040, and the p-value of 0.001 ≤ 0.05. Hence, the indirect effect of DEC on BI is statistically significant. Further, the direct effects of DEC on BI revealed b = 0.443, SE = 0.092, and the p-value of 0.000, which is less than 0.0001. Hence, both the direct and indirect effects are statistically significant, and it is evident that tourist satisfaction (TS) partially mediates the relationship between DEC and BI.
The indirect effects of MPTSQ on TS revealed the estimate of b = 0.062, SE = 0.029, and the p-value of 0.035 ≤ 0.05. Hence, the indirect effect of MPTSQ on TS is statistically significant. Further, the direct effects of MPTSQ on TS revealed b = 0.075, SE = 0.061, and the p-value of 0.214, which is greater than 0.05. The direct effects are non-significant. Hence, it is evident that IDSQ completely mediates the relationship between MPTSQ and TS.
The indirect effects of DEC on TS revealed the estimate of b = 0.102, SE = 0.045, and the p-value of 0.023 ≤ 0.05. Hence, the indirect effect of DEC on TS is statistically significant. Further, the direct effects of DEC on TS revealed b = 0.309, SE = 0.075, and the p-value of ≤0.001, which is less than 0.05. Hence, both the direct and indirect effects are statistically significant, and it is evident that IDSQ partially mediates the relationship between DEC and TS.
The model is tested with all the hypotheses using structural equation modelling, and the model fit indices met the required threshold levels confirming the model fit. The causal paths and hypothesis summary is presented in Table 7.
Causal Diagram
Overall Fitness of the Model
The final model was converged with the Chi-square value of χ2 = 566.345 with degrees of freedom (df) 239, p ≤ 0.05. The z-values range from 9.493 to 18.196 with a significant p-value of <0.05. The model yielded required factor loadings with significant z-values and achieved a good fit (CMIN/DF = 2.36 < 3 (Hu & Bentler, 1999), RMSEA = 0.06 < 0.08 (MacCallum et al., 1996), RMR = 0.03 < 0.08 (Hu & Bentler, 1999), Standardized root mean square residual (SRMR) = 0.05 < 0.08 (Hu & Bentler, 1999), GFI = 0.90 (Ahire et al., 1996), CFI = 0.92 > 0.90 (Bentler, 1990; Hair et al., 2010; 2013; Pan et al., 2017), TLI = 0.91 > 0.90 (Bentler, 1990; Bentler & Bonnett, 1980; Byrne, 1994; Pan et al., 2017; Tanaka & Huba, 1985), IFI = 0.92 > 0.90 (Henry & Stone, 1994). The model achieved the suggested threshold levels.
Discussion
This study developed a model for assessing the cyclical relationship between behavioural intentions and destination e-image formation. The model and hypotheses were developed based on the literature review. Further, the model was tested with the data collected from the tourists who visited Koh Larn Island in Chonburi, Thailand. The descriptive analysis, exploratory factor analysis, confirmatory factor analysis and structural equation modelling were conducted, and the main findings of the research are summarized as follows.
It is found from Table 5 that the majority of the visitors to the island were women, who fall in the age group of 18–40; and most of the respondents were students and working professionals who visited the island with their friends. The scale constructs of the model were tested for validity and reliability and found to be reliable and valid and achieved the thresholds of model fit indices (Tables 1–4). Further, the SEM was performed to analyse the causal impacts by testing the hypotheses. The results indicated that all the proposed hypotheses were supported, except the hypotheses H2, H9a, H10a, H11a, and H10b. The causal impact summary of the hypotheses is explained below.
The overall electronic image of the destination (formed by the user-generated contents in the social media network of the visitor, digital marketing and other commercial contents developed by hotels and resorts in the destination, tourist review comments and the visitors’ own digital contents and earlier experience) influence the visitors’ perception towards the maritime passenger transport service quality (H7) and destination environmental competitiveness (H3). However, it does not directly influence the visitors’ perception towards the island destination service quality (H2). Therefore, in island destinations, the visitors’ expectations formation through the destination e-image are directly influenced by the maritime passenger transport systems and the destination environment itself rather than the services offered by the hospitality SMEs such as motorbike rental and restaurants. On the other hand, there is a direct influence of island destination service quality (H4) and destination environmental competitiveness (H5a) on tourist satisfaction. There is also a partial mediation effect (H5b) of island destination service quality between the destination environmental competitiveness and tourist satisfaction. But the island destination service quality does not directly influence the behavioural intentions (H11a), in line with early findings of (Cevdet Altunel & Erkut, 2015), tourist satisfaction mediates the relationship between them (H11b). Further, IDSQ partially mediates the relationship between destination environmental competitiveness and tourist satisfaction (H5b). Thus, the island destination service quality plays a significant role in influencing tourist satisfaction.
The research also found that destination environmental competitiveness directly (H6a) and indirectly influences behavioural intentions, through the mediator tourist satisfaction (H6b). Hence, tourists who are not satisfied with the destination environmental competitiveness may also contribute to the destination e-image formation through their behavioural intentions. Further, destination environmental competitiveness (H13) and maritime passenger transport service quality (H8) has a positive impact on island destination service quality and together contribute to the destination service quality. Another important finding of this research is that the maritime passenger transport service quality alone does not lead to tourist satisfaction (H9a) or behavioural intention (H10a). Rather, island destination service quality mediates the relationship between the maritime passenger transport service quality and tourist satisfaction (H9b). Thus, there is no significant indirect influence of maritime passenger transport service quality on behavioural intention through tourist satisfaction (H10b). However, tourist satisfaction positively influences behavioural intentions, (H12) corroborate with the findings of Ardani et al. (2019), Baker and Crompton (n.d.), Bayih and Singh (2020), Lee et al. (2008). This study’s results revealed that island destination service quality has an indirect impact on behavioural intentions; the destination competitiveness has both direct and indirect impacts on behavioural intentions. Hence, such behavioural intentions influence the destination e-image formation (H1), which further influences the visitors’ perception towards the destination. Thus, forming a cyclical nature of destination e-image development.
Conclusion
The findings of this study prove that destination e-image formation is cyclical in nature, and there is a positive relationship between behavioural intentions and destination e-image formation. In addition, visitors view all the services they enjoy during their trip as a whole element of their trip. Such visitors’ experiences throughout the touchpoints during their trip are the predictive indicators of their satisfaction, behavioural intentions and memories (Ali et al., 2016; Kim, 2018). Such memories, either saved in digital form or shared in social media along with other commercial contents also influence the visitors’ perception towards the destination and the services offered in it.
Implications
In tourism research, the majority of the research concludes with behavioural intentions. This research extended beyond behavioural intentions and their role in the expectation formation of the visitors through destination e-image, thus contributing new insights into academic literature. The model can be used by destination management organizations for assessing the overall destination performance and destination e-image formation. In particular, there has been growing competition among the ASEAN countries (Sharafuddin, 2015b). So, using this integrated model can help the destination management organizations gain more insights into the direct and indirect effects of the destination environmental competitiveness with the services enjoyed by the visitors throughout their trip. In addition, travel agencies, tour operators and package tour wholesalers can use the model to assess the overall performance of the trip packages sold by them. Big data approach such as online content analysis are limited to insights from publicly shared content. But the influence of digital e-image on perception formation and behavioural intentions is not only limited to publicly available online content (Sotiriadis & Zyl, 2013), it also includes memorable personal content that is not shared publicly through social media and other online platforms. Hence, big data approaches can only provide partial cognizance. Thus, this model provides more insights on the destination e-image formation but has various limitations. Therefore, the future directions in this research domain are provided below.
Limitations and Future Directions
The research data were collected during December 2020 from tourists visiting Koh Larn Island. This was a period when the Thailand Government was slowly easing the COVID-19 travel restrictions. However, the international airports were closed, and the respondents were only domestic visitors. This is the first major limitation of the study. The theoretical framework was tested in island destination where accessibility plays a crucial role. This is the second major limitation of the study. The data was collected from one destination; hence the model cannot be generalized for assessing all types of destinations. This is the third major limitation of the study. Therefore, the model can be further tested with respondents from different international tourists in the future. The model can be used to assess other island destinations which have a ferry/other water transportation as a major mode of accessibility. Though the model is more appropriate for assessing island destinations, the same can be modified to suit the destinations based on their accessibility and services offered. This study included only repeat visitors to test the cyclical influence of their behavioural intention and destination e-image formation. The scale can be further tested with first-time and repeat visitors to compare the influential differences between the two groups.
Appendix-A Survey Instrument
Footnotes
Acknowledgments
The authors are grateful to the anonymous referees of the journal for their extremely useful suggestions to improve the quality of the article. Usual disclaimers apply. The authors would like to thank the Chiang Mai University for supporting this research through ‘CMU Junior Research Fellowship Program’. The authors also thank all the respondents who participated in this study.
Author Contributions
Mohammed Ali Sharafuddin has conceptualized the study, collected data, built up a model to validate, implemented software codes for formal analysis of reliability, exploratory factor analysis, confirmatory factor analysis, and structural equation model in the R programming language, and have done writing-original draft preparation. Meena Madhavan has validated the scale, interpreted all the results in a standard format, and have done writing-review & editing. Sutee Wangtueai supervised the whole project and worked on editing and reviewing the manuscript. All authors have contributed equally to extract conclusions from data. All authors have read and agreed to the published version of the manuscript.
Data Availability Statement
The data presented in this study is available on request from the first/corresponding author.
Declaration of Conflicting Interests
The authors declared no potential conflicts of interest with respect to the research, authorship and/or publication of this article.
Funding
The authors disclosed receipt of the following financial support for the research, authorship and/or publication of this article: This research is ‘Supported by CMU Junior Research Fellowship Program.’
Informed Consent Statement
Oral consent was obtained from all the respondents who participated in this study. All the respondents who participated in this study were explained about the study and its purpose. The respondents’ voluntary completion of the survey questionnaire was taken as their consent for participation in this research. The anonymity and confidentiality of the data were maintained all the time.
