



Abstract
The stagnant manufacturing sectoral share in India’s gross domestic product (GDP) needs an in-depth understanding, analysis and recommendation for growth. Taking manufacturing to a higher growth trajectory has now become a necessity for India’s prosperity. The 2011 National Planning Commission’s (NMP) objective of 25 per cent contribution by manufacturing to India’s GDP by 2025, though challenging, needs an urgent focus. This article utilizes system dynamics (SD)-based simulation for three futuristic economic scenarios to assess the achievability of the NMP targets. The article also provides an understanding of a few critical issues of the manufacturing sector using the causal loop diagram approach of SD. The article also applies the interpretive structural modelling approach to 19 factors identified from the literature, which impact the manufacturing sector. Nine driving factors have been identified for accelerating the manufacturing sector: Technology, labour Reforms, Infrastructural and energy reforms, Good Governance, quality Education and Resource management (TRIGGER). The four dependent factors identified are Domestic value addition, Macroeconomic health, manufacturing Investment and Green-field projects (DMIG).
Introduction
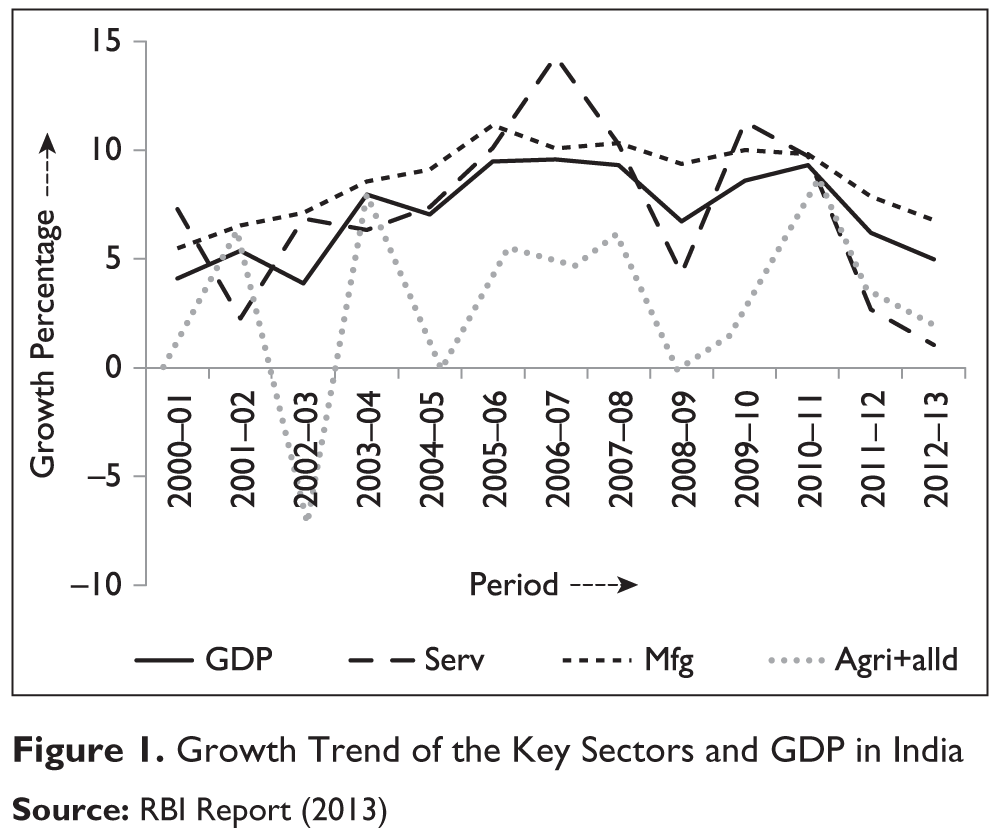
The period 2000–2001 to 2009–2010 has witnessed a reasonably healthy annual growth, in India, in terms of gross domestic product (GDP) and its manufacturing and service sectors (Figure 1). It is a common belief and also proven by research (Giffi et al., 2013) that once a nation begins to build the knowledge and capabilities necessary to manufacture goods, then the path to prosperity begins. Therefore, the contribution of the manufacturing sector to the national economy becomes a critical factor for prosperity. However, as evident from Figure 2, the manufacturing sector in India has almost remained stagnant at 15 per cent for years. Additionally, in the period 2000–2001 to 2012–2013, the service sector has dominated the Indian growth trajectory in terms of its share in GDP, which has grown from 57 per cent to more than 67 per cent, while the share of the agriculture and allied sector in GDP has decreased from 22 per cent to 14 per cent.
In a developing economy, manufacturing growth plays a significant role in the economic development. There is a strong association between the manufacturing GDP and the overall GDP. It is because of this reason that manufacturing is often referred to as the growth engine of the economy and should necessarily find a place in the radar of growing economy like India.
Objectives
This article aims to achieve the following objectives:
Identifying and understanding, from the literature survey, the various factors that impact the growth of the Indian manufacturing sector. Understanding and suggesting, through the scenario building and system dynamics (SD)-based simulation approach, the path of achieving the National Planning Commission (NMP) objective of 25 per cent share of GDP coming from the manufacturing sector by 2025 (Planning Commission, 2011). Understanding some critical issues of the Indian manufacturing sector using the causal loop diagram (CLD) technique of SD. Interpreting the dynamics among the key manufacturing growth factors using the interpretive structural modelling (ISM) approach, to accelerate India’s manufacturing growth share in the GDP.

Some Key Issues in Indian Manufacturing
The 15 per cent share (RBI, 2013) of manufacturing in India’s GDP compares unfavourably with the other Asian countries—China (30 per cent), Singapore (22 per cent), Thailand (36 per cent) and Malaysia (25 per cent) (Lal, Chandra & Sarangi, 2013). A declining share of manufacturing in exports is seen in India in recent years. Further, the import of manufactured products has increased faster than their export in the 2000s. Chinese manufactured products remain to be more cost-effective than India’s (Das, 2014). The value addition in manufacturing has diminished from 25 per cent in the mid-1990s to 18 per cent in 2011 (Banga, 2014).
The employment distribution amongst the firms categorized in terms of their size has become highly skewed—84 per cent in Micro, Small and Medium Enterprises (MSME), 6 per cent in medium and 10 per cent in large (Banga, 2014). A lob-sided informal employment of 92 per cent exists in manufacturing (Banga, 2014). Jobs created by manufacturing per 100 people in India during the period 2001–2010 have been half than that of China (India, 1.6 and China, 3.1) (Giffi et al., 2013). Almost no change has been observed in the 11 per cent employment growth share in the past two decades (Pannu, 2013). The 52 labour laws in the Centre and almost three times in the Indian states are a major barrier to the entrepreneurs wanting to engage in the labour-intensive manufacturing sectors (Panagariya, 2014).
An attractive labour cost ($ per hour) but very unattractive labour productivity (GDP/person employed in 000’ $) indices exist for India. In the year 2011, the labour cost and labour productivity in India, China and Taiwan were 0.9 and 8.9, 2.8 and 14.2, and 9.2 and 52.9, respectively (Giffi et al., 2013).
No Indian university finds a place in the top 200 universities in the world. The research and development (R&D) expenditure in India as a percentage of GDP has been a meagre 0.88 per cent in the last three years. Innovation in new products and process and patents filed are weak areas in the context of manufacturing in India.
India has just 0.3 million apprentices in India, while Japan has 10 million (Panagariya, 2014), which clearly highlights the dearth of trained people for manufacturing industries. Eighty-four per cent employees in MSME and 92 per cent informal employees have low access to technology, low labour productivity, limited access to finance and are unaware of new manufacturing processes (Singh, 2013).
India stands low at the 60th position out of 148 countries in global competitiveness, as per the World Economic Forum Report 2013–2014 (Sala-I-Martin et al., 2013). The World Bank, on the ease of doing business, has ranked India at 134th position out of 189 countries in 2014, which has marginally improved to 130th position in 2015. However, the 2013 Global Manufacturing Competitiveness Index reported by Deloitte (Giffi et al., 2013) has put India in the fourth position out of 38 countries.
These concerns and issues in the Indian manufacturing sector call for an in-depth analysis and strategies for improvement.
Factors Impacting Manufacturing
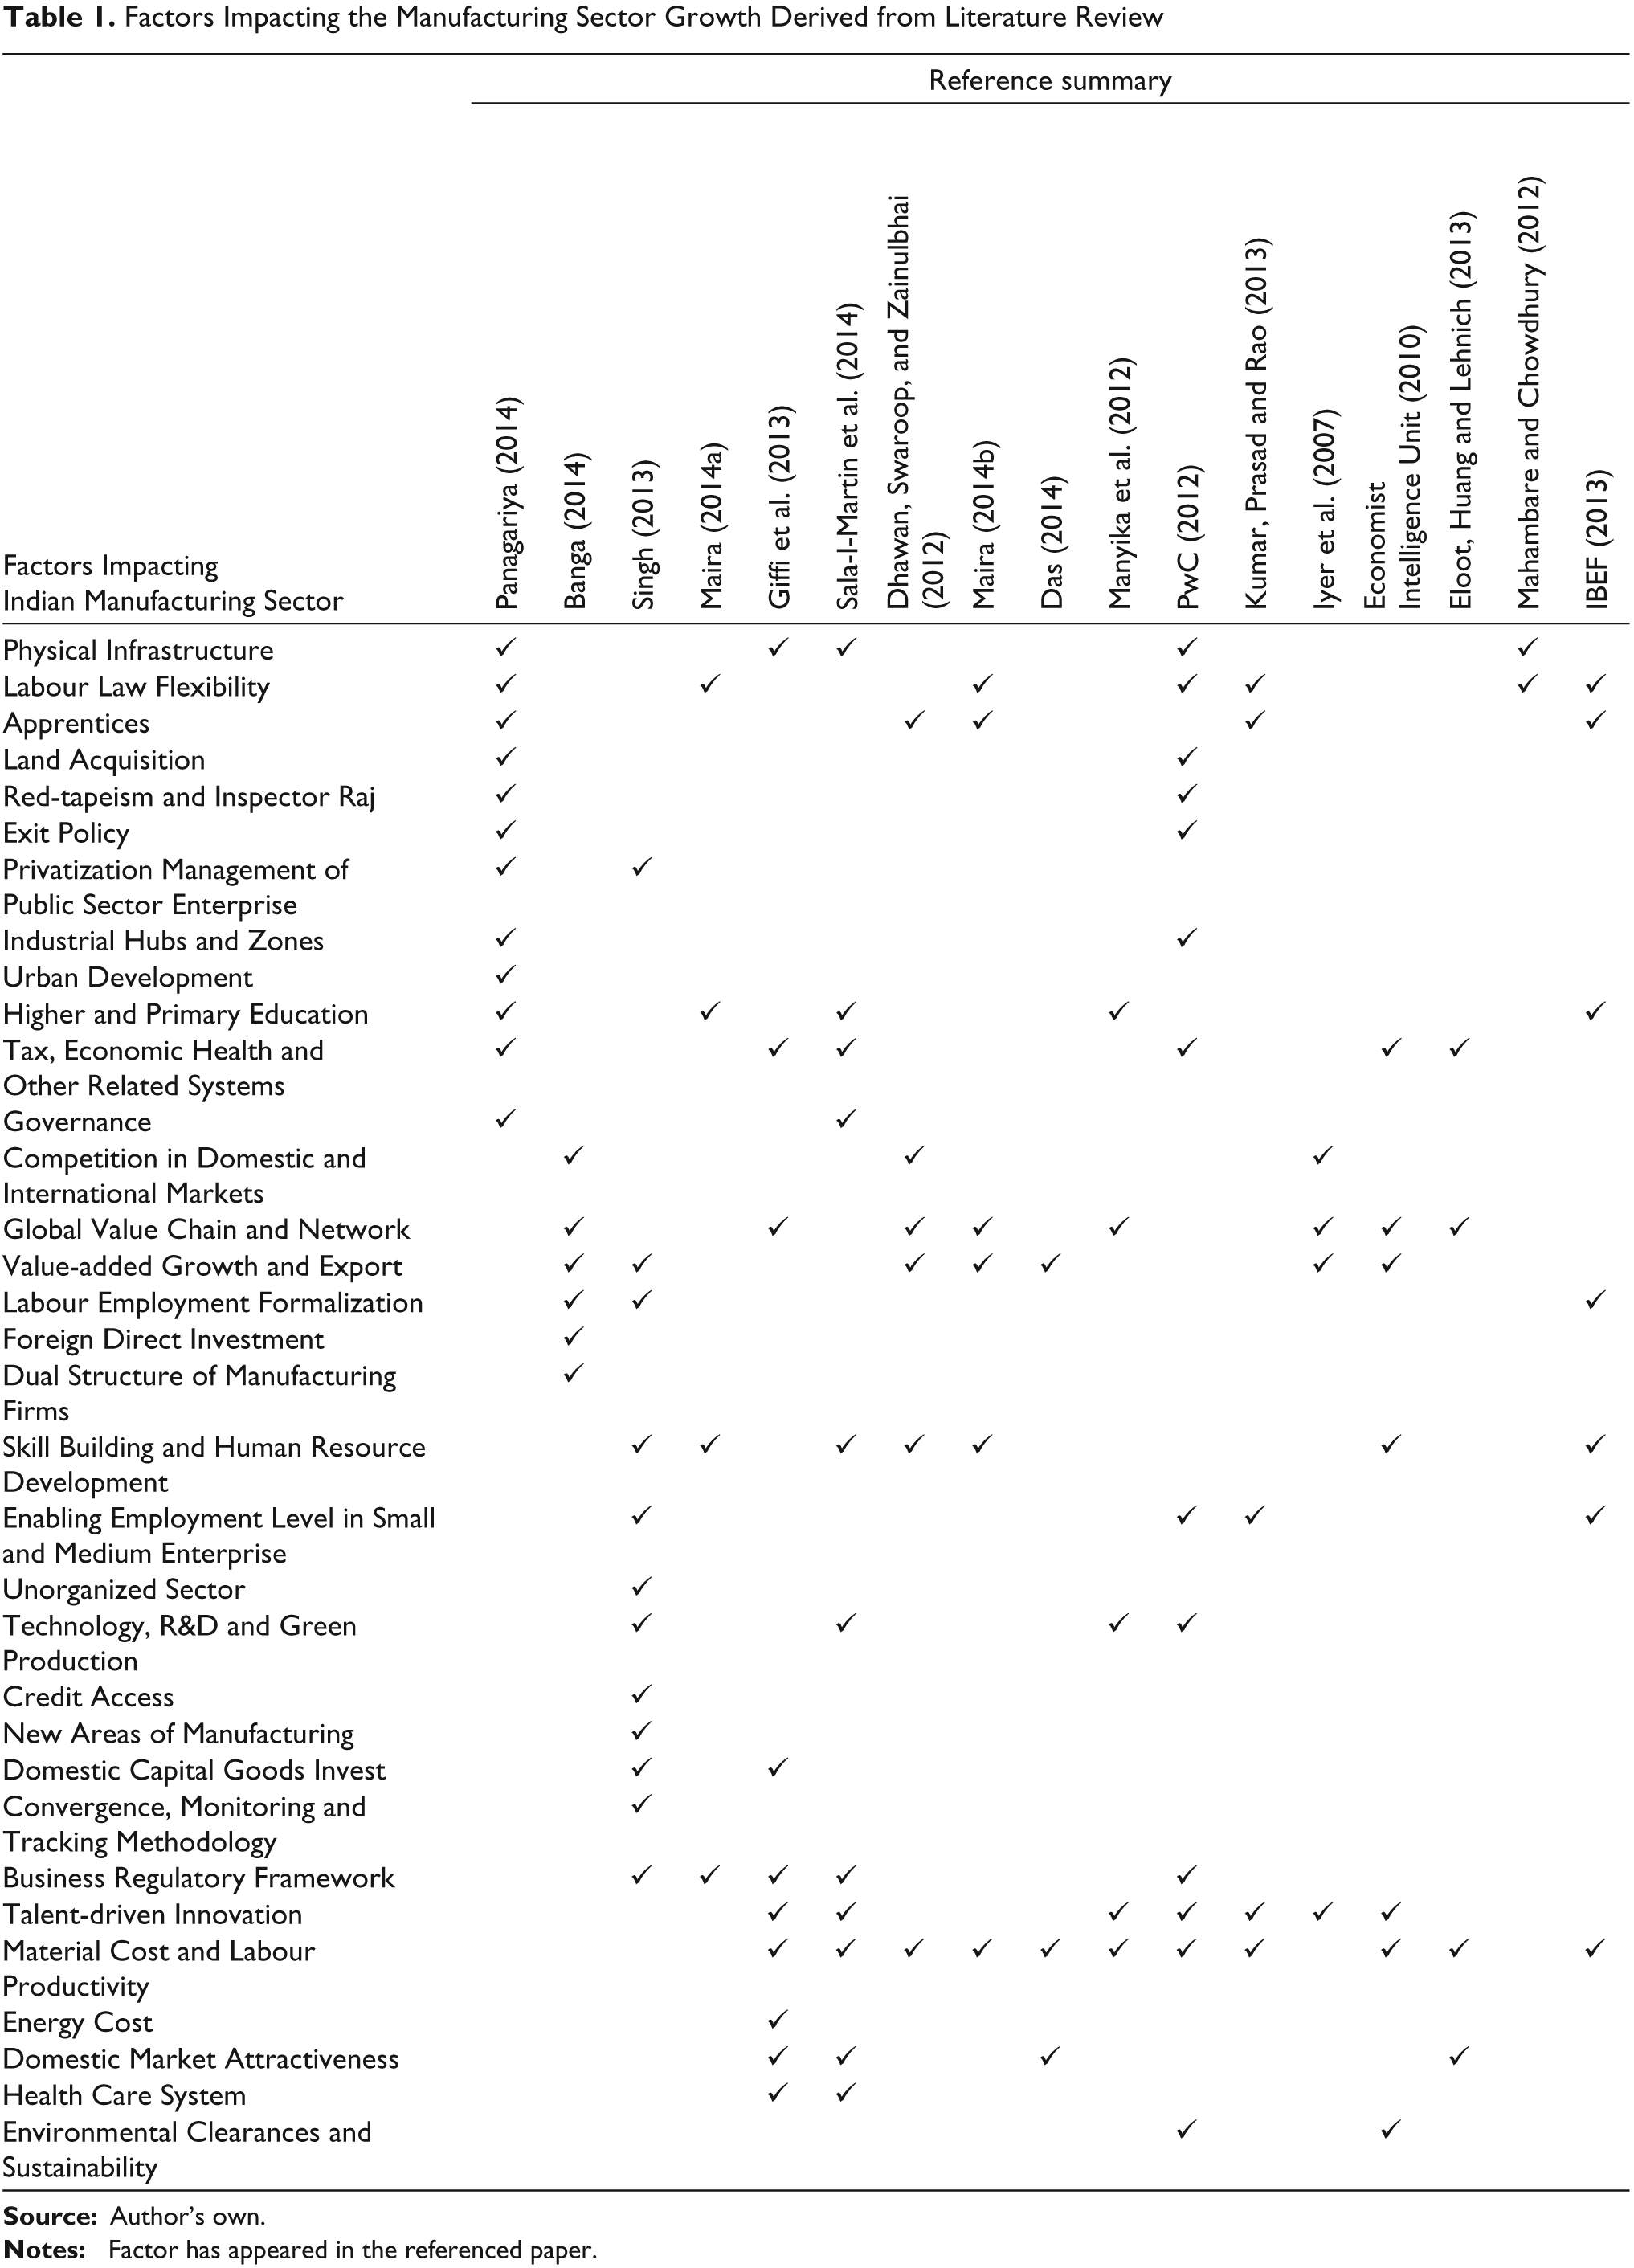
A summary of 33 factors, which impact the growth of the manufacturing sector of an economy, obtained through analysis of 17 papers/reports from the literature survey has been listed in Table 1. It is evident from Table 1 that there are broadly six factors that impact manufacturing growth, which find place in most of the papers: Physical infrastructure, labour laws, material cost, high value addition and export orientation, education and talent-driven innovation and business regulatory framework.
Factors Impacting the Manufacturing Sector Growth Derived from Literature Review
Interpretive Structural Modelling and System Dynamics approaches
To understand interrelationship dynamics between factors, the ISM approach has been extensively applied by various authors in the literature. Some of its applications are in supply-chain management domain (Agarwal, Shankar & Tiwari, 2007; Mahajan, Jadhav, Kalamkar & Narkhede, 2013; Mathiyazhagan, Govindan, NoorulHaq & Geng, 2013), world-class manufacturing practices (Haleem, Sushil, Qadri & Kumar, 2012), strategic technology management in automotive industry (Kedia & Sushil, 2013), human body typified as a business organization (Agarwal & Vrat, 2015) and in the manufacturing-excellence domain (Ojha, Vij & Vrat, 2014). This structured approach can also be applied for identifying the critical factors for the much needed Indian manufacturing sectoral growth.
The SD approach (Sterman, 2013) using the CLD has been extensively used in understanding dynamics in complex business systems. India’s complex manufacturing sector is no exception for its application.
Since there are a large number of factors impacting the growth of the Indian manufacturing sector, there is a need to understand and analyze the complex dynamics amongst the key drivers to facilitate the policy makers in decision-making. Additionally, the two critical questions that need to be answered are as follows:
Is the figure of 25 per cent share of the manufacturing sector in India’s GDP achievable? What driving factors are needed to make that happen in the targeted period?
Research Methodology
Tools and the Framework
Three appropriate techniques that have been used in this article are SD for building scenarios, ISM for identification of critical factors and understanding of the causality of the key subsystems through the CLD of the SD approach. The article has three parts. In the first part, the authors have used the Stella V9.1.3 software of SD to simulate three futuristic scenarios of the Indian economy. The future trends of service, manufacturing and agriculture and the allied sectors have been assumed from the inputs from research papers, industry practitioners and academicians. The quantitative impacts of the sectoral growth assumptions on the GDP growth as well as the sectoral share in the GDP have been analyzed. The prime objective of the study has been in achieving the target of 25 per cent share of GDP from the manufacturing sector by the year 2025.
Various factors impacting manufacturing growth are identified for further analysis in the second part of the article. ISM has been adopted for understanding the complex relationships of the identified factors. Bringing out the key driving factors and dependent factors was carried out through a structured interactive process of eight experts from industry and academia. In the ISM application, the set of different but directly related elements is structured into a comprehensive and systematic model (Warfield, 1974).
The third part uses the CLD, a technique in SD, for mapping the feedback loop structure. A simple causal relationship between manufacturing growth and the key subsystems identified by the ISM approach has been developed. The basic purpose is to highlight the application of CLD in understanding the causality between the key subsystems and manufacturing growth.
SD-based Scenario Simulations
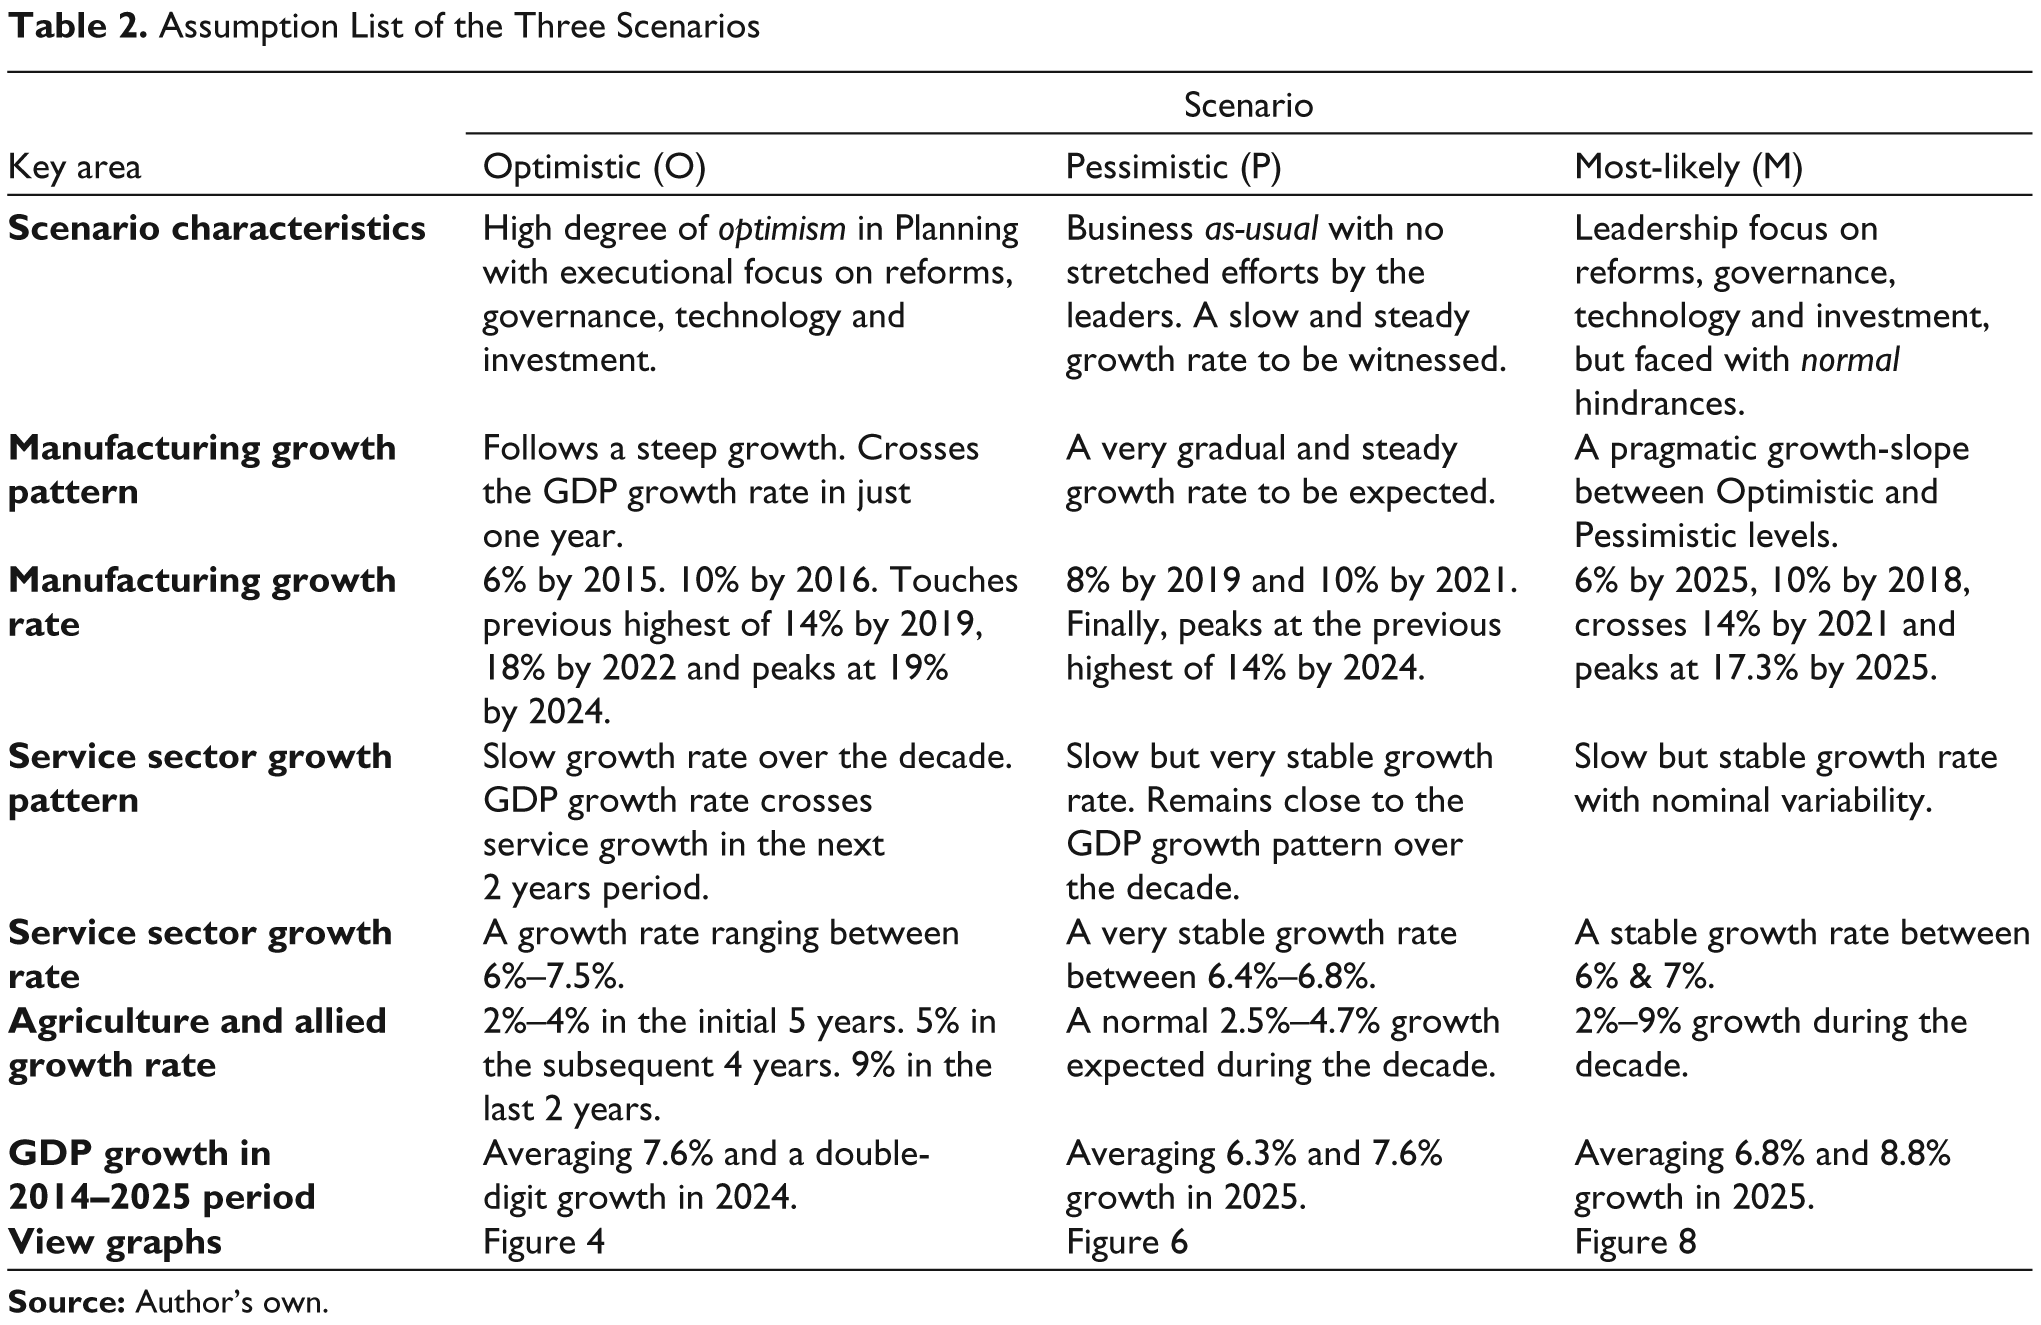
To achieve the target of 25 per cent share of manufacturing in GDP during the 2014–2025 period, from the current level of around 15 per cent and with the current GDP growth rate below 5 per cent (2004–2005 basis), is a big challenge for the nation. For analysis, the three scenarios envisaged are as follows:
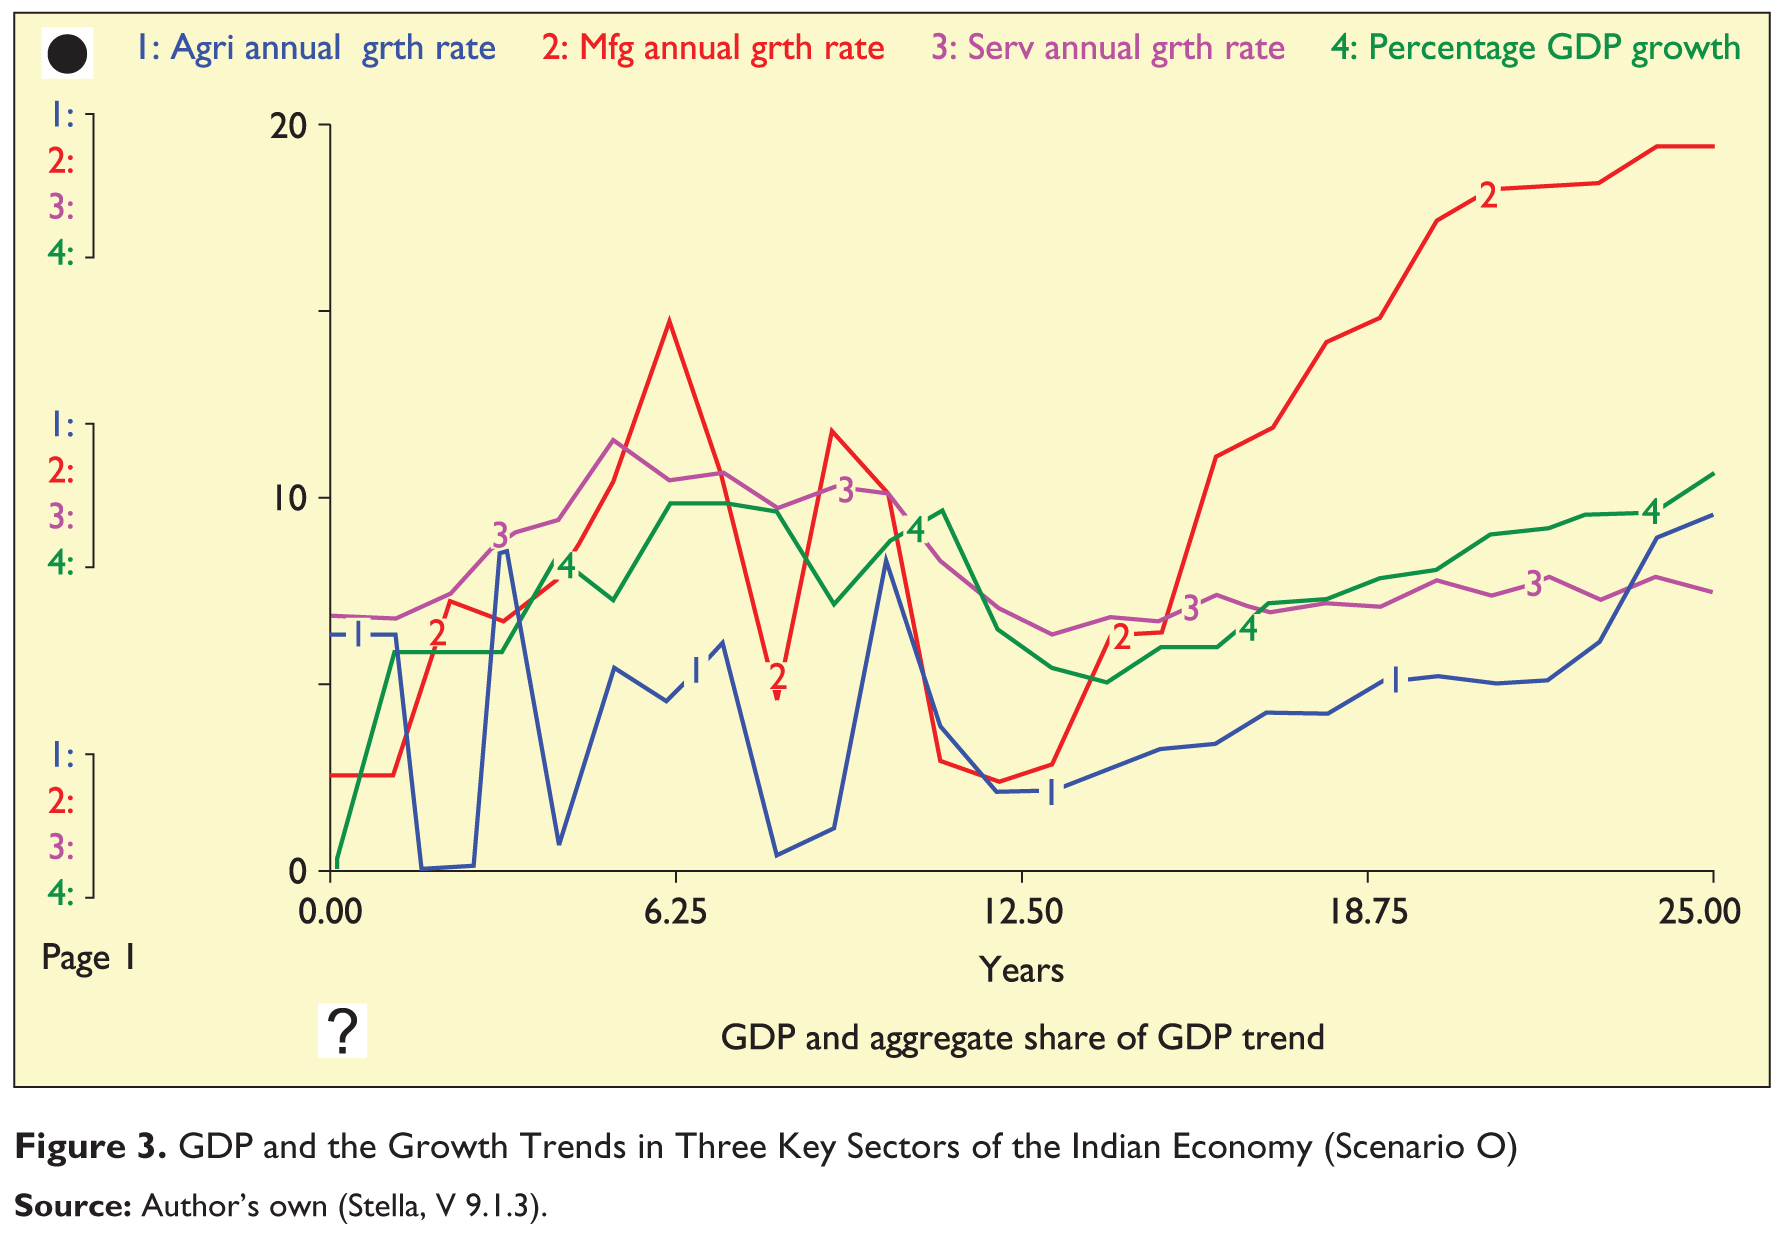
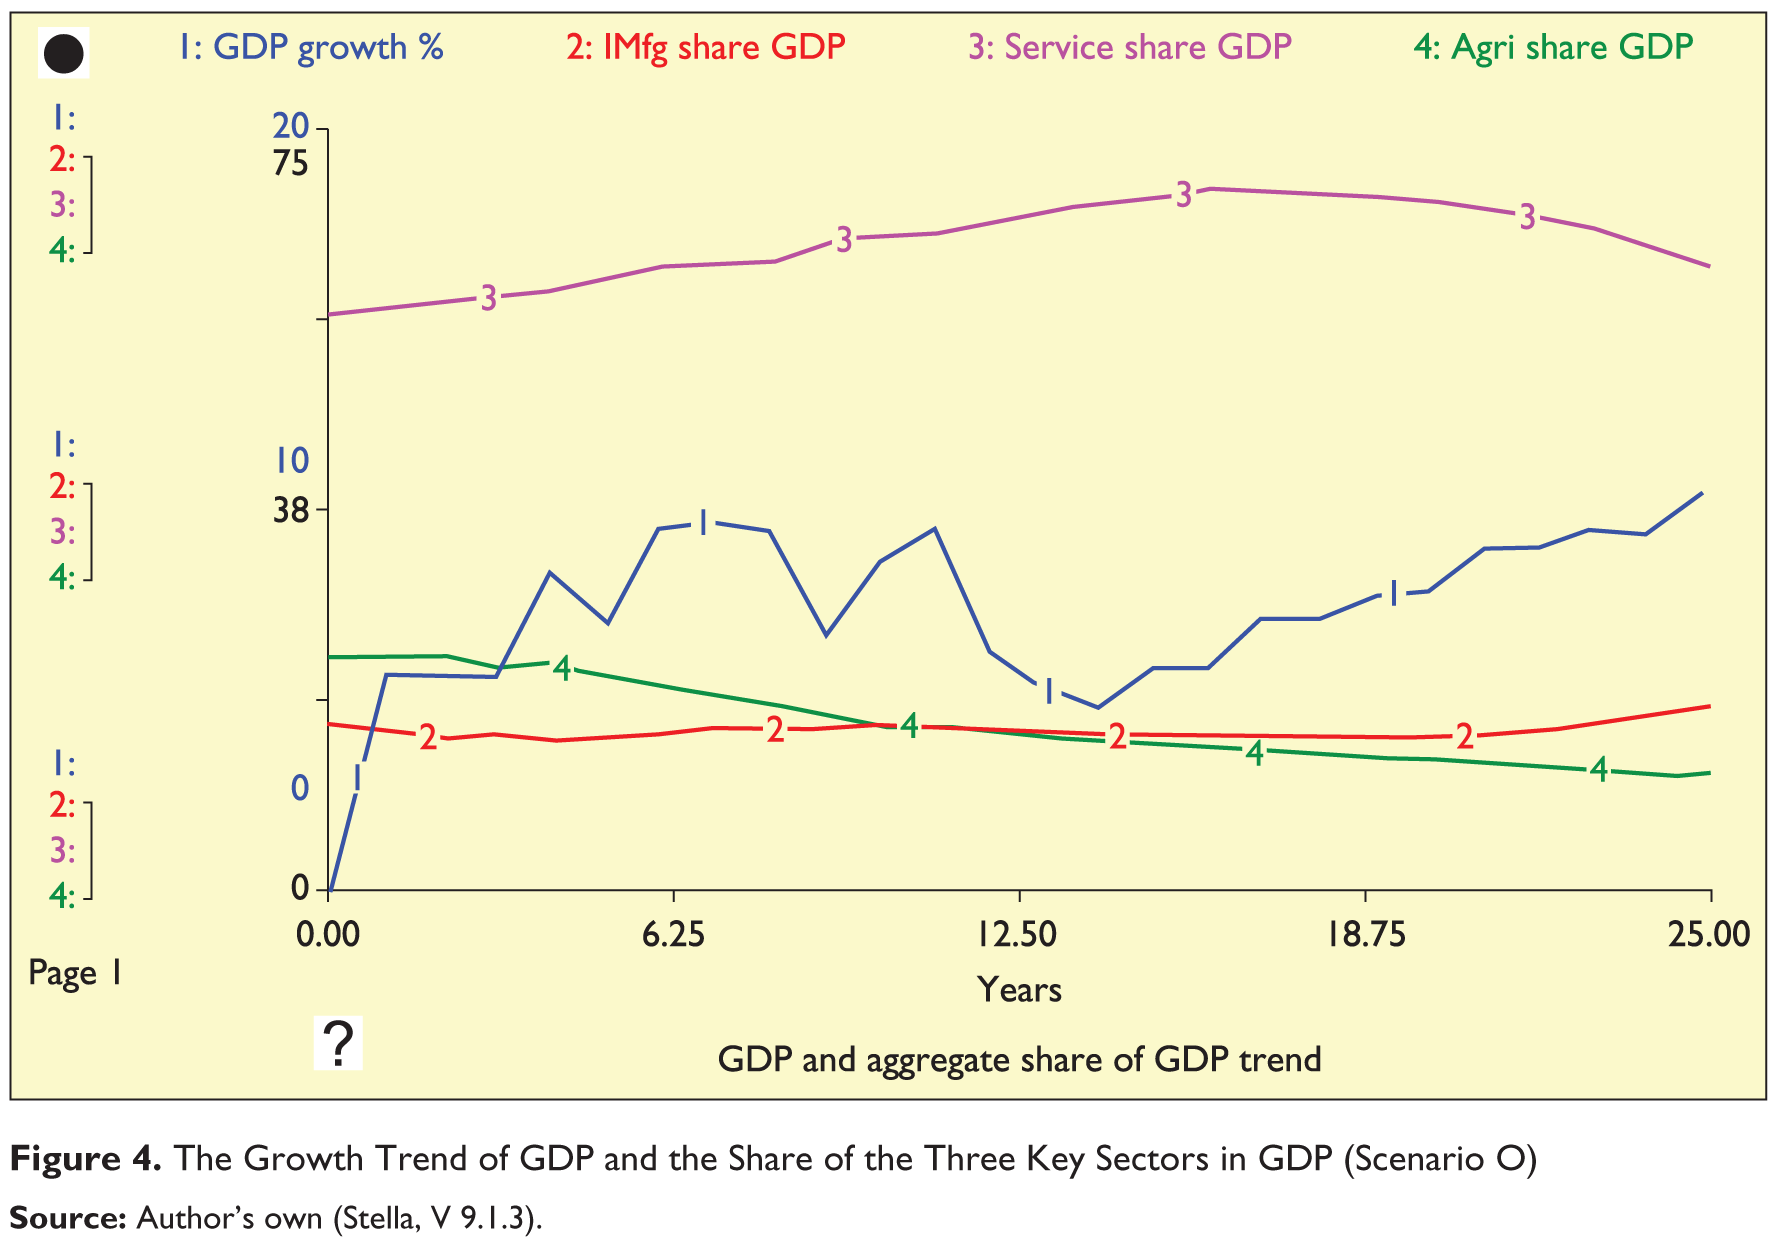
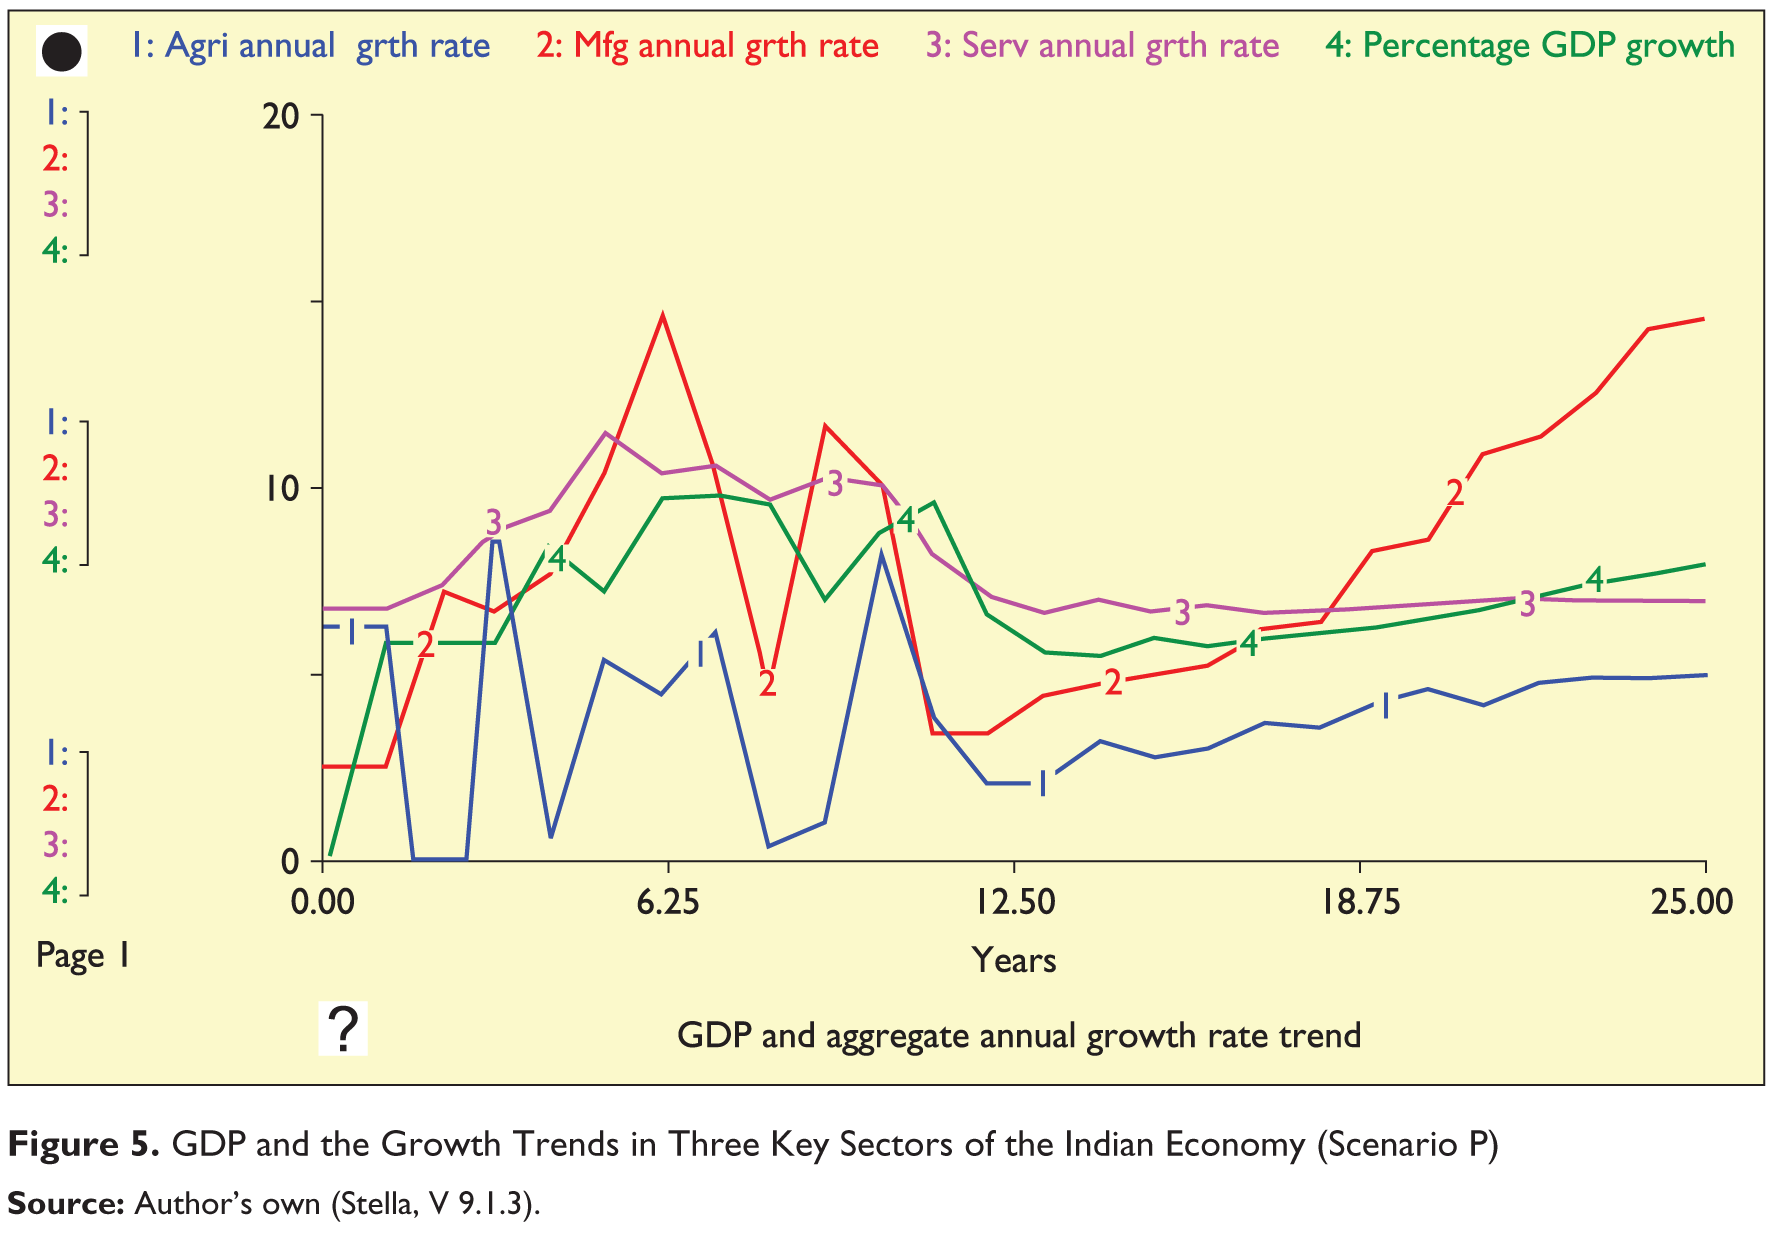
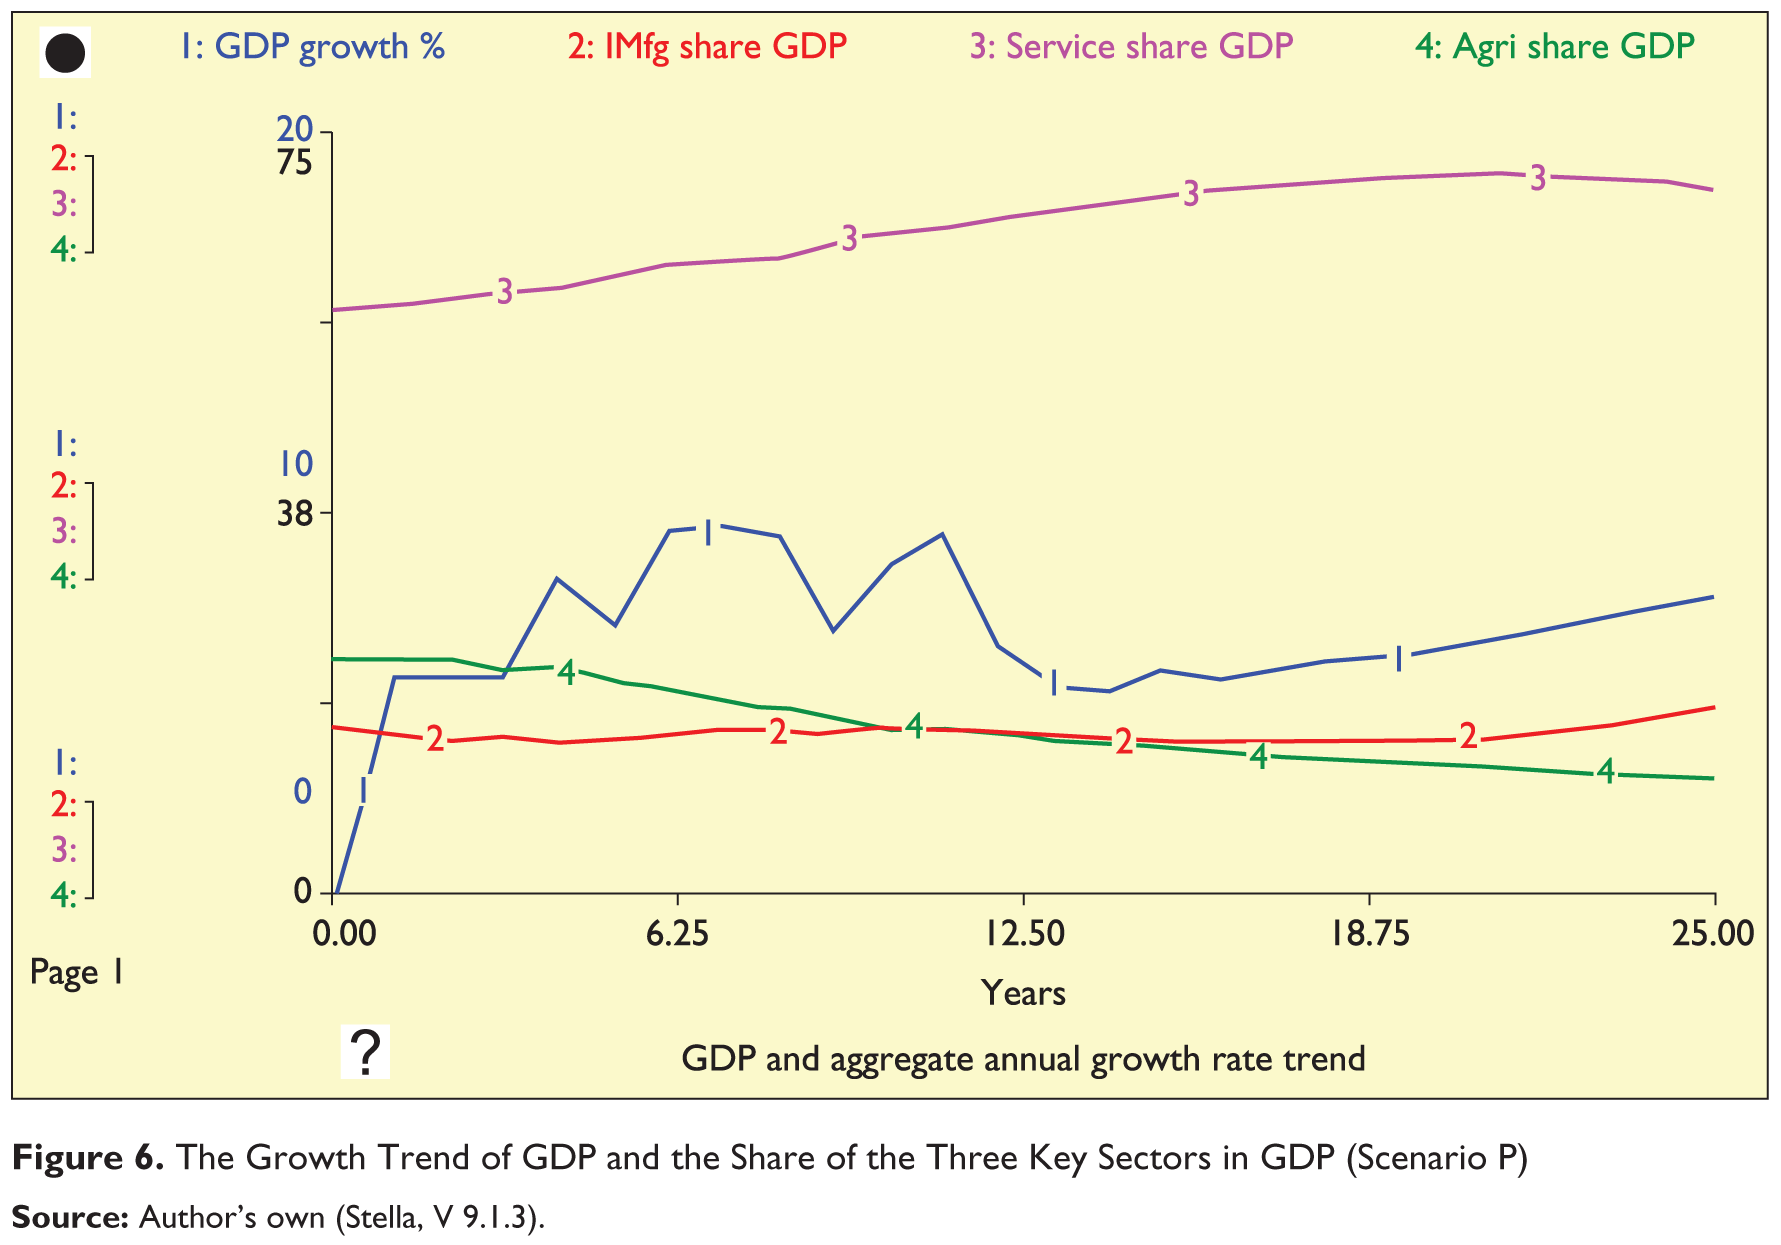
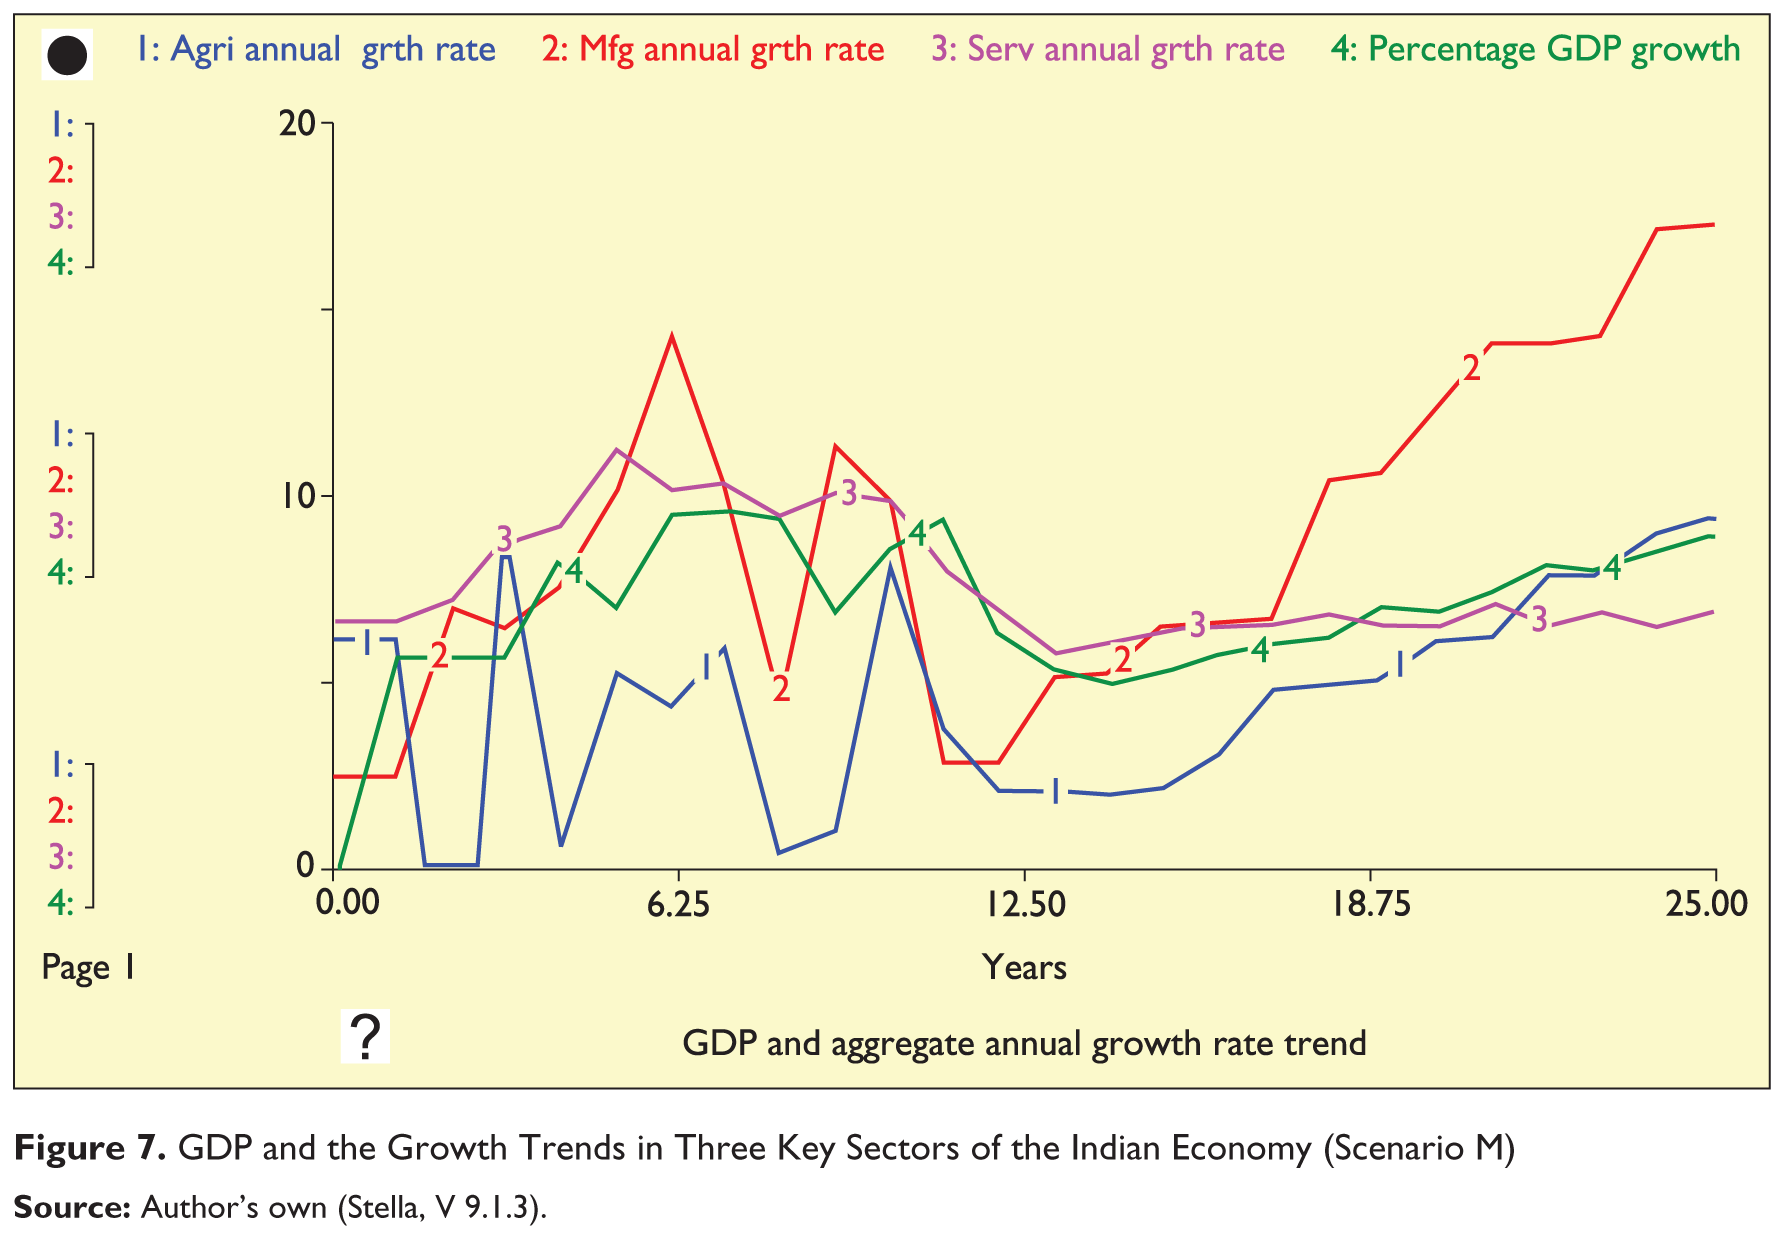
The simulation graphs obtained using Stella-V9.1.3 for the three scenarios O, P and M are shown in Figure 3 through Figure 8. The graphs in Figures 3, 5 and 7 display, in each scenario, the sectoral annual growth trends over the period 2000 to 2025 (RBI reported figures from 2000 to 2013 and the assumption-based figures for periods thereafter). However, the graphs in Figures 4, 6 and 8 display, for each scenario, the sectoral share trend in the GDP. The interpretation of the graphical trends in these figures has been discussed in the ‘Results and Discussions’ section.
The manufacturing sector in India is on the growth trajectory but is faced with many issues. What are those factors which would accelerate this growth? How are those factors interrelated? Which of them are the key drivers? These are few questions being addressed and analyzed in the next part of this article using the ISM approach.
Assumption List of the Three Scenarios

Interpretive Structure Modelling of Growth Factors
From the literature review, 19 critical factors were identified which had an impact on the manufacturing sector of the Indian economy. These factors are perceived to be reasonably mutually exclusive, even intuitively justified and have the agreement of the experts from the industry and academia. The list of these factors along with brief explanation for each is as follows:
ISM has been applied on these 19 factors through an interactive process involving five industry experts and three academia experts. The summary of the steps (Ojha et al., 2014) followed in ISM is as follows:
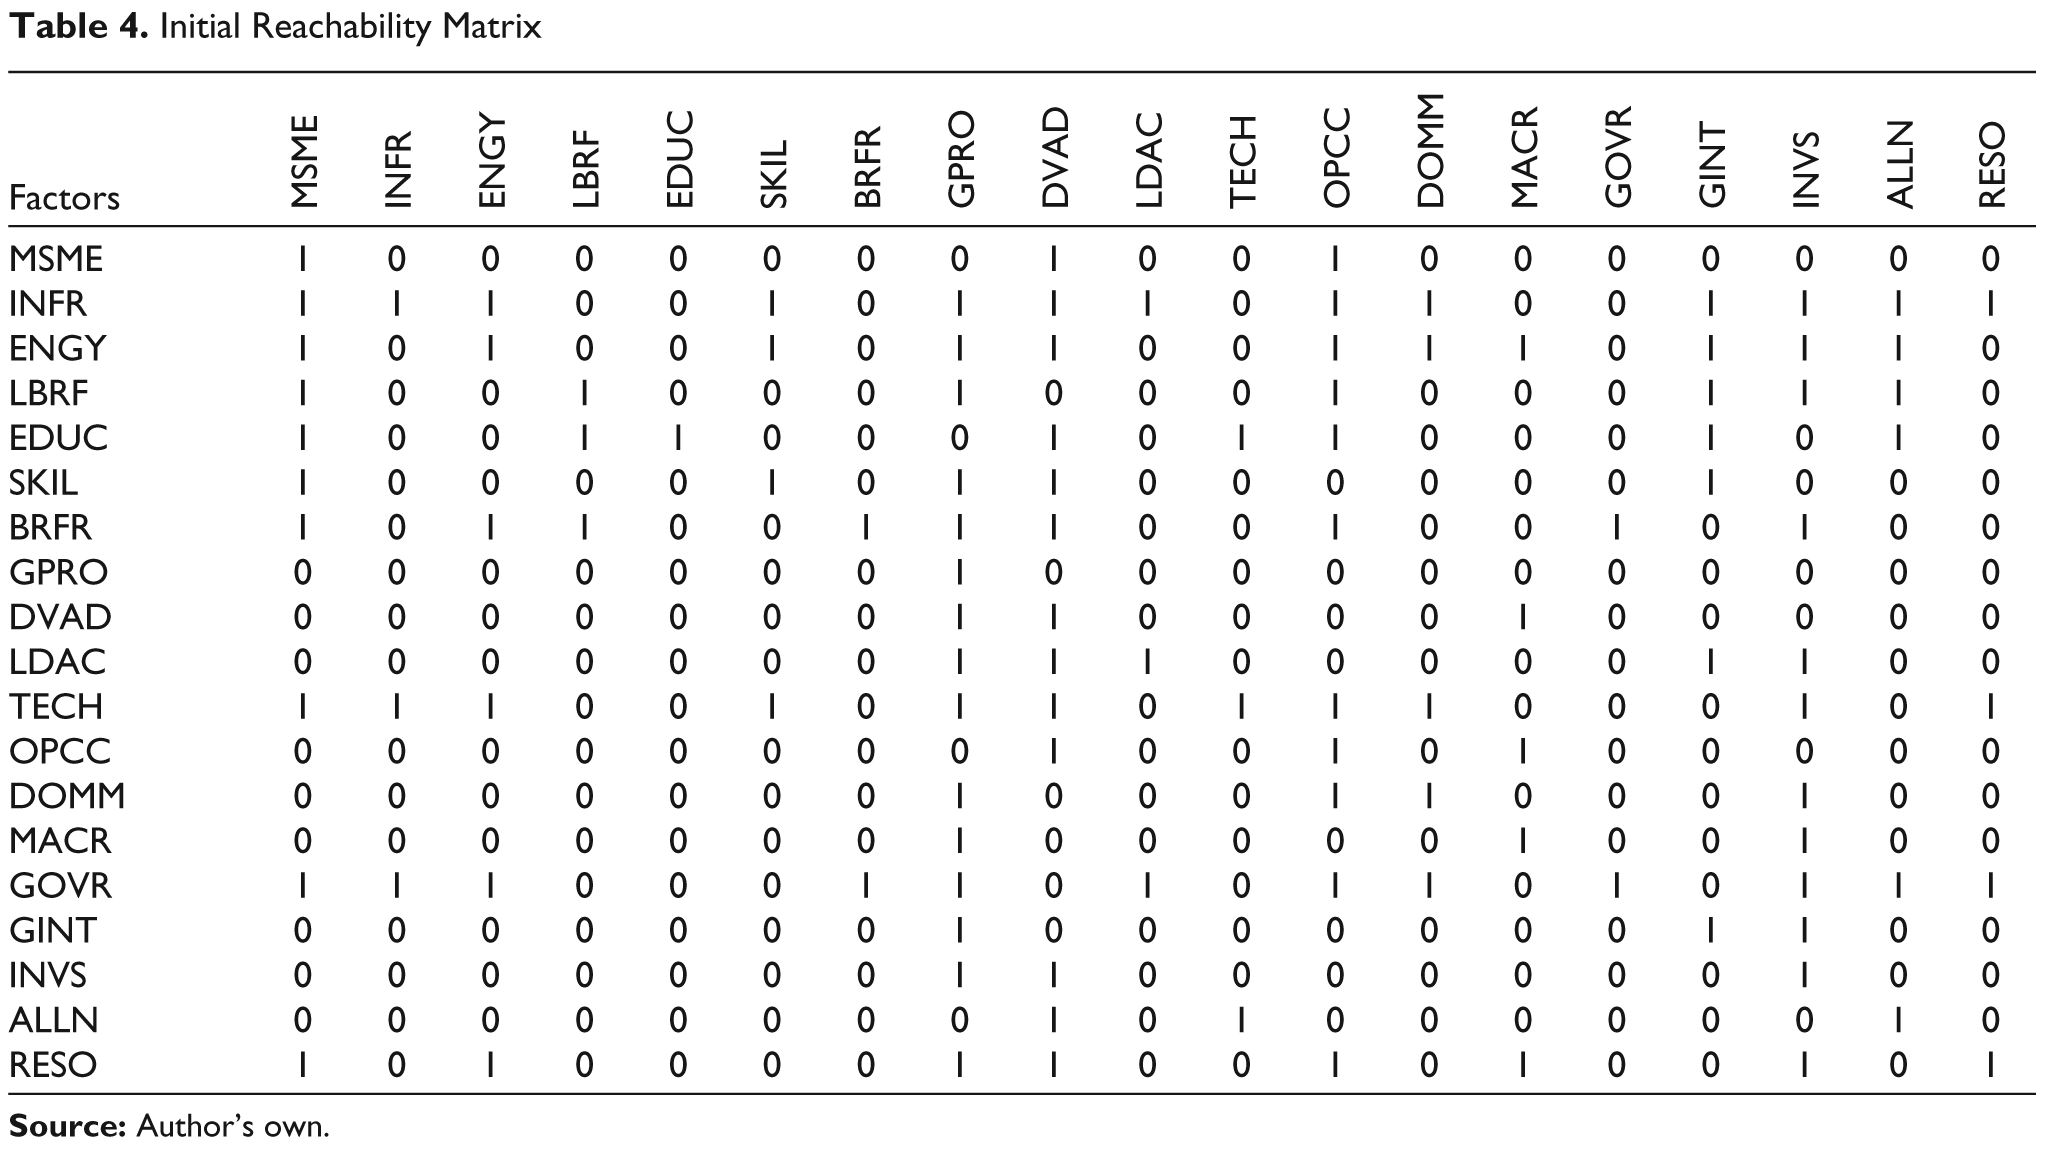
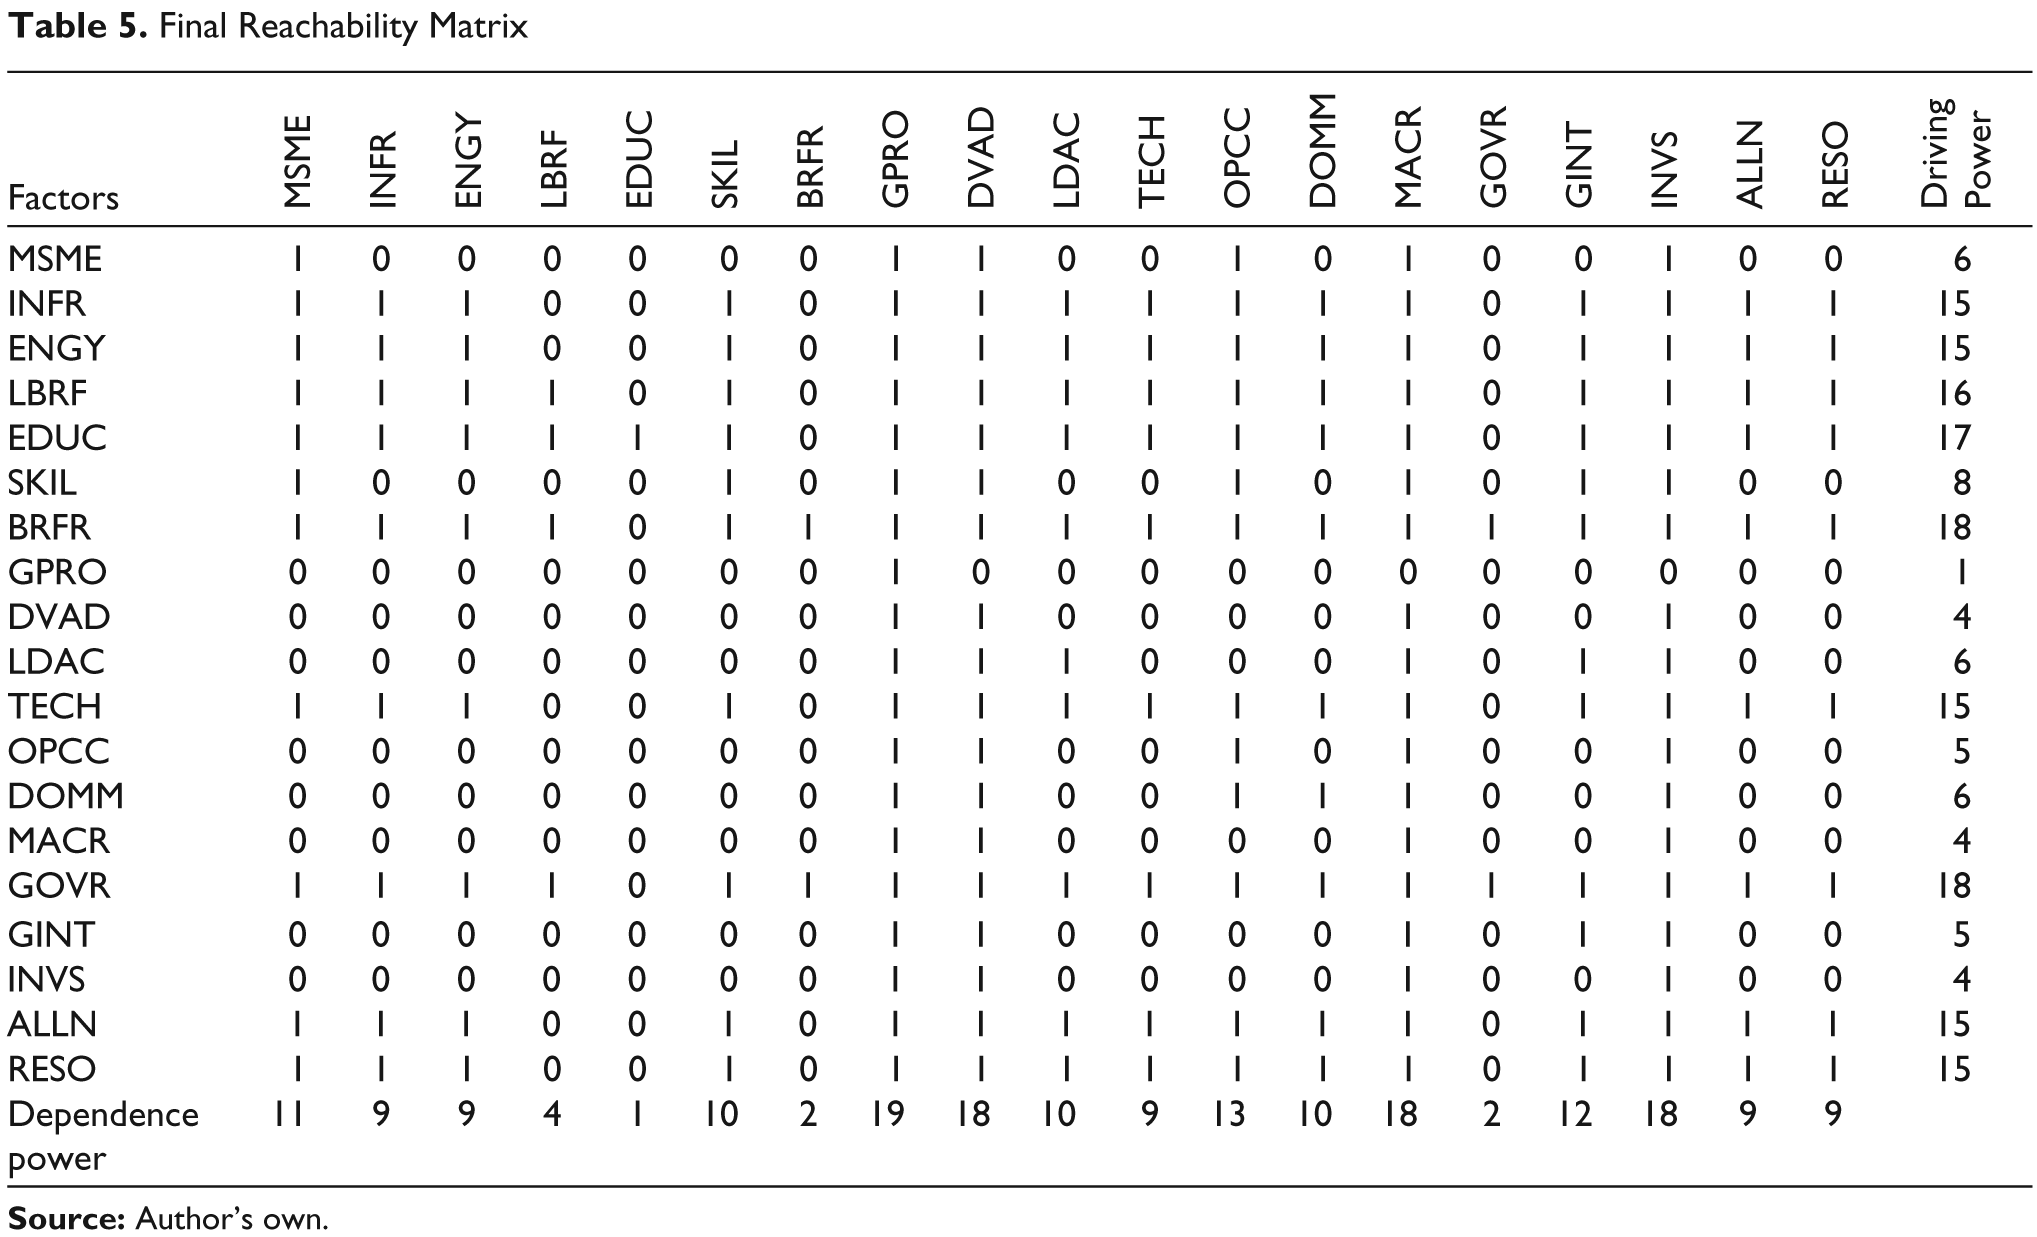
Evolve factors (Z) impacting the outcome under study through a group of experts and literature survey. Sequentially place the factors, in rows and columns of the Z × Z matrix. Involve the experts to develop the ‘structural self-interaction matrix’ (SSIM). Transform the SSIM into its binary (0–1) form, referred as the ‘initial reachability matrix’ (IRM). Finalize the ‘final reachability matrix’ (FRM) by checking for embedded transitivity (Malone, 1975). Do the partitioning, using the reachability and antecedent sets, and identify the hierarchical levels. Rank each factor, row-wise and column-wise, in the FRM by adding the 1s. Carry out the MICMAC (‘matriced impacts croises-multiplication applique and classment’, meaning cross-impact matrix multiplication applied to classification) analysis using the scatter diagram. Develop the digraph using the levels of the factors developed from step 6.
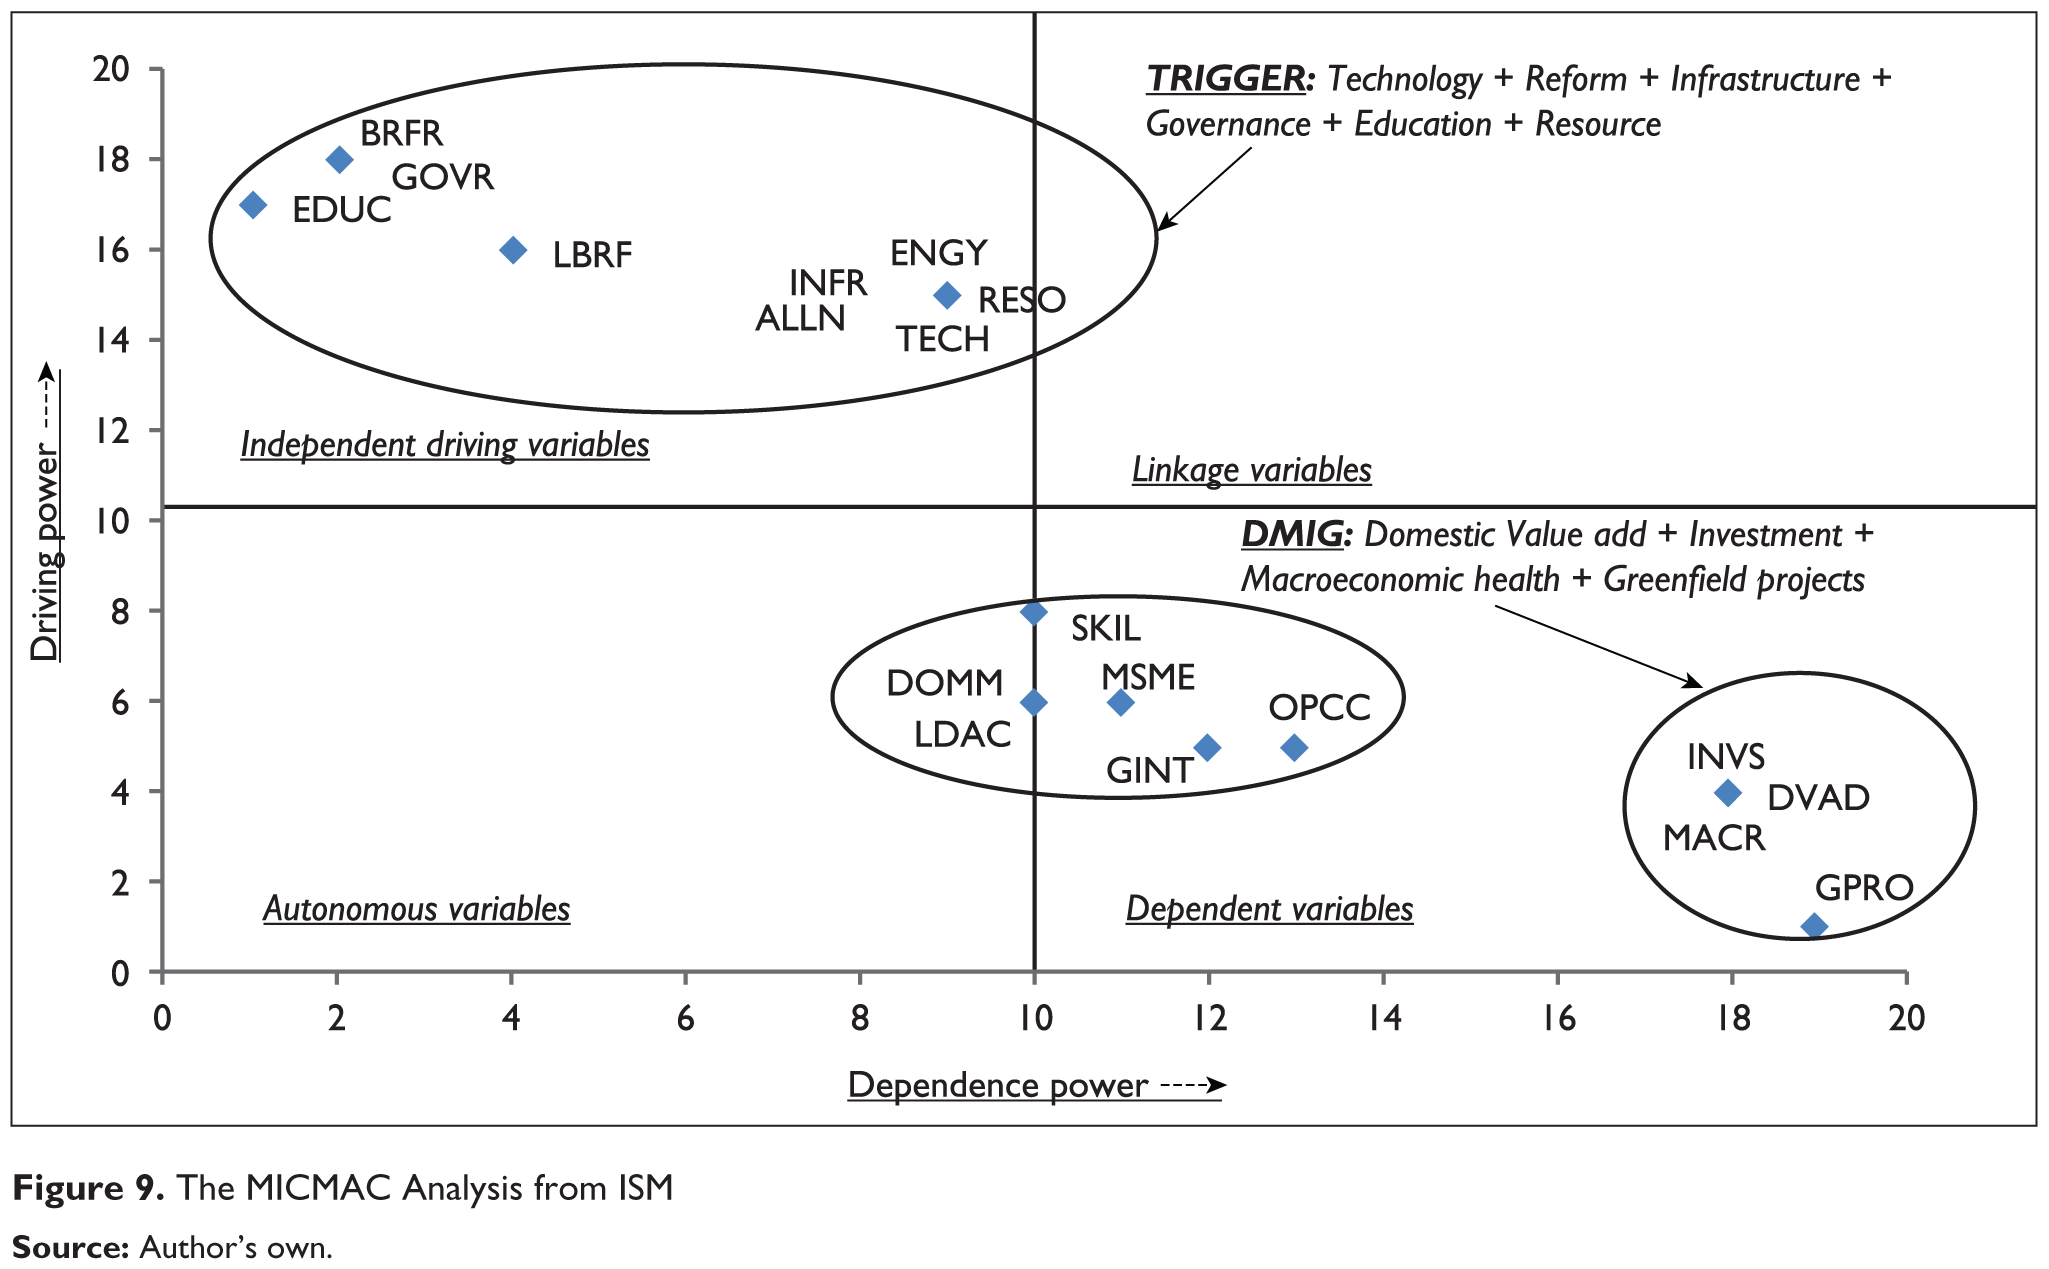
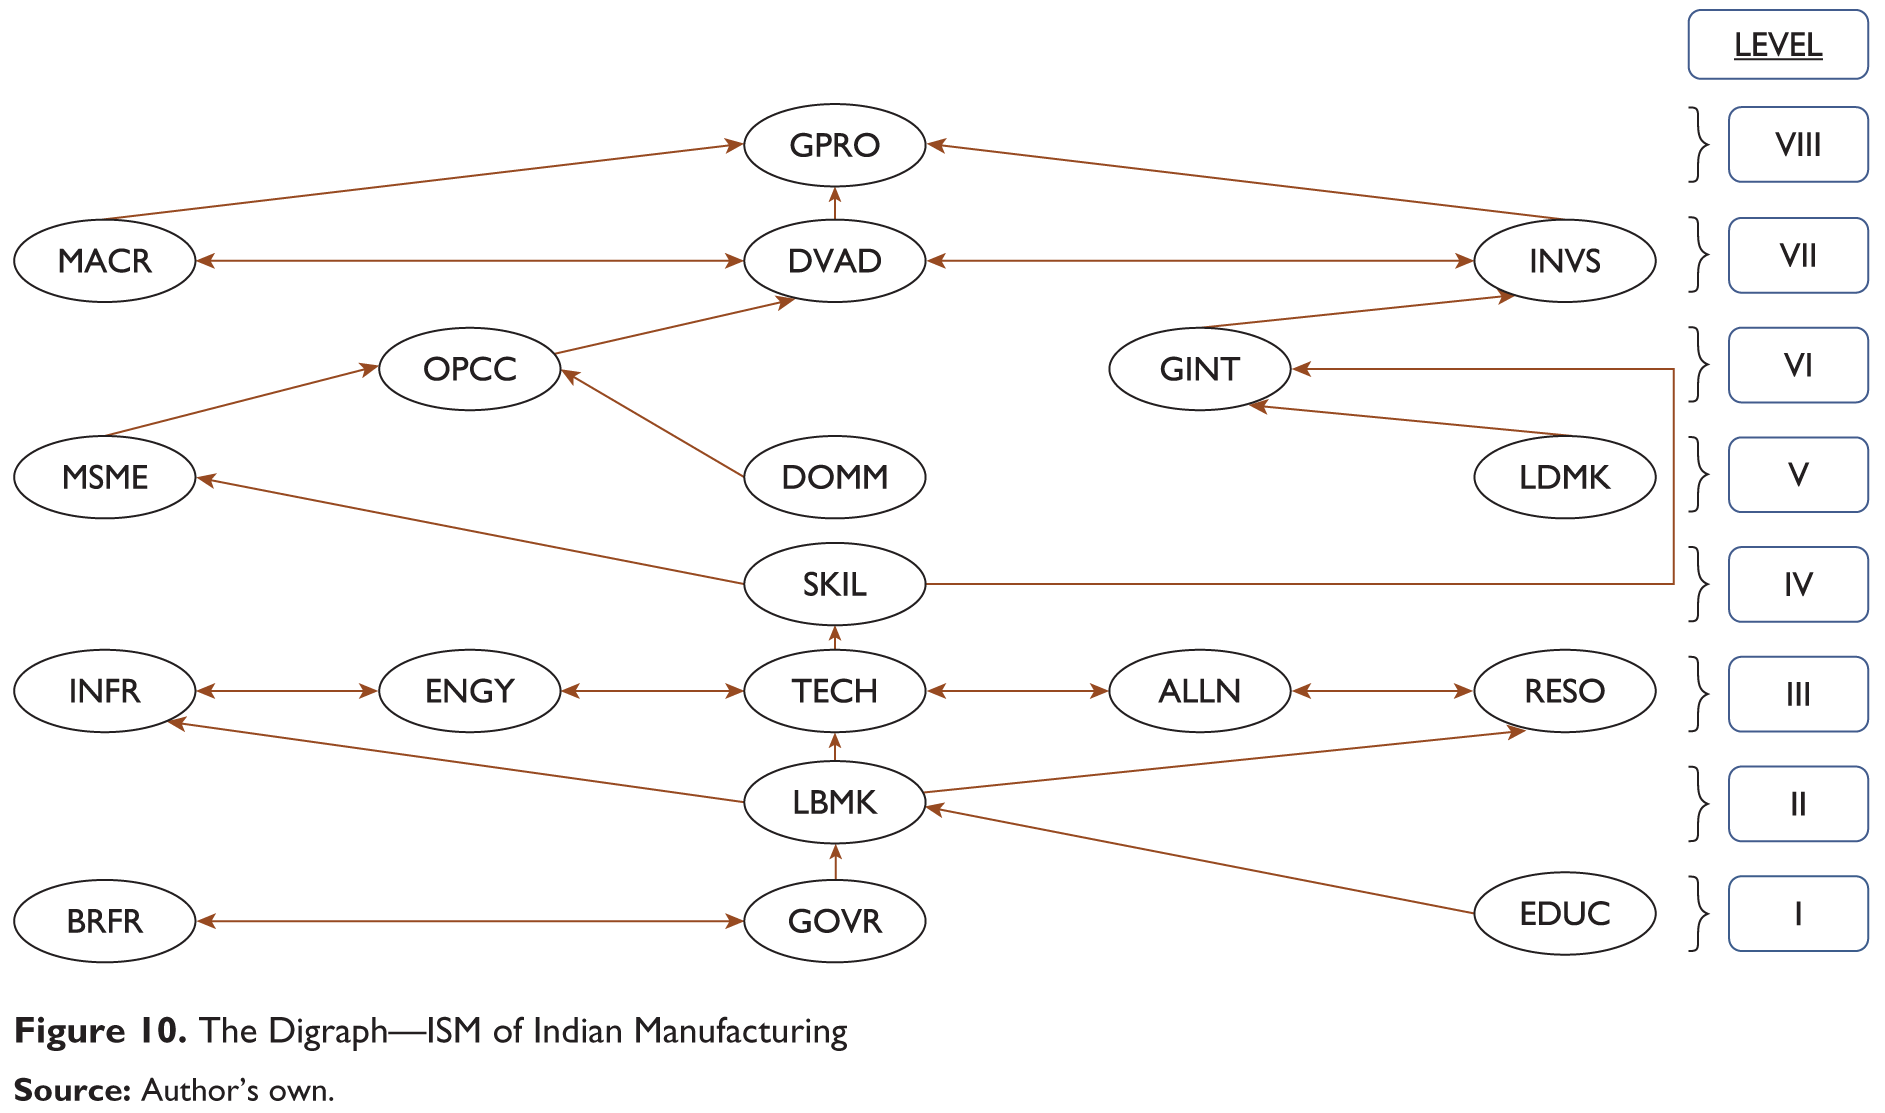
The key outputs—SSIM (Table 3), IRM (Table 4), FRM (Table 5), MICMAC analysis (Figure 9) and the digraph (Figure 10)—have been presented.
The interpretation of the MICMAC analysis and the digraph of the ISM approach on manufacturing growth have been discussed in the ‘Results and Discussions’ section.
Causal Relationship Representation
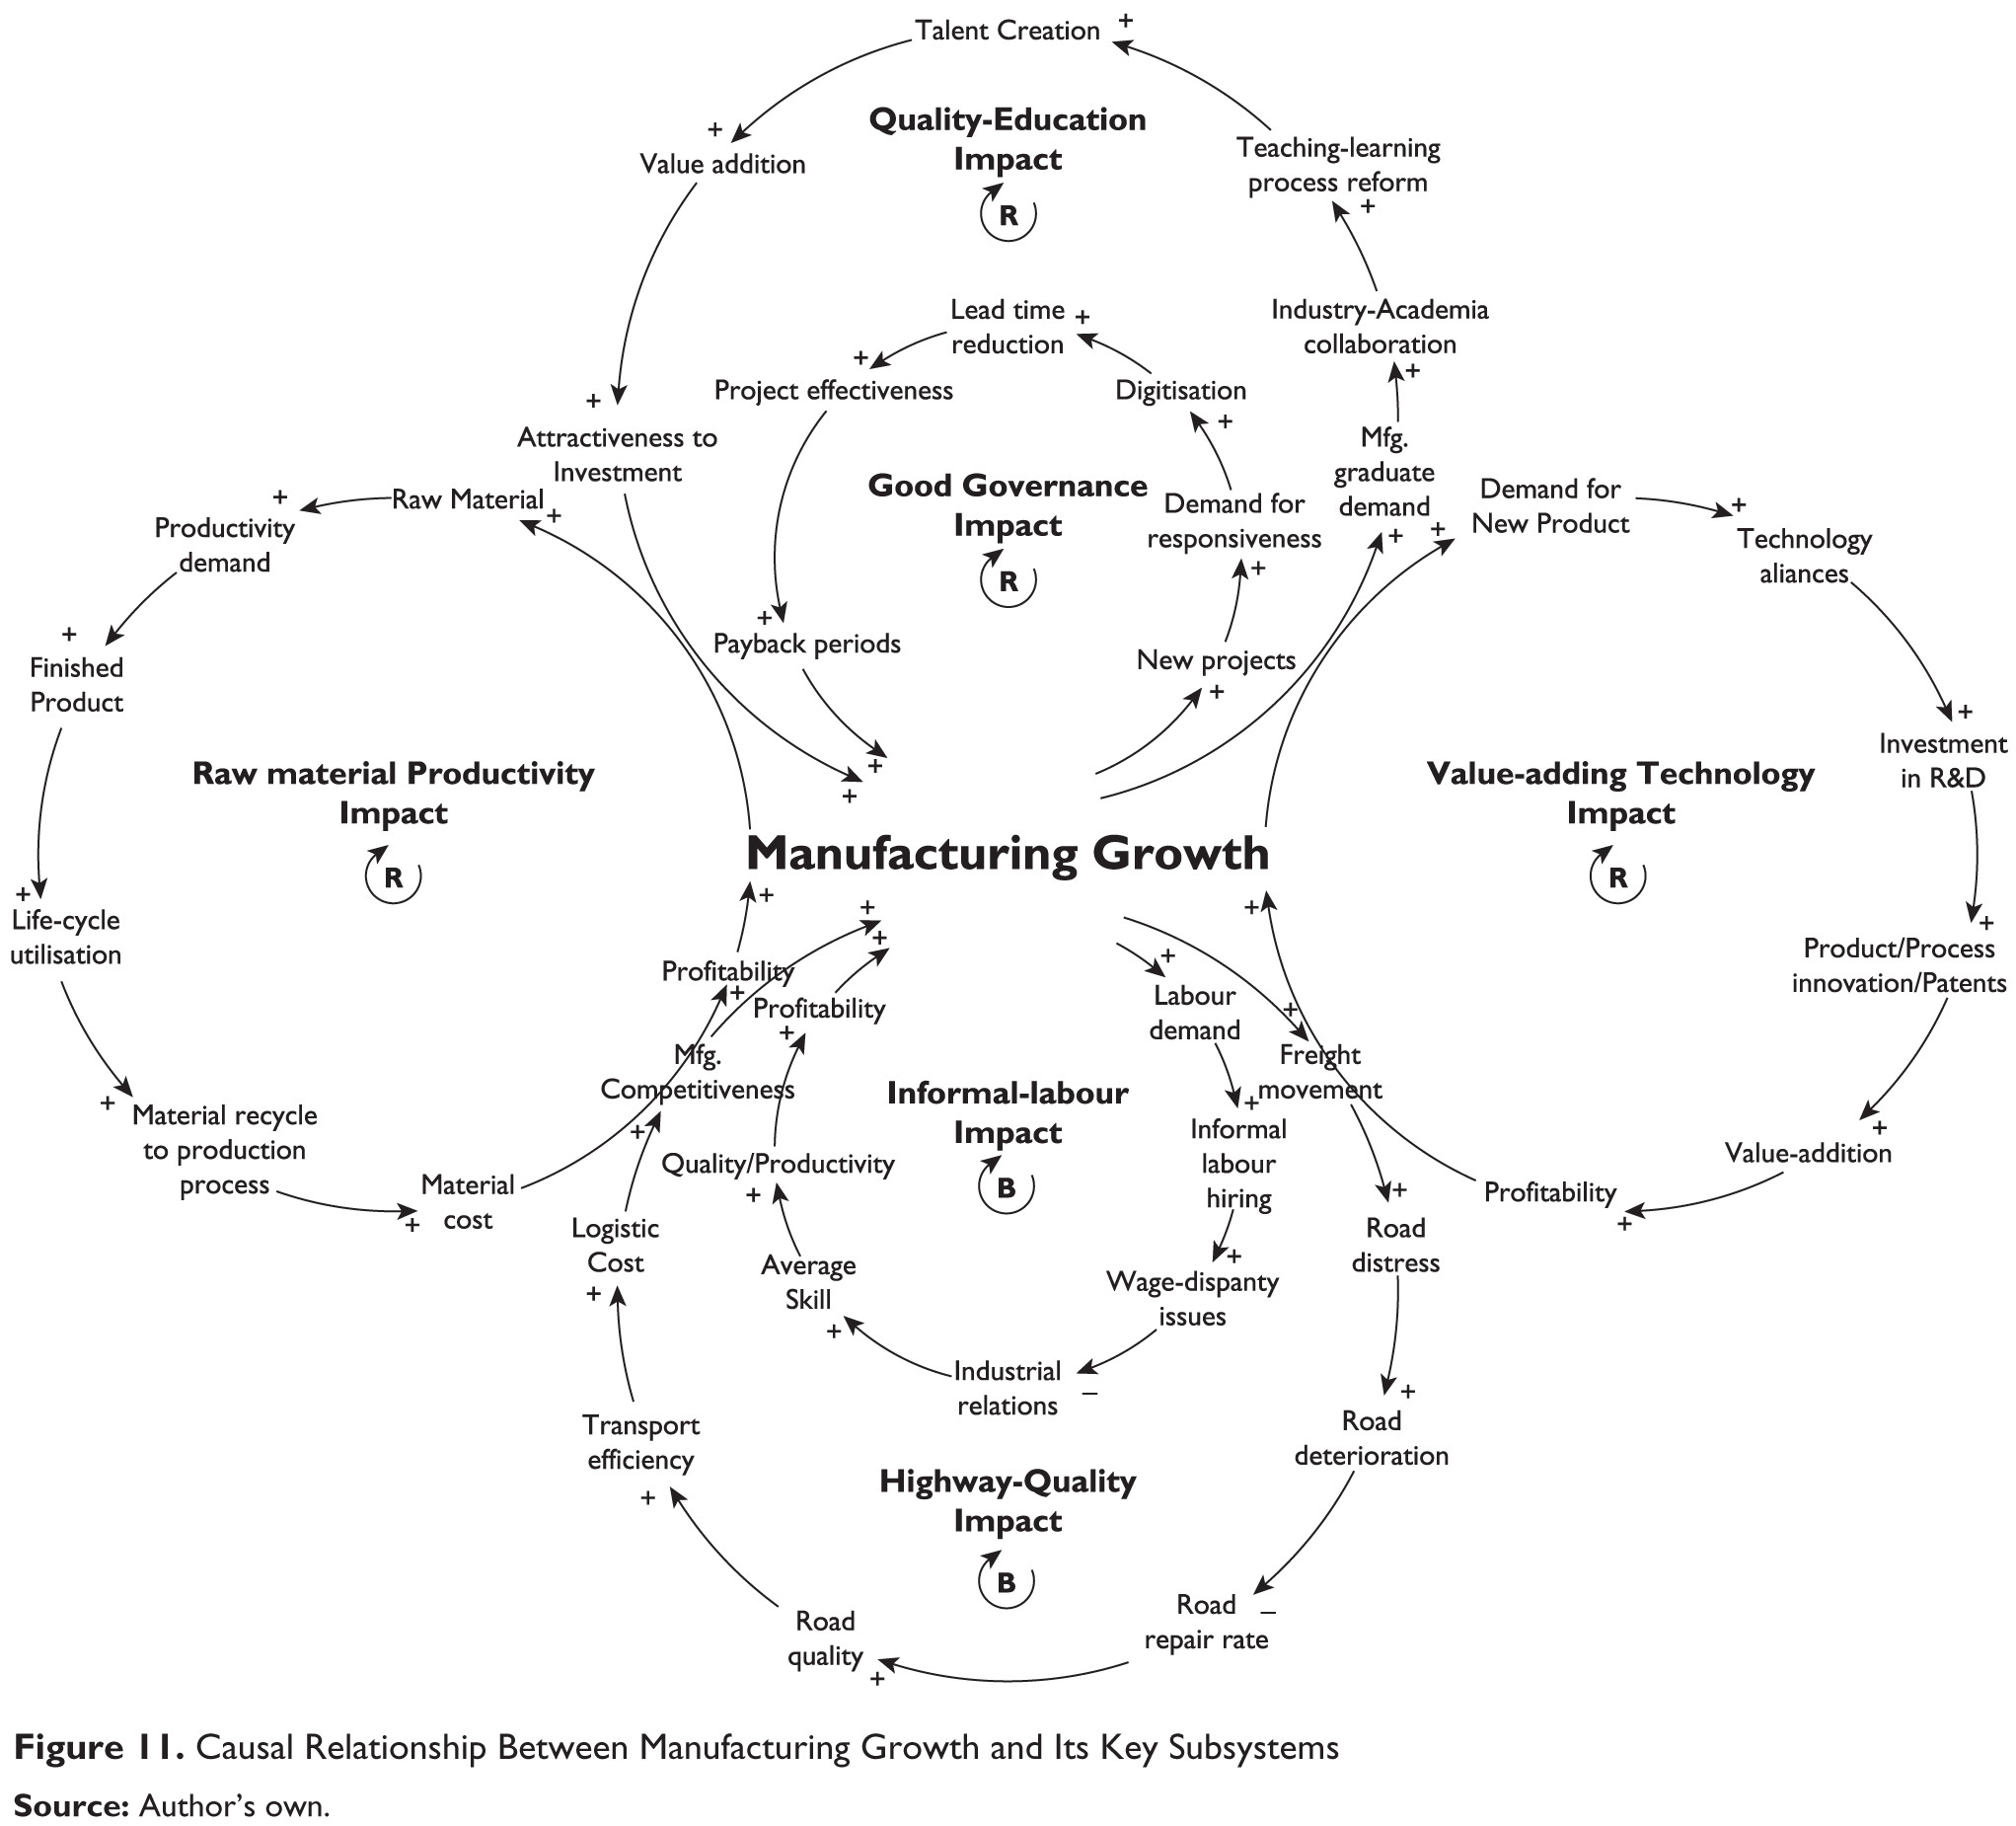
The authors have attempted to map and analyze the growth in the manufacturing sector using the CLD approach employing six key feedback loops. These loops cover the six subsystems represented as an acronym TRIGGER: value adding Technology, labour-related Reforms, Infrastructure quality, Good Governance, Education quality and natural Resource. These six subsystems encompass nine independent driving factors (TECH, ALLN, LBRF, INFR, ENGY, GOVR, BRFR, EDUC and RESO) derived from the MICMAC analysis of the ISM approach shown in Figure 9. Another accepted paper (Ojha & Vrat, in press) through an application of ANP modelling has been proposed top priority to the similar set of six subsystems in India’s manufacturing. A simple causal relationship between the manufacturing growth and the elements of the six subsystems has been depicted in Figure 11, which is self-explanatory.
In Figure 11, there are reinforcing and balancing loops (Sterman, 2013) with delays, which would result in different growth patterns of manufacturing sector, over time. The CLD does trigger some actionable thoughts for policy decisions. In other words, it pushes the government to press the reform pedal to full-throttle to ensure it moves towards achieving the NMP objective of 25 per cent share of manufacturing in GDP by 2025.
Structural Self-interactive Matrix

Initial Reachability Matrix
Final Reachability Matrix
Results and Discussions
In this section, the interpretation and analyses of results obtained through the three modelling approaches are discussed as follows:
Analysis of various scenarios simulated through SD. The scenario O reveals that though the target set in the NMP of having 25 per cent share of manufacturing section in GDP by 2025 is exceedingly challenging, yet it is achievable. In scenario O, to be realizable, annual manufacturing growth has to be aimed at 14 per cent in the first five years and peak at 18 per cent for the next five years. In scenario O, due to intense focus on the manufacturing sector, the share of service as well as agriculture and allied sector shows decline. In scenario O, GDP is expected to reach 10.3 per cent by 2025 (2004–2005 basis). The share of each sector in the GDP by 2025, shown in Figure 4, will be as follows: service—62 per cent, manufacturing—26 per cent, other non-manufacturing industry—2 per cent and agriculture and allied—10 per cent. In scenario P, when the business is as usual, the year-on-year manufacturing sector growth will be slow with lowest level during the 2012–2013 period and will peak to its previous best in the next 10-year period as seen in Figure 5. However, as per Figure 6, the share of manufacturing in GDP will increase at a slow pace to only 17.5 per cent by 2025. Thus, the NMP goal is not realizable under this scenario. In scenario P, GDP will be reach 7.6 per cent. The share of each sector in GDP by 2025 as shown in Figure 6 will be as follows: service— 69 per cent, manufacturing—17.5 per cent, other industry—2.7 per cent and agriculture and allied—10.6 per cent. In scenario M, the most-likely scenario, the year-on-year manufacturing sector growth trend will be fairly demanding. Its slope will be less steep than that in scenario O, but steeper than scenario P. It will be near 18 per cent by 2022 and reach 21.4 per cent by 2025, as seen in Figure 7. In scenario M, the GDP is expected to reach 8.8 per cent. The share of each sector in GDP by 2025, shown in Figure 8, would be as follows: service—64.5 per cent, manufacturing—21.4 per cent, other industry—2.4 per cent and agriculture and allied—11.8 per cent. MICMAC analysis From Figure 9, it is evident that there are three distinct clusters emanating from the MICMAC analysis of ISM. Nine factors fall in the independent driving variable quadrant, four fall into the dependent variable quadrant and the remaining six fall into the category of weak driving power and average dependence-power category. The vacant autonomous variable quadrant indicates that all the identified factors are strongly connected to the manufacturing growth. The linkage variable quadrant is also seen to be vacant, indicating that there is no strong driving cum high-dependence power variable which affects other factors and also provides a feedback on them. The first cluster of nine is led by two strong driving factors—Governance (GOVR) and Business Regulatory Framework (BRFR). Reducing bureaucracy and dramatically improving execution at all levels of the government would mean good governance, and it would act as a catalyst to the manufacturing growth. In the BRFR domain, simplifying the business regulatory laws, improving authority’s responsiveness, bringing transparency and timeliness in clearances and creating accountability by digitization of the processes would substantially improve India’s global ranking in competitiveness index which has been low at 60 out of 144 countries (Sala-I-Martin et al., 2013). Education (EDUC), obviously, has also found a very high driving power of 17. Education greatly influences the transformation process of not only the minds but the mindsets too. It leads to creating innovative entrepreneurs, globally employable people and world-class leaders for industries and researchers for R&D. The next factor in the first cluster is the Labour Reforms (LBRF), which is currently a critical driver of the manufacturing growth in Indian industry. The quality of the workforce, the quantity and quality of apprentices being produced for running operations, the strength of the informal employment workforce, the performance-driven flexibility in recruitment and exit of labour force, the industry classification based on the number of workers and the upskilling as well as retraining processes are key to changing the face of manufacturing. The subsequent five factors (INFR, ENGY, TECH, ALLN and RESO) of the first cluster have the same but high driving power of 15. India’s global manufacturing competitiveness ranking is primarily driven by these five key factors. Speedy completion of infrastructural projects, power sector reforms for industries, technology coupled with innovation in products, processes, markets and competencies, alliances for a win–win approach and effectively managing the natural resources will enhance the competitiveness of the manufacturing sector. Based on the affinity, the nine factors of first cluster can be grouped into six subsystems of Technology, Reforms, Infrastructure, Good Governance, Education and Resource with an acronym TRIGGER. The six factors (SKIL, OPCC, MSME, DOMM, GINT and LDAC) in the second cluster are quite important for imparting speed to manufacturing growth in India. A strong apprentice training system (SKIL) coupled with in-house training set-up would bridge the gap between education and employability. The barriers to land acquisition (LDAC) create a big hindrance to expansion and start of new project. MSME is the largest contributor to the manufacturing sector in terms of labour employment, innovation, cost-effectiveness, turnover and exports. The third cluster comprising of GPRO, DVAD, MACR and INVS factors has very high dependence power of around 18 and is an excellent result measure for tracking the manufacturing growth. An effective project monitoring group for the GPRO, the increasing value-add through high exports in DVAD, narrowing fiscal deficit for healthy macroeconomic indicators (MACR) and transformational reforms for facilitating investment (INVS) will push for a healthy manufacturing growth. Digraph analysis The digraph in Figure 10 has divided the hierarchy of the nineteen factors into eight levels which have been derived from the reachability–antecedent factor sets of the ISM approach (Agarwal et al., 2007). The interpretation of the relationship between the factors in the hierarchy is discussed as follows:
The Education (EDUC) quality and level, Business Regulatory Framework (BRFR) and Governance (GOVR) are driving the remaining 16 factors for manufacturing growth. A sound foundation of professional education would create bright entrepreneurs and researchers. The transformational labour reforms and quality of vocational curriculum will raise the skill bar. Simple, transparent and responsive business regulatory framework, good execution, implementation of reforms, fast-tracking project clearances and facilitating enforcement of law with zero corruption will supplement good governance. India, with a low wage-driven workforce but low labour productivity, continues to have an unattractive total labour cost. This coupled with not so-healthy industrial relations makes Labour Market Factor (LBRF) quite critical. Ninety-two per cent of the employment in manufacturing remains to be informal, indicating large wage disparity for the same work which is prone to labour unrest. This has also been represented in the CLD of Figure 9. The rigid labour laws virtually disallow the firing of even the poor performers, leading to industry’s performance deterioration. Hence, the LBRF rightly finds the level-II position. Level III in the hierarchy includes five factors—INFRA, ENGY, TECH, ALLN and RESO—being driven by the LBRF. A healthy labour-relation environment will encourage technical alliances, facilitate the growth of core sectors of infrastructure and energy which will significantly improve the productivity and yield in the labour-intensive mineral, mining and quarrying sectors. Another key driver to the manufacturing is the Workforce Skill (SKIL) level, finding a place at level IV. This is driven by rolling out competent and good number of apprentices to feed the growing manufacturing sector and improving vocational training curriculum. A continuous process of upskilling and reskilling of the industrial workers through structured in-house training, exposure to benchmark manufacturing processes and learning from world-class alliance partners maybe useful. GPRO falls in level VIII, while DVAD, INVS and MACR fall into level VII of the hierarchy. The increasing number of new projects (GPRO) is critical. The global manufacturing competitive edge emanating from levels I to VI will accelerate the inflow of foreign direct investment (INVS), increase the domestic value addition (DVAD) and make the macroeconomic (MACR) indicators healthy.
Limitations and Future Scope of Work
The three scenarios—the optimistic, pessimistic and the most-likely, discussed in this article are based on the assumptions and expert inputs from the industry and academia. The outcome of the research therefore is dependent on these assumptions. The behavioural pattern of the driving factors (TRIGGER) on the manufacturing growth may be further modelled and tested using the stock and flow diagram in SD. The application of the CLD approach (Figure 11) in understanding causality between the elements of the six key subsystems and the manufacturing growth can be extended to developing the SD modelling using SFD (stock and flow diagram) (Sterman, 2013) to understand long-run behavioural trends.
Conclusions
This article has attempted to identify the critical issues that impact the growth of manufacturing in India. The economic growth scenario analysis using the SD-based simulation has revealed that achieving 25 per cent manufacturing share in GDP by 2025 from the current level of 15 per cent is quite a challenging task. However, it is an achievable target. For it to happen, the futuristic annual manufacturing growth rates have to get stretched, touch the previously achieved highest rate of 14 per cent in the initial five years and then peak at 18 per cent in the last few years of the target time horizon of 2025.
ISM examined the 19 factors identified through the MICMAC analysis and the digraph and highlighted the need to focus on just the nine driving factors and the four dependent factors (DMIG). Good governance (GOVR), simplifying the existing complex business regulations (BRFR) and curbing the red-tapeism, will incentivize the entrepreneurs and deliver the start-up-expected manufacturing growth. Implementation of the much-needed reforms in the areas of labour (LBRF), infrastructure (INFR), energy sector (ENGY), vocational education and skill development (EDUC and SKIL) would turbocharge the growth. Finally, the effectiveness and efficiency in natural resource management (RESO) will help forge big alliances (ALLN) to transfer technology (TECH) for innovation as well as attract foreign and domestic investments (INVS) and take manufacturing to the desired growth level. This will lift the GDP growth level to near 8 per cent in next five years and then to a double-digit figure in the subsequent five-year period.
The causality between the six key subsystems (TRIGGER) impacting the manufacturing growth can be well understood using the CLD of the SD approach. It can serve as a foundation for simulation modelling through SFD to analyze manufacturing growth system behaviours.
Footnotes
Acknowledgements
The authors thank the anonymous referees whose constructive suggestions and comments have resulted in substantial improvements over the original version of this article.