



Abstract
This study examines the connection between electricity consumption and economic growth of India from 1980 to 2017. Initially, the study conducted stationary test to study the stationarity properties of the variables. Autoregressive distributive lag (ARDL) model was used to estimate the long-run relationship among the variables. In addition to this, to estimate the causality between the variables, the study has employed Toda–Yamamoto Granger causality test. The long-run estimation of the ARDL model suggests that electricity consumption does not impact output per capita, while financial development and physical capital have positive and significant impact on output per capita. In line with the ARDL model, the Toda–Yamamoto Granger causality test also does not show any causal relationship among the variables. Based on the empirical outcomes, the study suggests few policy prescriptions.
Introduction
The literature exploring the relationship between the growth of an economy and consumption of energy can be traced back to the 1970s, and it is found that it coincided with the oil crisis. This triggered a series of events, thereby putting pressure on the countries to ensure efficient use of energy and conserve energy as well. The global economy was driven to another energy crisis due to high oil prices in the 2000s. Moreover, climate change concerns have prompted countries to try to limit their demand for energy. However, for the developing countries, it poses another challenge as they fear that limiting the use of energy may act as an obstacle in their economic growth. In view of the importance of these economic as well as environmental issues, the research conducted in this field is significant. In the neoclassical framework, growth of an economy is not ascribed to increased use of energy, and it is only regarded in the national accounts as a portion of the output of the economy (Jamil & Ahmad, 2010). However, energy is a fundamental part of the production process and economic growth; therefore, it requires to be studied closely in order to recognize the causal association between growth and energy consumption.
A number of research efforts have investigated the relationship between energy consumption and economic growth in various nations resulting in conflicting outcomes. The overtime factors of production are one of the dominant determinants, which affect economic growth. Though the initial studies did not include efficient use of energy as a factor of economic growth, it was considered a part of economy’s gross output. But in the current economic scenario, such simplified role of energy consumption, especially electricity consumption, is no more permissible. In fact, electricity consumption is an integral part in assessing the economic growth path of a country as it is one of the major factors of production in today’s world. Through its involvement with both production and consumption of goods and services, consumption of electricity does play as a key indicator of economic growth and development. On the one hand, some studies conclude that energy is a vital driver of economic growth since it complements various factors of production (Altinay & Karagol, 2005; Asafu-Adjaye, 2000), while, on the other, researchers like Soytas and Sari (2003) found that energy is neutral to the growth of an economy.
The present attempt is an exercise to enquire into the causal association between consumption of electricity and growth of the Indian economy in both long and short run. The direction of the causality among the price, consumption of energy and economic activity has significant policy implications. Most of the existing studies examining these issues take into consideration the developed countries, but the recent ones delve into the potential of the developing countries as well. The study is important from the perspective of policy prescription that electricity may play the role of a catalyst in economic growth, and a shortage in supply may affect the growth process adversely. Along with Toda–Yamamoto Granger causality test, the present study has applied unrestricted autoregressive distributive lag (ARDL) method to investigate this causal relationship.
Review of Literature
A number of scholarly works have highlighted the vital linkages between economic growth and electricity consumption. On studying the existing literature, we can conclude that the results of these studies point in three directions. Some of these studies show a one-way causality running either from energy consumption to economic growth or vice versa, bidirectional causality and the absence of any causal relationship between the two. Though investigating the causal relationship between the two and its direction has been the principal concern in most of the studies, there are models that have used this relationship for forecasting purpose only. There is diversity in the findings, which is mainly the result of variations in factors such as specification of the model, selection and specification of variables, methodology adopted, countries or areas under study and time periods. This entire body of literature can be classified into the following broad groups.
Developed Countries
Though numerous studies have discussed the issue of causal relationship, the study by Kraft and Kraft (1978) is considered to be one of the first efforts in this direction. Studying the US data from 1947 to 1974, they found that the gross national product (GNP) has a profound impact on the electricity consumption of the USA. It is evident that most of the initial studies were concerned about developed countries only, but there are studies that have adopted the same econometric modelling but to different sets of data and found varying results. For example, both Murry and Nan (1994) and Thoma (2004) applied the vector autoregressive (VAR) technique on US data to analyse this causal relationship. But they had different sets of data. Murry and Nan (1994) considered the period from 1970 to 1990, while Thoma (2004) used the period ranging from 1973 to 2000. As a result of this, Murry and Nan (1994) found no such causal relationship between electricity consumption and real gross domestic product (GDP), but Thoma (2004) did find a one-way causal relationship from industrial production (approximated as indicator of economic growth) to electricity usage for the US economy. Further, Shahbaz et al. (2017) examined the Portuguese economy and found that there existed unidirectional Granger causality, running from electricity consumption towards economic growth, thereby, showing that it was energy dependent.
Developing Countries
The nexus of electricity consumption and growth has also been investigated as far as the developing countries are concerned. Shiu and Lam (2004) had conducted their study focusing on China during the period from 1971 to 2000 and found that there is a one-directional causality from electricity consumption to economic growth, but Chen et al. (2007), taking almost same data (1971–2001), found that there is no evidence of causality from electricity consumption to economic growth. The only difference between these two studies is that while Shiu and Lam (2004) applied Johansen–Juselius cointegration and vector error cointegration (VEC), Chen, Kuo and Chen (2007) applied Pedroni cointegration technique. In line with Shiu and Lam (2004), a recent study (Zhong et al., 2019) found that electricity consumption positively impacts economic growth of China. There have been differences among several studies in defining economic growth. Few have used real GDP per capita as proxy of economic growth (Mozumder & Marathe, 2007; Narayan & Smyth, 2005; Yang, 2000), while some have measured economic growth by real GNP per capita (Tang, 2008). Few researchers have also used industrial value added and agricultural value added as the proxy of economic growth (Zamani, 2007), while some have employed real import growth as a proxy variable for economic growth (Abosedra et al., 2009).
India-specific Literature
In addition to the aforementioned research mentioned, there are a number of studies that focus specifically on India. For instance, Ghosh (2002), using real GDP per capita as a proxy of economic growth and adopting VAR technique, found a unidirectional causality from economic growth to per capita electricity consumption in India over the period from 1950 to 1997. Ghosh (2009) found similar results for a different period, ranging from 1970 to 2006, where the study applied ARDL bound test. Both these studies did not find any reverse causality. Similar is the finding of Chen et al. (2007), where they took Indian data for the period 1971–2001 and found that economic growth resulted in an increased consumption of electricity. Approximating human development index (HDI) as the index of socio-economic growth and utilizing time series data from 1990 to 2016 for India, Rej and Nag (2019) found the presence of long-run causality from HDI to energy consumption but failed to find any reverse causality. Phukon and Konwar (2019) applied Engle–Granger method of cointegration and Johansen–Juselius multivariate method on Indian annual data from 1970 to 2002 and found a bidirectional causality between economic growth and energy consumption. Behera (2015) examined causality between energy consumption and economic growth for India over the period from 1970 to 2011 and found a bidirectional causality, which was in line with Phukon and Konwar (2019). Supporting the conservation hypothesis, Meher (2016) found unidirectional causal relationship from economic growth to electricity consumption, where cointegration and vector error correction method (VECM) were employed on annual data for the period from 1980 to 2014 for the Indian state of Odisha. Contradictory results can be seen in the study undertaken by Tiwari (2012), who applied Granger causality in VECM framework to the annual data of India from 1970 to 2005 only to find an absence of any causal relationship between economic growth and energy consumption and advocated for efficient use of energy. On the other hand, Ohlan (2018) found a positive relationship between electricity consumption and economic growth in India. Furthermore, Tiwari et al. (2021) examined the Granger causal relationship between economic growth and electricity consumption at the state as well as sectoral levels. The outcome in this study determined a long-run relationship, which was restricted to the agricultural sector, therefore, implying that a shortage in electricity may affect the growth of the agricultural sector. This conclusion corroborates the findings by Nain et al. (2012) but is in contrast to the outcome of Nain et al. (2017) at the sectoral level.
Methodological Issues
Over time, various researchers have addressed this issue from several viewpoints and, hence, there are dissimilarities in the model specifications and econometric methods adopted. Methods that are generally employed include Granger causality (Abosedra et al., 2009; Fatai et al., 2004; Murry & Nan, 1994), Engel–Granger test of cointegration (Yoo & Kim, 2006; Zamani, 2007), Johansen–Juselius cointegration (Lee & Chang, 2005; Yoo, 2005), etc. Different methods have also been adopted to explore the direction or even the existence of causality like VAR (Abosedra et al., 2009; Ghosh, 2002; Thoma, 2004), VEC (Ho & Siu, 2007; Lee & Chang, 2005; Shiu & Lam, 2004) and ARDL (Ghosh, 2009, Narayan & Singh, 2007; Tang, 2008). Depending on these approaches, researchers have come up with divergent findings regarding the causal relationship between growth of an economy and electricity consumption.
Since electricity is the most important component of energy infrastructure and a key input in the socio-economic development of an economy, it plays a crucial role not only in the development of various sectors but also in the production functions. Different sectors such as agriculture, household and industry are directly dependent on electricity, but it is unclear whether a rise in electricity consumption reflects economic development in India. The existing literature has failed to testify the causality among the two variables in the case of India. Therefore, this study seeks to investigate the presence of causal relationship between the economic growth of India and electricity consumption. Identification of the existence as well as the flow of the causal relationship between these two variables may prove to be helpful to the policymakers in determining the policies and steps towards better implementation of different electricity-related policies in India.
The present study further adds to the existing literature in the following ways. First, the model adopted in this study stands apart from the ones employed in the previous studies as it incorporates human capital and physical capital as independent variables. Further, this model allows us to assimilate neoclassical and endogenous growth along with environment–economics points of view in order to examine the relationship between economic growth and consumption of energy in India. Finally, for causal interaction, along with ARDL bound cointegration test, the study also adopts the Toda–Yamamoto (1995) causality test. This test is more robust than the conventional causality test.
An Overview on the Indian Power Sector
Power is one of the important components, which drives economic growth in a developing country like India. For Indian economy to be on a sustained path of growth, it is imperative to have a developed power sector. With the growth of the economy, demand for electricity has increased rapidly and is expected to further rise exponentially in the years to come. To meet this exponential rise in demand of electricity, India needs to increase its installed generating capacity by a considerable amount. As on May 2018, on account of overall power generation, in the Asia-Pacific region, India ranked fourth out of 25 nations. Subsector-wise statistics on installed capacity reveal that in the same year, India ranked fourth in wind power, fifth in both renewable power and solar power.
Demand–Supply Scenario
The demand for electricity in India is experiencing exponential growth ever since India has adopted sustainable economic growth regime. Power consumption in India is expected to rise to 1,894.7 TWH in 2022 (Central Electricity Authority [CEA], 2021). The ‘Power for all’ view adopted by the Government of India (GOI) has focused on the supply side of energy. According to an estimate, various sectors, such as solar, wind, biomass and hydropower, are expected to supply 114 GW, 67 GW and 15 GW energy, respectively, by 2022. Further, the government has increased the renewable energy target to 227 GW by 2022. As of April 2020, the total installed capacity stands 370.34 GW, and the production of electricity has reached more than 1,250 billion units in FY20 (India Brand Equity Foundation [IBEF], 2022).
Govt. Initiatives and Renewable Energy Integration
The GOI has undertaken several initiatives to boost the Indian power sector. Some basic schemes have been launched exclusively to boost the Indian power sector. For the period from 2019 to 2025, the government has allocated ₹111 trillion for the scheme of National Infrastructure Pipeline. The capacity of renewable energy is projected to be 500 GW by 2030. GOI has launched Ujwal Discom Assurance Yojana (UDAY) to reduce aggregate technical and commercial (AT&C) losses of state-owned power distribution companies (DISCOMs) to 15% by FY19. By 2022, under ‘rent a roof’ scheme through allowing solar panels to be set up in one’s rooftop in lieu of payments, GOI is planning to generate 40 GW of power. It is also planning to increase the power generation capacity of coal-based entity by 47.86 GW by 2022, which is currently 199.5 GW. The first review report by the International Energy Agency (IEA) on India’s energy policies has highlighted that renewable energy in India is growing, and it accounts for almost 23% in terms of country’s total installed capacity. In terms of sharing variable renewables in total electricity generation, some states of India have achieved remarkably (as high as 15%), which according to IEA needs to be integrated smoothly into the power system. According to this report, for integration with renewable energies like wind and solar, investment is required, and it also highlighted that India is making a steady progress towards its target of 175 GW of renewables by 2022.
Financial Sickness and Low Plant Load Factor
The power sector in India has suffered due to the poor financial health of DISCOMs. There are many factors that have led to this dismal financial health status of state-owned DISCOMS specially. Some of these factors are low-cost recovery from tariffs, along with cross-subsidizing household, farmers and politicization of tariff rates. As a result, the sector survives with delicate financial status. This has far-reaching consequences while dealing with the future prospect of this sector and impact on the consumers at large. Due to their poor financial status, they are not only unable to buy power but also lack appropriate investment in new capacity generation and in spreading the network, which is essential for building infrastructure in order to provide uninterrupted transmission. This affects retail consumers adversely as they are deprived of good quality power and often face blackouts. These challenges have resulted in an increase in losses of state DISCOMs from ₹300,000 million in the last financial year to ₹580,000 million in the present fiscal year. According to CRISIL, the debt incurred by states’ DISCOMs has increased by 30% with respect to the previous year reaching ₹4.5 trillion. As of May 2020, DISCOMs’ overdue payments to generators were a staggering ₹1.16 trillion, which has a direct negative impact on liquidity of India’s power sector (Garg & Shah, 2020).
The capacity utilization of thermal power plants can be addressed considering the plant load factor (PLF). While an increase in PLF implies that the thermal power plants are operating aggressively, a decline implies that they are sitting idle, which may be attributed to low demand for power (in some parts of the country), surplus capacity, non-availability of quality fuel, etc. In India, PLF has declined from 78% in 2009–2010 to 56% in 2019–2020. Apart from aforementioned causes, one of the reasons behind this decline may be India’s policy of shifting towards renewable energy resources.
Sources of Electricity Generation in India
Coal thermal power plants are the main sources of electricity production in India. In spite of undertaking various efforts to popularize the use of alternate sources of energy, coal continues to be the main source of producing energy in India. Tracing the share of electricity produced from coal, it is observed that since 2000, it has been continuously increasing. It was 68% in 2000, which rose to 75.69% in 2017–2018 (see Figure 1). Consequentially, the share of all the other sources of energy, barring the renewable sources, have shown a decline over this period of time.
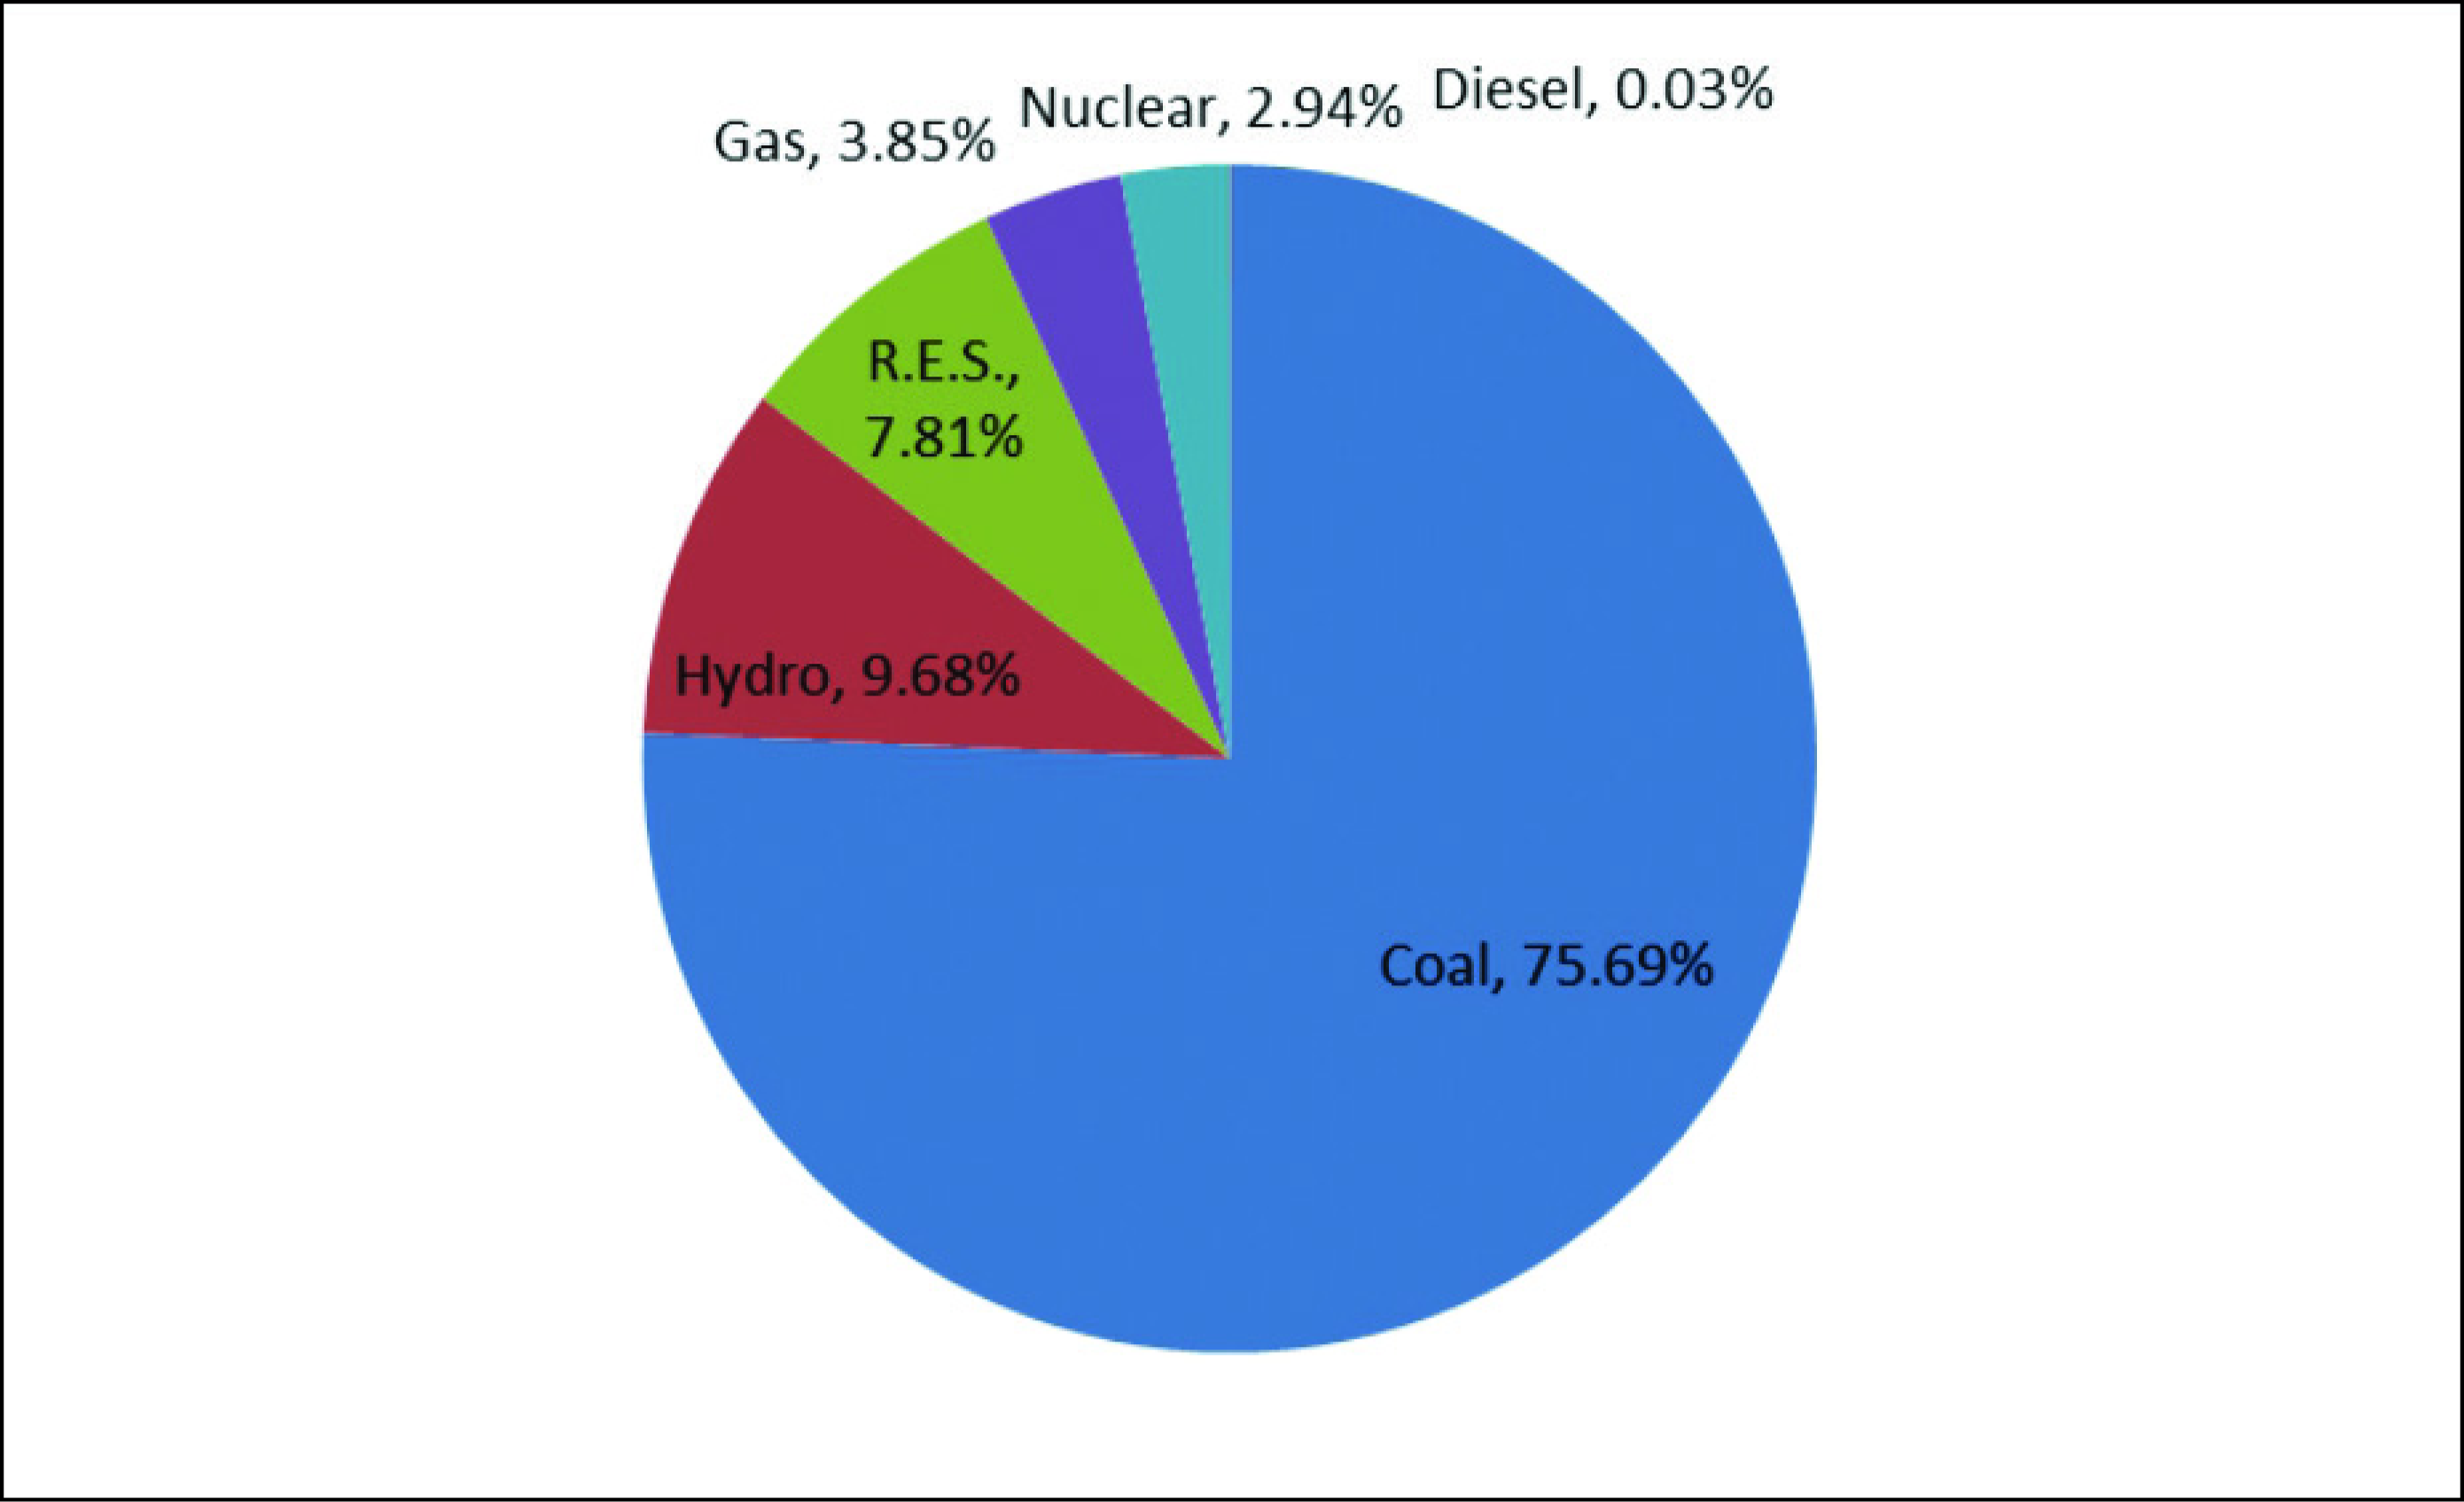
In the year 2017–2018, data indicate that a total of 1,303,455 GWh was generated by using resources such as coal, nuclear energy, hydropower, diesel, natural gas and renewable energy sources. Electricity generated from renewable sources, such as wind, biomass, solar and small hydropower plants, is gaining momentum. In 2017–2018, these forms of electricity sources were estimated to have approximately generated 101,839 GWh of electricity.
Coal power plants produced the bulk of the electricity in 2017–2018 (986,591 GWh), which formed almost 75.69% of the total production. This was followed by hydropower, which accounted for 126,123 GWh, excluding small hydropower plants. Other sources which contributed to generation of electricity included natural gas (50,208 GWh), nuclear (38,346 GWh) and diesel (348 GWh). Contribution of unconventional or renewable sources was approximately estimated to be 101,839 GWh in 2017–2018. At present, the majority of the renewable electricity was harnessed from wind energy and hydropower plants.
Electricity Demand in India
The electricity consumption was 1,123,427 GWh in India in the year 2017–2018. Out of all the sectors, consumption of electricity is maximum in the industrial sector (Figure 2), and in 2017–2018, it was estimated to consume almost 41.71%, that is, 468,613 GWh.
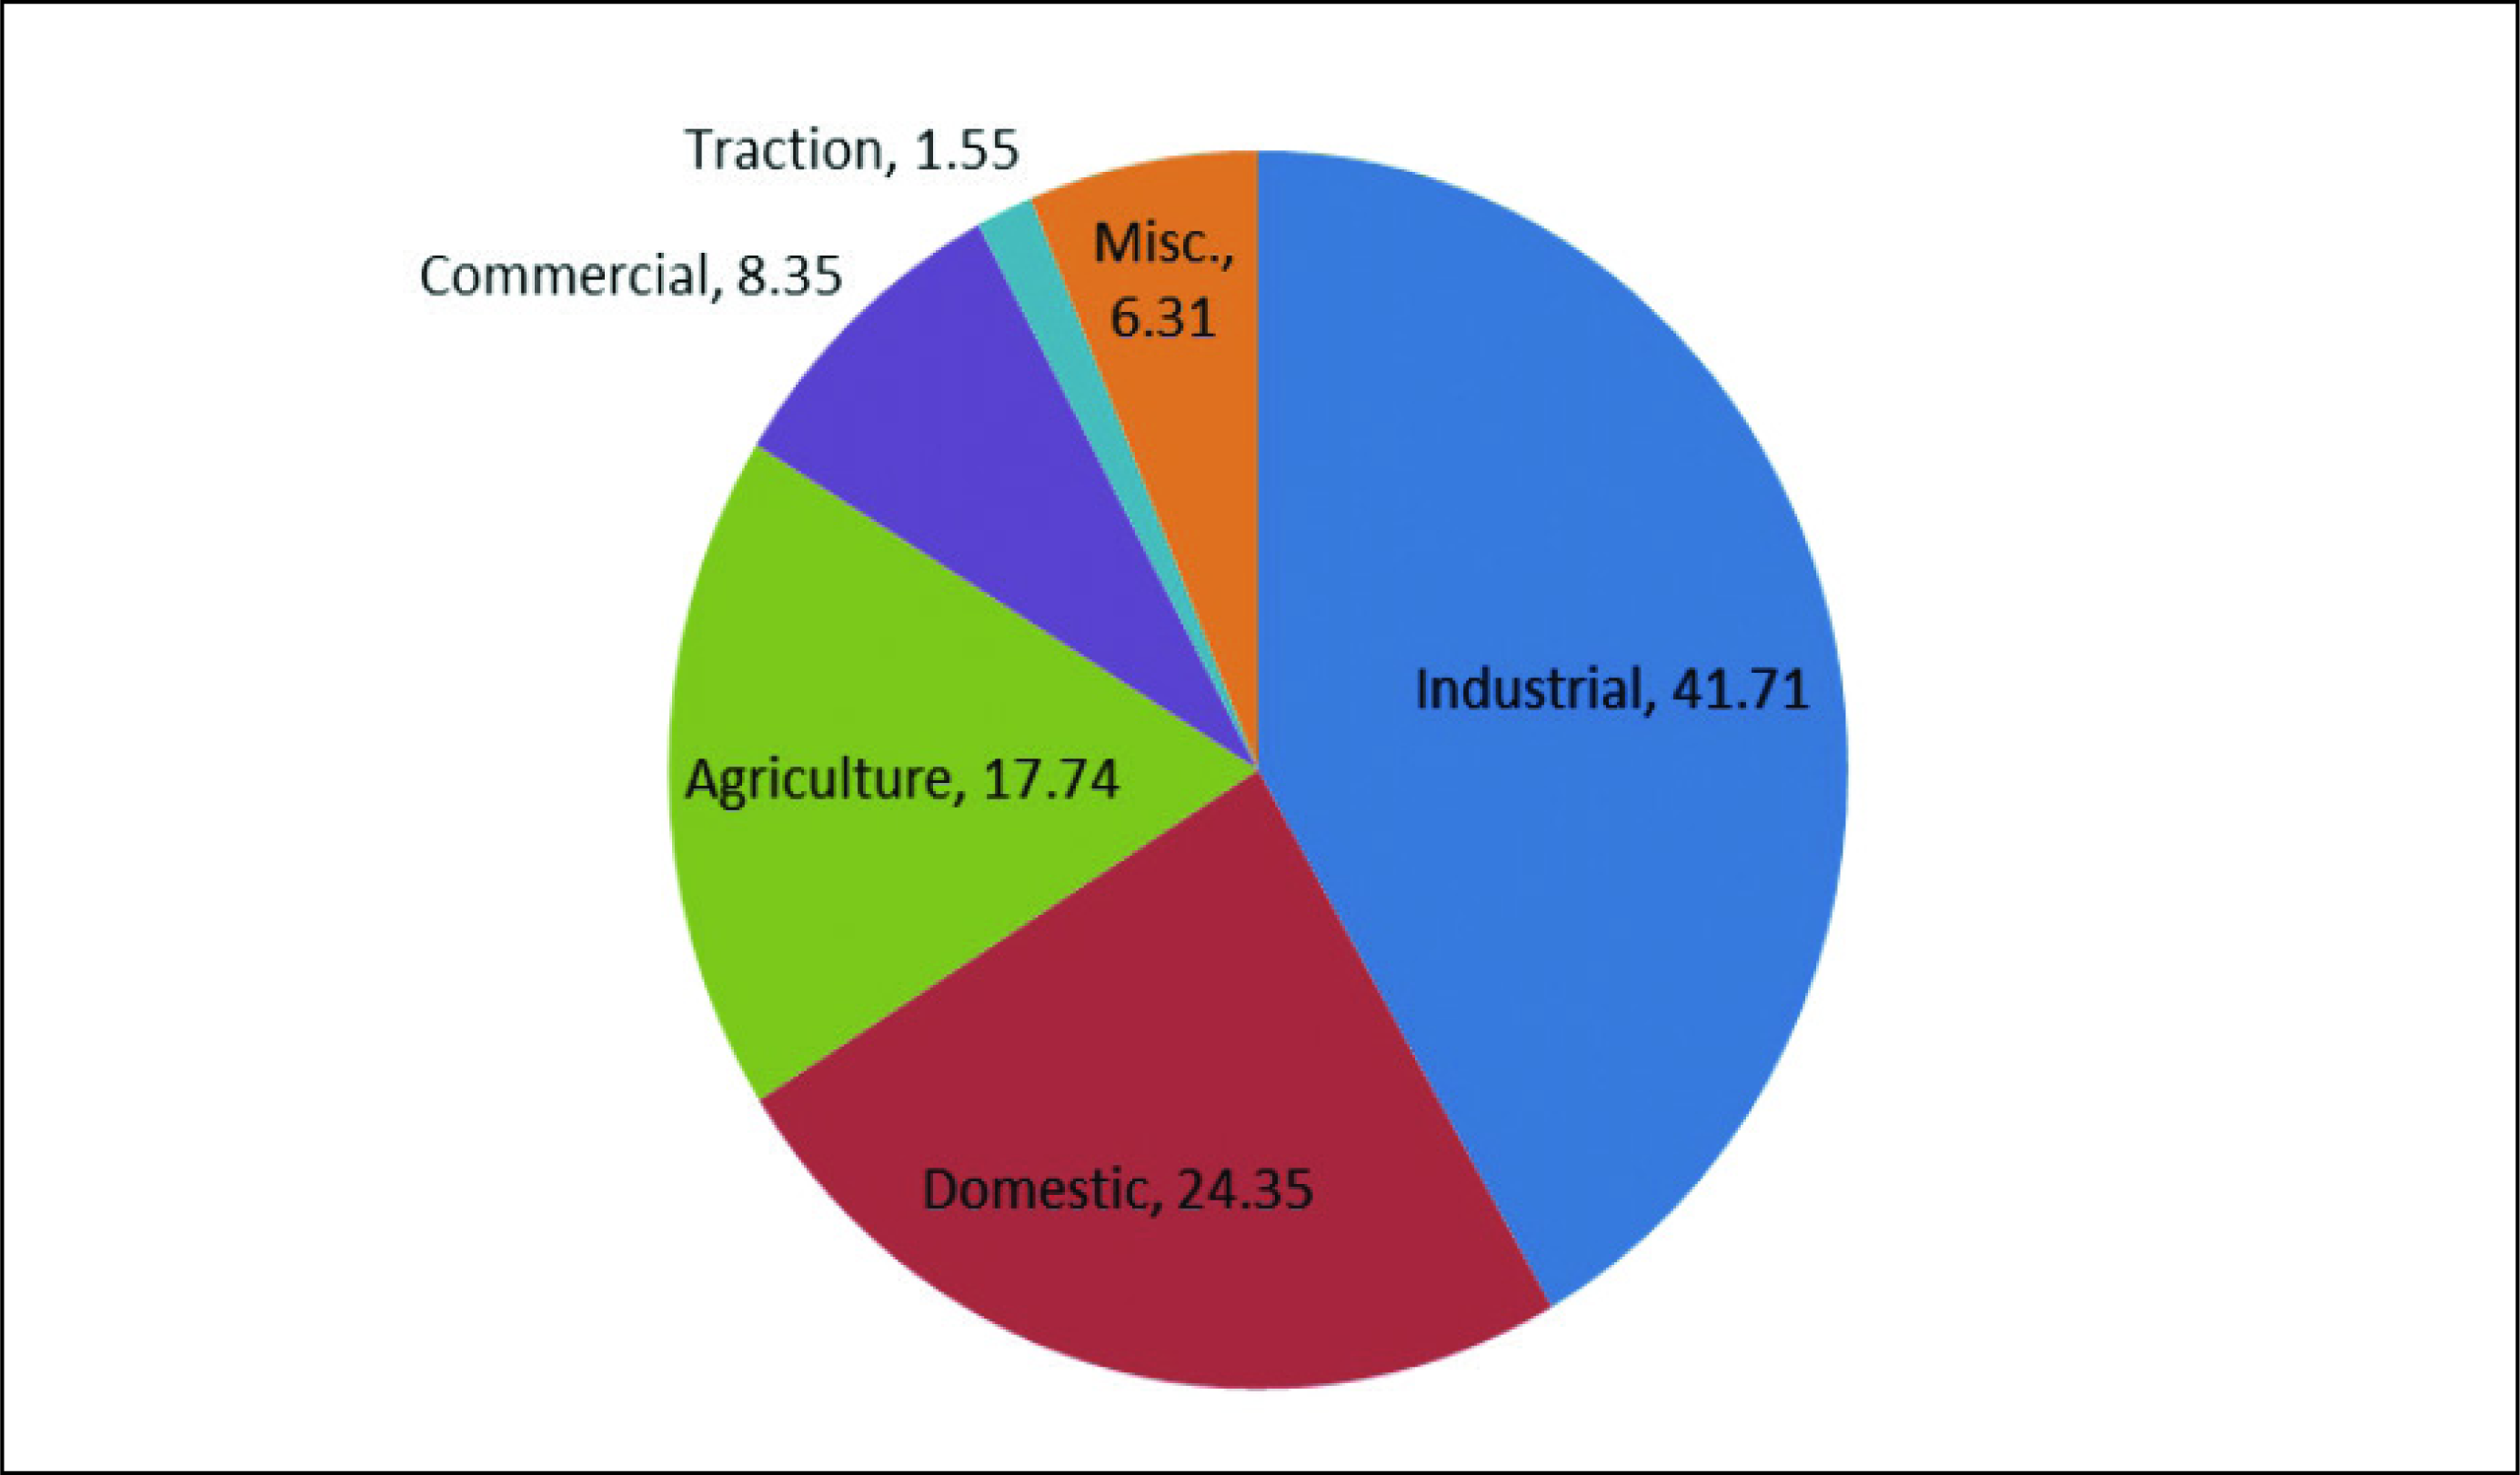
The major manufacturing sector—the micro, small and medium enterprises—popularly called MSMEs acts as the pillar of the Indian economy, accounting for almost 8.7% of the GDP. The domestic sector approximately consumed 213 TWh, which was 24.35%, in 2017–2018. The demand for electricity in this sector, which is the second highest consumer at present, is a direct consequence of the high population of the country. In 2011, the domestic sector was estimated at 240 million households and, out of these, 67% were in the rural areas. There has been an increase in the number of households in urban areas as compared to the rural areas, which can be attributed to higher rural to urban migration of the people and urbanization. In 2011, 55% of the households in rural areas were electrified in contrast to 93% of the households in the urban areas.
The agricultural sector is the third highest consumer of electricity and has consumed 167 TWh during 2017–2018, which formed around 17.74% of the total consumption (see Figure 2). In the same year, the commercial sector approximately consumed 86 TWh of electricity and was the fourth highest consumer with 9%, but this sector experienced an increased growth rate (8.82%) as compared to the agricultural sector (6.59%) and domestic sector (7.89%). The railway sector consumed 15.5 TWh, including both passenger and goods trains. Finally, the unorganized sector was responsible for the consumption of remaining electricity, and it was estimated at 46 TWh in 2015, with a growth rate of 4.75% annually.
Trend of Consumption of Electricity and Economic Growth in India
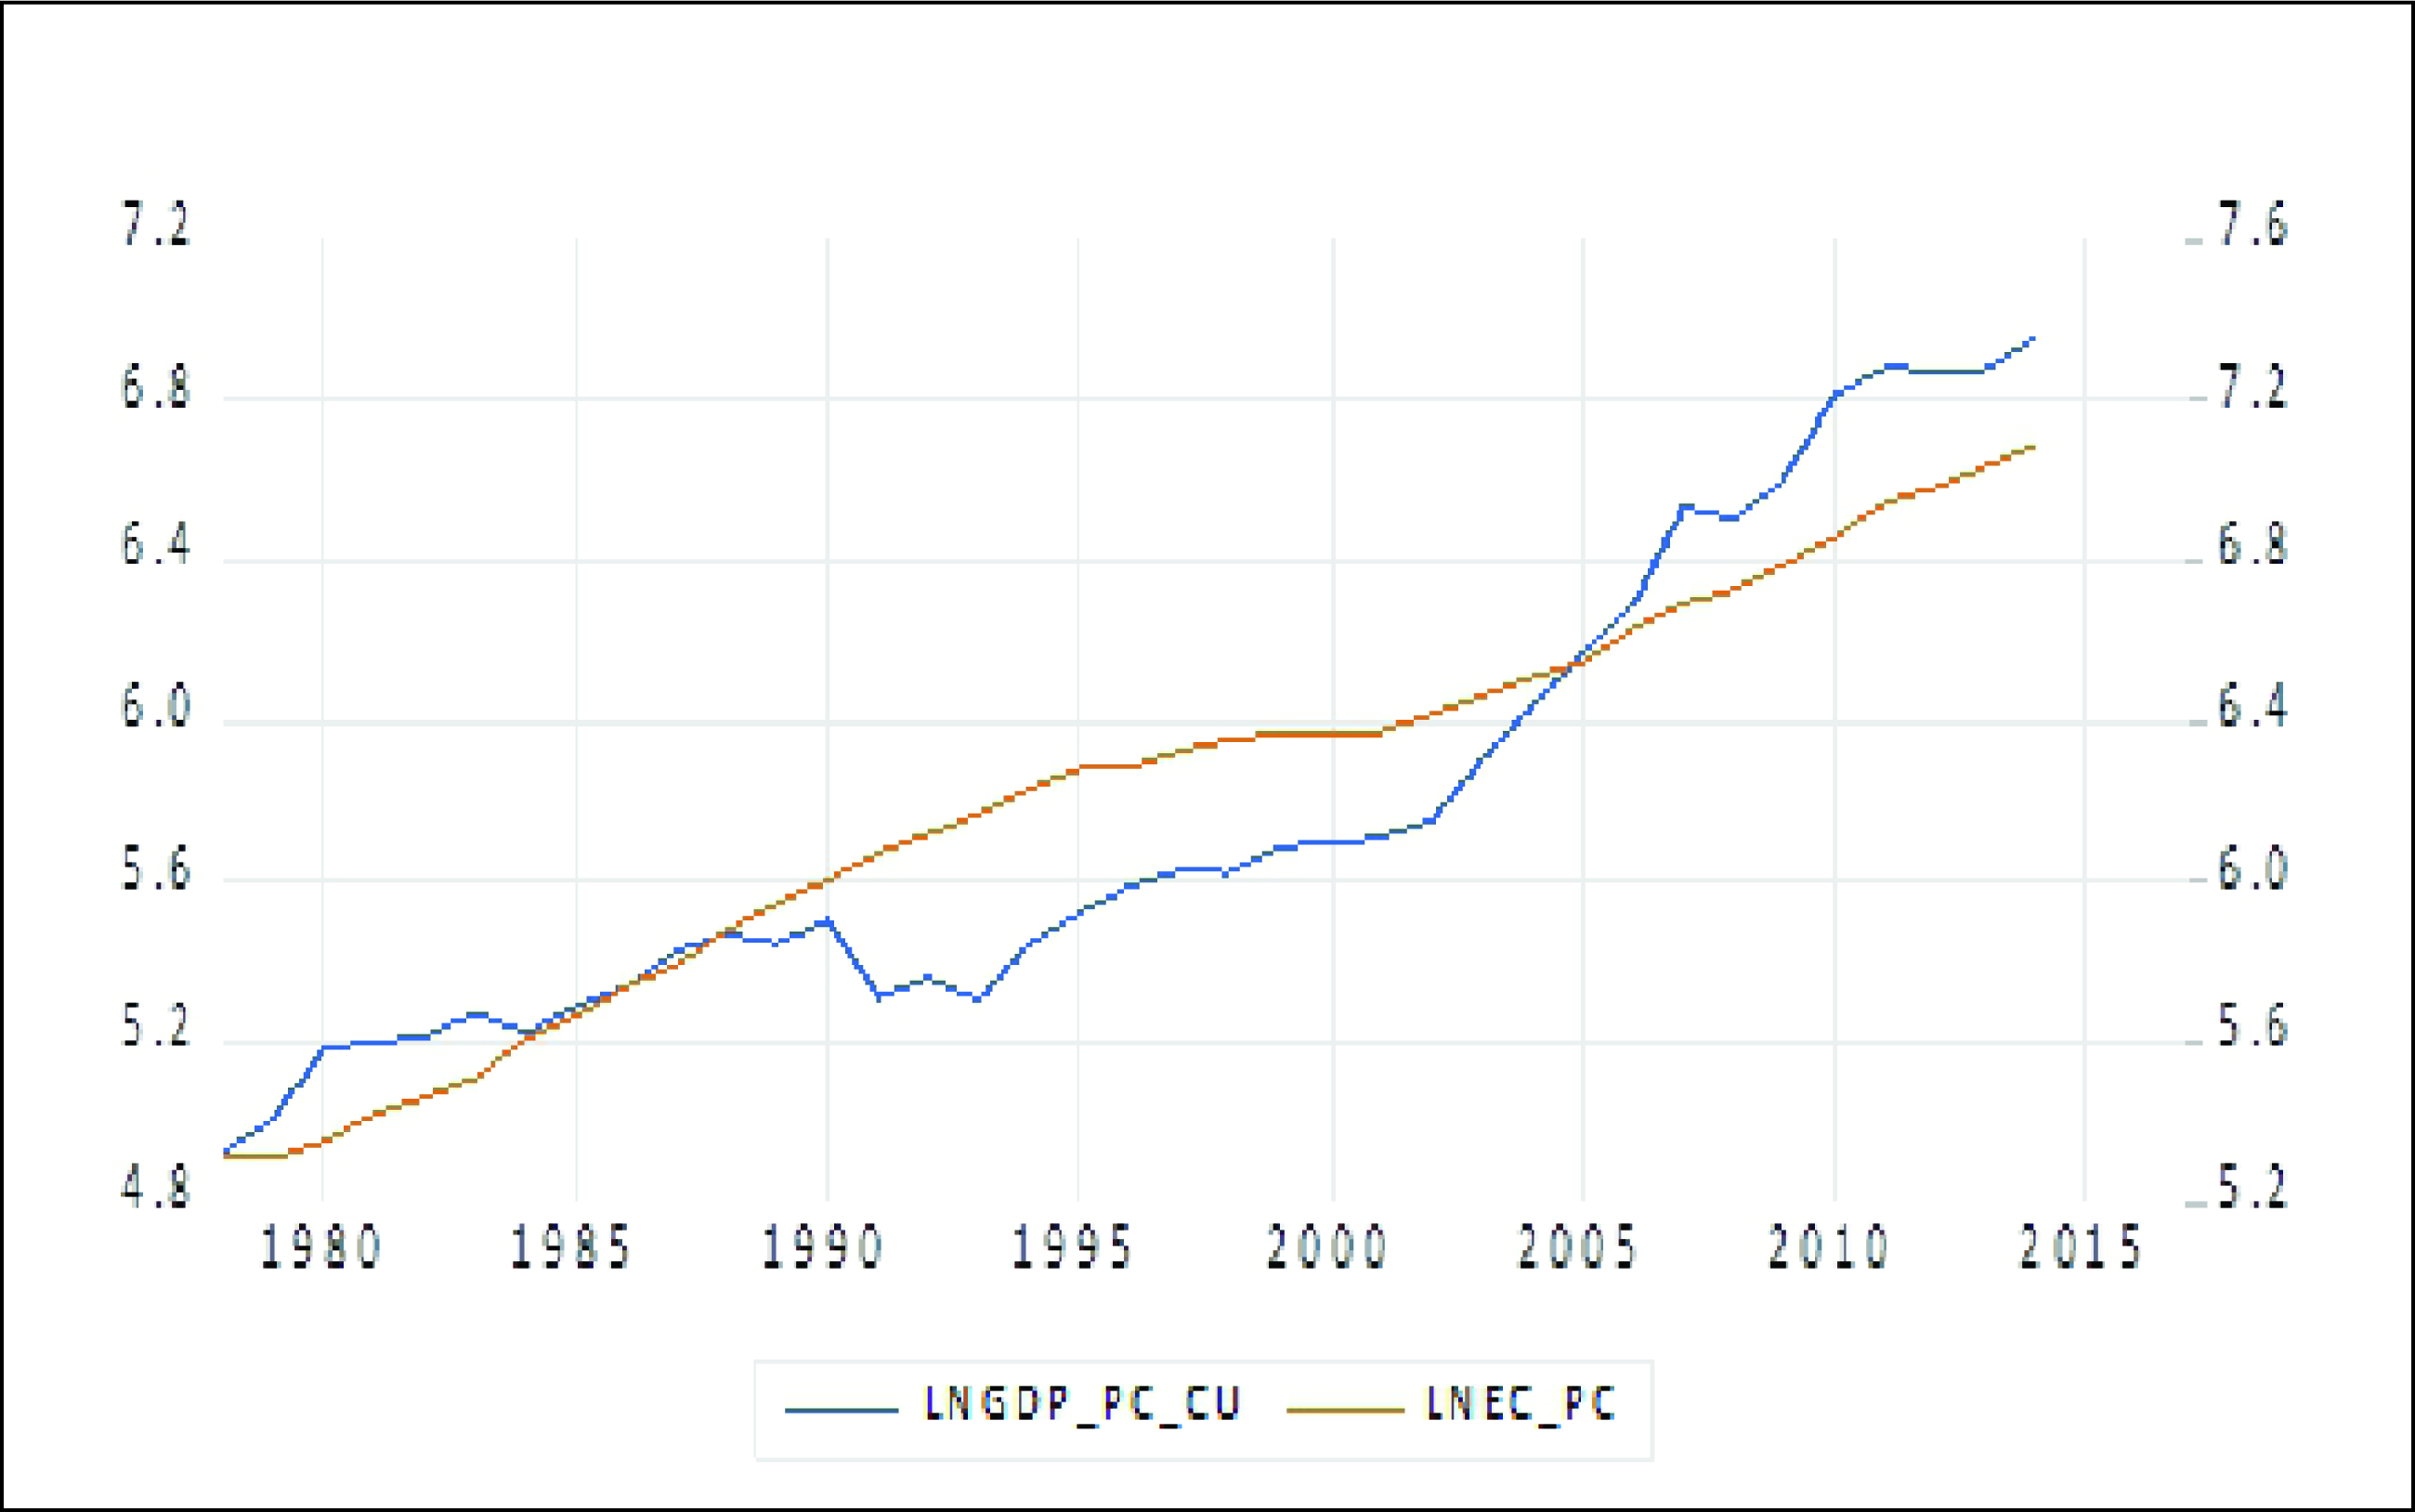
India is one of the fastest growing economies in the world. With this rapid growth, the consumption of energy, specifically electricity, is increasing day by day. In fact, the trend of utilization of electricity is a major indicator of the growth trend of an economy, and India is no exception. Figure 3 shows the pattern of per capita growth of electricity utilization and per capita growth of GDP in India between 1970 and 2014. The original data have been transformed into logarithmic term to eliminate any possible presence of heteroscedasticity. As the trend suggests, there are certain phases in the case of these two variables. In the earlier phase, roughly from 1970 to 1983, the economic growth rate outweighs the growth rate of electricity consumption. This may be the period when a major part of India lacked electrification though economic growth was increasing due to efficient performance of India’s five-year planning. After that, electricity consumption increased steadily and, as a result, economic growth fell short for a considerable period of time (say, 1987–2005). The gap between these two reduced continuously after 1993 due to India’s liquified petroleum gas (LPG) policies. In the third phase, that is, during the period from 2005 to 2014, there was a positive gap between economic growth and per capita electricity usage. So, it can be concluded that for achieving sustainable economic growth, India must increase its per capita electricity consumption. Moreover, it can be seen from the available data sources that there is a positive association between per capita electricity usage and economic growth of India.
Material and Methods
Model
To address the research question, that is, the relation between electricity utilization and growth, the article has adopted the following model:

where InGDP t is the per capita output, InHC t represents human capital, InCAPITAL t is the per capita physical capital, represents electricity consumption, InFD t represents financial development and InOPENNESS t is the openness of the economy. The coefficients θ t and ( i = 1, …, 5) correspond to the responsiveness of output per capita with respect to human capital, physical capital, electricity consumption, financial development and trade openness, respectively.
Data and Variable Descriptions
In Equation 1, output per capita is the main dependent variable of the study, and GDP per capita is used as a proxy for the output per capita. The data for output per capita have been obtained from the World Bank Development Indicator. Electricity consumption is the key explanatory variable of the study, and like GDP per capita, data on electricity consumption have been obtained from the World Bank Development Indicator. The World Bank measured electric consumption as the total production of power plant after deducting the losses during transmission, distribution and transformation, as well as the uses by heat and power plant. The study employed human capital index as a proxy variable for the human capital, and data for human capital index are obtained from World Penn Table (2017). Openness of the economy is estimated by the ratio of export to GDP (Ohlan, 2018). Openness is considered as one of the significant explanatory variables of the output per capita in the existing literature and data on this variable have been taken from the World Bank Development Indicator. Data on financial development have also been taken from the World Bank Development Indicator. The descriptive statistics of the variables are presented in Table 1.
Descriptive Statistics

Methods
Unit Root Test
For identifying the order of integration in the time series, we used augmented Dickey–Fuller (ADF) and Phillips–Perron (PP) unit root tests. By applying these tests, the stationarity or non-stationarity of the data series is evident. They are found to be most frequently used in the literature. We have performed these tests for all the variables in their level and first differences. For ADF test, Schwartz information criterion (automatic) with a maximum of nine lags was considered, while Newey–West bandwidth (automatic) using Bartlett kernel spectral estimation method was used for PP test.
Autoregressive Distributive Lag Model
The study employed ARDL methodology propounded by Pesaran and Shin in 1998 to measure the cointegrating equation. The long-term association can be identified between the chosen variables by adopting the ARDL model (Frait & Komárek, 2002). The benefit that this particular model has over other models is that it could be employed irrespective of the variables being I(1) or I(0), or their combination. Moreover, while the Johansen cointegration techniques need a bigger sample for the results to be considered acceptable, the ARDL model is better suited for looking into the associations in smaller samples (Ghatak & Siddiki, 2001).
Cointegration Analysis (Autoregressive Distributive Lag Model)
A bound test is initially conducted for determining the presence of a long-run association among the variables under consideration. This test is constructed on the computed F-statistic and is related to the critical value calculated by Pesaran et al. (2001). In case the tabulated F-statistic exceeds the upper bound critical value, then the null hypothesis of no cointegration is overruled, but in case the estimated F-statistic is lesser than the lower critical value, then null hypothesis stands. The result is indecisive in case the estimated value of F-statistic falls within the lower and upper critical values. As for the present study, a small sample size comprising 36 observations was used; therefore, the critical values of Narayan (2005) to explore the long-term association among the variables were adopted.
To explore the long-run association between consumption of electricity and growth of an economy with ARDL approach, the study rearranges Equation (1) in following form:
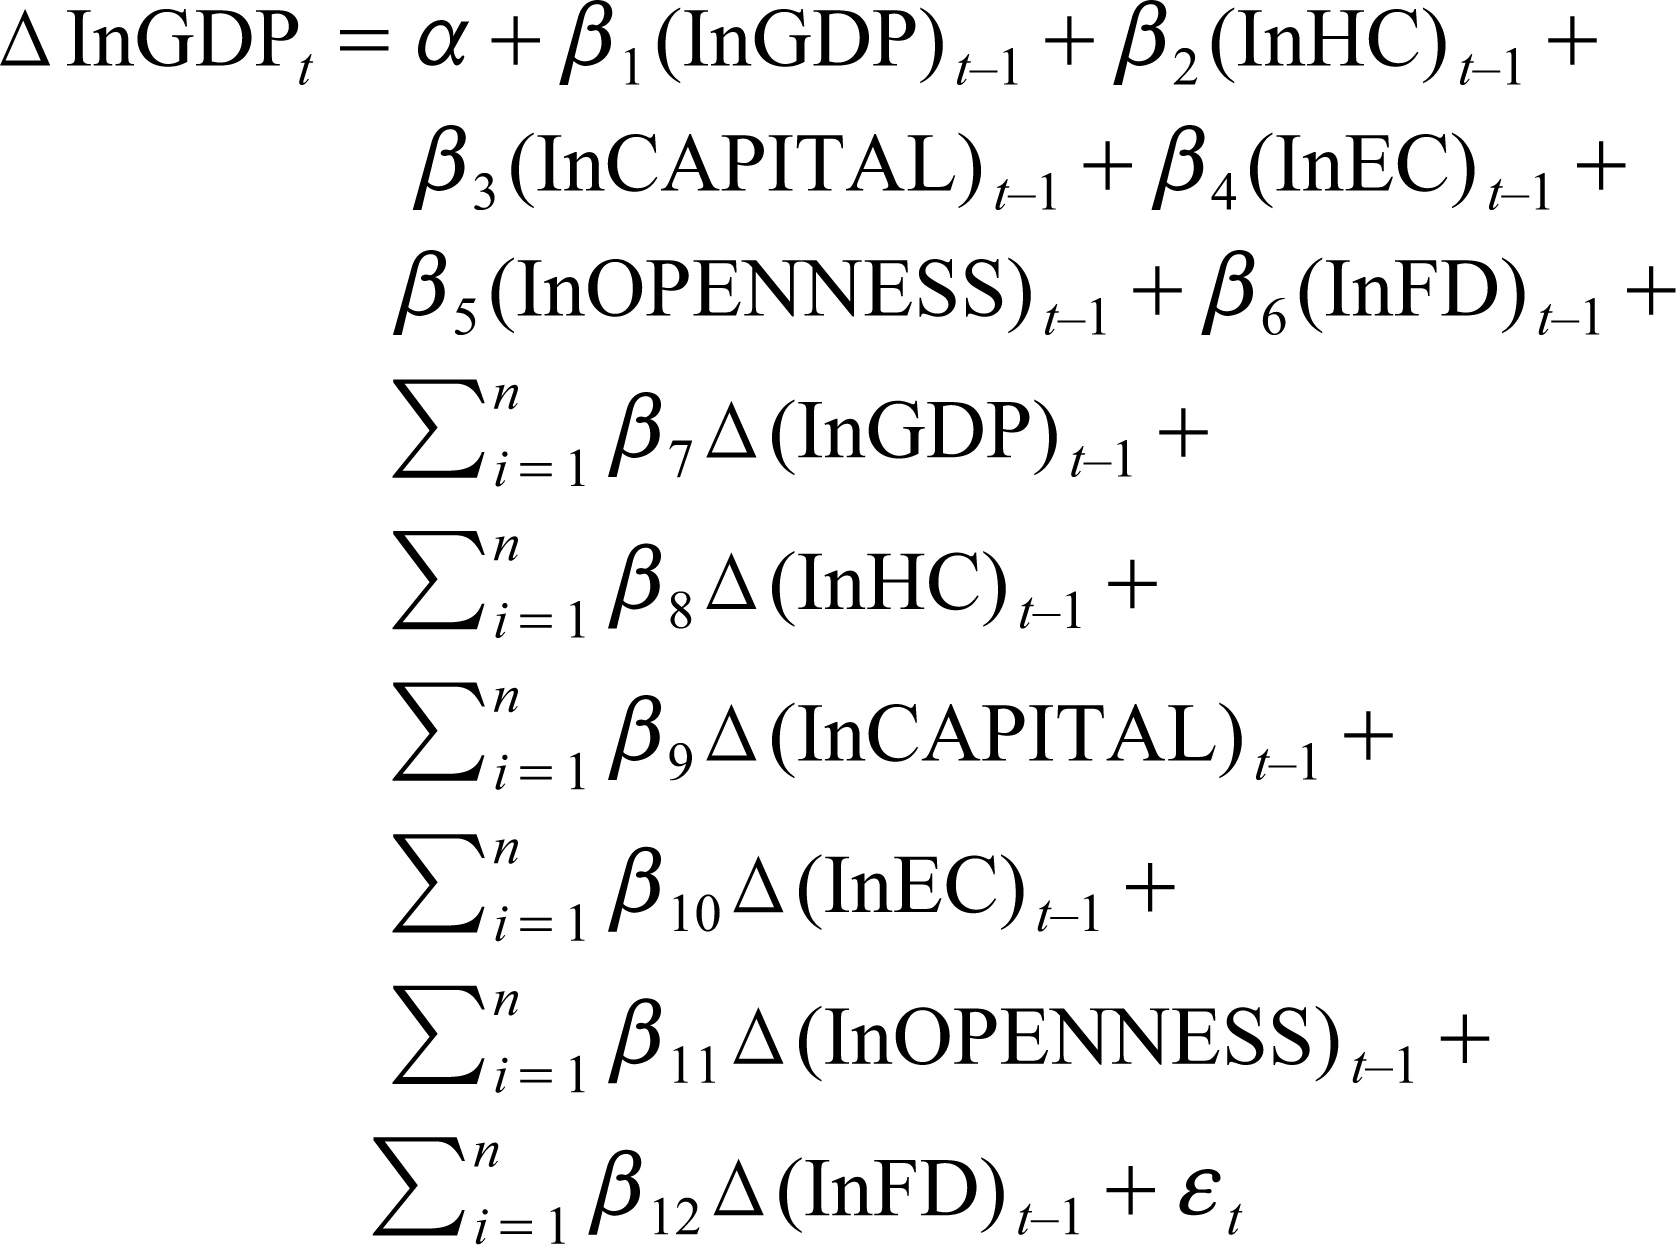
In the given equation, the first difference operator (Δ) denotes the dynamics in the short run. Likewise, βs show long- and short-run coefficients. The null hypothesis of no long-run association among the chosen variables (H0: β1 = β2 = β3 = β4 = β5 = 0) has been rejected in lieu of the alternative hypothesis of the presence of a long-run association
To probe into the dynamics of the short-run association, the present article used the short-run error correction model. It is stated in the given equation as follows:

Toda–Yamamoto Granger Causality Test
The study has conducted modified Wald test suggested by Toda and Yamamoto (1995) for examining the causality between electricity consumption and economic growth. This approach fits a standard VAR model in the levels of the variables, and by doing this, the Toda and Yamamoto (1995) approach reduces the risk linked with the likelihood of wrongly identifying the order of integration of the variables (Mavrotas & Kelly, 2001). This approach artificially augments the correct VAR order k by the maximal order of integration, for instance, dmax. Following this, a VAR of order k+dmax is estimated ignoring the coefficient of the last lagged dmax vector (Rambaldi, 1997; Rambaldi & Doran, 1996). To estimate Toda and Yamamoto Granger causality test, we can express electricity–GDP model in the given form:
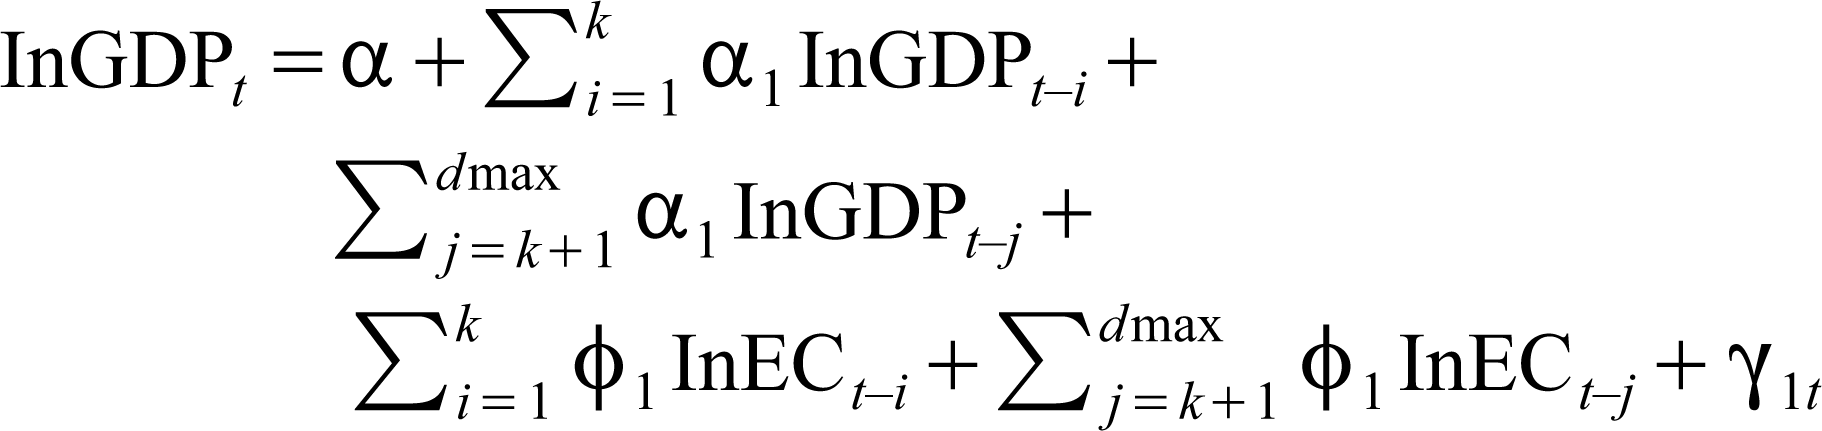
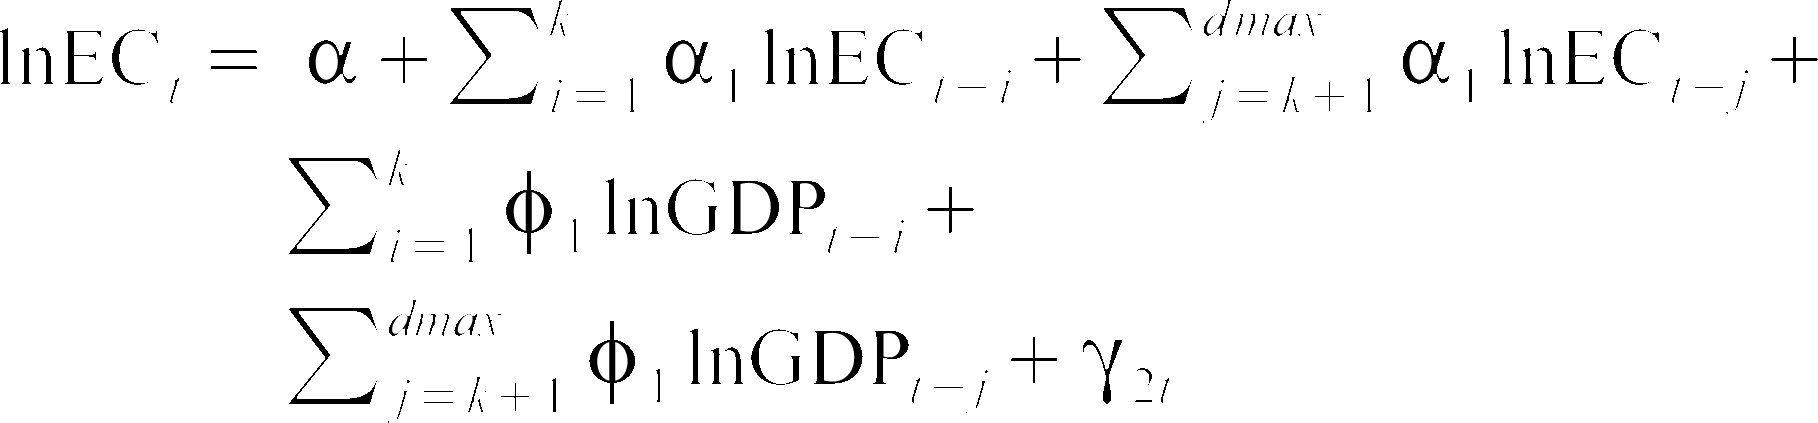
where Equation (4) implies Granger causality from InEC t to InGDP t ; similarly, Equation (5) implies Granger causality from InGDP t to. InEC t
Results and Analysis
This section discusses the evaluation of empirical results based on the method adopted previously.
Stationary Test
Table 2 displays the stationary test results at levels as well as first difference. As mentioned, the study has applied ADF test and PP test to see whether the variables were stationary or not. The result suggests that variables are non-stationary at level, and they became stationary at the first difference at the 1% significance level. In the case of ADF, financial development is found to be stationary at the 10% significance level in first difference, whereas it is stationary at the 1% significance level at the first difference as far as PP test is concerned. Thus, we have incorporated the first difference of the variables in our model to deduce any causal relationship between usage of electricity and economic growth of India. Analysis has been carried out with the first differenced series.
Results of the Stationary Tests
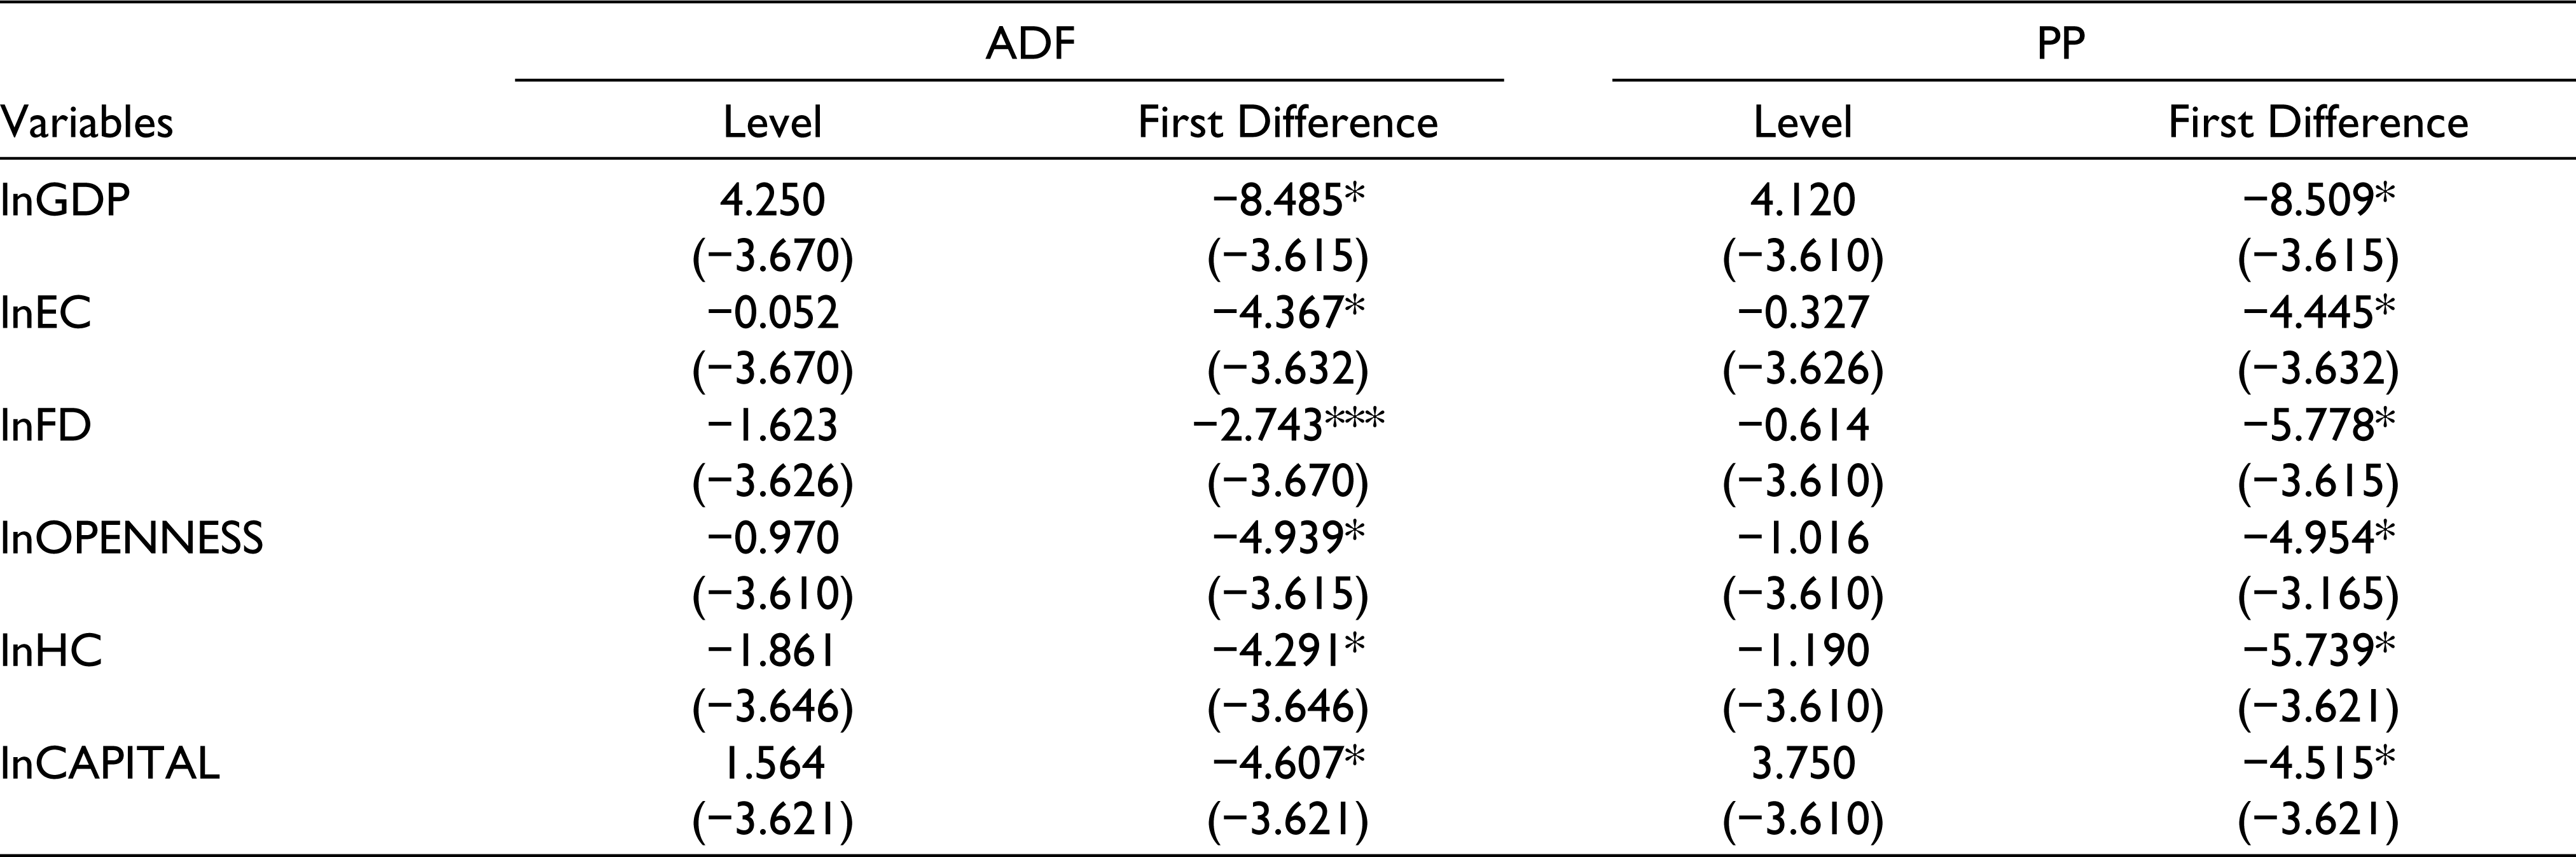
*** Represent statistical significance at 1% and 10% levels, respectively. Critical values shown in parenthesis represent significance at 1% level.
Bound Test
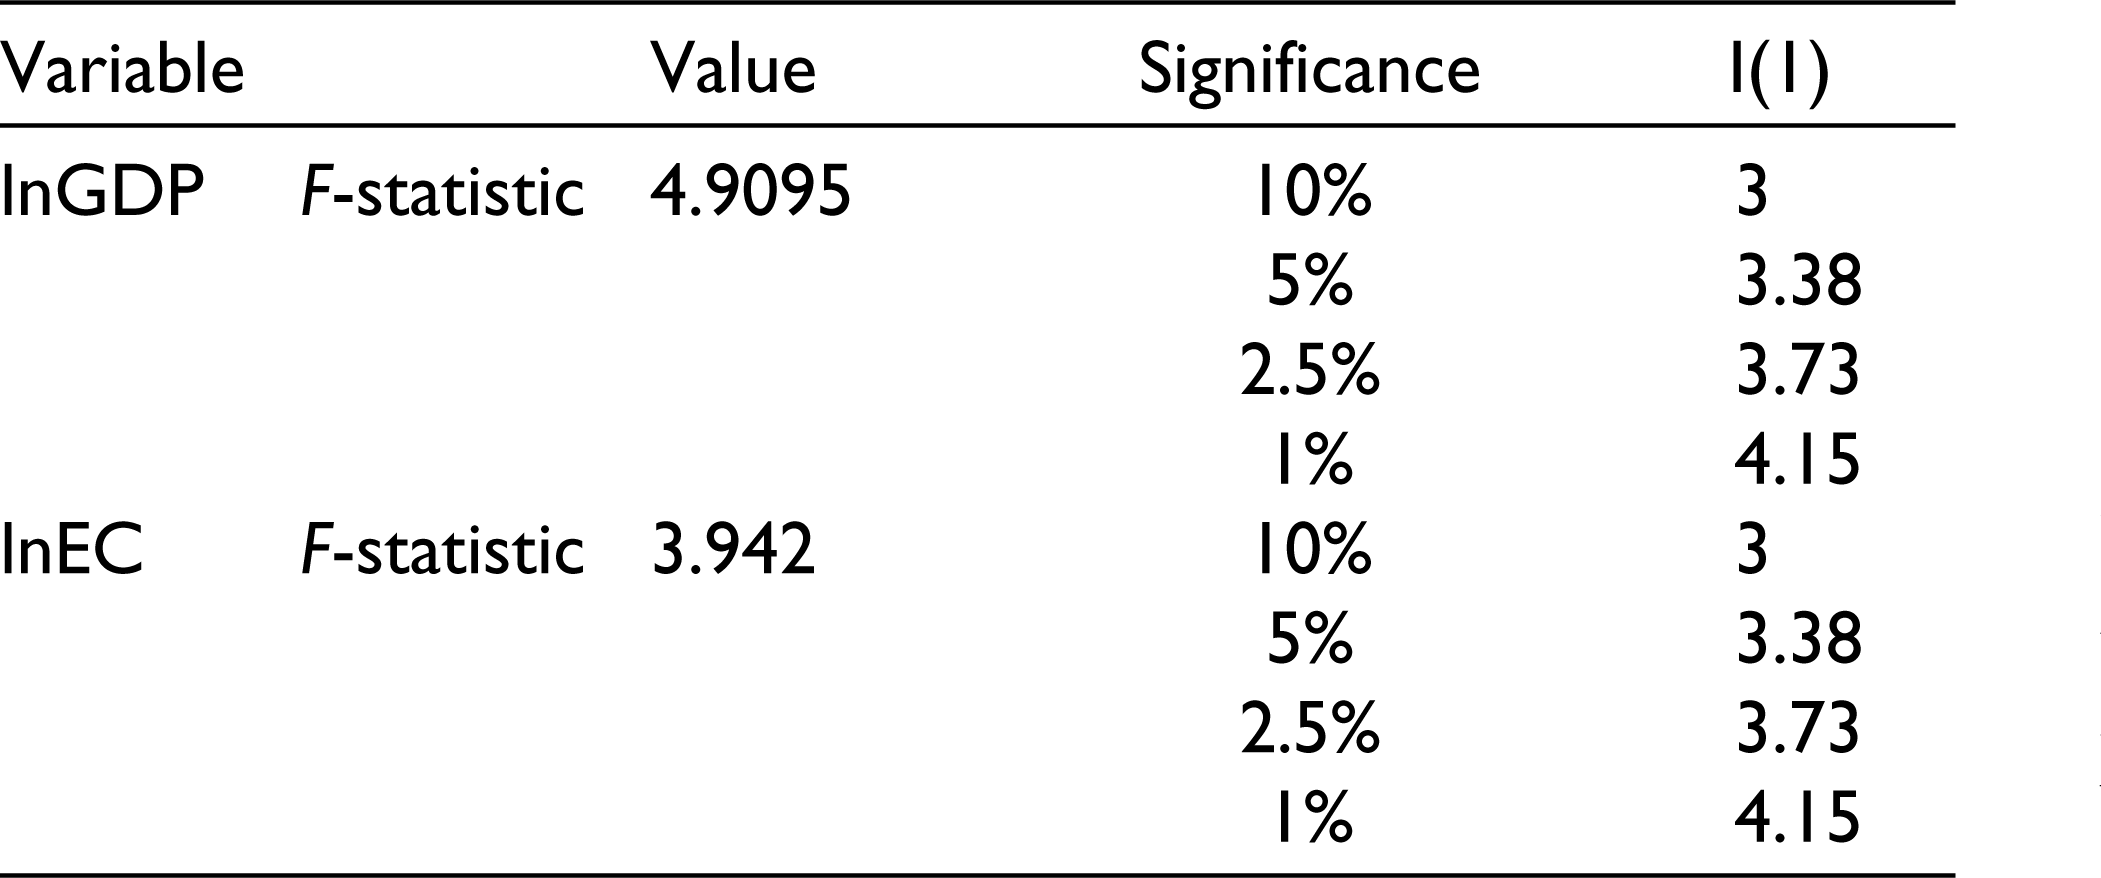
Table 3 presents the outcomes of bound test (under no trend) to show whether there exists any long-run relation among the given variables. It has been observed from the result that the value of F-statistic (4.9095) is more than the critical limits at the 1% significance level when GDP is used as a dependent variable. Hence, we can conclude that there exists a cointegrating relationship among the dependent variable and regressors. This implies that there exists a long-run relationship amid the selected variables. The value of F-statistic (3.942) is not greater than the critical limits at a significance level of 1% when electricity consumption was taken as a dependent variable. Hence, it can be concluded that cointegrating relationship cannot be established when electricity consumption has been taken as a dependent variable.
Results of the Bound Test
Long-run Results
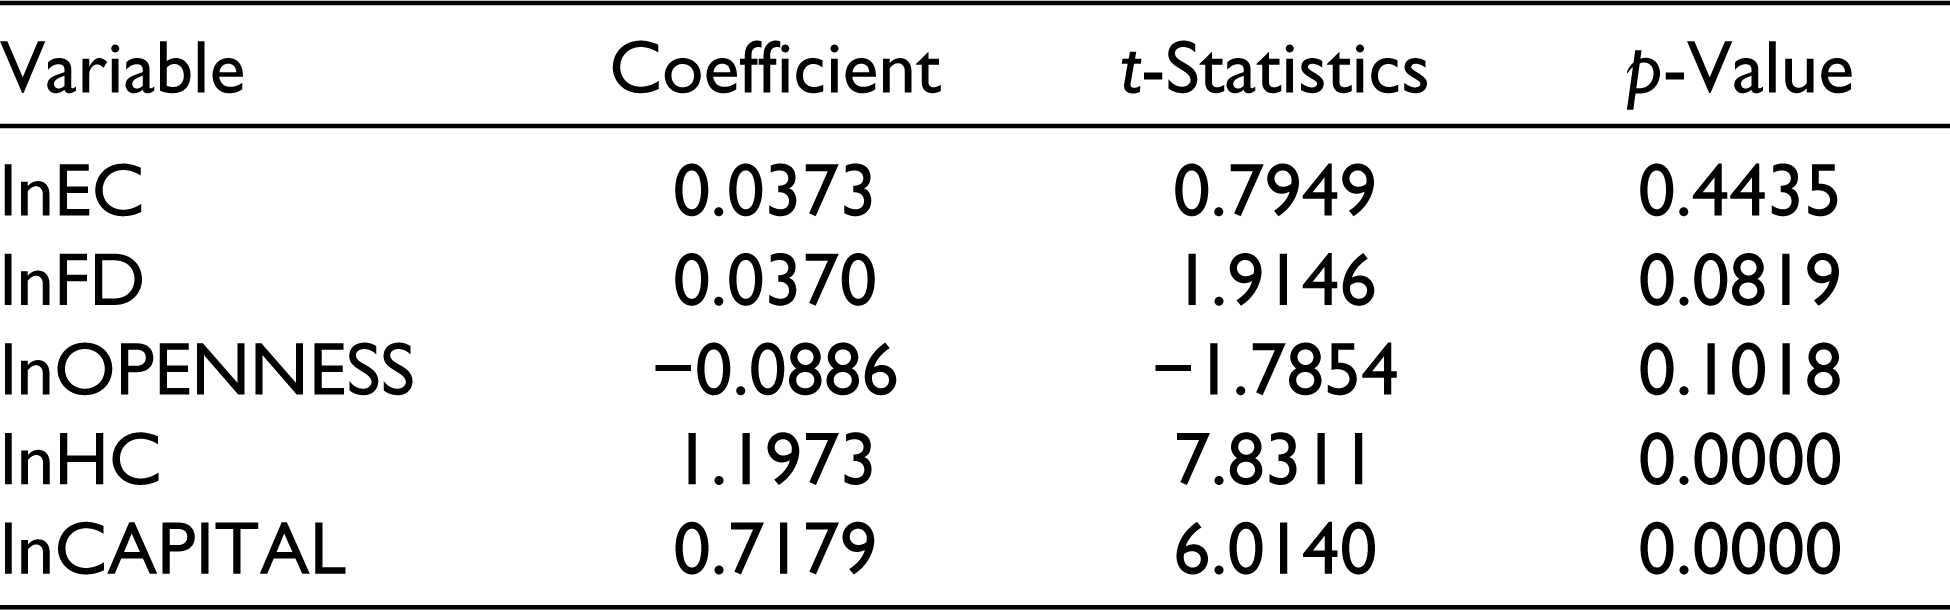
Table 4 shows the results of long run. It has been observed that in the long run, electricity consumption does not have any impact on the economic growth of India. The coefficient of electricity consumption is not statistically significant. The outcomes of this study differ from empirical results of Ohlan (2018). However, the outcomes of the study appear to be consistent with the results of Kumari and Sharma (2016). Their empirical results indicated that electricity consumption does not affect economic growth. Therefore, the economy could adopt policies focusing on energy conservation without any negative effect on the economic growth. While energy still continues to remain important, energy-efficient technical growth in the manufacturing sector has allowed lesser energy to be consumed per unit output, which has constrained the pressure that energy resources exert on the growth and output of an economy (Stern, 2011). This entails crucial consequences as India tries to improve energy security and, at the same time, lessen greenhouse emissions. The results of the study essentially point out that the conservation of energy and carbon pricing strategies may not have any unfavourable impact on the economic growth of India.
Similarly, in the case of openness also, the study found a similar kind of result. The significance of trade openness has been increasing since the advent of globalization, but the economic growth led by trade may vary due to the comparative advantage that orients the economy’s resources in a way that it either promotes growth or does not promote growth. Certain lesser developed nations due to financial and technological limitations may not have adequate technical or social capacity that is needed to adopt advanced technology. Thus, irrespective of the positive impact on growth, there might not be any significant impact that trade openness has on economic growth. The coefficient of human capital is also negative and statistically significant at 5%, which supports some other findings as well (Matthew et al., 2018). According to Rogers (2008), certain specific characteristics of a nation, such as black market premium, brain drain and corruption render human capital unproductive. This is due to the fact that resources are diverted towards wasteful activities due to corruption, and human resource is diverted towards activities like rent-seeking. The coefficient of capital is positive and statistically significant at 1% (following Yuan et al., 2008). A 1% increase in capital has increased the economic growth of India by 3.2%. Similarly, financial development also has a positive effect on economic growth of India (see Table 4).
Long-run Results
Error Correction Model
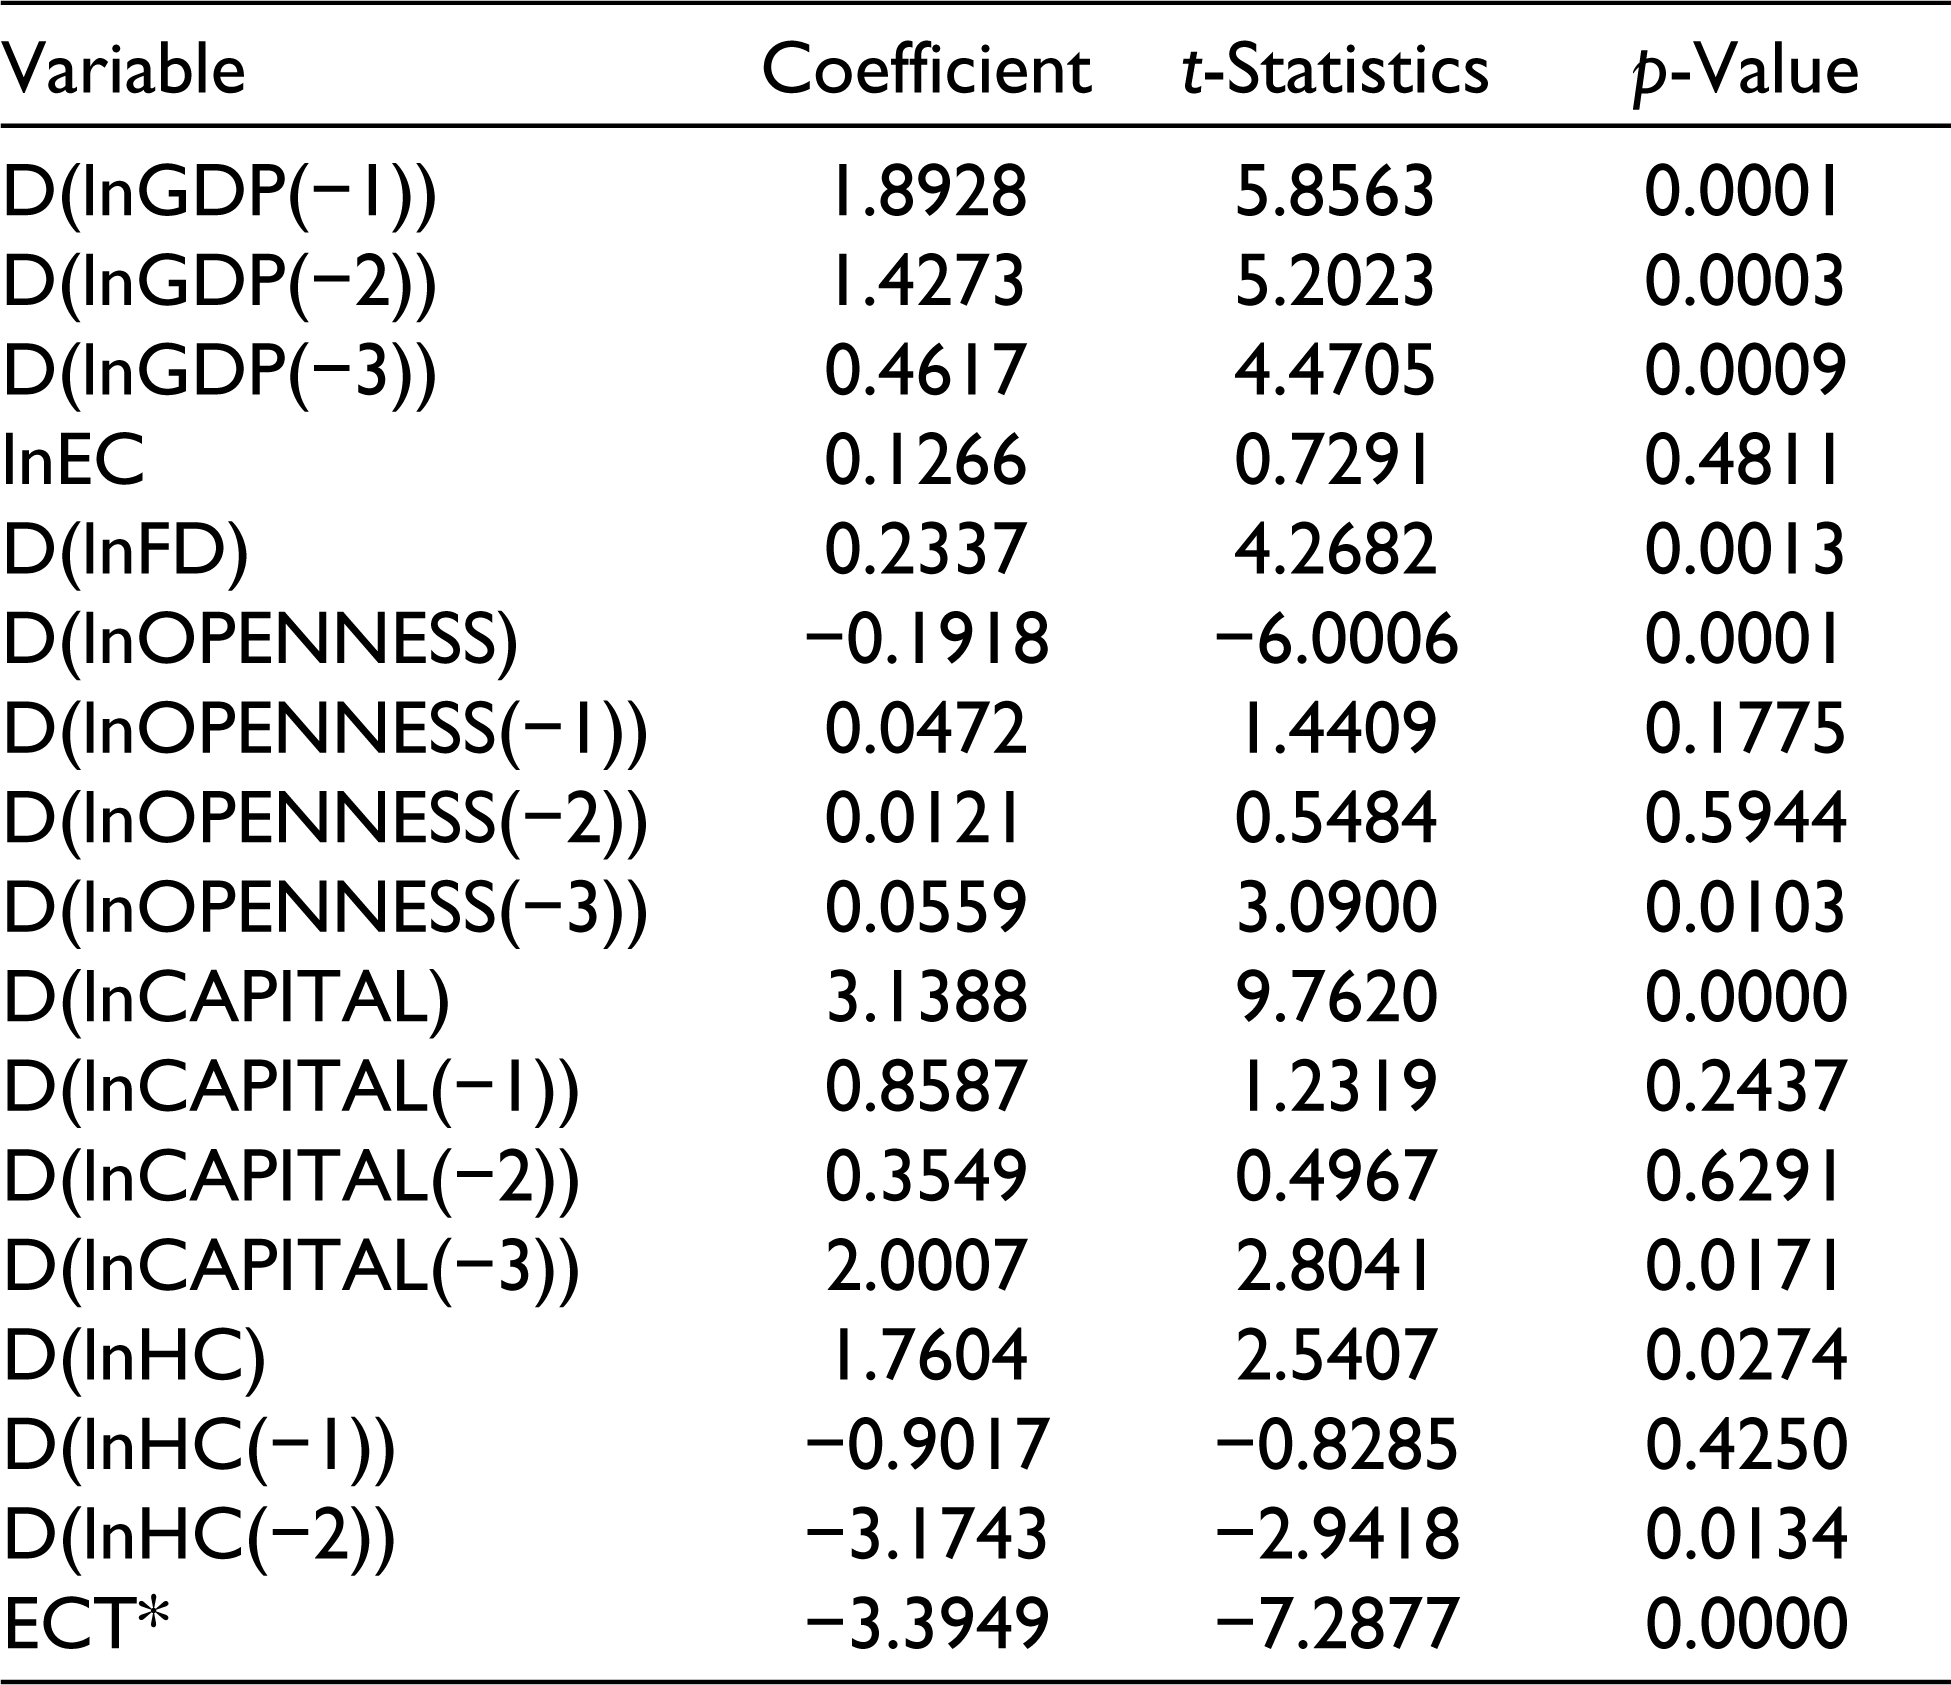
The outcomes of the short-run error correction ARDL model are stated in Table 5. It can be seen from the results that the coefficients of GDP in lag-one (t–1) period is negative and statistically significant at a significance level of 1%, whereas the coefficients of openness, human capital and physical capital are positive and statistically significant at 5% and 1% levels of significance, respectively. Like GDP in lag-1 period, the coefficient of financial development is also negative and significant at the 1% level. In addition to this, it is clear from Table 5 that the error correction term has correct negative sign (−3.39) and statistically significant at the 1% level.
Results of the ECM
Results of the Diagnostic Tests

Diagnostic Tests
The study used Akaike information criteria (AIC) for the selection of an optimal model. AIC graph has shown top 20 models (see Figure 4). Accordingly, as suggested by AIC graph, the study has chosen 2, 0, 1, 4, 0, 4 model. In addition to this, to assess the reliability of the ARDL model, the study has applied the diagnostic and the stability tests. The study used (a) the Lagrange multiplier test of residual serial correlation, (b) Jarque–Bera (Jarque & Bera, 1980, 1987) normality test and (c) a heteroscedasticity test based on the regression of squared residuals on squared fitted values to examine the dependability of the estimated model (for details of these tests, see Pesaran & Shin, 1998). The outcomes of the applied diagnostic tests are presented in Table 6. As the study cannot reject the null hypothesis of residuals that are normally distributed, and no heteroscedasticity and no serial correlation at even 10% level of significance also, the article concludes that the model adopted in the study is devoid of serial correlations, heteroscedasticity and non-normality. Finally, to see the stability of the model, the study used cumulative sum (CUSUM) of the recursive residuals and cumulative sum of squares (CUSUMSQ) of recursive residual tests.
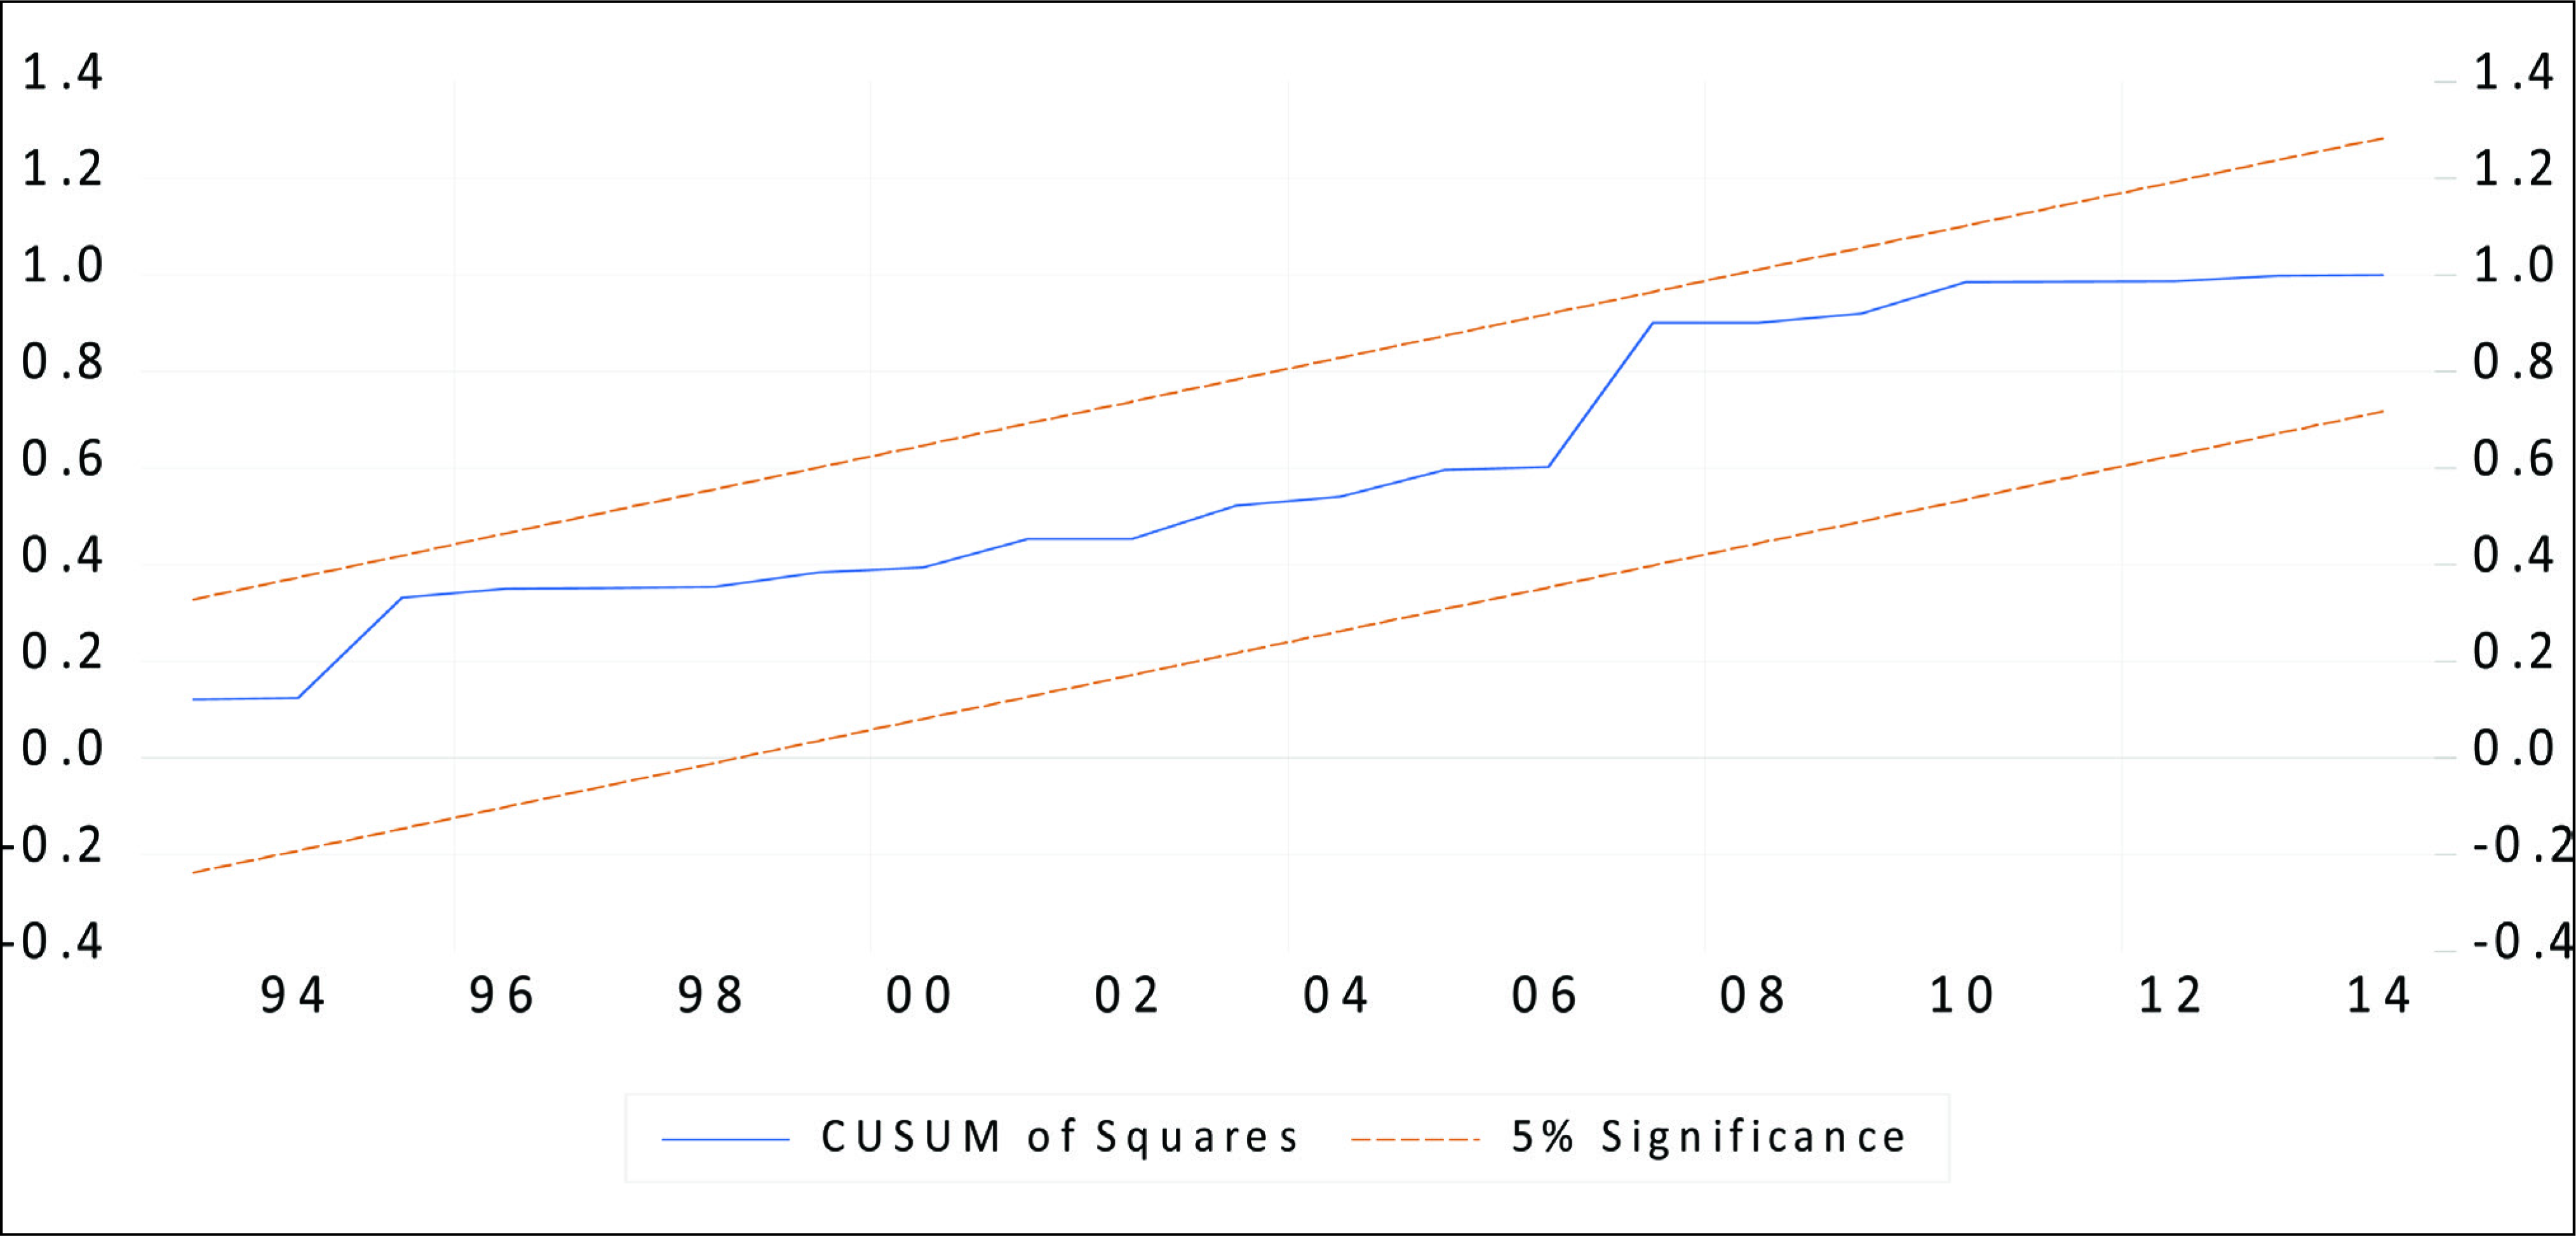
Figures 5 and 6 represent the outcomes of the CUSUM and CUSUMSQ tests. The outcome reflects the stability of the coefficient in the estimated ARDL model. From the figures, it can be deduced that the test outcomes are situated amid the red lines and do not cross the critical value at the 5% level of significance. Thus, it can be deduced that the estimated ARDL model is stable as well as reliable.

Results of the Toda–Yamamoto Granger Causality Test
The outcomes of the causality test proposed by Toda and Yamamoto (1995) have been presented in Table 7. The study does not find any causal relationship between electricity consumption and economic growth. It implies that neither electricity consumption nor economic growth impacts the other. It is inferred from Table 7 that the null hypothesis cannot be rejected. In other words, no causality is observed for GDP and electricity consumption.

Results of the Toda–Yamamoto Granger Causality Test

Conclusion
The aim of this study is to explore the impact of electricity usage on the economic growth of India from 1980 to 2017. To attain the objective, the study has initially applied ADF and PP tests to identify the order of integration of the variables. After identifying the order of integration, the study conducted ARDL test to estimate the long-run association among the variables used.
First, the study examined the relationship between utilization of electricity and growth of an economy and found a significant long-run association among them. Though the study found a long-run relationship among the variables, electricity consumption had no long-run effect on output per capita. Instead, the study found a positive and significant effect of financial development and physical effect on output per capita of the Indian economy. In line with ARDL results, the outcomes of the Toda and Yamamoto (1995) also confirmed no causal relationship between electricity consumption and economic growth. Thus, it is essential for the policymakers to frame policies and build a conducive environment that will help to positively direct the electricity consumption towards productive uses and magnify its potential developmental effects. Moreover, the study sheds light on future policies of electricity by exploring the direction of causation, thereby opening up possibilities to formulate policies with respect to environment, generation and distribution.
Though the study did not find any causal relationship between electricity consumption and economic growth, the electricity demand in India is increasing at a fast rate. The trend of electricity consumption forecasts a steady increase in consumption in the near future, hinting at a possible energy crisis. Such a crisis will affect the economic growth of the country. Therefore, the government and other stakeholders should try to formulate an effective plan immediately to mitigate potential turmoil due to energy crisis. One of the most efficient approaches would be the rapid development of the renewable energy sector to generate enough electricity in order to lessen the pressure on conventional methods.
Additionally, a secure, cost-effective and reliable supply of energy must be ensured by the government to promote economic growth since it has been seen that in the case of developing countries, there is a two to four times higher loss during transmission and distribution of electricity supply as compared to the OECD nations (Karki et al., 2005). The formulated policies should be focused around efficient production and utilization of energy while also emphasizing on the reduction of wasteful competition. A market-based approach should be adopted to raise efficiency levels. Highlighting the importance of investment in the energy sector is important and should be encouraged as it is a capital-intensive sector, and there is a need for global cooperation for developing an appropriate mechanism for a sustainable supply of energy.
Footnotes
Declaration of Conflicting Interests
The authors declared no potential conflicts of interest with respect to the research, authorship and/or publication of this article.
Funding
The authors received no financial support for the research, authorship and/or publication of this article.