
Abstract
In this article, we examine the information linkages of the forward-looking measure of volatility, the volatility index (VIX), for underlying equity market indices of BRICS countries—Brazil, Russia, India, China and South Africa. A study of the information transmission process confirmed a long-run equilibrium relationship between pairs of BRICS countries. The multivariate generalised autoregressive conditional heteroscedasticity (MGARCH) model revealed strong intertemporal linkages between sample VIX. Return and volatility spill-over matrix show the varying degree of connectedness of BRICS VIX across the study period. This study contributes to the international finance literature and has important implications for investors, portfolio managers, policymakers and academia.
Introduction
The BRIC acronym has been used to identify the group of four major emerging economies (Brazil, Russia, India and China). The origin of the BRIC acronym is attributed to a 2001 report by Jim O’Neill, an economist at Goldman Sachs. Later in 2010, South Africa (S) was inducted into the group and the acronym was then termed ‘BRICS’. Since the sub-prime crisis of 2008, the BRICS has been a major driver of global growth. Currently, the BRICS accounts for almost 30 per cent of world gross national product (GNP).
These five nations (BRICS) together have 42 per cent of the world’s population, 30 per cent of the world’s surface area and account for 23 per cent of the world’s gross domestic product (GDP). Further, the BRICS has contributed to more than 50 per cent of the world’s total growth rate over the last 10 years. The BRICS nations are also increasingly taking part in the world economy. Over the last decade, the total economic volume of the BRICS countries rose to 23 per cent from 12 per cent of world economy. The share of BRICS in the world trade has also increased to 16 per cent from 11 per cent a decade ago. These nations are also becoming popular destinations for foreign capital as global investors are constantly seeking higher returns. The share of BRICS in the world’s foreign investment volume increased to 12 per cent from 7 per cent during the same period. According to the projection made by the International Monetary Fund (IMF), China will be the number one contributor to world growth over the next 5 years. The position for India and Brazil are three and four, respectively. In terms of purchasing power parity (PPP) adjusted to nominal GDP, the BRICS includes 4 of the 10 most important countries in the world (Kearney, 2012).
BRICS Countries and the World: Major Statistics
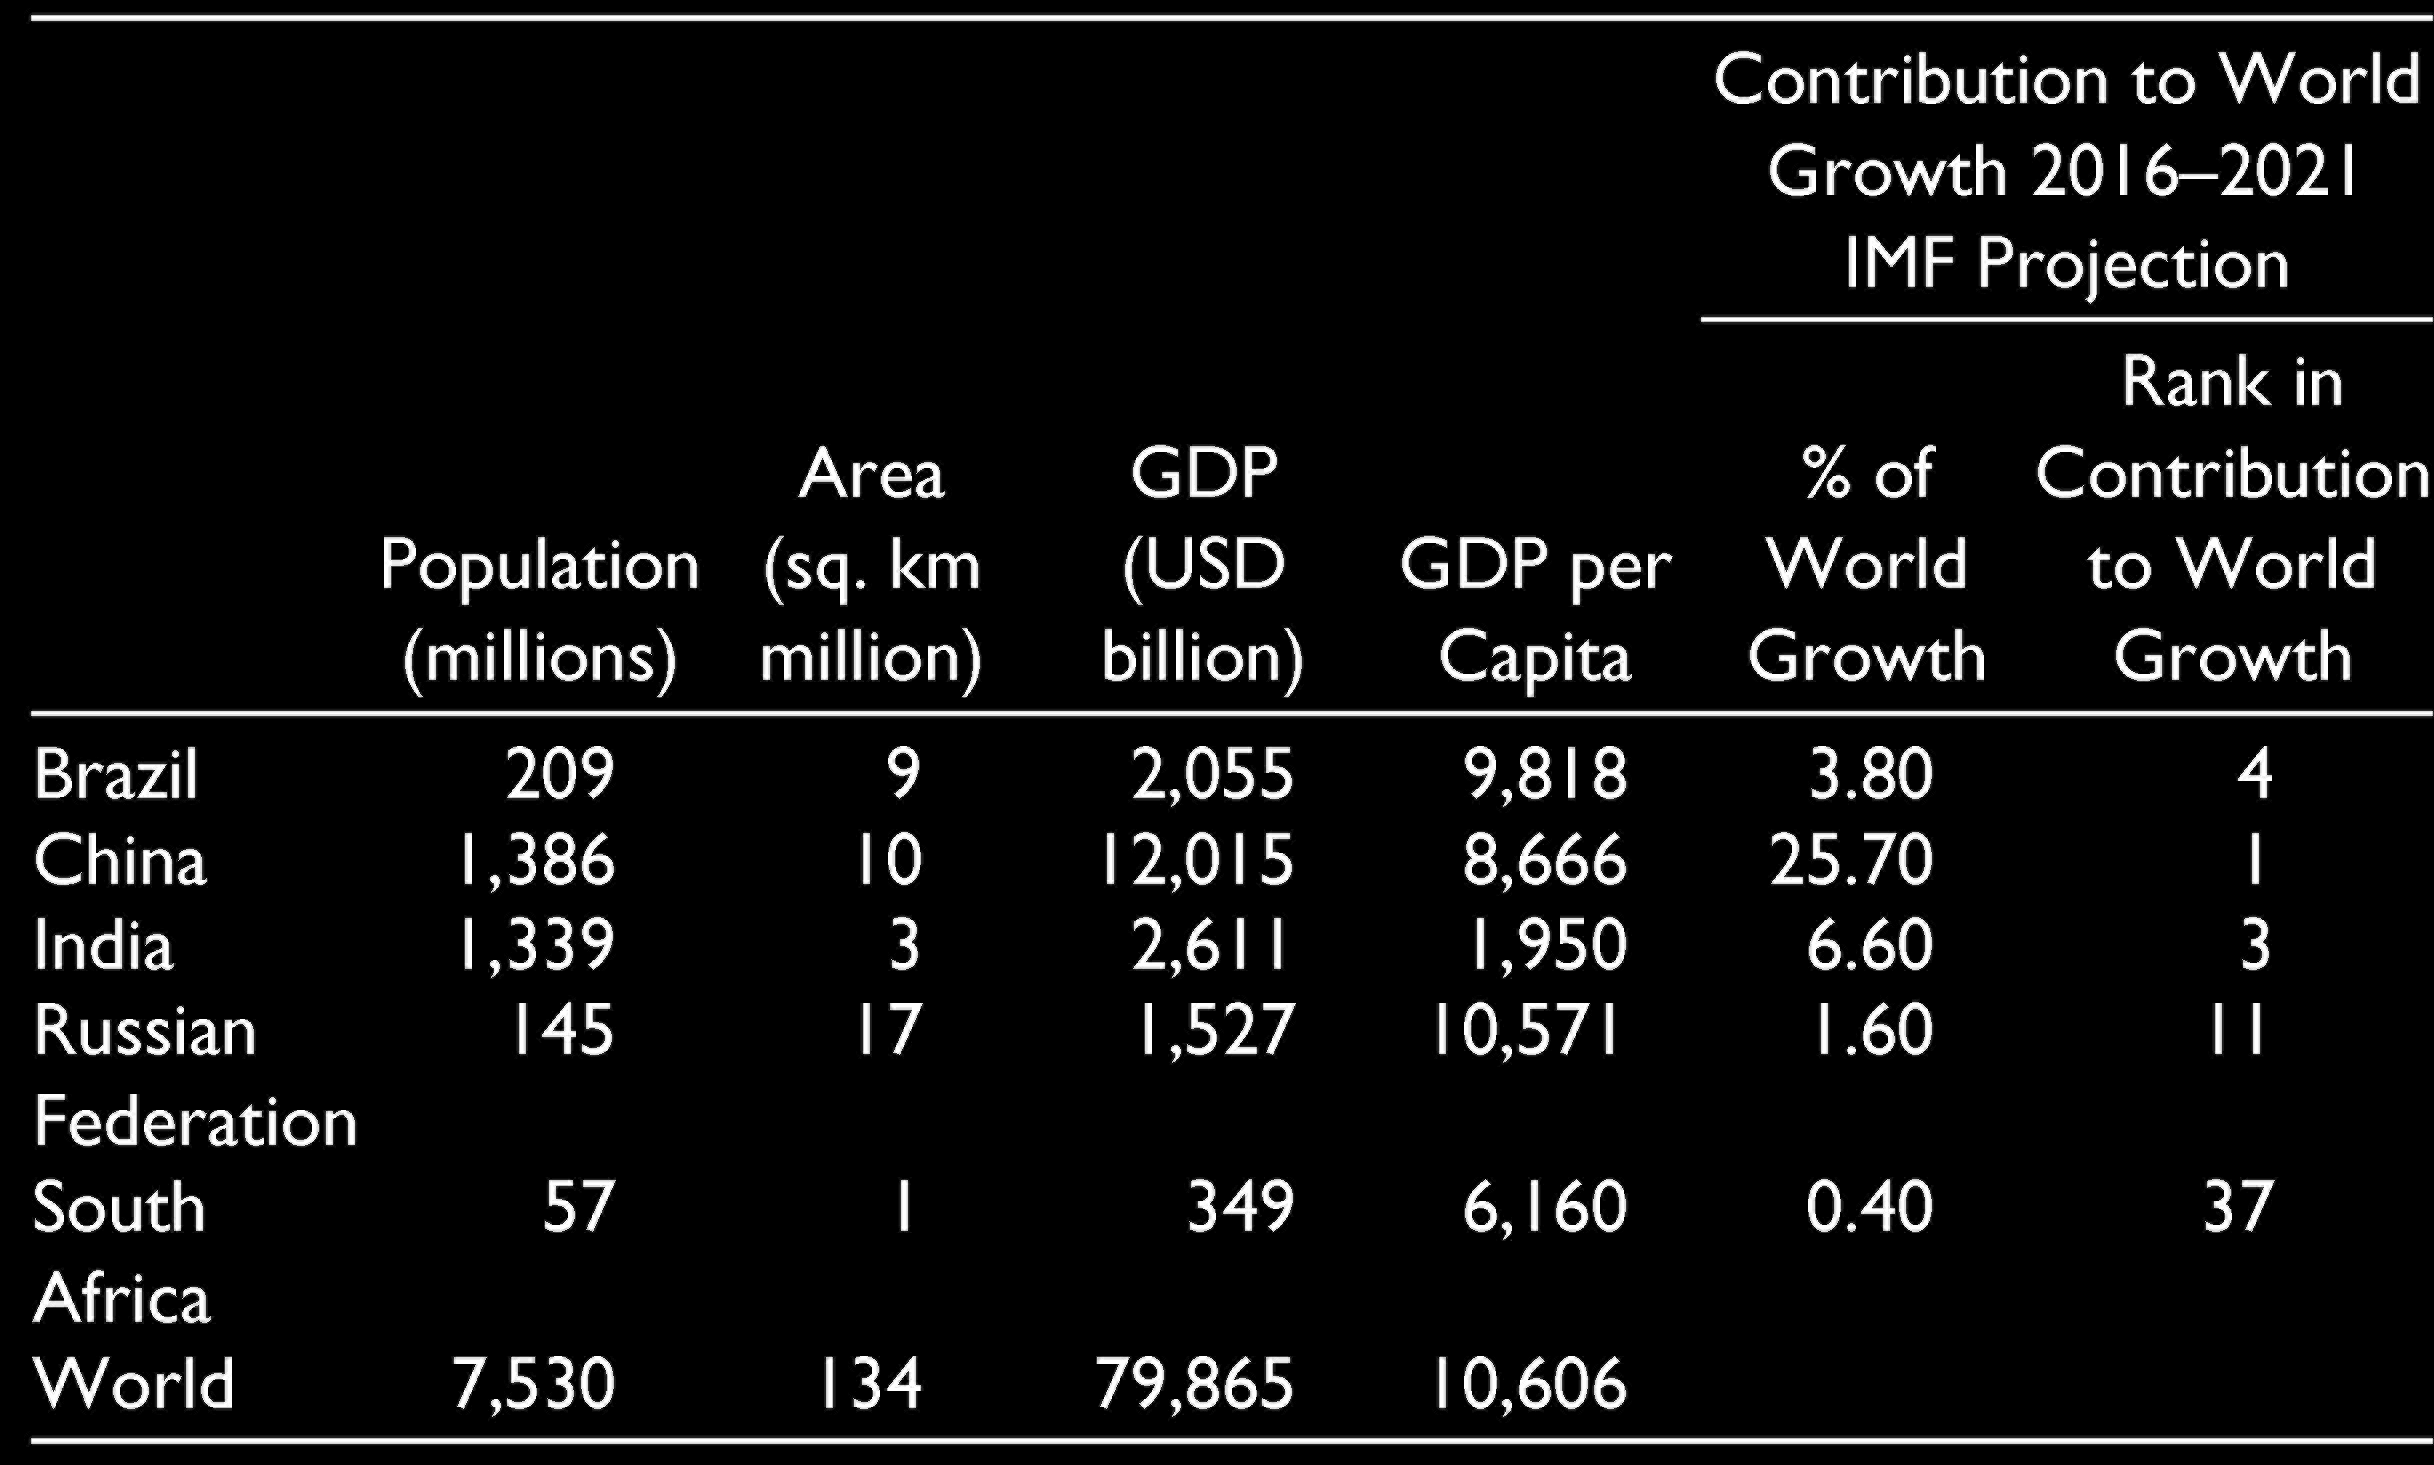
BRICS Countries and the World: Major Statistics
Over the last decade, BRICS countries have enhanced their collaboration as can be seen at various forums and the annual BRIC conferences. BRICS constituents are also seeking greater financial cooperation among themselves through their own New Development Bank (NDB) and Contingent Reserve Arrangement (CRA) as per the Fortaleza Agreement, 2014. Multilateral cooperation between BRICS nations holds great promise and opportunity for the global economy, investors, policymakers and researchers alike. BRICS economies are some of the fastest-growing emerging markets in the world. Because of the great promise they hold, they need to be studied from the perspective of investors, asset managers and policymakers (Hammoudeh, Sari, Uzunkaya, & Liu, 2013; Mensi, Hammoudeh, Kang, & Nguyen, 2016). BRICS financial markets are expanding and have offered good risk-adjusted returns along with ample opportunities for diversification to global investors.
With greater financial liberalisation and economic integration among emerging market economies, BRICS member countries have improved the liquidity and depth of their markets, strengthened investor protection and enhanced their regulatory standards (Mensi, Hammoudeh, & Kang, 2017). Thus, they have emerged as an important destination for developed markets’ investors, seeking to achieve a higher risk-adjusted performance (Buchanan, English, & Gordon, 2011). BRIC countries are among the best emerging market choices for the USA as well as global investors who pursue optimal portfolio allocation along with international diversification (Bhuyan, Robbani, Talukdar, & Jain, 2016). Assets from BRICS markets can offer positive returns during stress periods, may provide safety to returns during downturns and, also due to their low hedge ratio, long positions in the stock holdings of major mature markets can be hedged with smaller amounts from BRICS equities (Mensi et al., 2017). Global investors who are keen to diversify and earn superior returns from the opportunities that BRICS markets offer need to study the dynamics of these individual markets and how are they integrated among themselves. The BRICS economies are not homogenous and are in different stages of the development trajectory, some being more developed than the other. Similarly, their respective financial markets may have different levels of depth, different regulatory architectures and varying patterns in their market microstructures.
It’s been a well-known fact that market volatility varies much more than that of returns. Therefore, a study on cross-country volatilities could reveal more about market dynamics, especially market integration through spill-over effects (Peng & Ng, 2012). Market volatility could be historical (mostly quantified through the standard deviation of stock index returns) or forward-looking volatility indices (VIX) (available as implied VIX and calculated through option prices). Forward-looking VIX are considered as fear-gauge indices for investors. The index price is implied from a wide cross-section of put-call options on the major stock market indices. Further, the investor’s expectation of future stock market performance and overall risk aversion in the market get reflected in implied VIXs as many of them use index options to hedge their position. Historical volatility would not be able to capture such future expectations (Blair, Poon, & Taylor, 2001; Bollerslev, Tauchen, & Zhou, 2009). Nowadays investors can also buy or sell a variety of volatility derivatives to diversify the risk associated with their international portfolios. For international investors, it would be of interest to know the level and direction of the link among markets in terms of their volatilities. This could explain if unexpected shock in one market volatility would have an impact (and how much) on other market(s) and vice versa. Understanding cross-volatility linkage and their correlation dynamics could help international investors make a better decision regarding risk management (Li & Giles, 2015).
The empirical literature on information linkages (return and volatility spillover) has mostly focused on developed financial markets. As a result, there is limited literature on information transmission and volatility linkages within the BRICS markets. Against this background, our study aims to extend the analysis of spill-over effects to major emerging markets, that is, BRICS, as they evolve into bigger players in the world financial economy, and the global investor class aims to harness the benefits of higher returns and portfolio diversification. Studying BRICS returns and volatility spill-over effects across various markets is essential to enhance the understanding of global investors, financial institutions and governments on the dynamic relationships that exist between the various stock markets due to real-time information flow. Understanding information linkages is also helpful in effective financial market policymaking, prudent investment allocation and deploying suitable hedging strategies.
The era of increased financial openness and integration has decreased the level of isolation of local financial markets. Any news, information or event in today’s ‘information age’ makes investors react rapidly and this affects the asset prices locally as well as globally. This seamless information flow, apart from the impacting market returns, can also influence volatility patterns in both domestic and foreign markets. In financial literature, this pattern is identified as a ‘spillover’. Spillover occurs when price changes within one market induce a lagged impact on the asset prices of other different markets. A spill-over effect may exist between the markets of different countries and also among different financial markets within a single country (Huo & Ahmed, 2017). Under extreme situations, spillover may also be identified as ‘contagion’ when the spill-over effect is large and extremely quick. Since the US market crash of 1987, several researchers have identified spill-over effects in relation to returns and volatility between various financial markets. Examining the price (return) spillover helps in improving price prediction and developing arbitrage trading strategies for market participants (Dimpfl & Jung, 2012; Pati & Rajib, 2011). Investigating volatility spill-over is useful for option pricing, portfolio optimisation, computation of value at risk and risk hedging (Aragó & Salvador, 2011). Thus studying the information transmission process is important for decoding the dynamic price discovery processes that prevail in financial markets and optimising portfolios along with risk.
There is a vast literature that has studied the co-movement of BRICS equity markets. However, most of these prior studies have focused only on price connectedness. One of the key ways of understanding investor behaviour and market connectedness is through the study of market volatility. Just like prices, volatilities too are crucial driving factors of markets. The historical, or realised, volatility, mostly quantified through standard deviation, doesn’t offer much information in terms of expected volatility in the future. However, implied volatility which is calculated through option prices contains the expected future realised volatility of the underlying asset over the remaining life of that option (Padhi, 2011).Unlike realised volatility, implied volatility is forward looking in nature and is understood as the consensus of market participants about the expected volatility in future. So, according to Merton (1976), the best available estimate of market uncertainty is implied volatility. Limited research has been dedicated to studying the implied volatility association between the BRICS equity markets. The first market VIX was created using the implied volatilities derived from option prices through the Black and Scholes’ option pricing model in 1993 by the Chicago Board Options Exchange (CBOE). CBOE VIX has since been used as an indicator of future short-term volatility in US equity markets. Since VIX is an indicator of expected future stock market volatility, it has been termed ‘the investors’ fear gauge’ (Whaley, 2000). The index has since emerged as one of the key benchmarks for measuring risks in the US equity market. Since 1993 several financial markets such as Russia (RVI), India (IVIX), Germany (VDAX) and France (VCAC) have introduced their own VIX. The empirical literature has found a statistically significant relationship between the returns of the various countries’ market indices and their corresponding implied VIX (Chiang, 2012; Giot, 2005; Sarwar, 2012). VIX for any market provides valuable information regarding the expected volatility and is thus useful to create hedging strategies. The VIX measure is also useful to investigate the level of integration between the economies (Nikkinen & Sahlström, 2004). The VIX options and futures offer investors affordable tools to hedge their investments against market volatility. VIX can also be used as an indicator of the price of portfolio insurance (Whaley, 2009). Other studies advocate the use of VIX for timing the stock market and option trades (Arak & Mijid, 2006; Copeland & Copeland, 1999). Carr and Wu (2006) show that VIX can better predict movement in future realised variance in comparison to the historically estimated volatilities using generalised autoregressive conditional heteroscedasticity (GARCH) models.
Through this article, we try to identify the levels of linkages between the VIX of BRICS markets. The investigation of the nature of implied volatility spillover shall have implications for investors, traders and policymakers. Studying the information linkages in prices and volatility shall help understand the nature of the lead-lag relationship between the BRICS VIXs. It’s also of value for investors to investigate how a shock to one country’s VIX spills over, in magnitude and persistence, to another country’s VIX. The study of information transmission for BRICS VIX should help market participants in locating the patterns of information flow and its diffusion within these markets. It will offer evidence on financial market linkages which can be used for developing customised trading strategies suited to BRICS markets. Furthermore, the study shall help in exploring the diversification benefits through BRICS-implied VIX as an asset class in global portfolios (Narwal, Sheera, & Mittal, 2012). These findings can be useful when growing interconnectedness among international capital markets makes benefits of diversification difficult to attain just by going global (Padhi, 2011). Learning from this study may also help investors hedge their assets against volatility through adequate off-setting positions in BRICS VIX futures and option contracts. The study may be of relevance for the policymakers of BRICS member countries to develop a macroprudential policy for member countries factoring in the contagion effects.
There has been a lot of empirical literature on examining the equity market linkages for BRICS economies (see Ahmad, Sehgal, & Bhanumurthy, 2013; Aloui, Aïssa, & Nguyen, 2011; Bhar & Nikolova, 2009; Chiang, Chen, & Lin, 2013; Dimitriou, Kenourgios, & Simos, 2013; Kenourgios, Samitas, & Paltalidis, 2011; Mensi et al., 2017; Xu & Hamori, 2012; Zhang, Li, & Yu, 2013 etc.). But very little empirical work has focussed on information linkages of VIX (in general and BRICS in particular) which provide important cues for forward-looking volatility measures which impact equity markets’ interconnectedness. In a different context, Mensi, Hammoudeh, Reboredo, and Nguyen (2014) found the dependence structure between BRICS markets and US share market uncertainty (CBOE VIX). In similar work, Sarwar (2012) examined the intertemporal relationships between US VIX and stock market returns in the USA as well as Brazil, Russia, India and China (BRIC) for 1993–2007 and for the 1993–1997 and 1998–2007 sub-periods. The study found a significant negative contemporaneous relationship between US VIX and equity market returns in the USA, Brazil and China from 1993 to 2007 and in India from 1993 to 1997). This negative contemporaneous relationship is also asymmetric in nature, being stronger when VIX is higher and more volatile. VIX reactions to negative stock market returns are much more aggressive than their responses to positive changes in equity returns of a similar size. Sarwar (2017) suggests that VIX is more of an investor fear index than a gauge of investor positive sentiment, not only for the US stock market but also for the markets of Brazil, China and India. To the best of the knowledge of the authors, contemporary literature on examining the dynamics of information transmission (return and volatility linkages) within the BRICS countries VIX is extremely thin. Our study attempts to fill the gap by investigating the return and volatility linkages among BRICS equity markets’ VIX.
Data and Methodology
Data consist of the VIX of Brazil, Russia, India, China, South Africa and the USA. CBOE VIX 1 for the USA is used as a proxy for global factors. Daily values of the VIX of these respective countries have been used in the study. Data have been sourced from Bloomberg. The timeline of the daily VIX data used for the study extends from March 2011 to August 2016. The starting date for the VIX time-series data was March 2011 because it was the earliest available VIX data for Brazil. VIX prices are taken in USD for both controlling the foreign exchange risk and homogeneity of comparison.
In the methodology section, we first check for the stationarity in data using breakpoint unit root tests. Further, for cointegration among VIX, we use the Gregory and Hansen (1996a, 1996b) model which we discuss in detail in the next paragraph. After investigating the long-run relationship between the BRICS VIX price series, we investigate their short-run dynamics through the vector error correction model (VECM) test. We then use the dynamic conditional correlation (DCC) model of multivariate generalised autoregressive conditional heteroscedasticity (MGARCH) proposed by Engle (2002) to examine pair-wise time-varying conditional correlations. The linkages of the VIX of BRICS countries were further studied by measuring the level of contribution of shocks from each country to another member country at different points in time. To assess the degree of connectedness between the returns/volatilities of VIX, we use Diebold and Yilmaz’s (2009, 2012) methodology. It is based on dynamic variance decompositions from vector autoregression (VAR) applied to the return series. Now we go ahead and discuss these methodologies in detail.
The data are investigated for stationarity using breakpoint unit root tests as literature has documented that conventional unit root tests are biased towards a false unit root null in the presence of structural breaks. If two or more time series are individually non-stationary but their linear combination is stationary, then the series is said to be ‘cointegrated’. However, in some cases, the null of ‘no cointegration’ is not rejected, because of the presence of structural breaks in the individual series. So the Gregory and Hansen (1996a, 1996b) cointegration test, which accommodates for possible endogenous structural breaks, was applied to the data to identify the presence of any long-run equilibrium relationships between the various sample VIX data series. Gregory and Hansen’s methodology corresponds to augmented Dickey–Fuller (ADF)- and Phillip-type tests of unit root on the residuals, to identify cointegration in the presence of a possible regime shift. Gregory and Hansen’s test identifies cointegration in case of a single break in the intercept and/or slope coefficients when the timing is unknown. Critical values for the tests are quantified by modifying the Mackinnon (1991) procedure, though simulation methods and finite-sample performance is evaluated by conducting a simple Monte Carlo experiment. The single break date is endogenously determined and the null hypothesis of no cointegration with structural breaks is rejected if the critical value is greater than the corresponding ADF, Zt and Zα statistics.
The Gregory and Hansen model, along with the assumptions about structural breaks and their specifications for two variables, is represented by these four equations:
Model 1: Standard cointegration: Yt = μ1 + α1Xt + εt Model 2: Cointegration with level shift (CC): Yt = μ1 + μ2θtk + α1Xt + εt Model 3: Cointegration with level shift and trend (CT): Yt = μ1 + μ2θtk + βt + α1Xt + εt Model 4: Cointegration with regime shift (CS): Yt = μ1 + μ2θtk + α1Xt + α2Xtθtk + εt
where
Y = dependent variable; X = independent variable; t is time subscript εt is the error term; k is the break date; and θ is a dummy variable such that θtk =
After investigating the long-run relationship between the BRICS VIX price series, we investigate their short-run dynamics through the VECM test. Results from the VECM tests are confirmed through the Granger causality test which specifies the direction of causality.
The DCC model of MGARCH proposed by Engle (2002) is used to examine pair-wise time-varying conditional correlations. DCC estimates are computed by following a two-step procedure. First, univariate volatility is modelled using the exponential generalized autoregressive conditional heteroskedacity (EGARCH) process in terms of conditional variance (hi,t). In the interest of parsimony of parameters, the EGARCH (1,1) model is our preferred model (see Kim & Wang, 2006). Mean equation used for a country i’s VIX returns is as follows:

if εt = σtzt where zt is standard Gaussian,
Here, Rusa is the US VIX return and is used as a proxy for global effects (see Dungey, Fry, & Martin, 2003; Samitas & Kenourgios, 2007; Sehgal, Gupta, & Deisting, 2016). EGARCH is formulated after factoring in the mean spill-over effects from the US VIX as its lagged returns proxy for global uncertainty factors and captures the global mean spill-over effects including structural shocks. The time-series vector of the conditional volatility series of these sample indices is generated from the EGARCH (1,1) model to study volatility spillovers by Diebold and Yilmaz’s methodology (2009, 2012; discussed later).
Residual correlations are then computed in the next step.
Conditional covariance matrix Ht is decomposed as Ht = DtRtDt
where


The DCC model is preferred over other multivariate GARCH models because of its several advantages. The DCC model parameterises conditional correlations, while other specifications like vector error correction (VEC) and Baba–Engl–Kraft–Kroner (BEKK) models require indirect computations of conditional correlations as they parameterise conditional covariances (Gjika & Horvath, 2013). The constant conditional correlation (CCC) model introduced by Bollerslev (1990) assumes correlations to be constant which is neither realistic nor empirically justified (Gjika & Horvath, 2013), and its estimation involves solving a high-dimensional optimisation problem (Aboura & Chevallier, 2014). Further, the DCC model relaxes the assumption of constant correlation and provides greater flexibility as it reduces the number of parameters to estimate (see Kim & Sun, 2016). The Asymmetric generalised (AG) DCC model was introduced by Cappiello, Engle, and Sheppard (2006). AG-DCC accounts for series-specific impact from news/events and allows for conditional asymmetries in correlation dynamics. So it continuously adjusts to time-varying volatility and also accounts for heteroscedasticity. Hence, we utilise the AG-DCC model to evaluate the time-varying correlations among the sample VIX.
The linkages of the VIX of BRICS countries were further studied by measuring the level of contribution of shocks from each country to another member country at different points in time. To assess the degree of connectedness between the returns/volatilities of VIX, we use Diebold and Yilmaz’s (2009, 2012) methodology. It is based on dynamic variance decompositions from a VAR applied to the return series. Diebold and Yilmaz’s methodology is an improvement over the VAR methodology (Sims, 1980) because it can be used to quantify the return as well as volatility spillovers, both within and across countries. The results from this methodology help in better identification of spill-over trends and cycles.
For each variable i, in an N-variable VAR framework, the measure of connectedness is the sum of the shares of its forecast error variance coming from shocks to asset j, represented as a percentage, for all j ≠ i. Consider a p order in an N-variable VAR model:
xt = 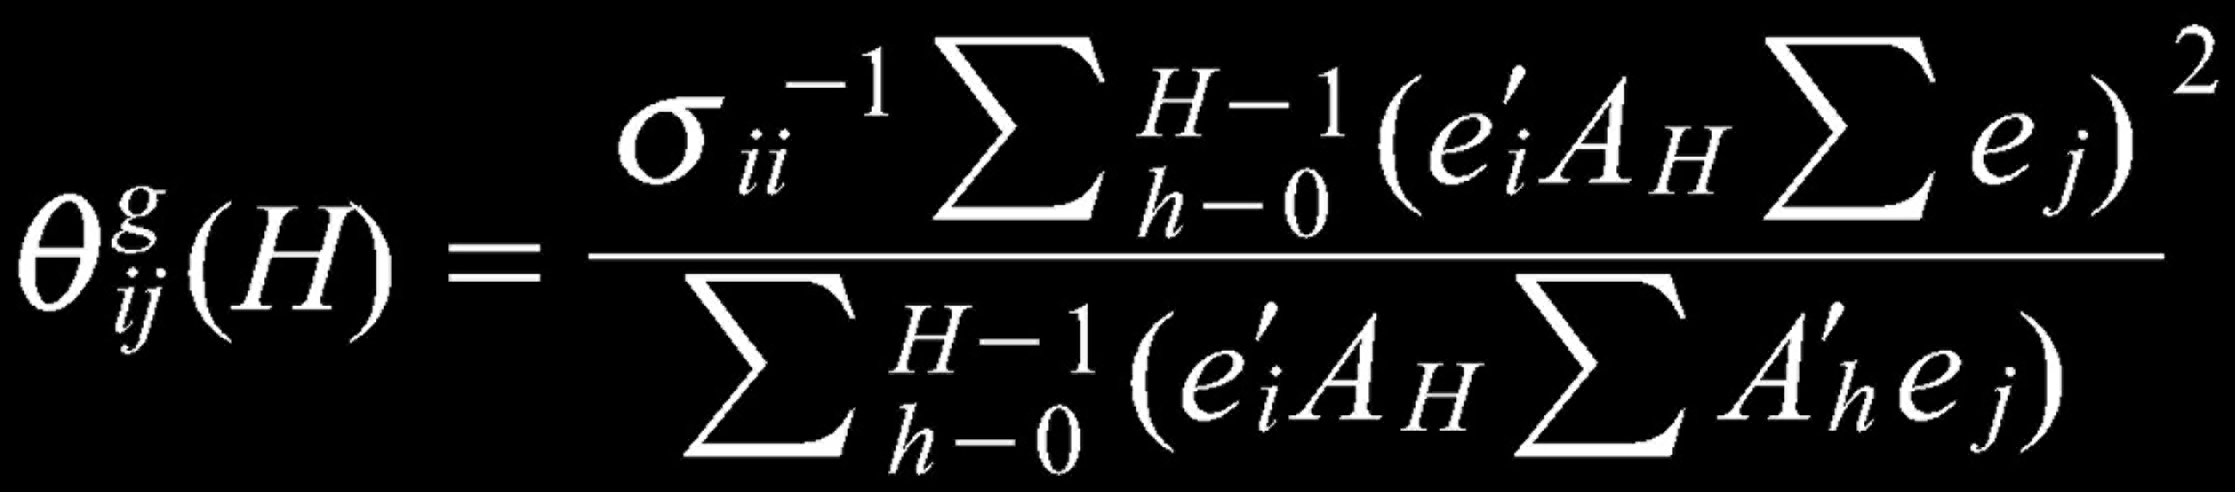
where 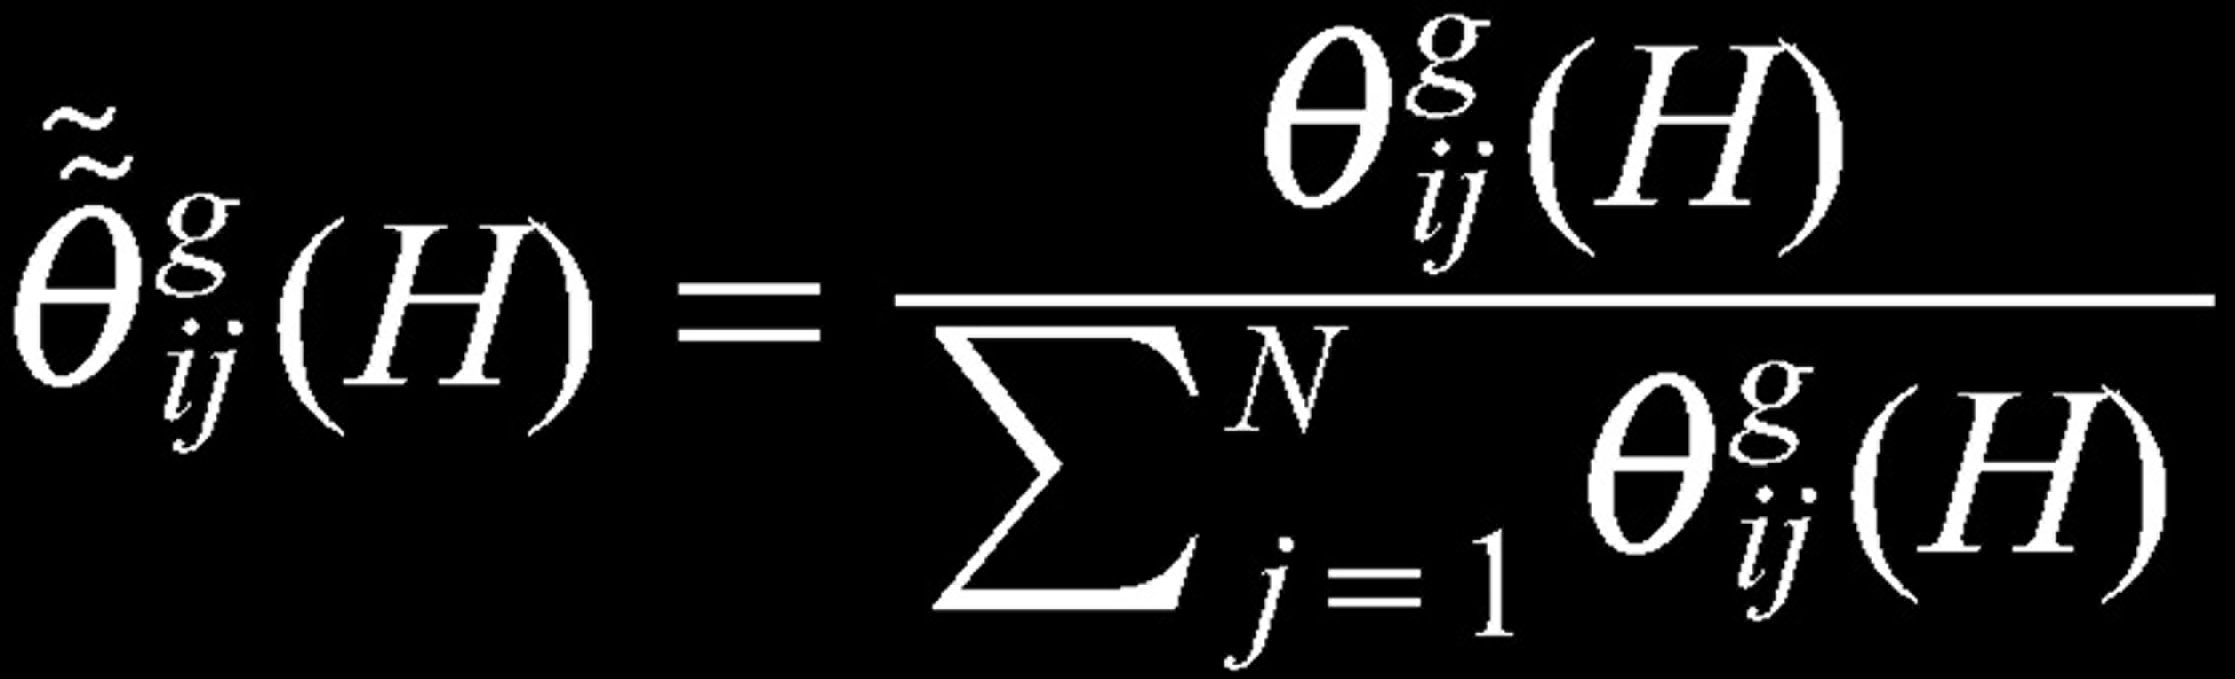
Following Diebold and Yilmaz (2012), the total spillover index is calculated as

Total spill-over index is the sum of cross-variance shares, which is the fraction of the H step ahead error variances in forecasting xi due to shocks to xj.
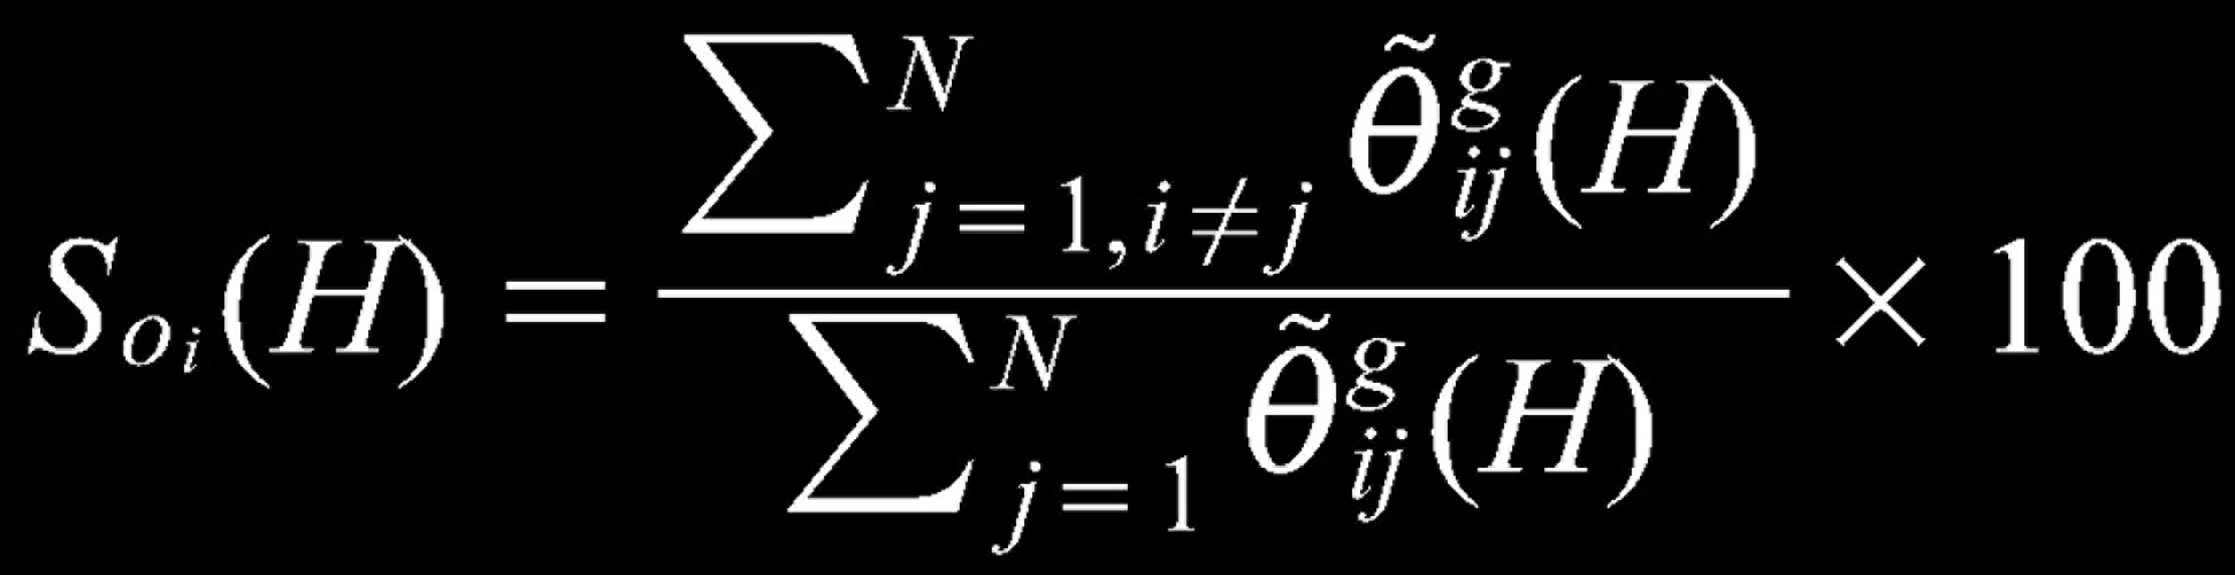
Directional spillover is measured as the sum of the proportions of the forecast error variance of the variable i due to shocks to j 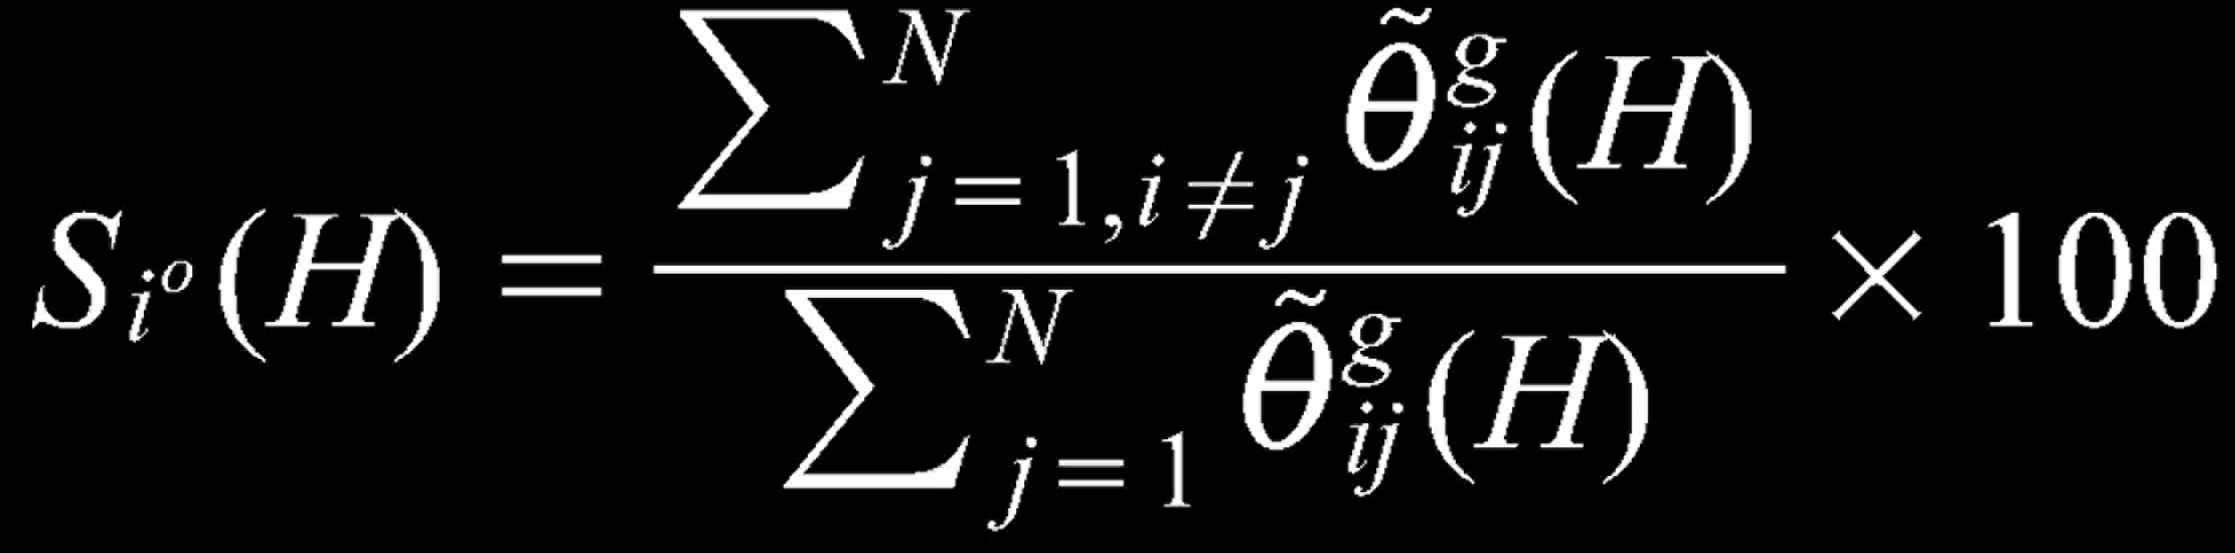
The directional spillover measures are not ordered sensitive. In a similar vein, directional spillover to the variable i from all other variables is obtained as:
Lastly, net spillover can be obtained by simply taking the difference between directional spillovers to and directional spillovers from all other variables:

Empirical Results
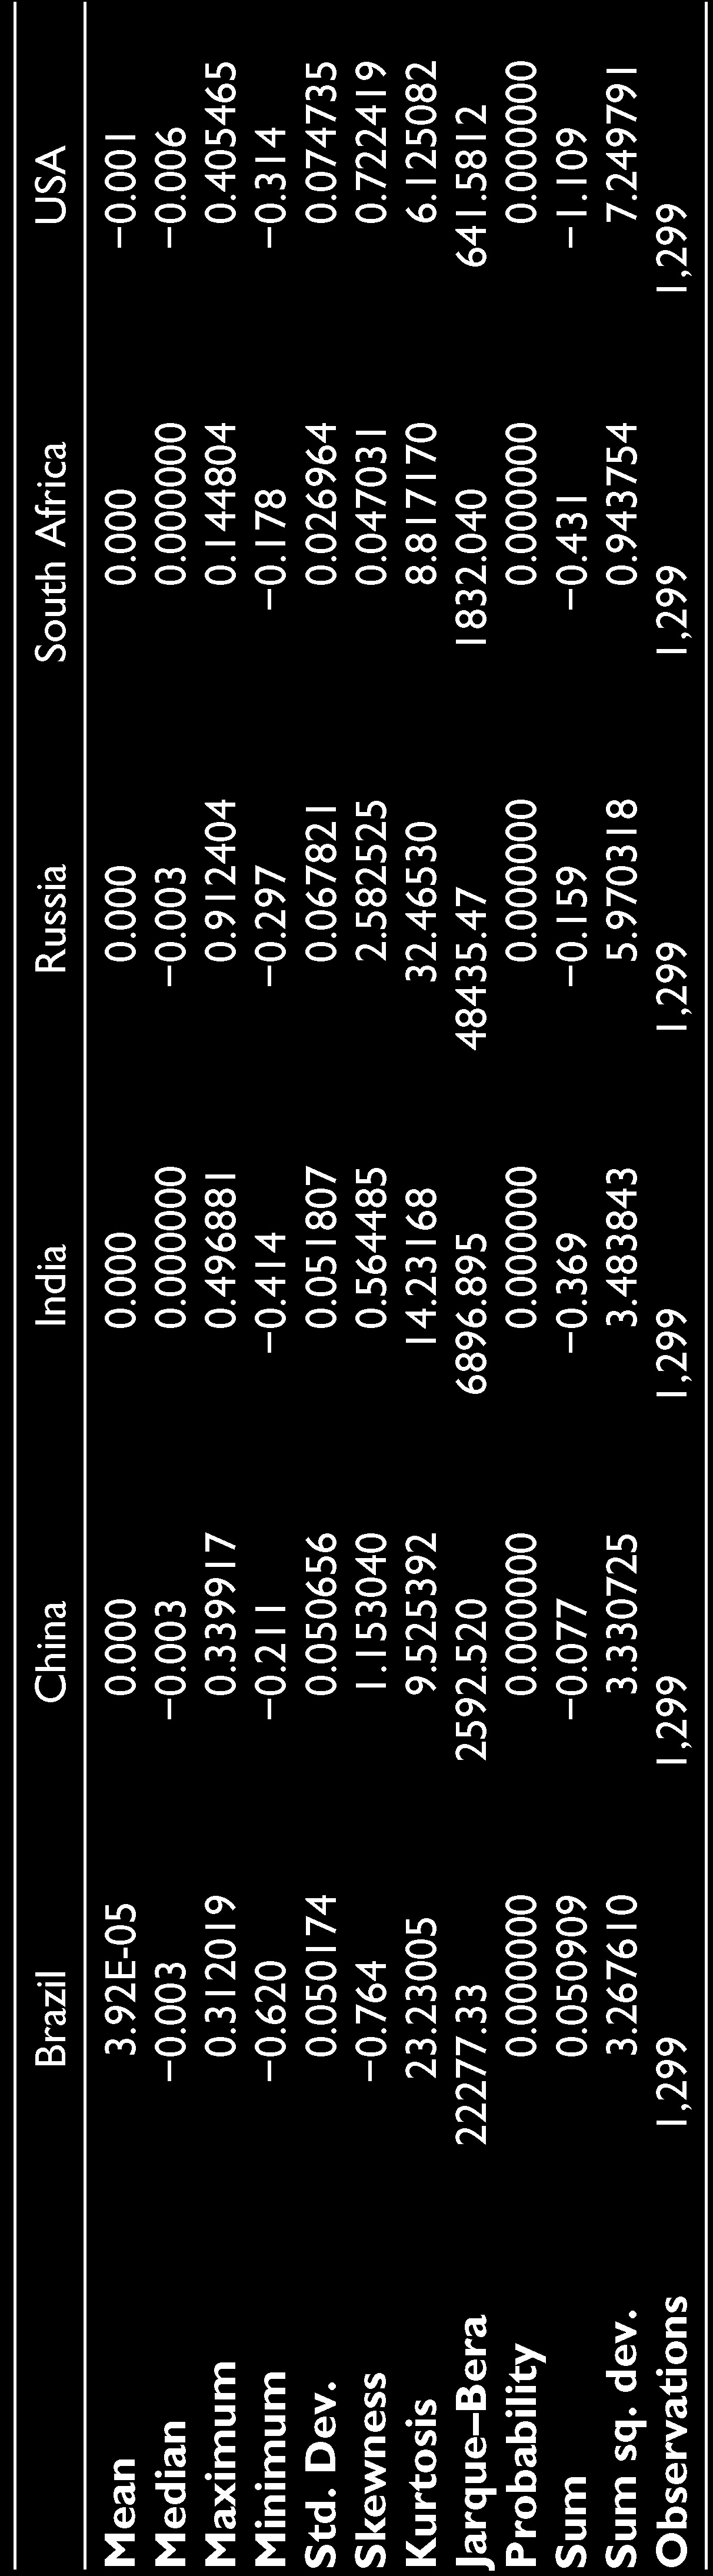
The average values for the sample VIX series are not statistically different from zero. The descriptive statistics (refer to Table 2) for the level series shows that sample countries have positive mean values which become negative for the log-differenced series except in the case of Brazil.
Descriptive Statistics of Sample VIX Return Series
Descriptive Statistics of Sample VIX Return Series
The standard deviation was found to be positive and highest for USA followed by Russia (among the BRICS group). Skewness and Kurtosis measure confirmed that the sample return series was predominantly positively skewed and highly leptokurtic with respect to normal distribution. The Jarque–Bera test of normality of the sample return series was rejected at 95 per cent level of confidence. A unit root test with structural breaks 2 was performed which confirmed that the VIX data series of the BRICS member countries was I(1), that is, stationary at first difference.
To account for structural breaks, the Gregory Hansen test was performed which is superior to Johnson’s cointegration test (as underlying data series is VIX where structural breaks are not uncommon) to confirm the long-run equilibrium relationship between the sample series.
Empirical results (refer to Table 3) confirmed that there exists a long-run equilibrium relationship between the sample indices, thereby indicating the network connectedness of the BRICS VIX. This is hardly a surprise given that all these markets are attractive to global fund managers who are looking for higher risk-adjusted returns after looking for diversification benefits. For international portfolio managers, significant risk reduction could be achieved by offsetting exposure to a common implied volatility risk factor and also hedging the idiosyncratic risk factors. The network connectedness of these implied VIX markets also stems from the fact that these global natures of risks are traded by institutional investors (hedge funds, etc.) who are relatively informationally efficient, and in turn, their expectations are well factored in the publicly available price of the VIX. The information transmission between the sample VIX was observed by the VECM test 3 to study the short-run error corrections from the long-run equilibrium path. For the pair of sample indices, South African VIX seems to be taking the lead to correct short-term deviations from the long-term equilibrium relationship with member countries. This could be attributed to the fact that South Africa is the newest member in the BRICS fold and its economy, population and size are much smaller than other member countries of BRICS, and hence its degree of financial linkages with other members might be bit weak. Granger causality results (refer Note 3) confirm the bidirectional causality of the majority of these sample VIX series which confirms that these indices are connected to each other.
Gregory Hansen Test for Cointegration
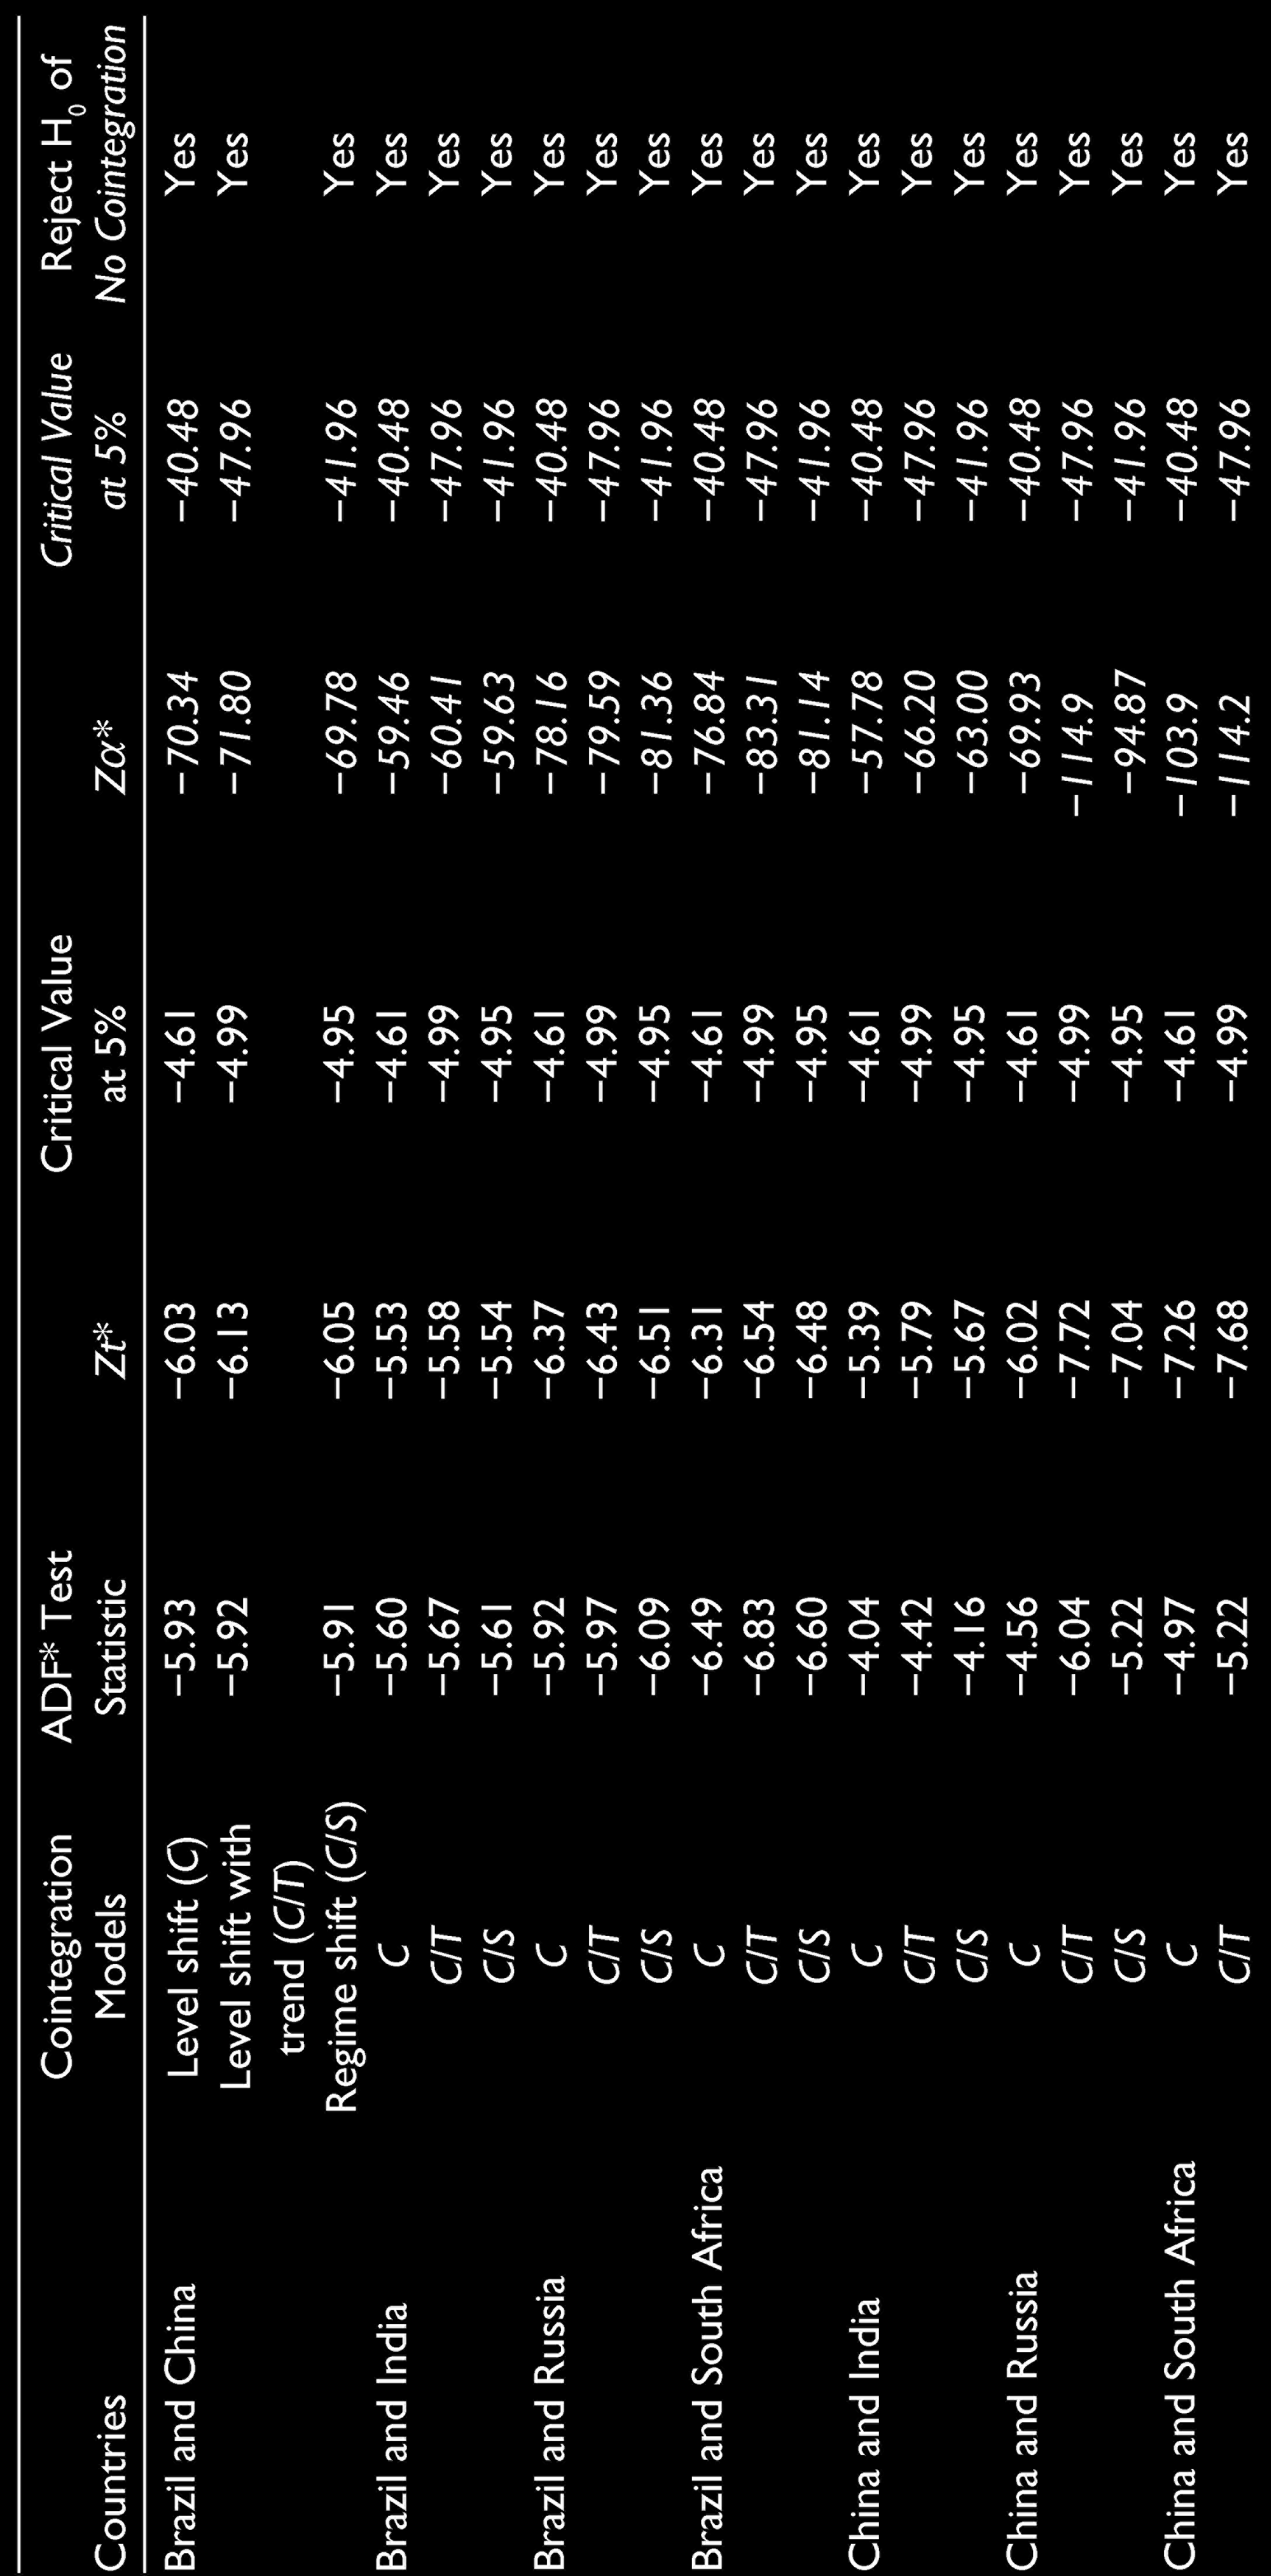
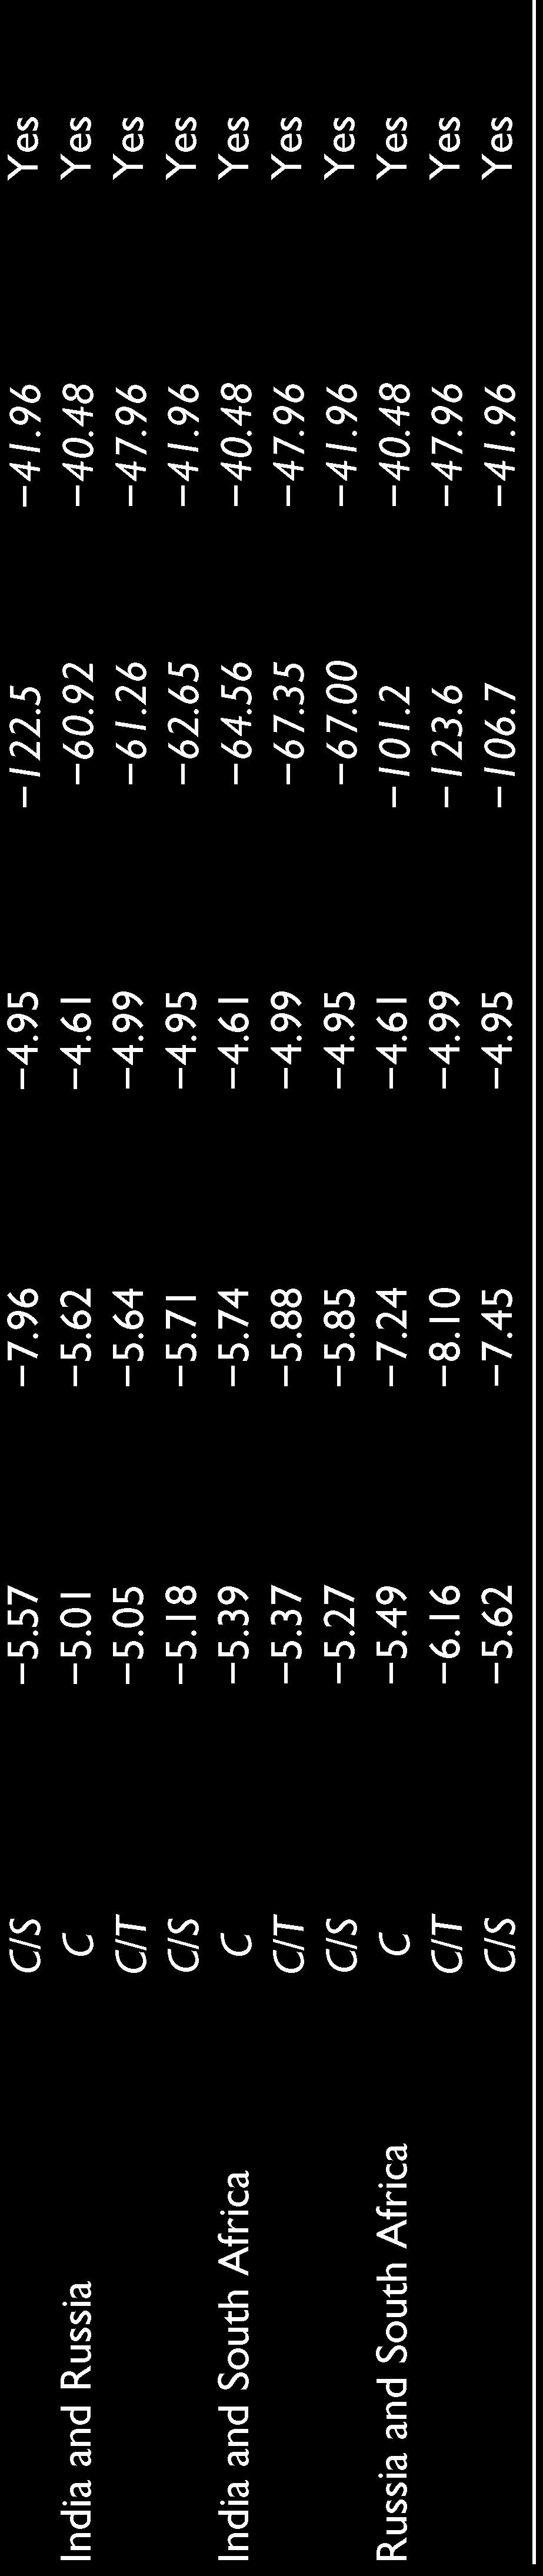
This table provides the results of the Gregory and Hansen (1996a, 1996b) cointegration test. This test identifies cointegration in case of a single break in the intercept and/or slope coefficients when timing is unknown. The null hypothesis of no cointegration with structural breaks is rejected if the critical value, quantified by modifying the Mackinnon (1991) procedure, is greater than the corresponding ADF, Zt and Zα statistics.
C represents cointegration with level shift
C/T represents cointegration with level shift and trend
C/S represents cointegration with regime shift
To explore the correlation structure of various sample VIX, we compute the bivariate dynamic conditional correlations (AG-DCC EGARCH (1,1) model) between them.
Figure 1 plots the time-varying conditional correlation measure of the sample VIX. The time-varying correlations 4 have been plotted against the average measure of correlations intertemporally to observe its dynamic evolution. The average conditional correlations seem to be the lowest for the South African VIX vis-a-vis other countries, while the highest correlations (0.48) emerge for the Brazil-China pair of VIX. The average conditional correlations seem to be generally high for the sample countries, indicating the degree of connectedness which may be attributed to higher yields of BRICS group members, network linkages and institutional funds seeking homogenous risk exposure to BRICS countries as a whole. The sample graphs have broadly hovered around the mean over time which shows that there has not been any major increase/decrease of dependences.
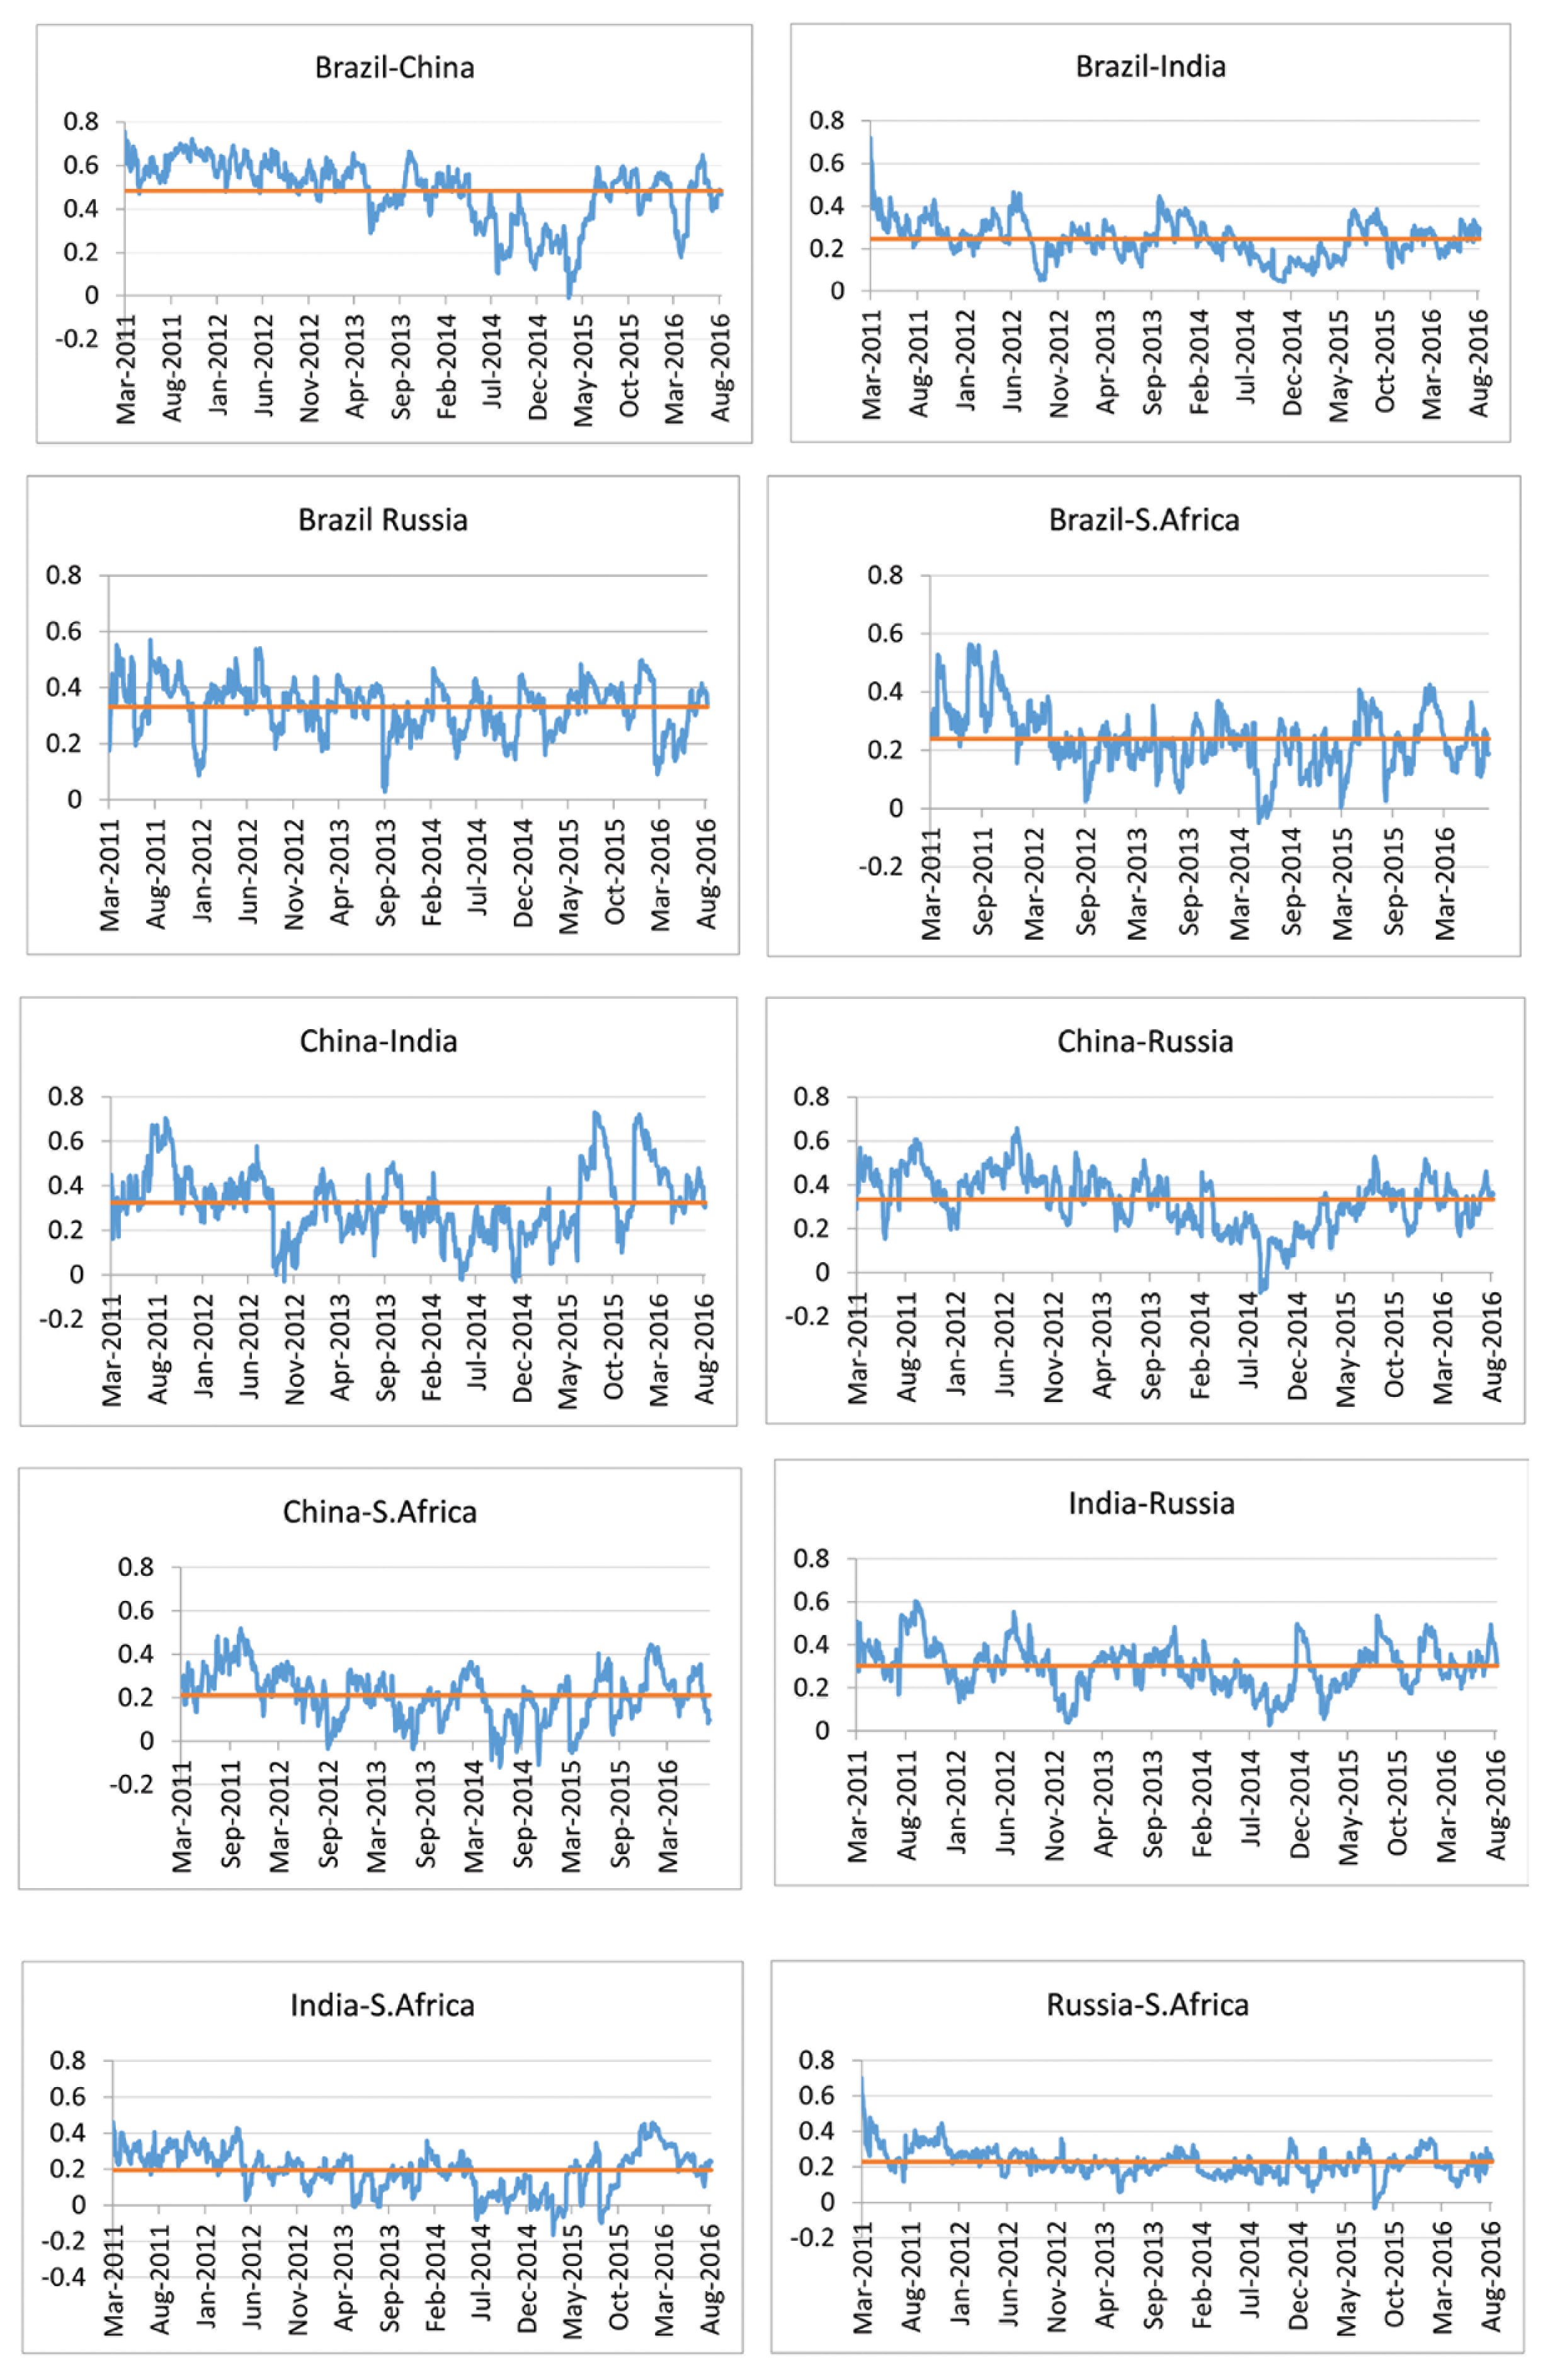
Table 4 represents the time-aggregated VIX returns spill-over matrix for BRICS member countries. The results clearly show that for each sample country, the contribution to its forecast error variance comes predominantly from shocks given to its own VIX returns 5 but the ‘others column’ also constitutes one-third of the total contribution. The cross-market spillovers (the off-diagonal elements of Table 4), though individually small, together account for one-third of the total contribution to the forecast error variance of the sample VIX of sample countries. China’s VIX seems to dominate BRICS member countries in terms of its contribution (indicated in both the ‘from others’ and ‘to others’ columns of Table 4) to the forecast error variance of other member countries. Both Brazil’s and China’s VIXs seem to be net transmitters of returns spillovers as their ‘contribution to others’ is greater than ‘contribution from others’. Strong Brazil-China linkages can also be attributed to strong trade linkages, where China is Brazil’s top trading partner for exports as well as imports. This can also be a reason as to why this particular pair showed the highest conditional correlation (as the highest contribution to the forecast error variance of China’s VIX comes from Brazil and vice versa as shown in Table 4), as found out by the AG-DCC model estimated earlier. South African VIX is the one in which more than 80 per cent of its contribution to its forecast error variance comes from the shocks given to its own index returns; hence, it seems to be least connected (contributions to and from other BRICS countries’ VIX are the least) among the BRICS members. Total returns’ spillover value (indicated in the lower right corner of Table 4) indicates that on an average, 29.3 per cent of the forecast error variance in all the sample BRICS VIX comes from spillovers within the BRICS itself. This indicates a high connectedness within the BRICS-implied VIXs.
VIX Returns Spillovers Across BRICS Countries
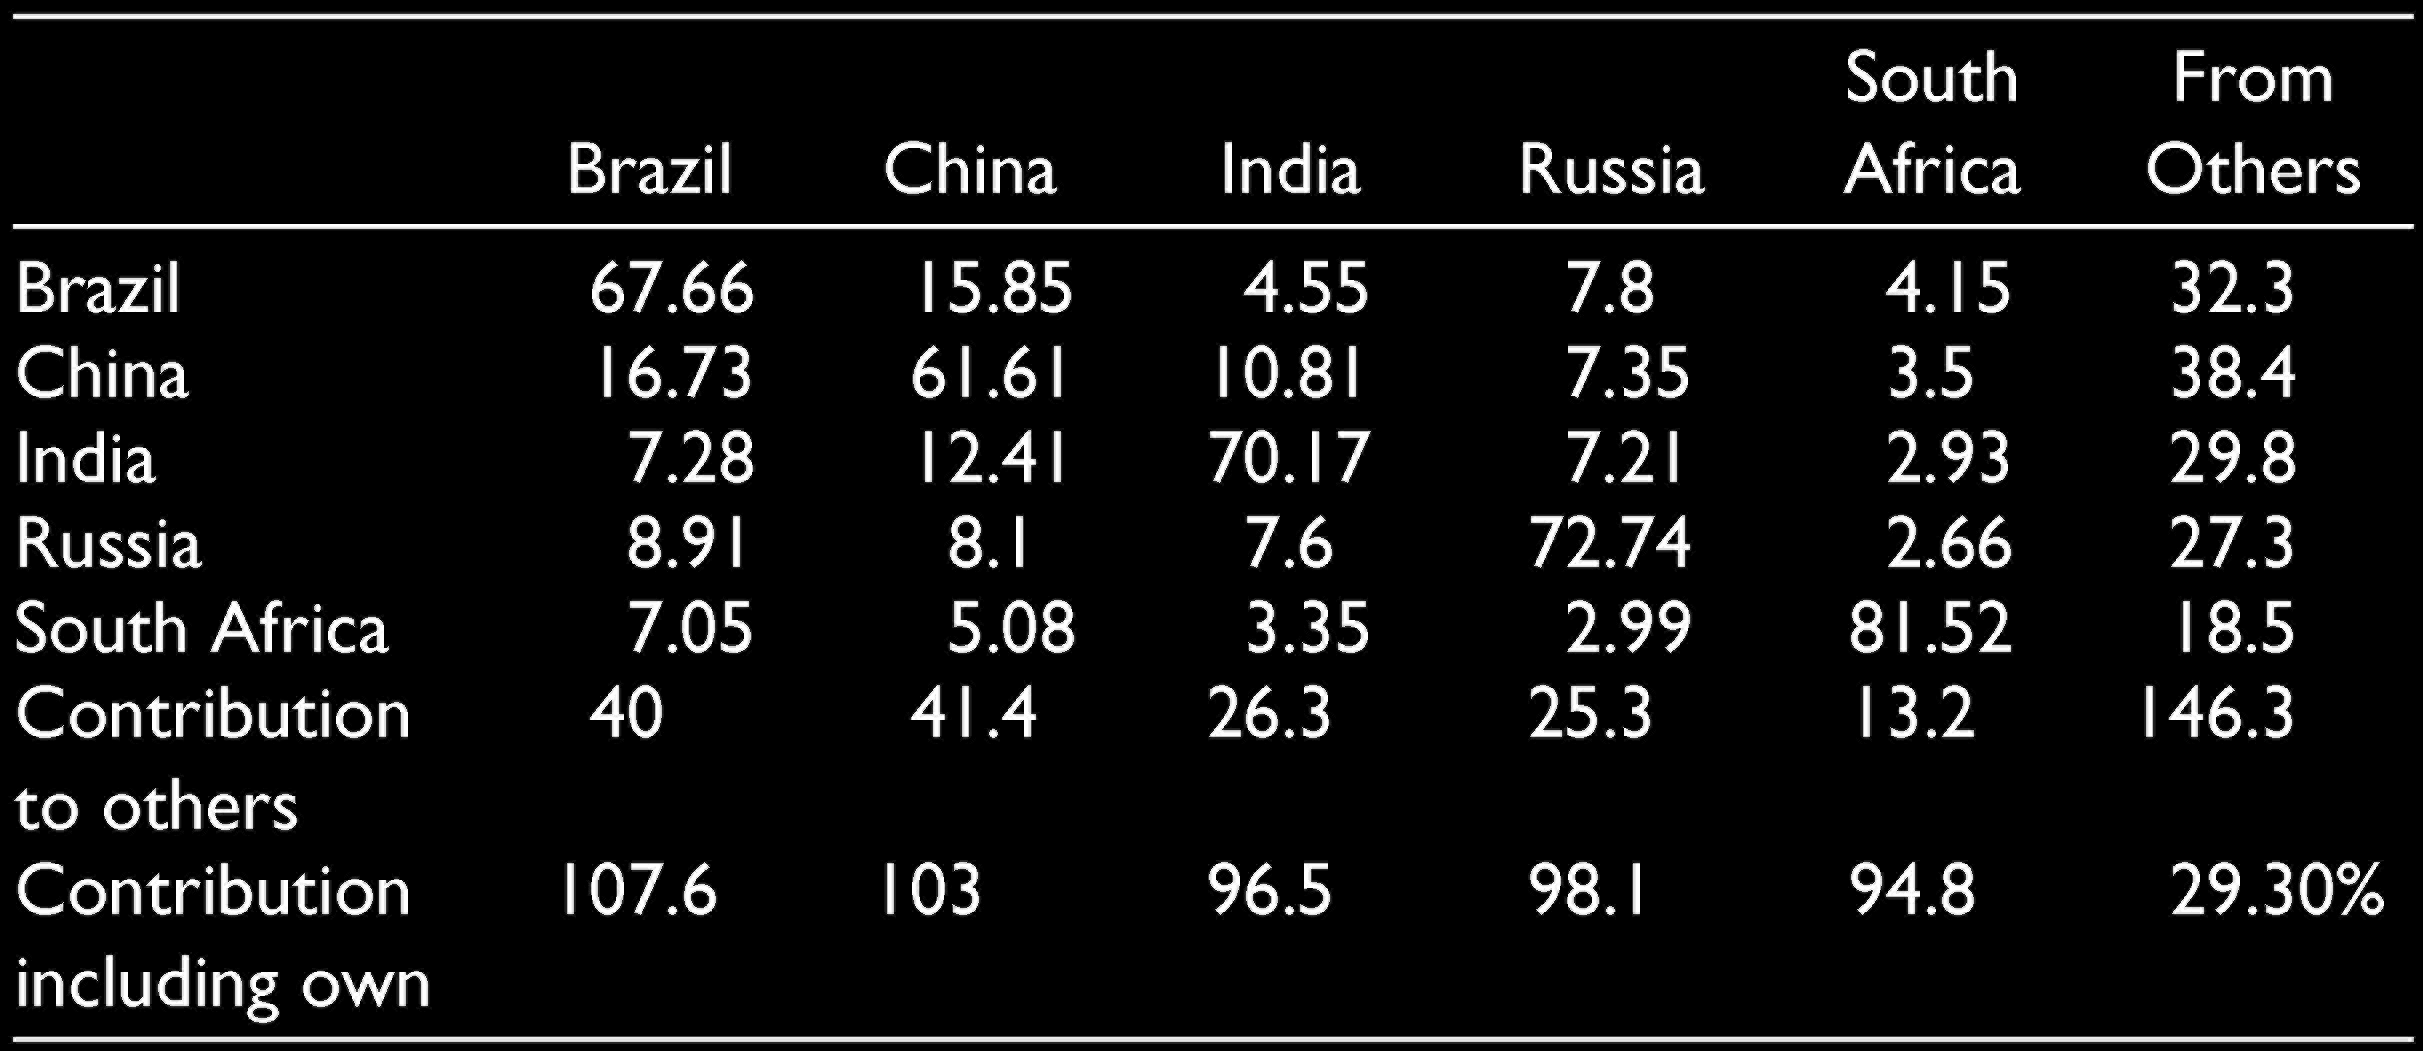
1. The last column of the matrix (‘from others’) highlights the gross directional return spillovers to the country from rest of the countries.
2. The second-last row (‘to others’) indicates the gross directional spillover from a country to rest of the countries.
The table presents the Diebold and Yilmaz (2012) spill-over summary for BRICS VIX return series.
The volatility linkages can also be explored by running the Diebold and Yilmaz methodology on conditional volatilities generated by the EGARCH (1,1) model as explained earlier. Table 5 provides results for the same, wherein the lower-right corner indicates that on average 22.1 per cent of the forecast error variance in all the sample BRICS VIX conditional volatility series comes from spillovers which confirm that the volatility linkages of these indices are high.
VIX Volatility Spillovers Across BRICS Countries
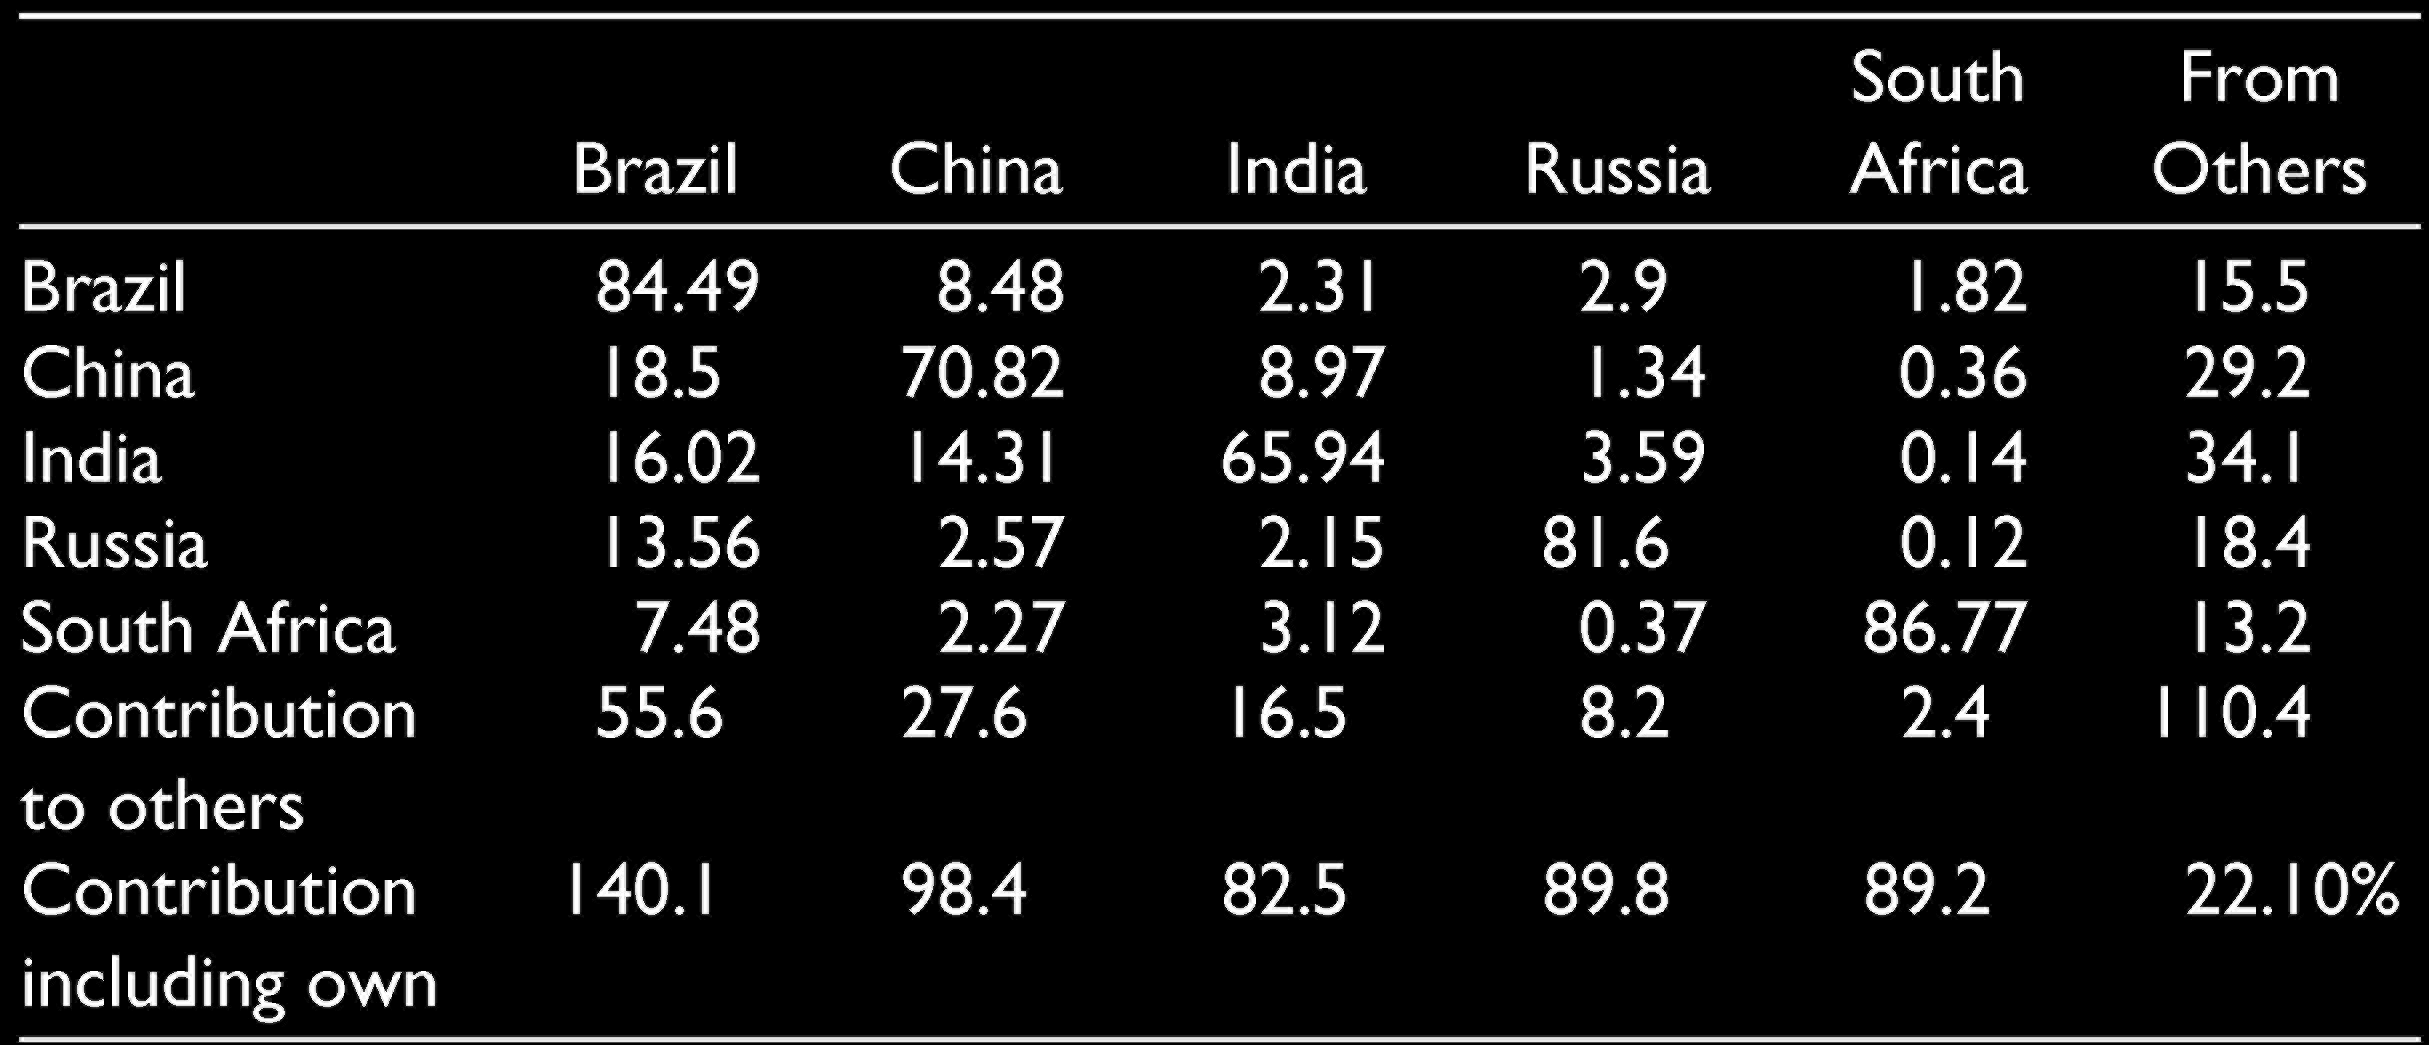
1. The last column of the matrix (‘from others’) highlights the gross directional spillovers to the country from rest of the countries.
2. The second-last row (‘to others’) indicates the gross directional spillover from a country to rest of the countries.
The table presents the Diebold and Yilmaz (2012) spill-over summary for BRICS VIX volatility series (conditional volatility generated by the EGARCH (1,1) model).
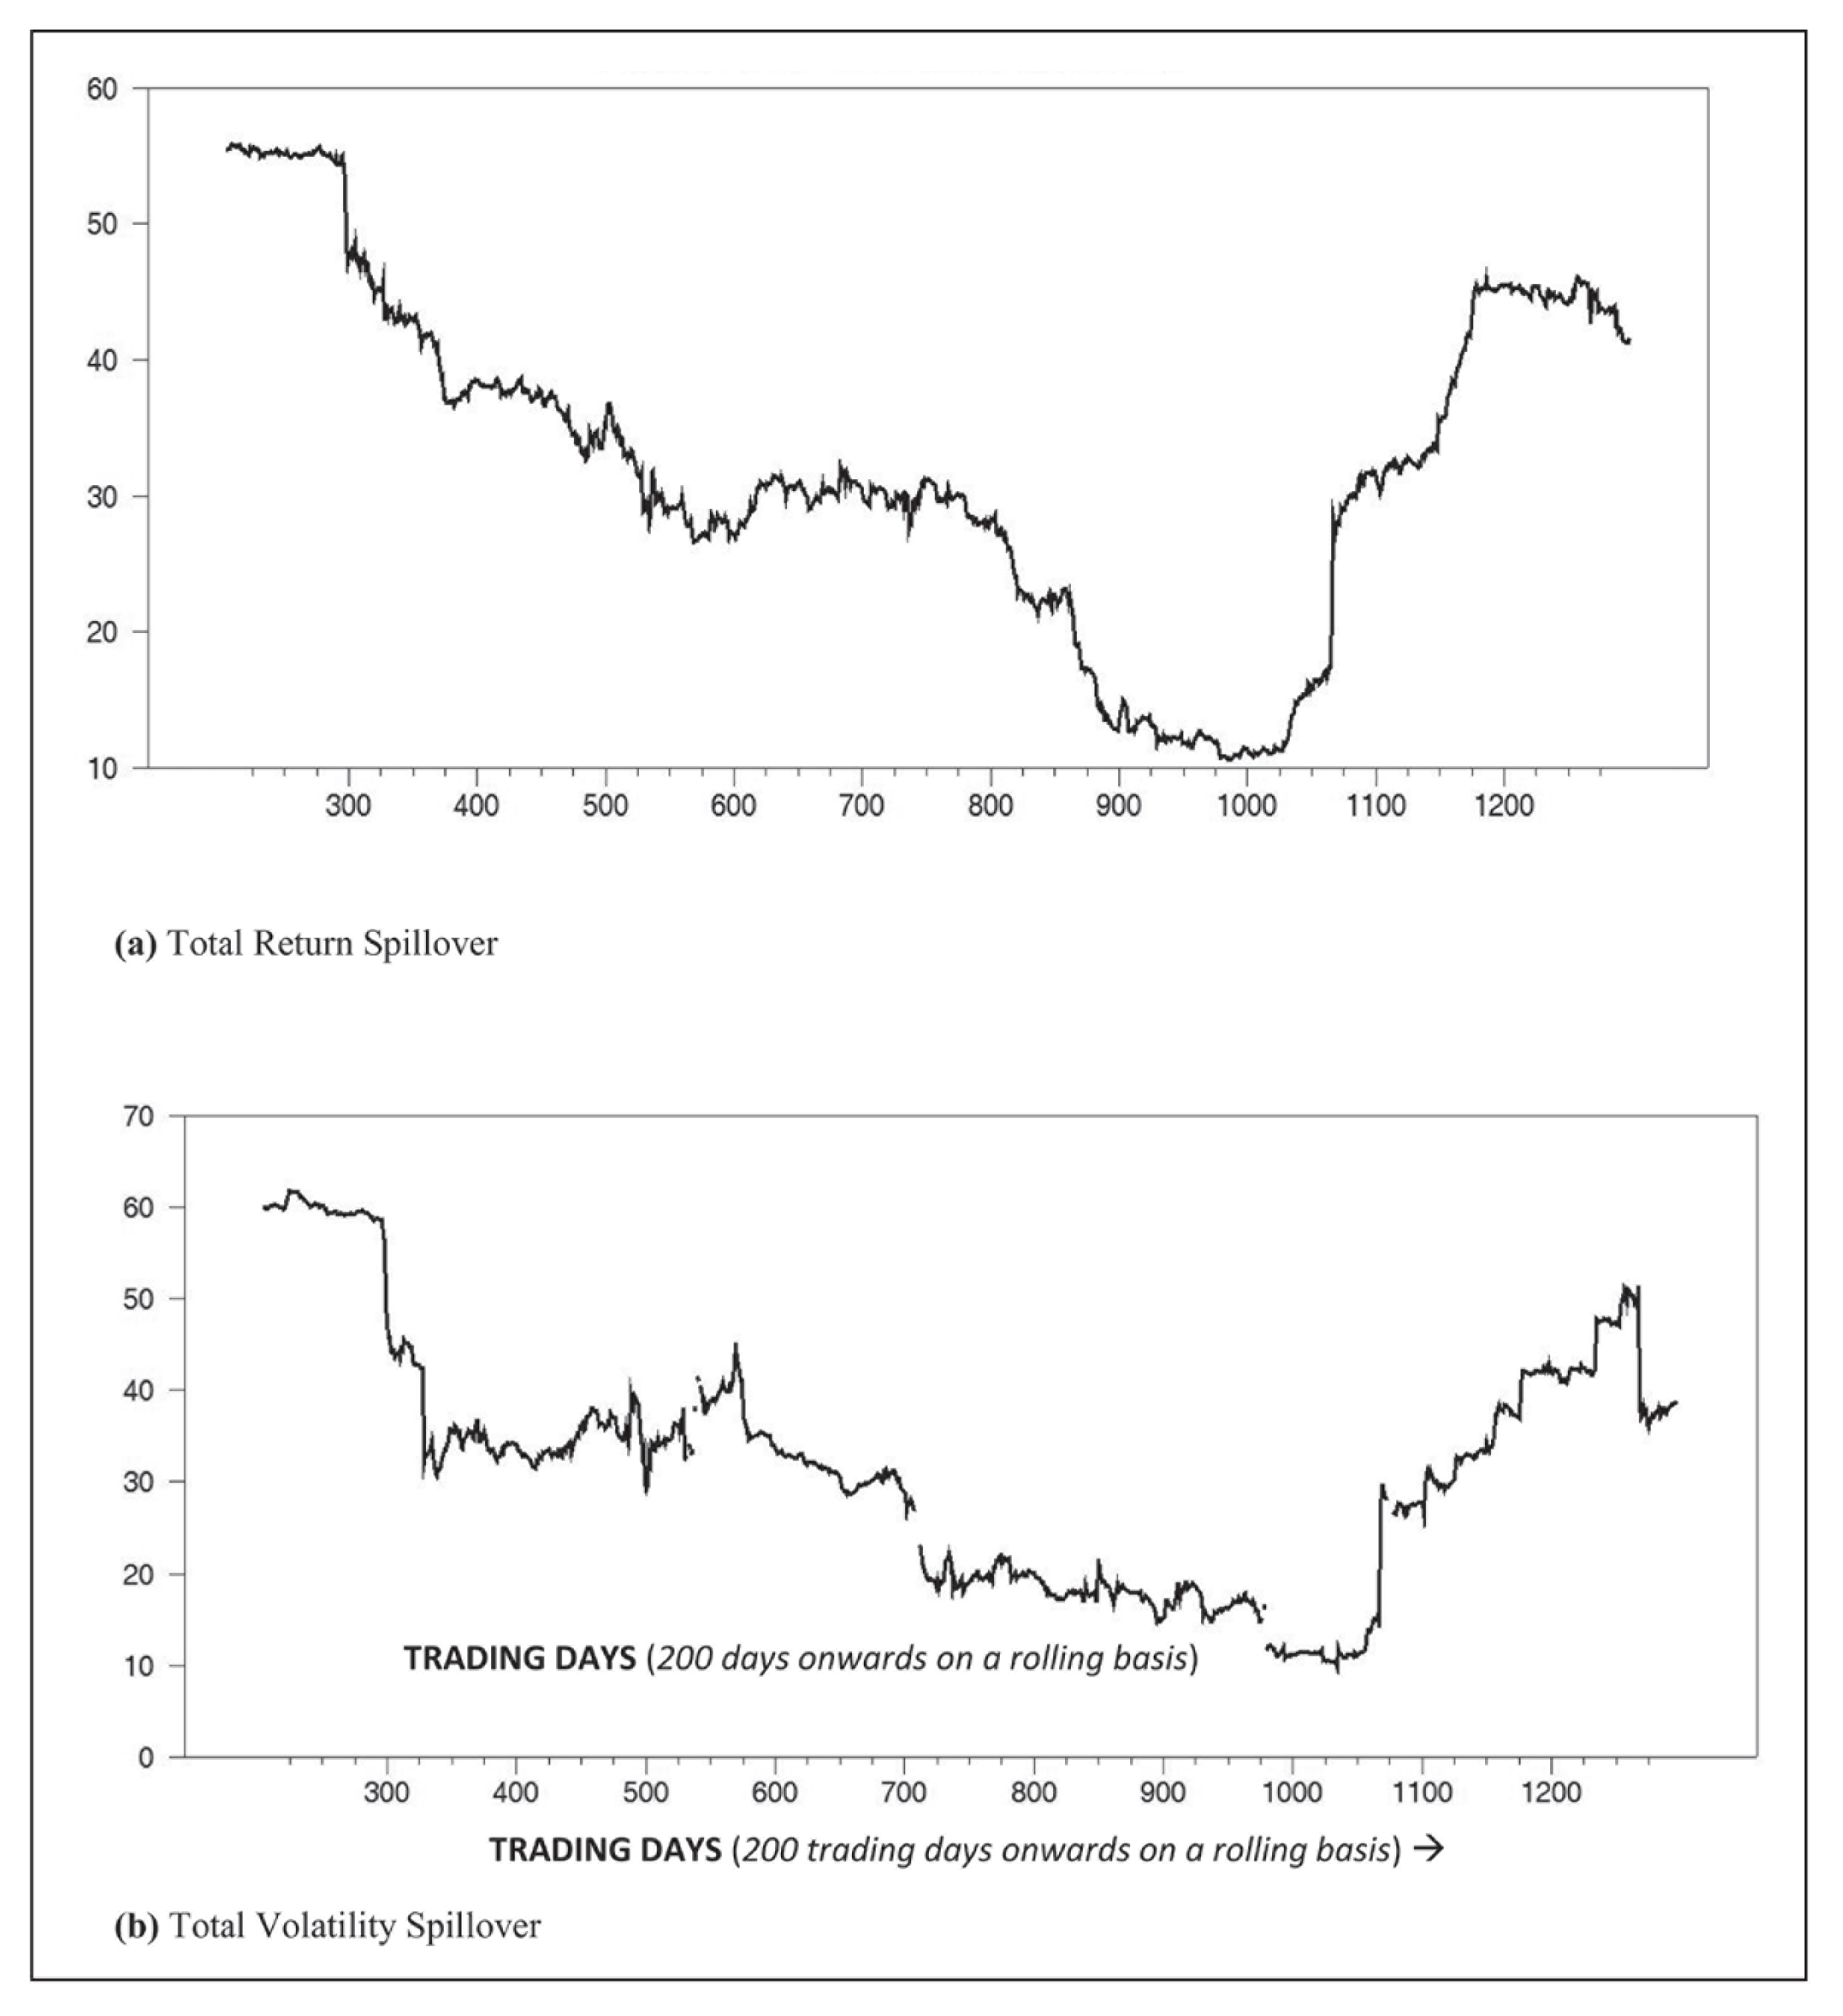
Though the full-sample spillover matrix table provides a summary of average returns spillover for the VIX returns of BRICS countries, it likely misses the intertemporal behaviour of these linkages. So we estimate returns spillovers and volatility spillovers by using the 200-day rolling samples. This helps us understand the nature and extent of spillover variation over time, which is represented in the ‘total spillover’ graphical plots of Figure 2(a) (return spillover) and Figure 2(b) (volatility spillover). The spillovers are at 55 per cent at the beginning of 2012 but decrease to 10 per cent in 2015, only to recover back to 40 per cent by 2016. The fall in interconnectedness from 2012 to 2015 could be attributed to various domestic events which led to the emergence of idiosyncratic patterns in their individual markets. Indian currency crises dues to stagnant growth and ballooning trade deficit, sanctions on Russia due to its interventions in the Crimean region of Ukraine, slowdown in Brazilian and South African GDPs post-2013 and the Chinese stock market meltdown 6 in 2015 resulted in dominance of local factors driving their respective markets, thus weakening the interconnectedness within the BRICS markets and enhancing the heterogeneity within the bloc. Post 2015 member countries have witnessed positive growth along with global recovery. 2015 also marked the implementation of Fortaleza Agreement which had provisions for currency swaps, BRICS currency-denominated payments for trade between member states and establishing of the New Development Bank for lending. So, post-2015, BRICS VIX have seen a rise in interconnectedness, with the return of relative stability in the absence of major event-based shocks, domestically.
The graphs/charts 7 showing time-varying net returns and volatility spillover to our study sample of five BRICS VIX from all the other countries as well as the dynamic net pair-wise spillover between sample countries reveal that the VIX are more interconnected with each other. This indicates high BRICS VIX linkages in return and volatility. The empirical results suggest that long-run information linkages exist on a bivariate basis among the pairs of BRICS countries’ VIX. However, on a short-run basis, many times, this equilibrium doesn’t exist due to individual markets’ idiosyncratic behaviour. Over time, these markets take short-run corrections to reach their long-run equilibrium position. This characteristic of the markets could be used for investment/trading strategies. International investors could take a short position in those markets above the long-run equilibrium and a long position on others. Thus corresponding long/short investment/trading strategies could be useful which eventually helps markets correct this dis-equilibrium from the long-run equilibrium relationship. The intertemporal conditional correlations show that linkages are high between BRICS VIX when there is relative stability in their respective markets. Because of the size of their economies, levels of economic growth and attractive risk-adjusted returns, BRICS acts as a homogenous asset class for investments and can be used for diversification. However, in the face of a crisis and major domestic events, the interconnectedness between the BRICS VIX has weakened, as shown, between 2012 and 2015. In the crisis phase, due to idiosyncratic factors, authors identify weakening levels of homogeneity. Global investors thus need to identify the individual risks and make their choice of diversification accordingly, by evaluating each BRICS member economy independently and not as a bloc.
Diebold and Yilmaz’s connectedness matrix shows that on an average 25 per cent of forecast error variance within BRICS comes from spillovers, both for returns (29.3%) and for volatilities (22.1%), thus confirming a high level of connectedness of these indices.
With the global nature of risk, stock market volatility linkages are of preeminent importance in risk hedging, investment management and financial regulation. Because it incorporates all the relevant information available, the VIX, ever since its inception, has gained traction with investors, portfolio managers and regulators alike as it is found useful in developing informed/rational expectations about the future volatility of the underlying markets. This study explores the interaction of implied VIX across different equity markets of the BRICS member countries which would be instrumental in arriving at a good volatility forecast for the market participants. US dollar-denominated daily price data of the VIX of Brazil, Russia, India, China and South Africa were taken from March 2011 to August 2016. The starting date for the VIX time-series data was March 2011 because it was the earliest available VIX data for Brazil so as to make homogenous comparisons. The Gregory Hansen test which accommodates endogenous structural breaks was applied to the VIX price data to identify the presence of any long-run equilibrium relationships between the various BRICS VIX series. The presence of the long-run equilibrium relationship between the sample series necessitated the use of the VECM model to study the short-run correction path from the equilibrium and Granger causality test to confirm the direction of causality. The information linkages were clear by the VECM and Granger causality test results wherein the tests suggest bidirectional causality for the majority of the BRICS VIX sample series. To get more insights on the correlation structure of various sample VIX, we compute bivariate conditional correlations by using the asymmetric dynamic conditional correlation GARCH model which helped graph the intertemporal linkages which were found to be strong for member countries, thereby indicating high informational linkages. Diebold and Yilmaz’s methodology indicated that for each sample country the contribution to its forecast error variance is predominantly from shocks given to its own VIX returns and volatilities. The cross-market spillovers, even though individually small, together account for one-third of the total contribution to the forecast error variance of the sample VIX of sample countries which confirms that connectedness of these indices is high.
As implied volatility is a more forward-looking measure of volatility, information about dependences can help in arriving at a better volatility forecast of the underlying equity indices. Investors can make use of the information on implied volatility estimate to design their risk-hedging strategies. The understanding of these interlinkages between the forward-looking measure of volatility can be really helpful for volatility traders looking to make arbitrage profits in these markets. Expectations of the future volatility of underlying equity indices can also exert a substantial impact on future market prices and hence the market pricing of risk, which is a crucial input for investment managers and corporates. For corporates, this may lead to the determination of the cost of equity in these individual markets. For policymakers, the interlinkages between the forward-looking measure of volatility can be a vital input to understand the efficacy of their monetary policy interventions and study the effects of contagion. Also, the policymakers would want to study the interlinkages between the forward-looking measure of volatility of their underlying equity indices to better understand asset price volatility, which is a major concern for global financial stability. Since implied VIX are viewed as a forward reflection of institutional investors’ sentiment and given their predominance in the international derivatives markets, a study of their interlinkages can help these investors realign their expectations and churn in their portfolio exposures to gain diversification benefits emanating from the same. The study of the conditional correlation of VIX of BRICS countries can further help hedge-fund managers who see BRICS as a homogenous block to earn risk-adjusted profits look for dependencies within the pairs of BRICS member countries to further enhance their alpha returns. The study has important implications for academia as it comprehensively evaluates the interlinkages between VIX for BRICS member countries which are expected to be the engines of global growth and development hereafter.
Footnotes
Acknowledgements
The infrastructural support provided by FORE School of Management, New Delhi, in completing this article is gratefully acknowledged.
Declaration of Conflicting Interests
The authors declared no potential conflicts of interest with respect to the research, authorship and/or publication of this article.
Funding
The authors received no financial support for the research, authorship and/or publication of this article.