
Abstract
This study uses the MGARCH-BEKK model and Diebold–Yilmaz (DY) volatility spillover index to examine volatility spillovers among BRICS countries’ stock markets. The study finds that the own volatility spillover is more than the cross-markets and has increased during the financial crisis. In contrast, the cross-markets volatility spillovers have decreased after the financial crisis. The total net return spillover increased during the crisis period (27.30%) and the pre-crisis period (25.50%) in comparison with the post-crisis period (6.30%) and the whole sample period (10.70%). Brazil is the highest net volatility transmitter among the BRICS countries’ stock markets, and China is the highest net volatility receiver. We learned from the volatility network connectedness that China is highly connected with India regarding volatility. Foreign institutional investors may use this study’s result to find diversification opportunities across the BRICS stock markets.
1. Introduction
Based on restrictions on foreign investors’ participation, markets all over the globe are divided into two categories: integrated markets and segmented markets. The integrated markets permit foreign investors’ involvement, and segmented markets are closed for foreign investors’ participation. Integrated markets are divided into two types: markets with overall economic integration and markets where integration is limited to participation in the capital market (Bekaert & Harvey, 2002). Capital market integration can be measured through spillovers. The volatility spillovers between stock markets of different regions are called dynamic volatility spillovers, which happen when one market starts trading; the other markets are closed based on different geographical areas. Under this circumstance, the information transfers from one market to another on the next trading day (Mulyadi, 2009).
The existing literature on volatility spillovers has used multivariate GARCH models like MGARCH-BEKK, DCC, CCC, and MGARCH VECH. Diebold and Yilmaz (2009, 2012, 2014) have developed a volatility spillover index that captures the magnitude of volatility spillovers in a VAR framework and calculates the net volatility in the form of a net transmitter or net receiver. In addition to the static volatility spillover, this index calculates the dynamic volatility spillover in a rolling window. Mensi et al. (2018) depict that the lacuna of static volatility spillover considers the linkages among stock markets as constant over time. It ignores the jumps in stock returns as well as the financial crisis. The rolling window volatility spillover index overcomes this issue by applying dynamic volatility spillover models.
In addition to the return spillover effect, the studies find that volatility spillovers among stock markets persist (King & Wadhwani, 1990; Kocaarslan et al., 2017; Panda et al., 2020; Panda & Thiripalraju, 2018; Patra & Panda, 2021). The dynamic volatility spillovers across markets have been studied by several researchers (such as Ahmad, 2017, Ahmad et al., 2018a; Ahmad et al., 2013, 2014; Diebold & Yilmaz, 2009, 2012; Gabauer & Gupta, 2018; Mensi et al., 2018; Yilmaz, 2010). This study employs the VAR-BEKK framework to estimate the spillovers in return and volatility for BRICS countries’ stock markets. In addition to the VAR-BEKK model, the study uses the volatility spillover index developed by Diebold and Yilmaz (2009, 2012, 2014) to examine the volatility receivers and transmitters countries.
The study finds that Brazil market is a net volatility transmitter, whereas India and China are the highest net volatility receiver. The volatility spillover connectedness persists between Brazil–Russia and South Africa–Russia in all the periods under study. The total net volatility spillover in the pre-crisis period was 25.5%, which increased to 27.30% during the crisis period and decreased to 6.30% in the post-crisis period.
The primary motivation to study the spillovers among the BRICS countries’ stock markets is as follows. First, BRICS countries represent 22% of the world’s listed companies, with India being the largest (13%) and China being the third largest. Second, these countries are undervalued based on the buffet indicator (market cap to GDP ratio) except South Africa. Third, the compound annual growth rate (CAGR) for 15 years of these countries’ stock markets ranges from 8% to 14%, and the price-to-earnings ratio of the BRICS countries’ stock indices ranges from 7% to 26%. Fourth, these countries contribute 16% to the world market capitalization, 23% to world GDP, and 42% to the world population. Further, this study is also relevant because several researchers have found that the USA impacts the stock markets of BRICS countries. Fifth, the structure of BRICS countries’ stock markets is different. For example, the Brazil stock market is more volatile; at the same time, the Indian stock market is more stable (Kasman, 2009). Sixth, many studies have used MGARCH models to capture market volatility spillovers. We have used the Diebold and Yilmaz volatility spillovers index and the MGARCH-BEKK model.
The rest of the sections of this study are organized in the following manner. The section highlights the review of the literature; the third section presents the methodology and data sources used in the study; empirical results are explained in the fourth section four; and conclusion is in the fifth section.
2. Related Literature
The literature on stock market spillovers suggests mixed results in different business cycles. For instance, higher stock market integration results in higher volatility spillovers among the markets (Kim & Lee, 2017). Further, during the financial crisis, the volatility transmission from one market to another is more significant, as all markets are prone to risk (King & Wadhwani, 1990; Yarovaya et al., 2016). Further, the volatility spillovers are pronounced during the recent crisis (Kang et al., 2017). Additionally, the transmission effect between the emerging and developed markets is more during the Eurozone crisis (Ahmad et al., 2018b). Again, own past volatility is more than the cross-market volatility spillovers among the stock markets (Hammoudeh et al., 2009). In recent times, the volatility spillovers among developed and emerging markets have increased. For instance, the magnitude of correlations among emerging markets, including BRICS and developed markets, has increased over the past two decades. Still, emerging markets can be considered a separate investment class to benefit from diversification (Bekaert & Harvey, 2017).
Several studies are available on the transmission effect (in terms of return or volatility) among international stock markets. However, such studies are less for the BRICS countries’ stock markets. The findings of the existing studies on BRICS countries’ stock markets state that diversification among these countries will give economic value to the investors (Bhar & Nikolova, 2007). Additionally, to benefit from diversification, investors may focus on the movement in the indices and specific growth areas in the BRICS economy (Bhar & Nikolova, 2009). Further, contagion effects are more from one country to another during the crisis, and BRICS countries are more disposed to the contagion effect (Kenourgios et al., 2011; Patra & Panda, 2021). Among the BRICS countries’ stock markets, South Africa is more affected by China, India, and Russia. Further, South Africa has fewer spillovers on China, India, and Russia. There are more cross-market spillovers between Brazil and South Africa (Bonga-Bonga, 2018). Investors look into long-term strategies based on the volatility index. For instance, the volatility index and BRICS countries have long-run relationships, and the degree of connectedness varies across business cycles. The volatility trades will benefit by designing risk-hedging strategies while trading in the BRICS countries’ stock markets (Sharma et al., 2019). Studies find the presence of asymmetric volatility spillovers across markets. For example, the asymmetric and volatility spillover is more in the case of more volatile markets (Newaz & Park, 2019). Further, asymmetric volatility spillovers exist between Indian and developed countries’ stock markets (Nandy & Chattopadhyay, 2019).
The USA impacts more on the BRICS countries’ stock markets. For instance, the conditional correlation between BRICS and developed countries is high (Mensi et al., 2016; Zhang et al., 2013). During the financial crisis, the BRICS, the USA, Germany, Japan, and the MSCI emerging markets index carry mean and volatility spillovers (Gilenko & Fedorova, 2014). The spillover effect occurs between developed and emerging countries’ stock markets. For instance, volatility spillover exists between the USA and BRICS countries’ stock markets. China and India have a bidirectional spillover effect, and more return spillover exists from China to the USA (Bhuyan et al., 2016). Further, downside risk reduces, and diversification benefit increases the portfolio investors investing in a mix of BRICS and developed stock markets (Mensi et al., 2017).
3. Data and Methodology
3.1 Data
To measure the volatility spillover among BRICS countries’ stock markets, we considered the daily open, high, low, and close (OHLC) prices of the respective BRICS countries’ stock indices. Those are IBOVESPA Index for Brazil, MICEX Index for Russia, NIFTY index for India, Shanghai Composite Index for China, and FTSE/JSE all shares index for South Africa. The overall period of study is from September 22, 1999, to December 28, 2019, with a total of 4,194 daily observations. The study period is divided into pre (September 1999 to November 2007), during (December 2007 to June 2009), and post (July 2009 to December 2019) subprime global financial crisis period. 1
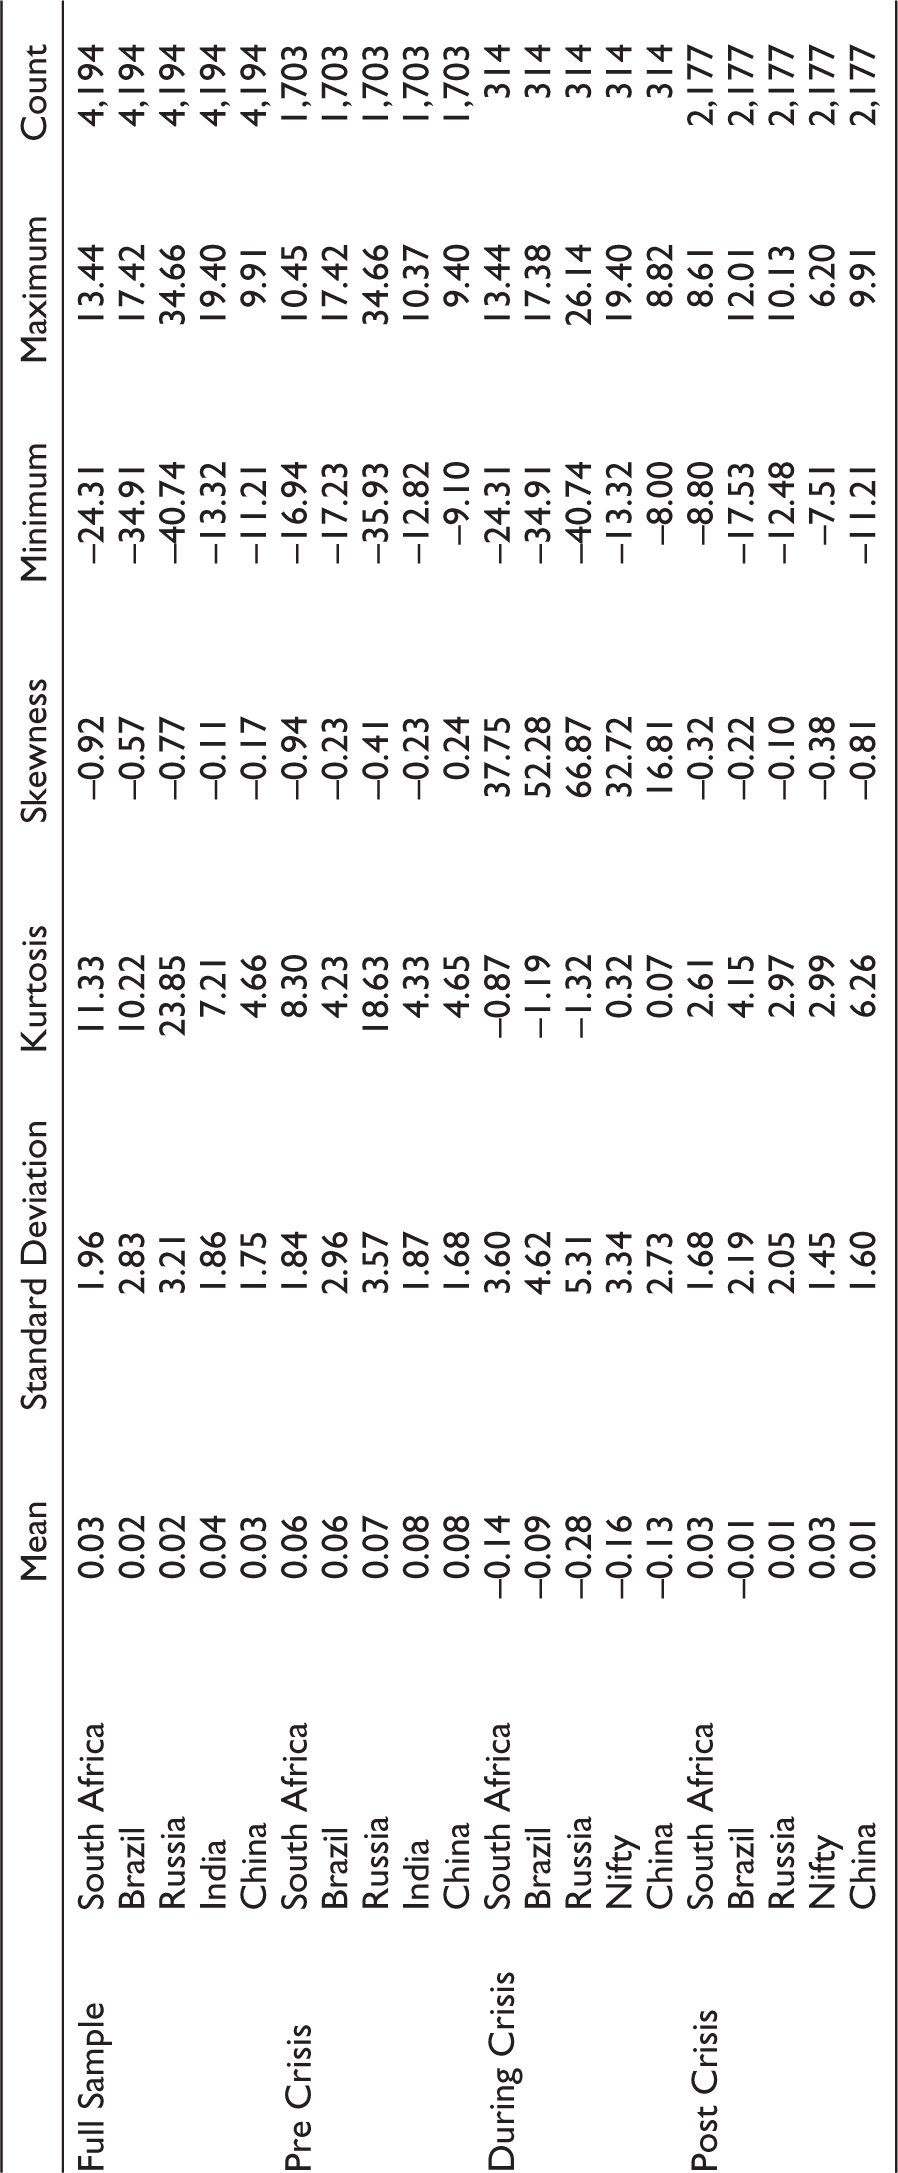
The data are extracted from Bloomberg. The augmented Dickey–Fuller (ADF) test confirms stationary of the return series. The descriptive statistics of the variables under consideration are presented in Table 1. It is inferred that based on mean return in the whole sample period, these markets provide 2% to 4%; in the pre-crisis period, it is 6% to 8%; during the crisis period, it is –9% to –28%; and in the post-crisis period, it is –1% to 3%. Based on standard deviation, the Russian market is more volatile, and South Africa is less volatile in all the periods under consideration. Further, this study uses OHLC data to estimate range-based return volatility using Garman and Klass (1980) and considers that as an input for Diebold and Yilmaz volatility spillover index.
Descriptive Statistics.
3.2 Methodology
The current study observes the volatility spillover using VAR(1) BEKK(1), volatility spillover index using Diebold and Yilmaz (2009, 2012, 2014) spillover index and network volatility connectedness.
3.2.1 VAR-BEKK Model
BEKK-GARCH model developed by Baba et al. (1990) is one of the best MGARCH models because it does not impose any restrictions on the conditional framework among the variables. BEKK model helps us estimate many parameters and reduces the system’s dimensionality, which is stable. To run the BEKK model, we first run vector auto-regressive (VAR) model for the mean equation. The lag order of VAR is considered as one using Schwarz information criteria (SIC). The VAR model used in this study is given in Equation 1.
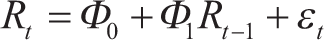
Where Rt is a return of the respective countries’ stock index and is considered the column vector with length N. The Rt–1 is the lag one of the returns of respective countries’ stock markets, and εt is the residual of the VAR equation for all the nations under consideration and is a column vector. The εt is assumed to have a multivariate normal distribution [εt ~ N (0, Ht ) where Ht denotes the conditional variance–covariance matrix of the error term εt].
In this study, we have used BEKK (1,1) to model the conditional volatility Ht, and it is given in Equation 2.

Where A, B, and C are the order of N × N square matrices. C is taken to be a lower triangular matrix, which makes Ht positive definite. The impact of past shocks and volatility of an asset i have been captured through matrices A and B diagonal elements. On the other side, the off-diagonal elements of a matrix capture cross-volatility and shocks of all other assets, say j, on the volatility of asset i. In this study, we have performed both Ljung-Box Q statistics and McLeod-Li statistics to test the serial correlation in the residuals and ensure the absence of the same.
3.2.2 Volatility Spillover Index
We apply Diebold and Yilmaz (2012) model for capturing the directional spillover, pairwise spillover, total spillover, net spillover, and net pairwise spillover indices in which investors can easily find out which is the net receiver or net transmitter of volatility. To get the volatility series of each variable under consideration, we first calculate the range-based return volatility using Garman and Klass (1980) formula as given in Equation (3).

Where H, L, C, and O are high, low, close, and open prices.
The volatility spillover index of Diebold and Yilmaz examines the fraction of P-step ahead forecast variance in one asset due to past shocks of other assets in a VAR framework.
Mathematically, with the assumptions, a covariance stationary N-variable VAR of order p, that is,

Where Σ is the variance–covariance matrix of the residuals εt, σjj is the standard deviation of the error term for the jth asset, and ei is the selection vector, with one as the ith element and zeros otherwise. By construction, the sum of the Sij(P) matrix’s rows need not be equal to 1, that is, 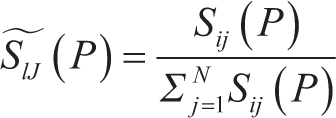
Where
Using the volatility contribution from the variance decomposition, the total volatility spillover index, which measures the contribution of volatility shocks across all variables to the total forecast error variance, is estimated as:

Next, the directional volatility spillovers to market i from all other markets j are defined as
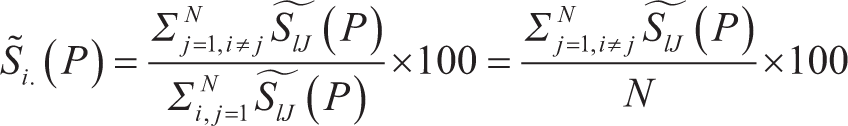
and the volatility spillovers from market i to all other markets j are estimated as:

The difference between 
A market is said to be a net transmitter if the net volatility spillover is positive and a net receiver if the same is negative.
4. Empirical Results
This section presents the result of VAR (1) BEKK (1,1) and Diebold and Yilmaz (2012) volatility spillover index for BRICS countries’ stock markets.
4.1 Volatility Spillover Among Stock Markets for BRICS Countries
Employing the VAR (1)–GARCH-BEKK (1,1) model, the study examines the magnitude of volatility spillover from one country to another country’s stock markets.
The full sample volatility spillover result based on the VAR-BEKK model is presented in Panel A of Table 2. As per the return spillover, we find that Brazil and India return spillover exists with South Africa. India return spillover comes from South Africa, Brazil, and its lag; China return spillover exists from Russia, South Africa, Brazil, India, and its lag. South Africa and Brazil return spillovers exist to China. Overall, we find that own return spillover exists in Indian markets, and cross-market return spillover exists in all the markets; out of which India and China markets are more dependent on the rest of the BRICS countries’ stock markets with respect to return spillover.
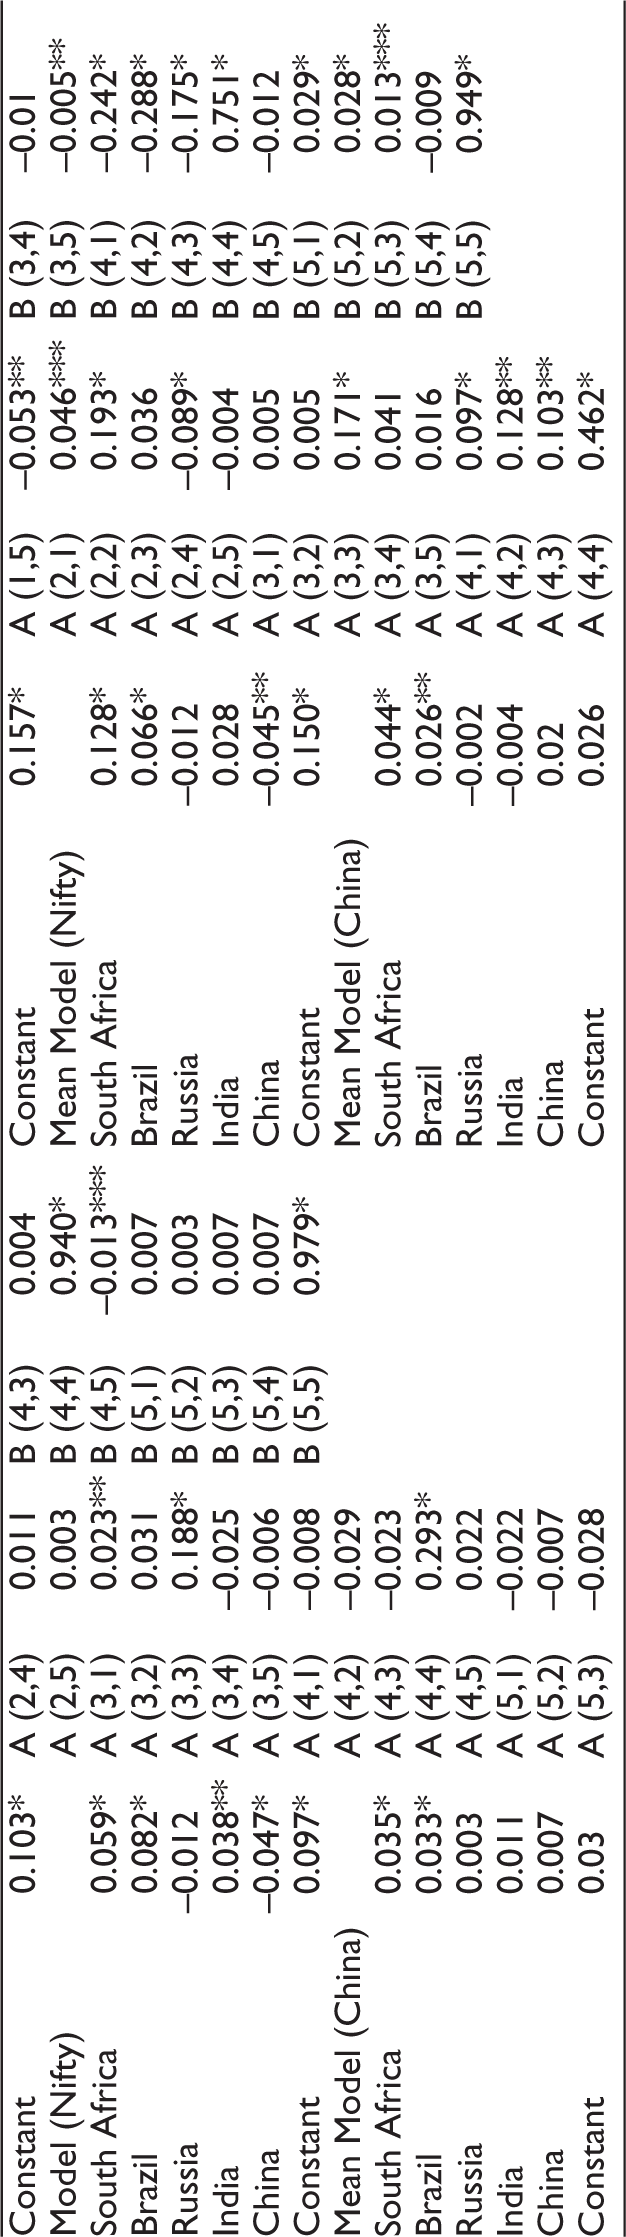
VAR (1) GARCH-BEKK (1,1) Model for BRICS Stock Indices.
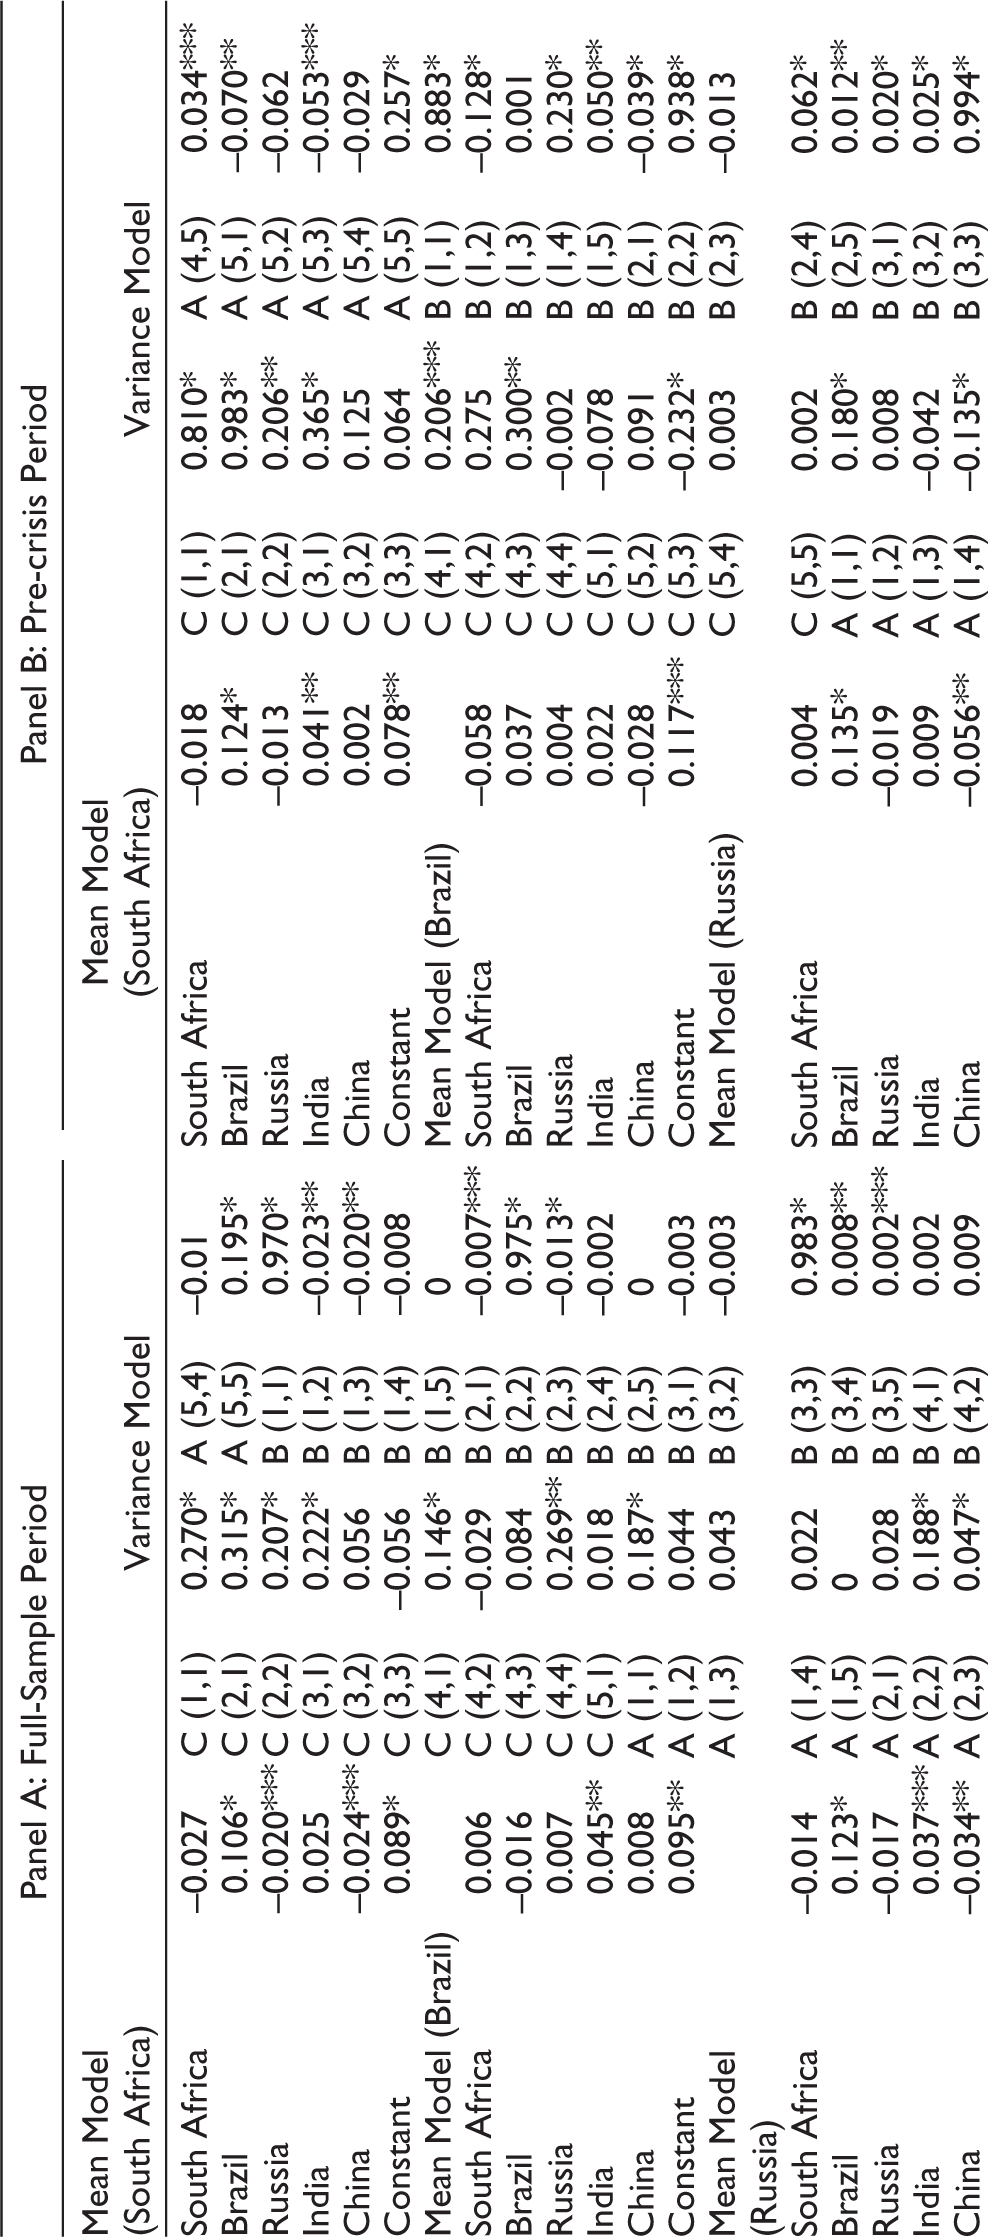
The cross-market volatility spillovers among the countries under consideration exist from Brazil to Russia (0.04%) and Russia to South Africa (0.02%) in the short run. The long-term volatility spillover as measured by GARCH terms exists from South Africa to Brazil (–0.02%); South Africa to Russia (–0.02%); Brazil to South Africa (–0.007%); Brazil to INDEXCEF (–0.01%); Russia to India (0.008%); Russia to China (0.002%). The result of volatility spillover during the whole sample period indicates that own lagged shock plays a crucial role in the volatility spillover of BRICS countries’ stock markets compared to cross-market volatility spillovers.
This study presents the volatility spillover results during the pre-crisis period for BRICS countries’ stock markets in Panel B of Table 2. The return spillover to South Africa exists from Brazil (0.12%) and India (0.04%). The return spillover exists from Brazil (0.14%) and China (–0.05%) to Russia; from South Africa (0.13%), Brazil (0.07%) and China (-0.05%) to India; and from South Africa (0.04%) and Brazil (0.03%) to China. Among all the return spillover pairs, we notice that South Africa is impacting India, and Brazil has a less impact on China. There is no return spillover from any of the BRICS countries’ stock markets to Brazil’s stock market.
The cross-market volatility spillover exists from South Africa to India –0.14%); South Africa to China (–0.05%); Brazil to South Africa (0.05%); Brazil to Russia (0.03%); Brazil to India (–0.09%); India to South Africa (0.09%), Brazil (0.123%) and Russia (0.10%) to China (0.03%) in the short run. The existence of cross-market long-term volatility spillover is present in most cases. It occurs from South Africa to Brazil (–0.13%), India (0.23%), and China (0.05%); from Brazil to South Africa (–0.04%), India (0.06%), and China (0.01%); from Russia to South Africa (0.02%); from Russia to Brazil (0.02%) and China (–0.01%); from India to South Africa (–0.24%), Brazil (–0.28%), and Russia (–0.17%); from China to South Africa (0.02%), Brazil (0.02%), and Russia (0.01%).
The volatility spillover has increased in the long and short runs in both the cross-market and the own volatility spillover during the pre-crisis period compared to the volatility spillover in the whole sample period.
The volatility spillover result among BRICS countries’ stock markets during the crisis has been presented in Panel A of Table 3. From the result of return spillover during this period, we notice that the Indian market return spillover comes from all the markets under consideration, along with its lag return spillover. The return spillover from South Africa is more (0.08%), and from Russia, it is less (–0.03%). The return spillover to South Africa is there from its lag (–0.04%), Brazil (0.12%), and India (0.03%). The same spillover exists from India (0.04%) and China (–0.04%) to Brazil; from Brazil (0.09%), India (0.03%), and China (–0.06%) to Russia; and from Brazil (0.02%) and India (0.01%) to China. The volatility spillover has increased during the crisis period compared to the whole sample and pre-crisis period. Unlike the pre-crisis period, the volatility spillover has increased in the long run compared to the short run.
VAR (1) GARCH-BEKK (1,1) Model for BRICS Stock Indices.
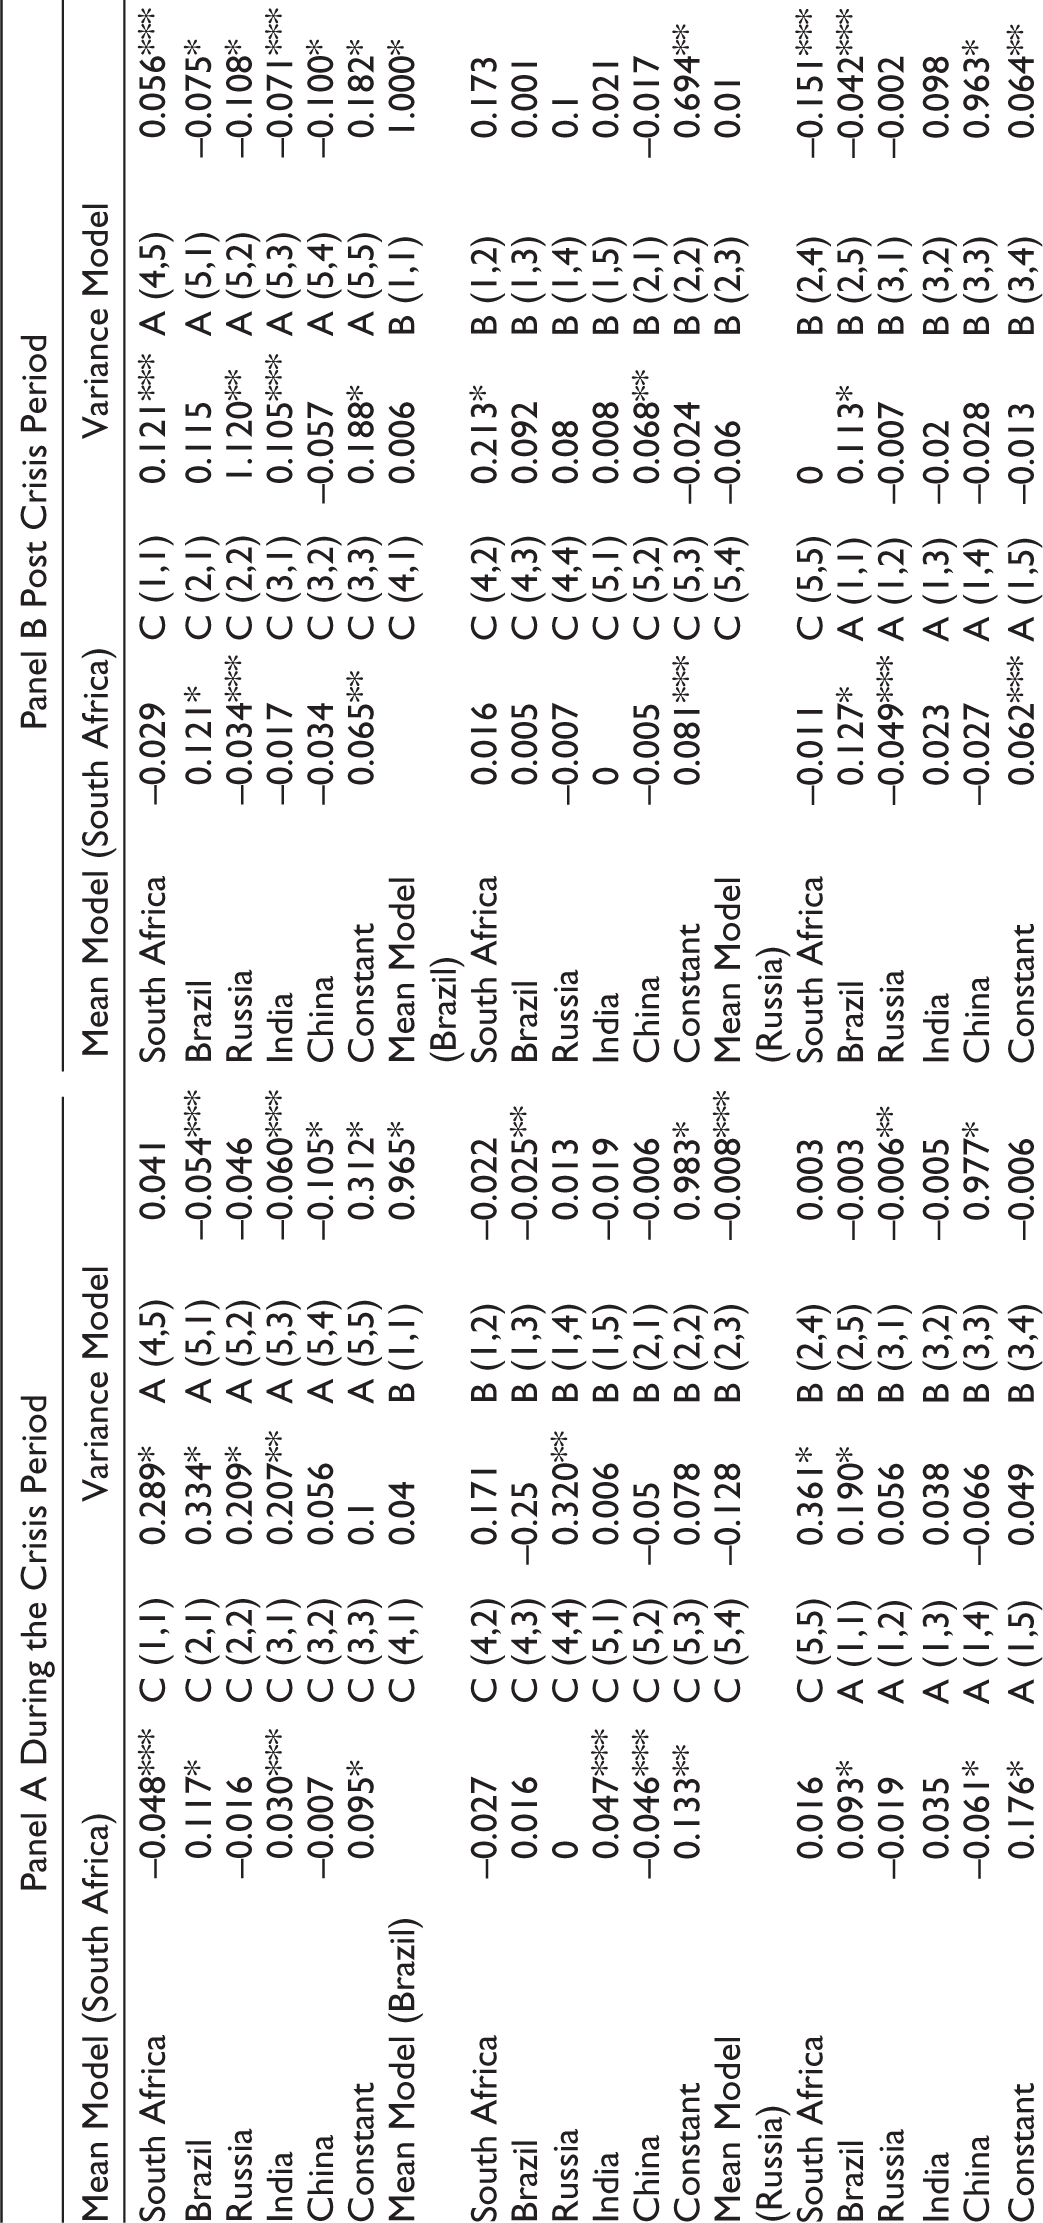

The cross-market short-term volatility spillover exists from Russia to South Africa (0.03%); Russia to Brazil (0.04%); China to South Africa (–0.05%), Russia (–0.06%), and India (–0.10%) in the short run as measured by ARCH coefficients. A similar case has been observed in the long run volatility spillovers coefficients such as from South Africa to Russia (–0.03%); from Brazil to Russia (–0.01%); from Russia to South Africa (–0.01%); and from South Africa (0.04%), Russia (0.03%), and India (0.09%) to China. From the result of the volatility spillovers during the crisis period, we find that own volatility spillovers are more, and the cross-market volatility spillovers are less.
Panel B of Table 3 presents the spillover effect among BRICS countries’ stock markets during the post-crisis period. The result shows that the return spillover effect exists from Brazil (0.12%) and Russia (–0.03%) to South Africa; from Brazil (0.12%) and Russia (–0.05%) to Russia; from Brazil (0.13%) and China (–0.06%) to India and from Brazil (0.08%) to China. In the short run, cross-market volatility spillover exists from Brazil to India (0.05%), from Russia to India (0.08%), from India to China (0.05%), and from China to South Africa (–0.07%), Brazil (–0.10%), Russia (–0.07%), and India (–0.10%). The long-run volatility spillover effect is present from Brazil to India (–0.15%) and China (–0.04%); from Russia to India (0.06%) and China (0.03%); from India to China (–0.03%); and from China to South Africa (0.01%), Russia (0.01%), and India (0.02%).
Out of all the periods under study for examining the volatility spillovers among BRICS countries’ stock markets, the study finds that their own volatility spillover is more than that of cross-market volatility spillover. The cross-market volatility spillover and the own shock volatility spillover have reduced after the financial crisis period.
4.2 Directional Spillover Results
Further, this study employs Diebold and Yilmaz (2012) methodology to measure the volatility spillover. This spillover index measures the net receiver, net transmitter, and total net spillover of the assets under a portfolio.
The directional volatility spillover index result for the full sample has been presented in Panel A of Table 4. The study observes that the own directional volatility spillover is more in all the countries. Other than its own volatility spillover, there are cross-market volatility spillovers between the countries, ranging from 0.3% to 6.97%. The net volatility spillover for each of the BRICS countries’ stock markets provides that all markets are net volatility transmitters except China, which is the net receiver of volatility from others. Among all the net transmitters of volatility, the highest net contributor is South Africa (1.8%), followed by Brazil (1.6%), India (0.8%), and Russia (0.2%). However, China is the net receiver of volatility (–4.3%). The total spillover index is 10.70%, indicating that the level of volatility transmission (the forecast error variance) among BRICS countries’ stock markets is 10.7%. That means the level of volatility transmission among BRICS countries’ stock markets is low in the whole sample period. From an investor’s point of view, China cannot be included in a portfolio of cross-country investments. However, Brazil, Russia, India, and South Africa are good portfolios that provide economic value during diversification.
Volatility Spillover Index for BRICS Countries.


The degree of interdependence among five countries’ stock markets in a time-varying framework in the whole sample period depicts that the total dynamic volatility spillover index is between 8% and 35% during the pre-crisis period. However, during the crisis period, the overall volatility spillover increased substantially from 18% to 58%. The same has decreased post crisis and ranges between 5% and 25%. This indicates that the time-varying volatility spillover is more during the crisis period and has reduced in the post-crisis period.
The directional volatility spillover index result for the pre-crisis period has been presented in Panel B of Table 4. Other than own volatility spillover, cross-market volatility spillovers exist between the states, ranging from 0.61% to 13.41%. The net volatility spillover for each of the BRICS countries’ stock markets provides that Russia, India, and South Africa are the net transmitter of volatility. In contrast, Brazil and China are the net receivers of volatility from others. Among all the net transmitters of volatility, the highest net volatility contributor is Russia (7%), followed by India (2.6%) and South Africa(0.4%). China appears to be the net receiver of volatility (–7.2%) compared to Brazil (–2.8%). The total spillover index value is 25.50%, indicating that the level of volatility transmission (the forecast error variance) among BRICS countries’ stock markets is 25.50%.
The degree of interdependence among five countries’ stock markets in a time-varying framework for the pre-crisis period indicates that the total dynamic volatility spillover index falls between 8% and 58% during this period. At the end of the pre-crisis period, the volatility spillover increases. This indicates an upcoming higher-risk period for which the global financial crisis appeared.
The network of volatility spillover among BRICS countries has been presented in Figure 1 (Panels A, B, C, and D), representing network spillover for the Full sample, pre-crisis, crisis, and post-crisis periods. The node indicates the size of the country’s market capitalization. We find China contributes around 11%, India 3%, and Brazil, Russia, and South Africa 1% to the world market capitalization. From the full sample network spillovers, we find that the extent of the spillovers from Russia to Brazil is more supported by India to Brazil, Brazil to South Africa, and vice versa, South Africa to Russia and vice versa. The extent of network volatility connectedness between South Africa and India, China and India, Russia and India, and China and South Africa is significantly less. China and Russia do not have any volatility connectedness in the whole sample period and the post-crisis period. During the pre-crisis period, the volatility connectedness is more from China to India and follows the same extent as the spillovers during the crisis and post-crisis periods.
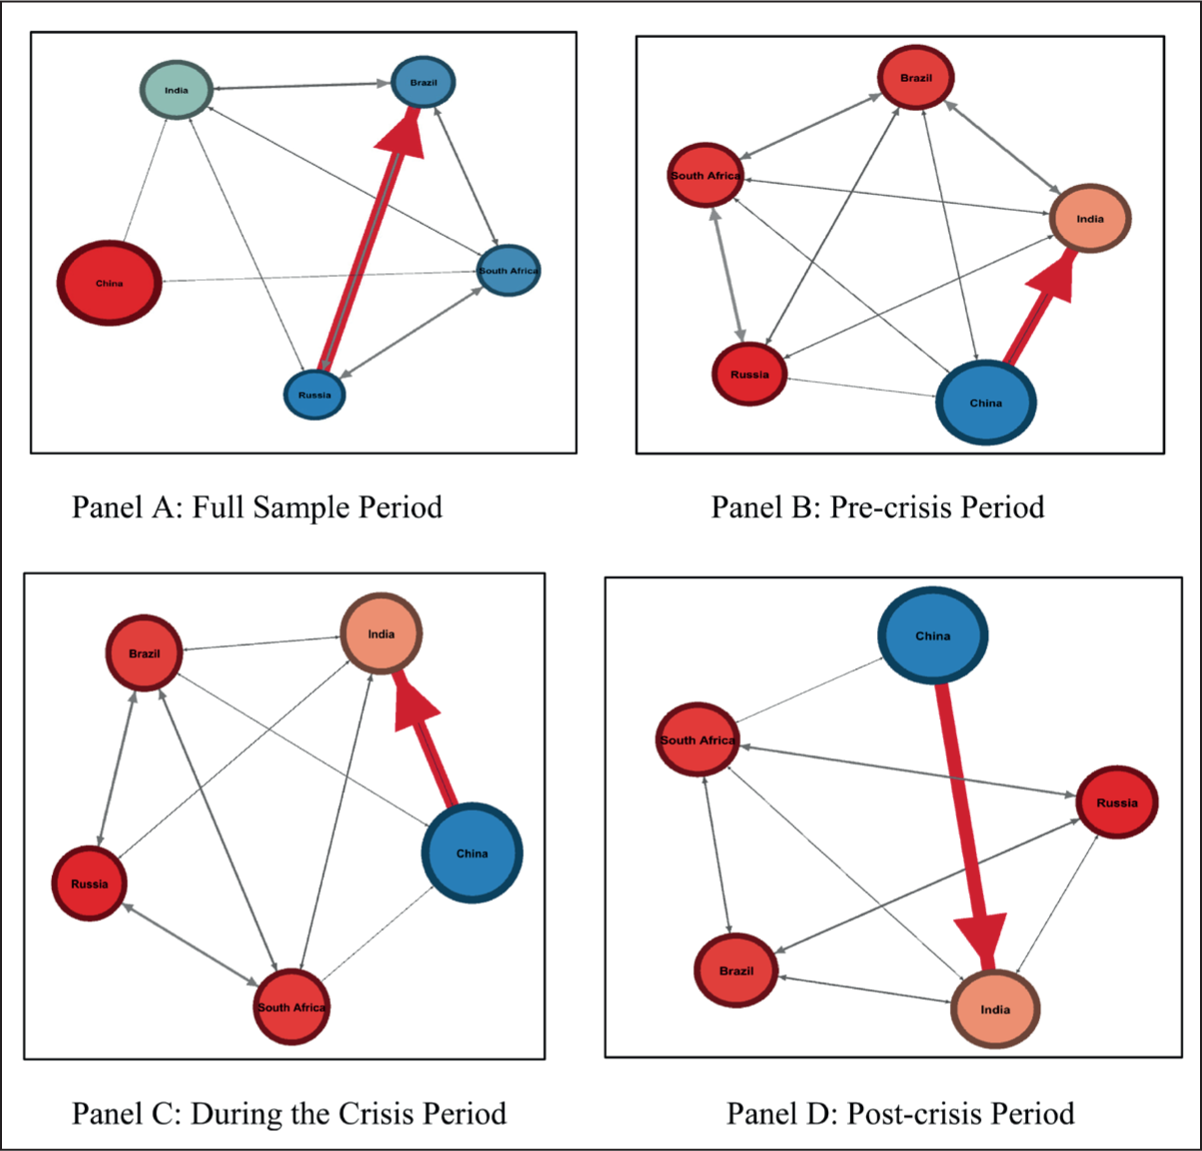
There is a similar extent of volatility connectedness between Brazil and South Africa, Russia and South Africa, India and Brazil, and Russia and Brazil during the crisis period. A negligible extent of the volatility connectedness is reported among India and Russia, India and South Africa, and China and South Africa during the pre-crisis period, as indicated in Panel B of Figure 1. The extent of volatility spillovers during the crisis period is the same in Brazil and Russia, Brazil and South Africa, Russia and South Africa, and India and South Africa. The volatility connectedness is less in the case of Brazil and India, Brazil and China, India and Russia, and South Africa and China during the crisis period, as reported in Panel C of Figure 1. However, in the case of the post-crisis period, the extent of volatility connectedness has reduced among the countries and has the same degree of spillovers between South Africa and Russia and Brazil and Russia. There is less volatility connectedness between South Africa and China, South Africa and Brazil, India and Brazil, India and Russia, and India and South Africa, as reported in Panel D of Figure 1.
From the volatility network connectedness, we learned that China is highly connected with India regarding volatility spillovers in all the subsample periods. The persistence of volatility spillovers connectedness between Brazil and Russia and South Africa and Russia is present in all the periods. Other pairs of countries have negligible spillover connectedness.
The net volatility spillover in 200 days rolling sample for the pre-crisis period has shown that Brazil and China are the net receivers of volatility, and the rest of the other BRICS countries are the net transmitters of volatility. The total net volatility spillovers during this period ranged from –30% to 120% in all the markets under consideration.
The directional volatility spillover index results for the crisis period have been presented in Panel C of Table 4. The study observes that the directional volatility spillover is more in the case of each of the countries. Other than the own volatility spillover, cross-market volatility spillovers exist between the countries, ranging from 15% to 47%. The net volatility spillover for each of the BRICS countries’ stock markets during the crisis indicates that India, China, and South Africa are the net receivers of volatility. In contrast, Brazil and Russia are the net transmitters of volatility during the crisis. Among all the net receivers of volatility, the highest net receivers are India (–27%), followed by South Africa (–20.8%) and China (–11.9%). Russia appears to be the net transmitter of volatility (53.2%) compared to Brazil (6.6%). The total volatility spillover during the crisis period is 27.30%, higher than the full sample and pre-crisis period. This indicates that the volatility spillover has increased during the crisis period, which was also expected.
The directional volatility spillover index result for the post-crisis period is presented in Panel D of Table 4. The study observes that the own directional volatility spillover is more in the case of each of the countries. Other than the own volatility spillover, cross-market volatility spillovers exist between the countries, ranging from 0.06 to 9.09%. The net volatility spillover for each of the BRICS countries’ stock markets provides that all markets are net volatility transmitters except China, which is the net receiver of volatility from others. Among all the net transmitters of volatility, the highest net volatility contributor is Brazil (3%), followed by Russia (1.2%), India (0.6%), and South Africa (0.3%). However, China is the net receiver of volatility (–5.2%). The total spillover index value is 6.30%, indicating that the level of volatility transmission (the forecast error variance) among BRICS countries’ stock markets is 6.30%. That means the level of volatility transmission among BRICS countries’ stock markets is low in the post-crisis period. From an investor’s point of view, China cannot be included in a portfolio of cross-country investments. However, Brazil, Russia, India, and South Africa are profitable portfolios providing diversification’s economic value. The net volatility spillovers in 200-day rolling sample depict the magnitudes of the net volatility spillovers changed during the post-crisis period. The total net volatility spillovers have ranged from –30% to 30% in all markets under consideration.
5. Conclusion
Considering daily data, this study examines the volatility spillover effect among BRICS countries’ stock markets. Further, the study estimates the volatility spillover index developed by Diebold and Yilmaz (2012). The total period of the study has been divided into pre-, during, and post-crisis periods.
The volatility spillover impact among BRICS countries’ stock markets using the VAR-BEKK model reveals that the spillover effect was more significant during the crisis. It started decreasing in the post-crisis period. However, the volatility spillover based on the BEKK model is static. It is difficult to conclude the magnitude of the volatility spillover effect, as the coefficients of BEKK models are very large. Diebold and Yilmaz (2009, 2012) have developed a volatility spillover index based on VAR to overcome this issue. This study finds that the total spillover in the whole sample period is 10.70%. The total spillover in the pre-crisis period is 25.5%, which is more than double in the whole sample period. The same has again increased to 27.30% during the crisis period and has come down to 6.30% post crisis. This indicates that the subprime financial crisis has affected the BRICS countries’ stock markets. The total spillover among themselves has increased in the pre- as well as crisis periods. However, all the markets started recovering in the post-crisis period, resulting in the total volatility spillover coming down to 6.30%. From the volatility network connectedness, we learned that China is highly connected to India regarding volatility spillovers in all the subsample periods. The persistence of volatility spillover connectedness between Brazil and Russia and South Africa and Russia is present in all the periods. Other pairs of countries have less volatility spillover connectedness. The result of this study may help the foreign portfolio investors to diversify their investment among the BRICS countries’ stock markets considering the state of the economy. Diversification among these countries will help create a risk-adjusted portfolio to maximize return and minimize risk. Our results align with Bhar and Nikolova (2007) and Bhuyan et al. (2016).
Footnotes
Acknowledgements
The authors are obliged to Dr Jinesh Panchali, professor at the National Institute of Securities Markets (NISM), for proofreading and commenting on the article to improve it. The authors are also grateful to the participants and discussants of the World Finance and Banking Symposium held at FMS, Delhi University, December 19–21, 2019, for their valuable feedback.
Declaration of Conflicting Interests
The authors declared no potential conflicts of interest with respect to the research, authorship, and/or publication of this article.
Funding
The authors received no financial support for the research, authorship, and/or publication of this article.