
Abstract
Virtual Reality (VR) is a technology that creates fully immersive and virtual experiences and have been used to create virtual supermarkets and explore consumer behaviour on such alternate reality. The current study uses a VR scenario to analyse the effects of mental imagery, product involvement and presence on customer’s emotions and on the customers purchase intention, during a virtual shopping experience. The proposed model was tested with 108 participants in the laundry detergent category on a VR scenario. Findings reveal that on a virtual setting, mental imagery has the most significant impact on emotions, whereas presence has a strong influence on the purchase decision. Yet product involvement has any effect only on emotions. Moreover, the obsession for laundry products highly decreased the effect of product involvement on purchase intention.
Introduction
For retailers, the new digital age has become a great challenge (Grewal et al., 2017). In such a dynamic setting, consumers have become more complex and more demanding. Thus, retailing has shifted from a more offline and single channel-based communication to modern in-store practices where an omnichannel approach is the key (Souidena & Ladharia, 2018). The omnichannel model involves the use of many diverse channels and, additionally, the increase of shopper touchpoints (Shankar et al., 2011). Such multichannel environment is enhanced by some new technology developments such as advanced mobile devices and interfaces (Shankar et al., 2011) and virtual and augmented reality tools (Grewal et al., 2017). Slowly, retailers are trying to establish a multichannel relationship with their customers by converging offline and online channels using these new devices, particularly because digital channels have been found to affect consumer behaviour (Amegbe et al., 2017; Sama, 2019).
However, although marketing experts see the evolution of VR with high hopes for companies, there are still no clear guidelines on how VR should be integrated on the companies’ strategies (Boyd & Koles, 2019). In VR, the consumers are exposed to a computer-generated environment that fully immerses them on a virtual experience (Loureiro et al., 2019; Loureiro, Guerreiro, & Ali, 2020). When exposed to a virtual environment (VE), the consumer experiences a sense of immersion or presence within that environment, thus being isolated from the real world. Besides immersion, VR also provides a very dynamic environment (Boyd & Koles, 2019), which is important to create consumer involvement with the brands.
The use of these technological innovations allows customers to feel less time pressure while increasing consumer satisfaction and pleasure during the experience and engagement with the companies (Grewal et al., 2017). Although this new experience approach brings a big opportunity for brands, research on the use of VR has been scarce in the last 20 years (Loureiro et al., 2019). Particularly absent from research is the role of mental imagery (the perceptual image stored in long-term memory) and its effects on involvement, tele-presence perception, purchase intentions and emotions at a virtual supermarket setting.
Virtual Reality in Retail
In 1995, Milgram, Takemura, Utsumi and Kishino suggested a model known as the reality–virtuality continnum (RVC) that was latter used to explain the different degrees of exposure that users/consumers may have with their surrounding environment. The physical world is at one spectrum of the RVC, while virtual reality (VR) is on the opposite end of such continuum. VR in the RVC is a fully synthetic universe that may or may not resemble the natural world and in which the person is completely immersed (Milgram et al., 1995) while in other less immersive degrees of VEs such as augmented reality, the viewer sees the real world with overlaid objects, by wearing translucent smart glasses or a smartphone (Bimber & Raskar, 2005). VR implies the creation of a simulated reality where users are absorbed in the interactive reality as though they were part of it. There are different VR interfaces, ranging from movable gadgets such as VR headsets to non-movable ones such as specifically built rooms with several wide displays. Over the years, many styles of head mounted displays (HMDs) have been produced, and today, most of them acknowledge the location of the consumer by providing gyroscopes and accelerometers that track the user location in the scene. In VR environments, participants have a fully immersive experience with a binaural dynamic sound that allows them to interact with 3D objects using their body movement, just as they would in a regular shopping environment. Although VR is still focused on controlling two senses (visual and auditive), interactive VR often allows the users to have unique physical or quasi-physical interplay with the objects by using haptic systems such as monitoring sensor data gloves (Mizell et al., 2002).
In retailing, in particular, VR is a promising alternative to e-commerce (Evans & Wurster, 1999; Krasonikolakis et al., 2014, 2018). Usually, e-commerce limitations are linked to the lack of feeling of the real environment and not being able to touch the products. Although VR is not yet able to imitate sensations such as touch, it immerses the consumers in the shopping environment. Indeed, recent studies explored the influence of such immersion on adoption (Peukert et al., 2019) and the differences between consumer perceptions of physical stores versus VR stores (Pizzi et al., 2019). The authors have showed that consumers reported higher levels of hedonism and utilitarianism and that satisfaction with the store is less influenced by utilitarianism when consumers perceived the store to have a large assortment size. Other studies have also explored the role of crowding on a VR shopping experience (Van Kerrebroeck et al., 2017). Results have showed that attitudes, satisfaction and loyalty increase in crowed virtual spaces (Loureiro & Ribeiro, 2014). However, despite the extant literature on VR in retail, studies are still scarce and particularly absent on the role that memory plays on retail outcomes.
Hypotheses Development
According to Miller et al. (2000), mental imagery is an activation of the perceptual knowledge stored in the long-term memory and related to personal experiences. Therefore, mental imagery can act as a stimulus for consumers depending on their previous knowledge. Indeed, in an imagined situation, mental imagery can evoke consumer organism responses such as attention, positive feelings or behavioural responses (i.e., purchase intention) (Ha et al., 2019; Lv et al., 2020; Xu et al., 2020). Mental imagery can be evoked in different ways. First through a mental elaboration (Bogicevic et al., 2019) that relates the number of images formed on someone’s mind and the memory activation when exposed to such image (Yoo & Kim, 2014). Such memory activation is known to be dependent on vividness: the intensity of the stimulus (Miller et al., 2000), which relates to the clarity, vibrance and distinctiveness of the stored images. Effective tone, which reflects the emotional meaning of the recall memory and provokes the individual’s emotional reaction, is also known to evoke mental imagery (Loureiro, Bilro, & Japutra, 2020; Yoo & Kim, 2014). Finally, imagery can be evoked by different types of sensory stimulus: tactile, visual, auditory, olfactory or gustatory—the modality dimension of mental imagery (Bilro et al., 2019; Miller et al., 2000). Given the role of mental imagery as a stimulus that may lead to consumer behavioural intentions (Yoo & Kim, 2014), we suggest the following:
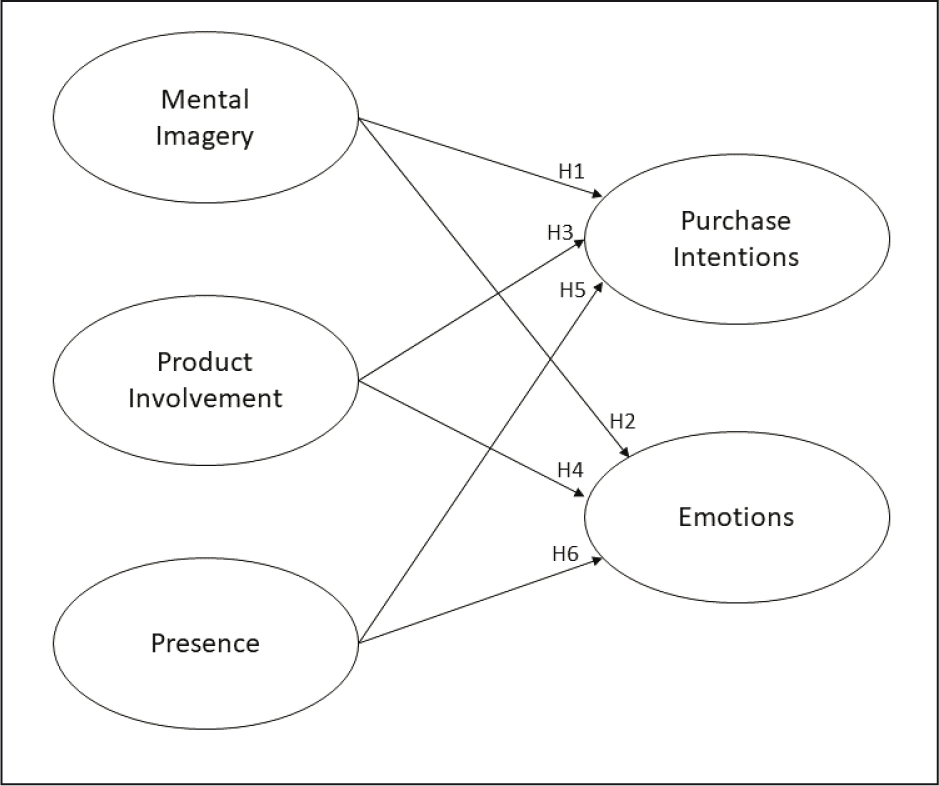
H1: Mental imagery is positively related to purchase intention. H2: Mental imagery is positively related to emotions.
Product involvement has been studied as the perceived significance of the object by an individual based on intrinsic desires, beliefs, and interests (Zaichkowsky, 1985). Therefore, each customer has a different involvement with the different products and brands (Calvo-Porral et al., 2018). Indeed, product involvement reflects the amount of interest, attention, excitement and motivation of the consumer towards a product (Calvo-Porral et al., 2018). Involvement depends on personal factors, choices and customer perceived value (Peng et al., 2019) and is one of the most important factors in consumers’ behaviours. Indeed, involvement is known to influence the way customers engage with the brands (Calvo-Porral et al., 2018). Therefore, we posit the following:
H3: Product involvement is positively associated to purchase intention. H4: Product involvement is positively associated to emotions.
Telepresence means the illusion that you’re there. This perception serves as a mediator between the stimulus and the positive or negative appraisal of the VE (Hyun & O’Keefe, 2012; Loureiro et al., 2019; Marsh, 2003; Shi et al., 2016). The feeling of telepresence in the VR environment creates a highly immersive store atmosphere (Boyd & Koles, 2019). In VR, consumers experience the feeling of escaping and telepresence (Van Kerrebroeck et al., 2017) and such telepresence perception is known to influence their behaviour. Hence, we posit the following:
H5: Presence is positively associated to purchase intention. H6: Presence is positively associated to emotions. Figure 1 shows the proposed conceptual model.
Methodology
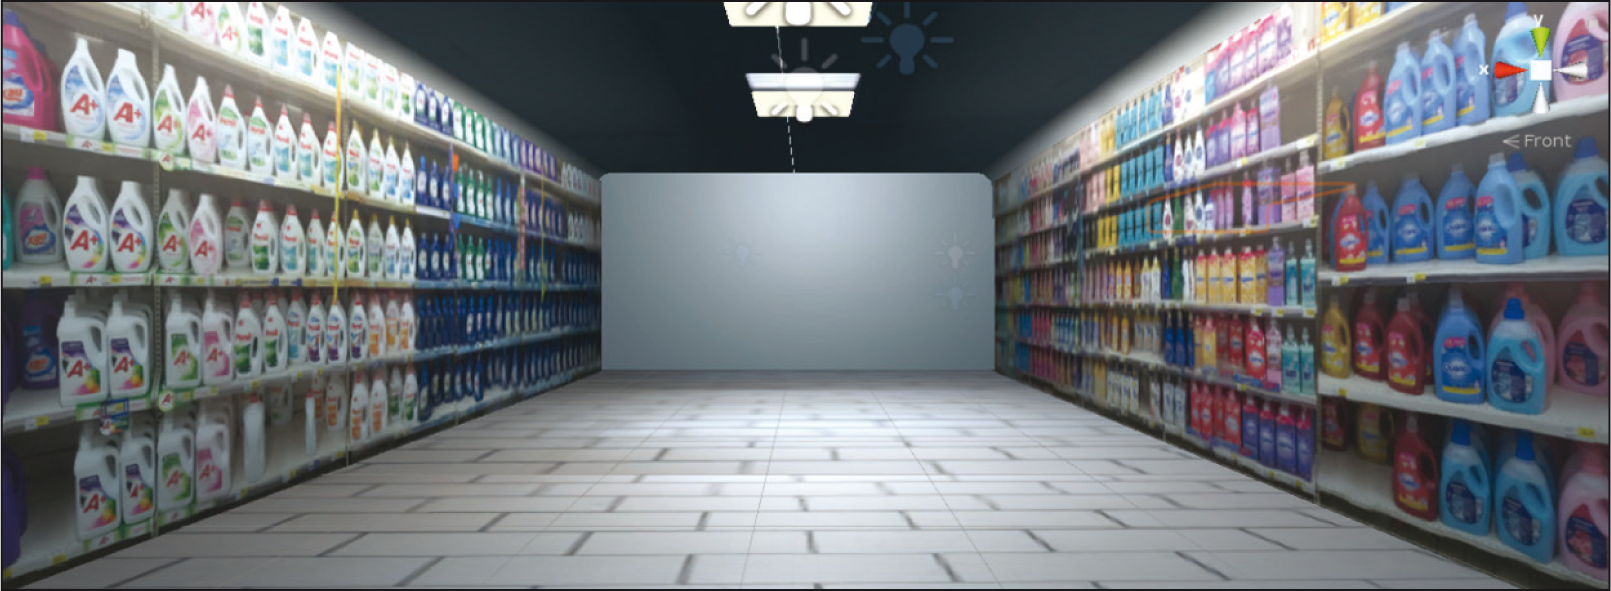
A quasi-experimental study using a between-subjects design was implemented to test the proposed model. The quasi-experimental manipulation was done using a virtual grocery store, using VR. A quantitative approach was followed using a questionnaire to get data to test the model. The virtual scenario displayed the product assortment, prices and promotions to a group of regular shoppers that agreed to participate in the study. Participants were requested to wear an Oculus Rift headset, which includes an appropriate oculus to emerge in a virtual world and two motion sensors that detect the person movement in the VE. The VR environment was developed using Unity software and was based on an existing shelf layout and real brands in order to resemble the physical experience (see Figure 2). The virtual model was created using Unity software (Version 2017.2.0f3). The VE simulated a store with which participants could interact. Wall textures were done using simulated shelfs and printed ads of the brand. Additionally, several 3D shelfs were also used so that participants could explore the elements while inside the store. The environment was set to have good lighting conditions.
Two types of products of the laundry care category were chosen for the experiment, specifically, Hard Duty Detergent (HDD) and Fabric Finishers (FFI). In order to ensure maximum accuracy, the VE was based on an existing shelf layout and used real brands (Pizzi et al., 2019).
First, participants were asked if they had ever been to a supermarket. If the answer was affirmative, they were informed about the apparatus of the VR equipment and that they could move around the scenario of the virtual supermarket until they decided which products they would buy, without any pre-determined time limit. In the end, participants were asked to fill in the final questionnaire. The first two questions of the survey were related to the individual’s experience in a physical store (Pizzi et al., 2019). The remaining questions measured involvement—using a 7-point Likert scale (adapted from Deng et al., 2019)—the emotions felt during the experience—measured using a 7-point Likert scale (adapted from Deng et al., 2019)—and the level of ‘presence’ in the virtual world—adapted from Van Kerrebroeck et al. (2017). Mental imagery’s dimensions—quantity, vividness, valence and modality—were measured using Miller et al. (2000) scale. Finally, purchase intention was measured using a scale adapted from Spears and Singh (2014).
Participants were also asked about their gender, age and education in order to describe the sample profile.
A total of 108 subjects participated in the experiment, of which 73 are female (67.6%, mean age = 31.96) and 35 are male (32.4%, mean age = 31.83). The average age of the total respondents is 31.92 (range: 18–69 years old). In terms of education level, 35.2% of the participants have bachelor’s degree and 34.3% have master’s degree/doctored/PhD, while 21.3% have elementary/secondary education and only 9.3% have vocational training.
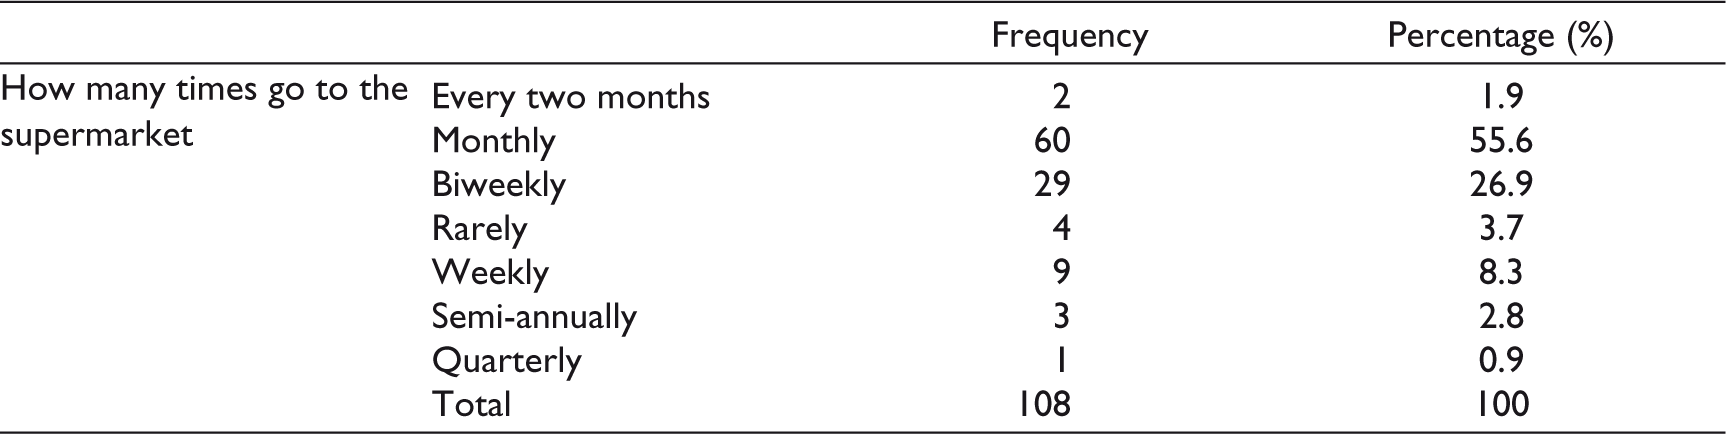
Another relevant item for this study regards to the frequency that the customer goes to the supermarket to buy these types of products. In Table 1, it is possible analyse the respondents’ behaviour. In fact, 55.6% of the participants buy laundry products monthly, whereas 26.9% go biweekly.
Results
Descriptive Statistics
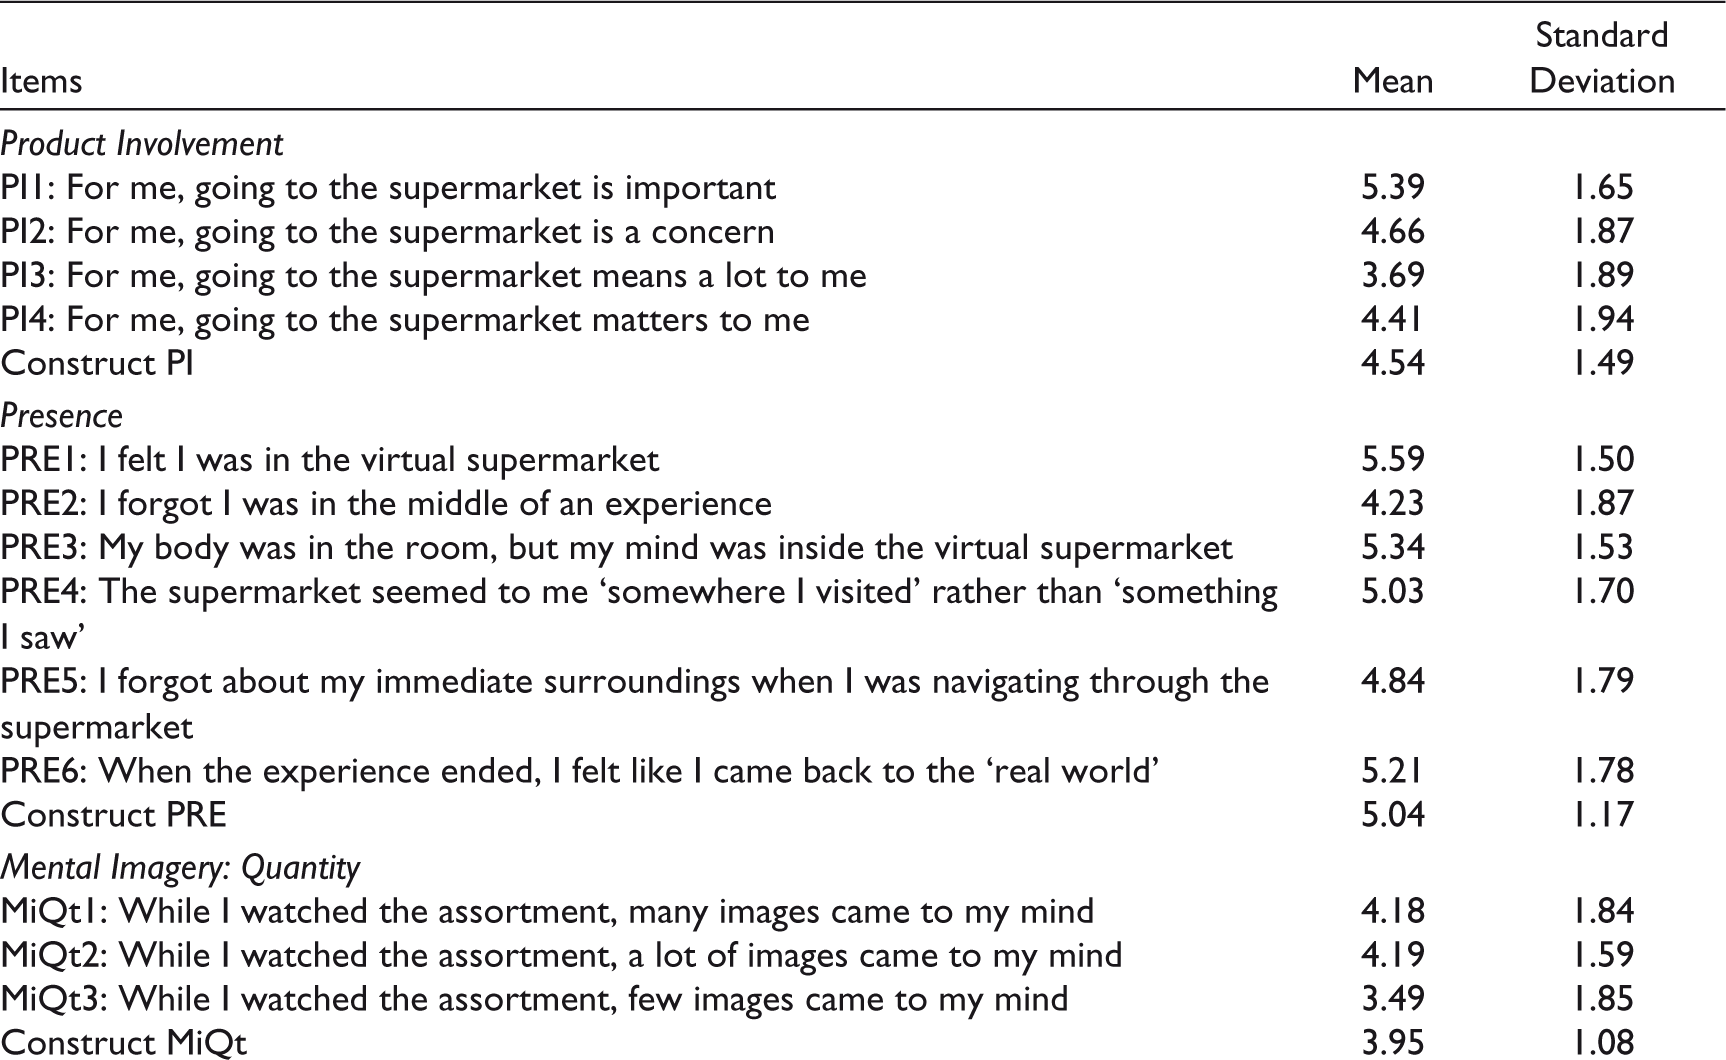
The first variable to be studied is the product involvement. The question is composed by 4 items presented in the Table 2. The item with a highest average value is PI1 (mean = 5.39). On contrary, item PI3 has the lowest average with a value of 3.69. Regarding the standard deviation, the values are very similar for all items, excluding PI1 with the lowest value of 1.65. The new construct PI presents an average value of 4.54 and a standard deviation of 1.49 (see Table 2).
Sociodemographic Data: Frequency of Going to the Supermarket
The variable presence has six items presented in the Table 2. The item with a highest average value is PRE1 (mean = 5.59). On contrary, item PRE2 has the lowest average with a value of 4.23. Regarding the standard deviation, PRE1 shows the lowest value of 1.50. The new construct PRE presents an average value of 5.04 and a standard deviation of 1.17.
Mental imagery is composed by quantity, modality, vividness and valence. The variable quantity is composed by 3 items. The item with a highest average value is MiQt2 (mean = 4.19), very similar to MiQt1 (mean = 4.18). On contrary, item MiQt3 has the lowest average with a value of 3.49. Regarding the standard deviation, MiQt1 shows the lowest value of 1.84. The new construct MiQt presents an average value of 3.95 and a standard deviation of 1.08. The variable modality is composed by 4 items. The item with a highest average value is MiMo1 (mean = 5.03). On contrary, item MiMo2 has the lowest average with a value of 3.96. Regarding the standard deviation, both MiMo1 shows the lowest value of 1.77. The new construct MiMo presents an average value of 4.56 and a standard deviation of 1.36. Vividness aggregates 7 items presented in the Table 6. The item with a highest average value is MiVi6 (mean = 5.64). On contrary, item MiVi7 has the lowest average with a value of 2.92. Regarding the standard deviation, MiVi6 shows the lowest value of 1.35. The new construct MiVi presents an average value of 4.76 and a standard deviation of 1.09. Finally, valence contains 4 items. The item with a highest average value is MiVa3 (mean = 5.54). On contrary, item MiVa4 has the lowest average with a value of 4.99. Regarding the standard deviation, MiVa1 shows the lowest value of 1.39. The new construct MiVa presents an average value of 5.34 and a standard deviation of 1.35.
Descriptive Statistics

The variable purchase intention is composed by 4 items (see Table 2). The item with a highest average value is Pin3 (mean = 5.00). On contrary, item Pin4 has the lowest average with a value of 4,44. Regarding the standard deviation, PIn1 shows the lowest value of 1.55. The new construct PIn presents an average value of 4.71 and a standard deviation of 1.46.
The variable emotion is composed by 4 items. The item with a highest average value is EM2 (mean = 5.71). On contrary, item EM3 has the lowest average with a value of 5.38. Regarding the standard deviation, EM1 shows the lowest value of 1,44. Both EM3 and EM4 present the same standard deviation value (α = 1.64). The new construct EM presents an average value of 5.57 and a standard deviation of 1.38.
Structural Results
A partial least squares-structural equation model (PLS-SEM) approach using SmartPLS 3.0 was used to test the model. PLS-SEM was considered suitable for analysing the current data due to its fit under small-medium sample sizes that are common in laboratory experiments. Using the guideline proposed by Hair et al. (2010), the analysis was conducted on two levels: a first-order constructs level and a second-order construct level to analyse the four dimensions of mental imagery: vividness, quantity, valence and modality.
At the first-order construct level, item reliability was analysed. Reliability measures the internal consistency between all the items which belong to a construct (Götz et al., 2010). Cronbach’s alpha and composite reliability should be above 0.7 (Hair et al., 2010) to be accepted. All composite reliability values are above 0.8. Regarding Cronbach’s alpha values, all variables exceed 0.7, except for Presence which has a Cronbachs’ alpha = 0.675, very close to the acceptable limit. Convergent validity was measured using average variance extracted (AVE) and the minimum value of 0.5 was met for all the constructs (see Table 3).
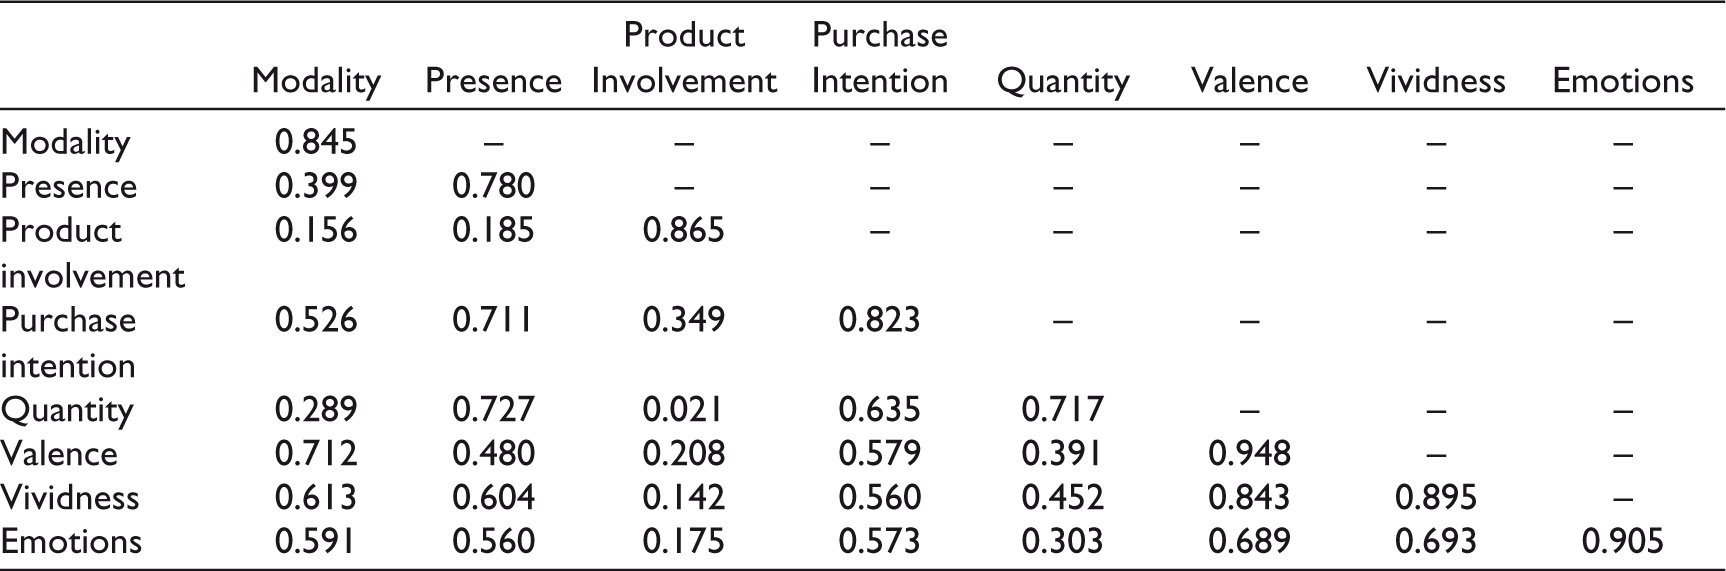
Discriminant validity was also according to the levels required by the Fornell–Larcker criteria. Here, the square root of AVE of all constructs needs to be greater than its highest correlation with any other construct (Henseler et al., 2016). Table 4 shows the results.
Measurement Results: First-Order Construct Level

Discriminant Validity: Fornell–Larcker Criterion
Regarding the second-order construct, we have the parameter estimates of the indicator weights, significance of the weight (t-student) and multicollinearity for mental imagery’s dimensions. First, weight indicator measures the contribution of each item to the variance of the latent variable. According to Chin et al. (2003) the recommended indicator weight should be above 0.2. All the items have values equal or above 0.2, except for the quantity sub-dimension of mental imagery. Table 5 shows that the items show positive beta weight. Therefore, they contribute significantly for the latent variable. Even though, quantity sub-dimension weight is equal to 0.07, the item shows a positive significance for the construct, so the constuct was acepted. A high multicollinearity among dimensions would produce unstable estimates and would make it difficult to separate the effect of the individual dimensions on the construct (Petter et al., 2007). The degree of multicollinearity among the formative indicators should be assessed by variance inflation factor (VIF; Fornell & Bookstein, 1982). The VIF indicates how much an indicator’s variance is explained by the other indicators of the same construct and should be below 3.33. All the constructs meet that threshold, except for vividness, which is very close to the acceptable value and below the less conservative threshold of 5.
Measurement Results: Second-Order Construct Level

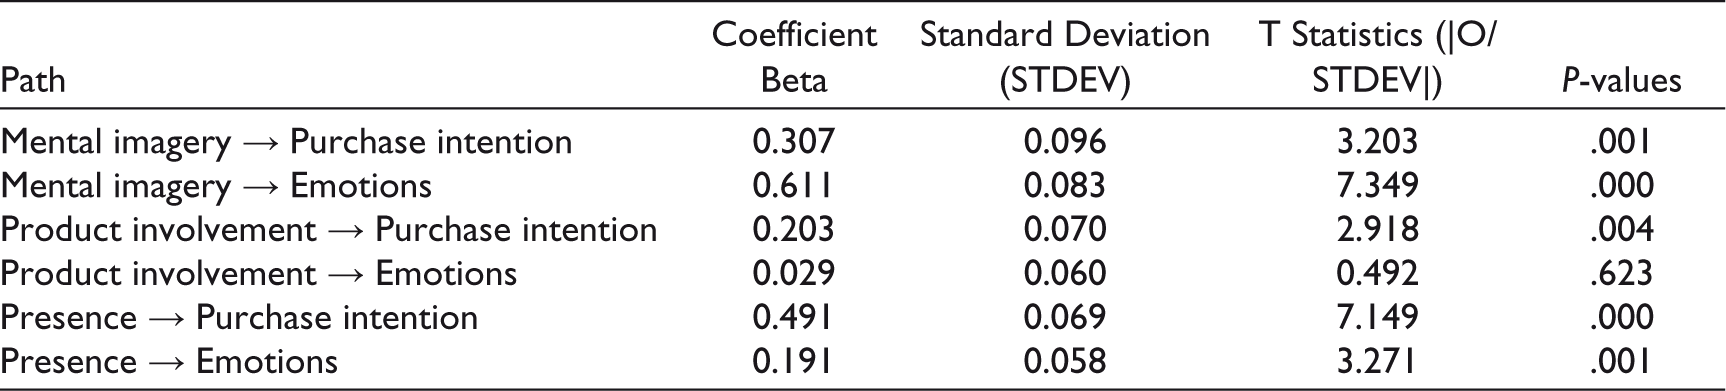
A bootstrapping method (using 500 samples) was applied to estimate the statistical significance of the effects between each construct. This non-parametric method is used to obtain the standard errors of the estimates (Chin et al., 2003; Hair et al., 2010). Regarding the established hypotheses, not all paths’ coefficients were found significant. Table 6 shows the results for each hypothesis. Hypothesis H1, H2, H3, H5 and H6 are fully supported, while H4 is not supported.
Structural Results
Predictive Relevance and Validity

Hypothesis of the Study

The model explained 61.5% of the total variance of purchase intention and 55.7% of emotions construct, while Q2—the level of predictive power—is positive in both cases, which shows that the model is able to predict new data (see Table 7).
Table 8 shows the hypotheses that were supported.
Discussion and Conclusion
Bogicevic et al. (2019) suggest that in the new technologic world, VR can be a significant stimulus to increase marketing outcomes. While being exposed to strong stimuli, consumers long-term memory has an influence on consumer behavioural responses (Yoo & Kim, 2014), namely on purchase intentions and positive emotions (Bilro et al., 2019).
The current results show that mental imagery leads to a purchase intention in a virtual setting (β = 0.307), which means that when in the VR shopping experience, mental imagery explains the purchase intention variable, therefore, H1 is supported. The effects of mental imagery on purchase intention that were found in the current study bring implications for both academics and managers. The study shows that memory cues are important drivers of purchase in VR, which confirm that brand cues may be important not only in the physical environment and e-commerce (Kulshreshtha et al., 2017) but also on VEs. Therefore, the findings suggest that brands should highlight both intrinsic and extrinsic cues in the virtual setting. Regarding emotions, results show that there is a relationship between mental imagery and emotions (β = 0.611), thus supporting H2. It is crucial to highlight that the positive effect of mental imagery in emotion was the strongest direct effect of whole model, pointing out the crucial role that mental imagery may play in the generated emotions. Indeed, emotional responses occur when our cognitive senses are stimulated (Miller et al., 2000), and according to mental imagery definition, this is exactly what happens when mental images take a lead role in the brain.
Product involvement is the way customers perceive the relevance of a product, brand or category (Calvo-Porral et al., 2018). The product involvement is not the same for all consumers. The level of involvement will determine the consumers’ attitude towards the product; therefore, brands should approach the audience taking their involvement level into account. Here, VR has an important role. According to Cowan and Ketron (2019) the use of VR, as marketing tool, has a different impact depending on the degrees of involvement. In fact, VR enhances engagement and communication with customers who are highly involved leading to a product purchase. The current study confirms the results obtained by Cowan and Ketron (2019). Results show that product involvement leads to a purchase decision in a VR setting (β = 0.203). Therefore, when in the virtual shopping experiences, consumer who is highly involved with the product/brand tend to be more prone to buy the product. Thus, product involvement explains purchase intention in a virtual setting (H3 is supported).
Calvo-Porral et al. (2018) highlighted the importance of product involvement on emotions. According to the authors, the positive or negative emotions are related to product involvement. High involvement is linked to positive and pleasurant emotions, while low involvement leads to negative emotions. In Calvo-Porral et al. (2018) case, the products involved were wine (high involvement) and coffee (low involvement). However, our results show that product involvement does not affect emotions on a VR setting and H4 is not supported.
One of the most important characteristics of VR is the feeling of physical presence in a virtual world. Some authors suggest that this characteristic is very important to engage customers and consequently leads to positive emotions and also purchase behaviours (Sands et al., 2015). Marketers found that VR and this feeling of presence can be a tool to enhance sensory perceptions. Therefore, when atmosphere conditions stimulate our senses, there is an emotional response. The current results show that presence leads to a purchase decision (β = 0.491). Therefore, when the consumers feel a sense of physical present in a virtual world, they show a higher intention to buy the product, thus supporting H5. Presence was also found to positively affect emotions (β = 0.191). This means that interactivity and immersion experienced on virtual supermarket enhances emotions, thus supporting H6. However, the positive relationship between presence and emotion was the weakness direct effect of model.
The current study contributes to the literature by showing that a shopping VE influences the consumers purchase intentions and emotions. Findings show that mental imagery, product involvement and presence have positive direct effect on purchase intention and emotions.
The findings suggest that in order to develop a better experience within a virtual store, managers should create an atmosphere focused on strong mental imagery cues, which will lead to positive emotions and influence the consumers purchase decision. Results also showed that when consumers are totally immersed in the virtual shopping environment (a high presence perception), both emotions and purchase intention increase. Therefore, managers should develop VEs that promote such escapism effect. In conclusion, the current study emphasises the importance of creating the right atmosphere for a better shopping experience. Marketers must provide a personalised shopping experience given the different variables that influence the shopper’s behaviour.
Despite the contributions of the study, there are some limitations that should be acknowledged. First, the main limitation relies on the sample size of only 108 participants. However, given the laboratory condition of the study, the current experiment presents a high internal validity at the expense of external validity. The sample was also composed mainly of women. Such sample bias may be explained by the fact that women are still the most active buyers of laundry products. A more extensive and diversified sample could strengthen the results found in our study. It would also be interesting to sample participants in a real shop environment and compare the differences between a real and virtual setting.
For future research, we believe that other constructs could also present interesting results in the virtual setting, namely to explore the level of consumer satisfaction with the virtual shopping environment and how such satisfaction would lead to recommending the experience to others through word of mouth (Sharma & Srivastava, 2017).
Footnotes
Declaration of Conflicting Interests
The authors declared no potential conflicts of interest with respect to the research, authorship and/or publication of this article.
Funding
The authors received no financial support for the research, authorship and/or publication of this article.