Abstract
This study examines the impact of scheduled macroeconomic announcements on the option’s implied volatility index in the emerging market. The macroeconomic indicators considered are RBI monetary policy statements, the consumer price index, wholesale price index, index of industrial production, the employment rate and gross domestic product (GDP growth rate). The study reveals that during non-announcement periods the implied volatility index (India VIX) increases significantly. Once results are announced, uncertainty is resolved and the India VIX returns to normal levels. It confirms that the India VIX declines significantly following scheduled GDP news, but rises significantly on the announcement of monthly inflation rates (WPI). Indeed, the joint effect of the announcements relating to monetary policy, the industrial output, employment rate and GDP is found to be statistically significant (and negative).
Keywords
1. INTRODUCTION
The link between asset prices and macroeconomic announcements provides an insight into the behaviour of asset prices during important scheduled macroeconomic news releases. The literature documents well the response of asset prices in terms of equity prices, futures, interest rate, the exchange rate, etc, but little attention has been given to options’ implied volatility index. This study is an attempt in this direction, analysing the behaviour of the implied volatility index (VIX). These types of studies have drawn great interest from policy makers, practitioners and market analysts.
Stock market returns are greatly influenced by federal monetary policy announcements and scheduled announcements of macroeconomic indicators such as the wholesale price index (WPI), consumer price index (CPI), index of industrial production (IIP), growth rate of the gross domestic product (GDP), unemployment rate, etc. (see Chen and Clements, 2007; Ederington and Lee, 1993; Nikkinen and Sahlström, 2004). The implied volatility index (VIX) is the measure of expected volatility in the near future. The Nobel work of Black–Scholes (1973) and Merton (1973) on option pricing has made it possible to construct an implied volatility index from the best bid-ask prices of the options.
Almost all past studies in this area are based on well-developed stock markets; this is the first attempt at a study in an emerging market like India. Consequently, the empirical results of this study may not be fully consistent with the literature for developed market. India has two leading stock exchanges, the Bombay Stock Exchange (BSE) and National Stock Exchange (NSE). The NSE, which allows trading in derivative instruments, recently introduced a volatility index know as the India VIX 1 , constructed along the lines prescribed by the VIX of Chicago Board of Options Exchange, 2003, methodology. In this study we focus on the India VIX, constructed along the lines of the Chicago Board of Options Exchange (CBOE) VIX®. 2 The India VIX is constructed out of the best bid-ask options prices written on the S&P CNX Nifty Equity Index. The daily best bid-ask prices of the OPTIDX (options written on the S&P CNX Nifty Equity Index) options contract are considered, from which is derived volatility in percentages, which indicates expected market volatility in the next 30 calendar days (20 to 22 trading days).
Under the rational expectation assumption, the market collects all the information on macroeconomic announcements, which is reflected in the current prices of the market’s underlying S&P CNX Nifty Equity Index. Nikkinen and Sahlström (2004) found that the VIX increases in the period prior to and falls on, the day of various series of scheduled macro-economic announcements.
The literature in this area deals with the volatility of financial assets in terms of equity prices and futures on interest rates, commodities and currency (Balduzzi et al., 2001; Bomfim, 2003; Christie-David and Chaudhry, 2000; Donders and Vorst, 1996; Ederington and Lee, 1993, 1996; Fleming and Remolona, 1999; Goodhart and Smith, 1985; Jones et al., 1998; Hess et al., 2008). This study, in contrast, deals with the volatility index.
Asset pricing and expected volatility have been widely discussed in academic literature. The effect of information content of scheduled macroeconomic announcements on the stock prices and volatility index has drawn great attention over the last two decades. Nikkinen and Sahlström (2004) in their article described the impact of FOMC (federal open-market committee) meeting days on the implied volatility index and found that implied volatility increases prior to the scheduled news and drops after meeting announcements. Their study showed that investors take into account FOMC meeting days for valuing the stocks. It was also known that there is a great impact on the CBOE VIX from macroeconomic news releases such as the employment report and the CPI and PPI reports. Ederington and Lee (1993) concluded that scheduled macroeconomic announcements are responsible for most of the observed time-of-day and day-of-the-week volatility patterns in interest rate and foreign exchange markets. Ederington and Lee (1996) tested for different hypotheses based on T-bond, Eurodollar and deutschemark markets and found that implied volatility rises before scheduled announcements and returns to normal after the announcements. They distinguish between scheduled and non-scheduled announcements and found that implied volatility was more volatile during non-scheduled announcements.
Some of the early studies (Beber and Brandt, 2006; Chen and Clements, 2007; Kearney and Lombra, 2004; Nikkinen and Sahlström, 2001, 2004) clearly establish a positive and significant relationship between scheduled macroeconomic announcement and the VIX. These studies conclude that scheduled announcements reduce market uncertainty, but before the announcements, markets become more uncertain due to surprise elements in the news releases. The literature that support the finding that the VIX and asset price volatility increase significantly before scheduled macroeconomic announcements and return to normal on the day of announcements are Bomfim, 2003; Christie-David et al., 2000; Ederington and Lee 1993; Fleming and Remolona, 1999; Goodhart and Smith, 1985; Joyce, 1999; Kearney and Lombra 2004; Thorbecke, 1997; and Thornton, 1998. Some recent studies (Chen and Clements 2007; Füss et al., 2011; Krieger et al., 2012; Nikkinen and Sahlström 2001, 2004) on the linkages between the VIX and scheduled macroeconomic announcements confirmed that market participants take into account macroeconomic news releases in their financial planning. However, Cutler et al. (1989) and Jones et al. (2005) studied the impact of macroeconomic news release on stock prices and interest rates and found no significant relationship.
The main objective of this article is to analyse the behaviour of the VIX in an emerging market economy. An attempt is made to isolate the impact of scheduled macro announcements on the India VIX using the ARMA: OLS, ARMA: GARCH, ARMA: GARCH-M and ARMA: EGARCH models. The analysis indicates that during non-announcement periods, the India VIX increases significantly, but goes back to normal once the results are announced. It also show that the India VIX declines significantly following scheduled GDP news, but rises significantly on the announcement of monthly inflation rates (WPI). In addition, the joint effect of announcements on monetary policy, the IIP, employment rate and growth rate of GDP are found to be statistically significant (and negative). The GARCH (1,1)-M model clearly showed that volatility trading provides an extra return on risky assets. In addition, the exponential GARCH (1,1) model accounts for the leverage effect and confirms that bad news on macro indicators have a significant impact on the India VIX. The Nikkinen and Sahlström (2004) study disregards the nature of news announcements and assumes a symmetric and mechanical impact of all macro announcements. In the conditional variance, the parameters of the variance equation are found to be statistically significant, indicating that volatility persists in the measurement of the India VIX return.
The article is organised as follows: Section 1 gives the theoretical introduction, with a related review of literature and explains the significance of the study; Section 2 describes the data and methodology; the empirical results and discussions are presented in Section 3; and the final section has the summary and conclusions.
2. DATA AND METHODOLOGY
2.1 Data
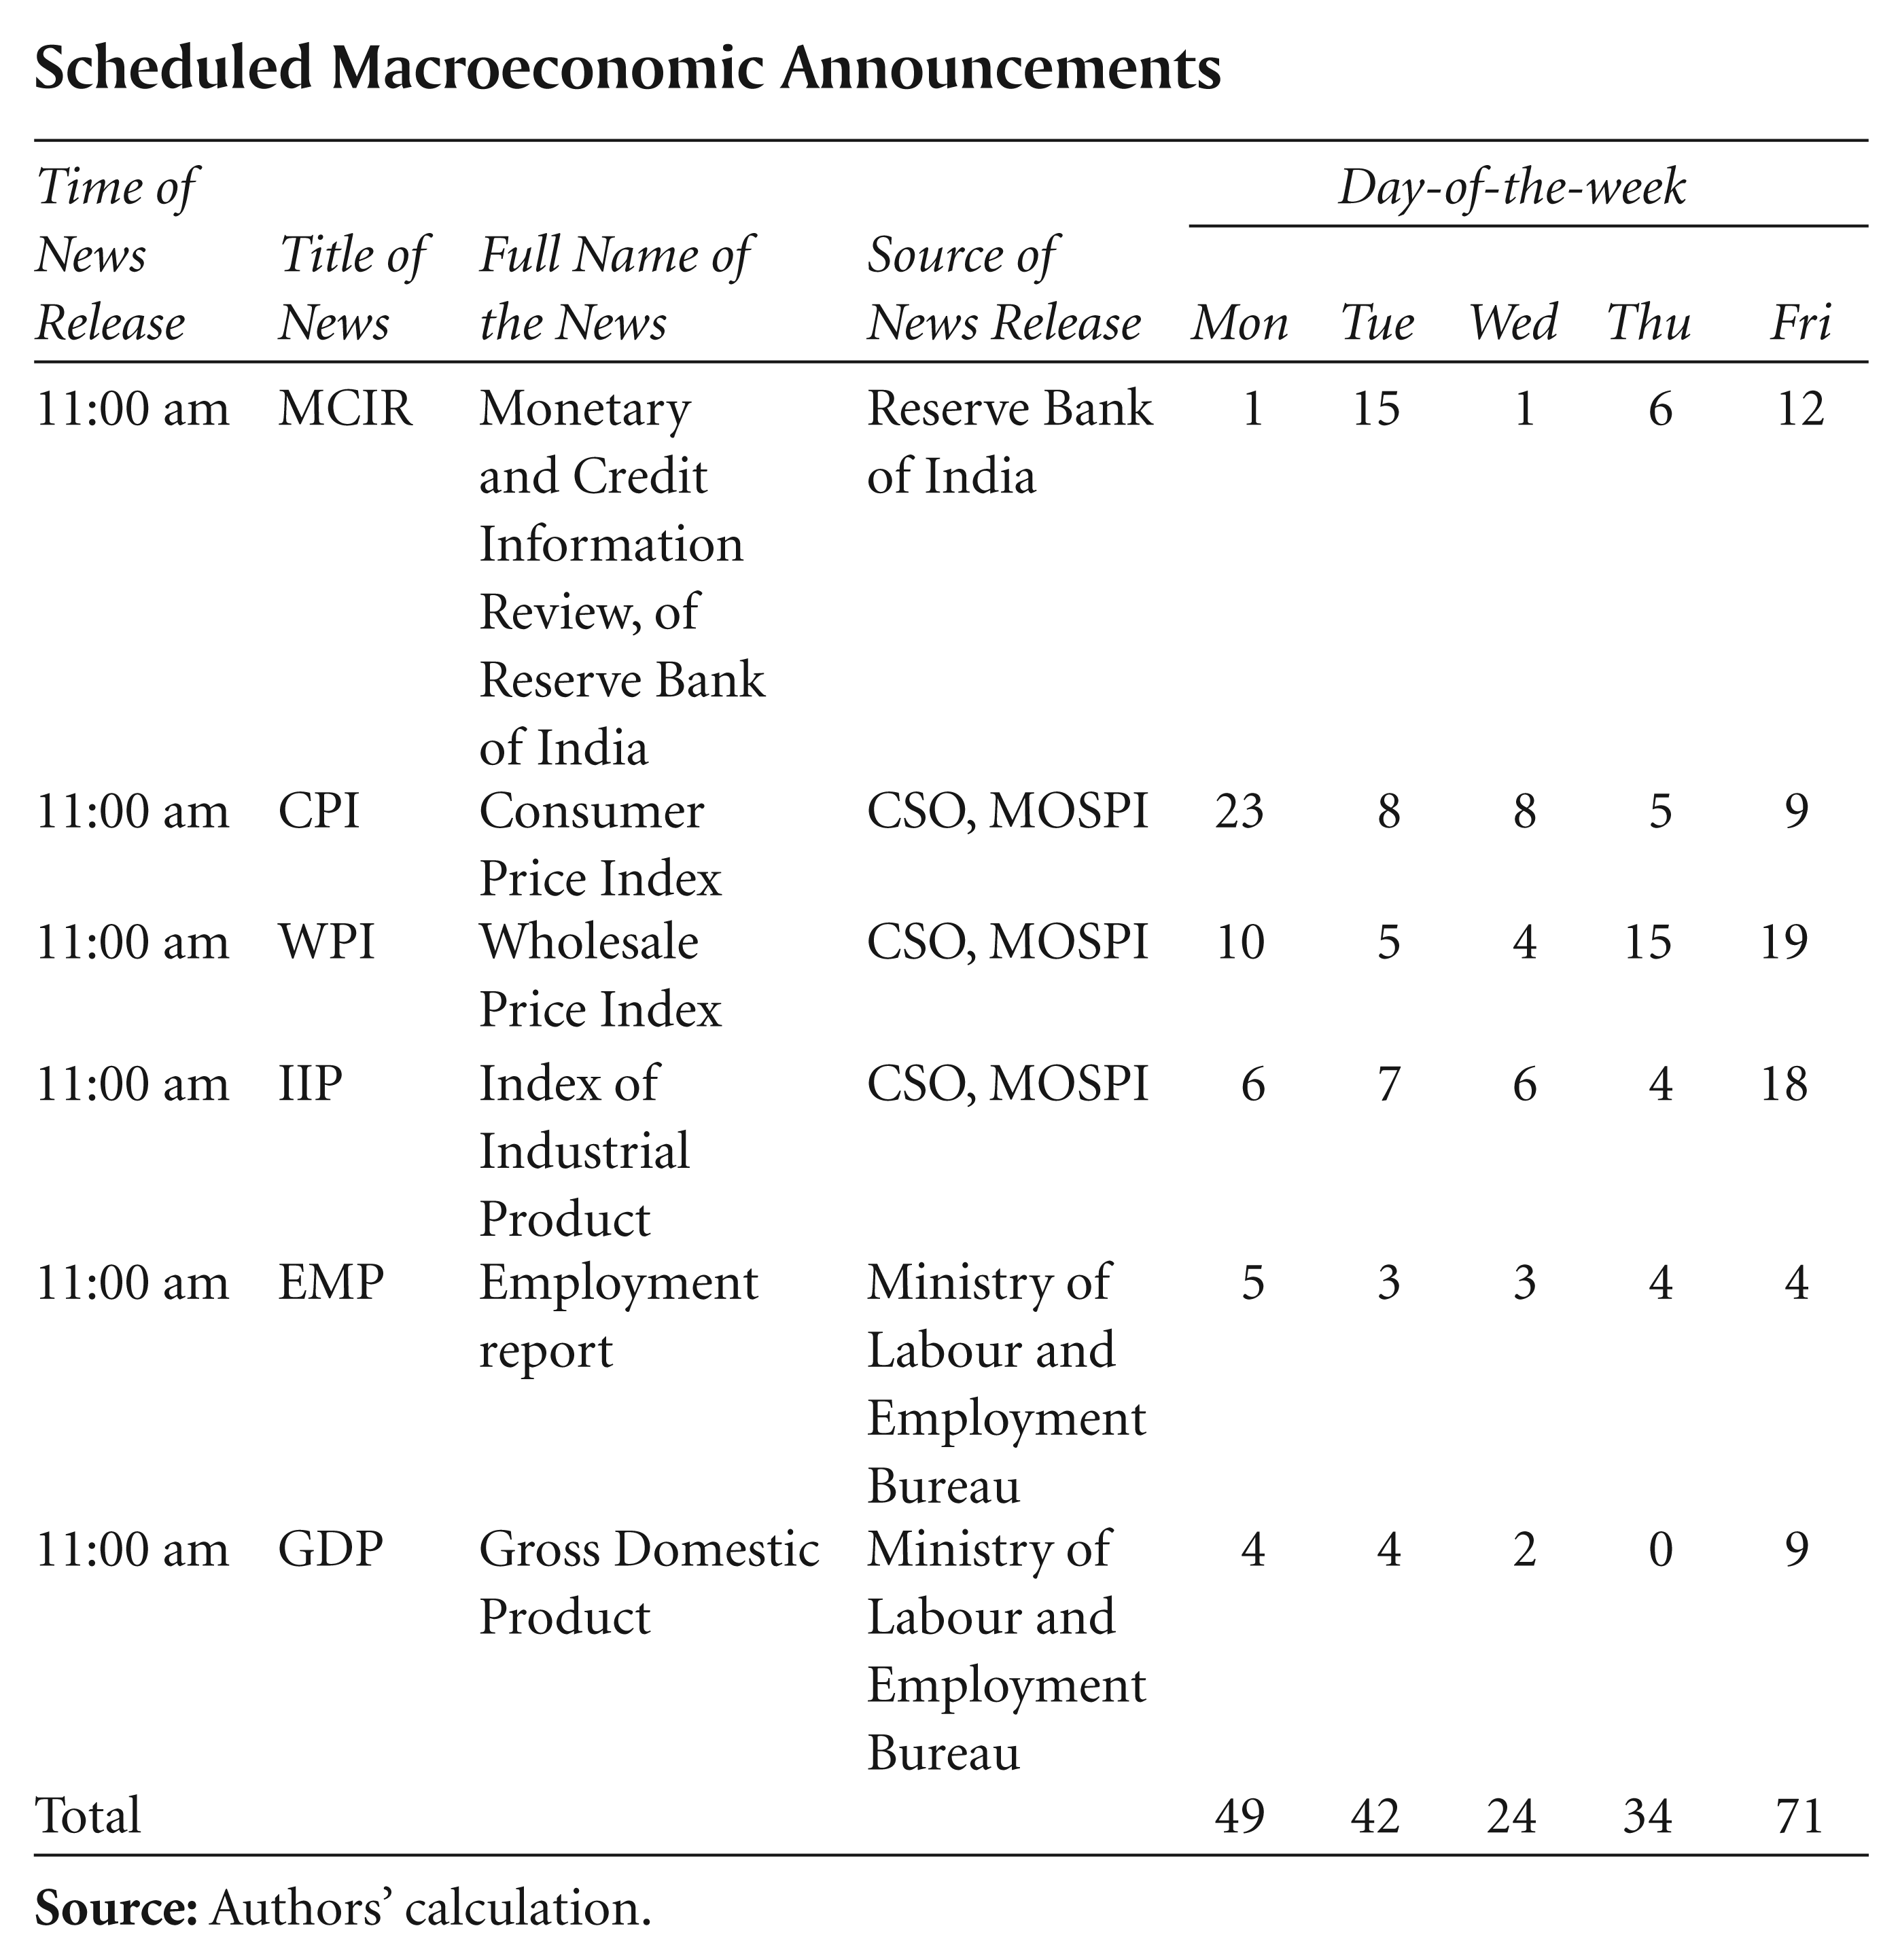
In this study, daily closing prices for the India VIX are collected from the NSE (National Stock Exchange of India) for the period, November 2007 to May 2012. Scheduled announcement dates are collected for MCIR (monetary credit information review of reserve/central bank of India), the CPI, WPI, IIP, employment and GDP for the sample period. Scheduled announcements of the CPI, WPI and IIP are available on a monthly basis, while data on the MCIR, employment and GDP are given on a quarterly basis. In addition, there are four mid-quarter monetary policy (MCIR) reviews after each quarterly review from the RBI, so eight MCIR meeting announcements take place annually. (Appendix A shows the details of scheduled macroeconomic announcements).
2.2 The India VIX
Implied volatility is the market’s expectation of volatility, based on the best bid-and-ask prices of options written on the S&P CNX Nifty index. The implied volatility index (VIX) forecasts expected market volatility over the next 30 calendar days. It is computed as a function of time-to-expiration; risk-free-rate-of-interest; forward-index-level and bid-ask quotes of options. Volatility is calculated using the order book of the underlying index options and is denoted as an annualised percentage term.
Stock price indices are calculated using the prices of their component stocks, while the India VIX is comprised of options rather than stock prices. India VIX uses the same methodology developed by the CBOE with required changes. The following equation was developed to calculate the India VIX:

Where:
σ
is the India VIX in percentage terms, i.e., India VIX/100 ⇒ VIX = σ × 100
T
time-to-expiration, i.e., life of the options
F
forward index level derived from index option prices
K0
first strike below the forward index level, F
Ki
strike price of ith out-of-the-money option; a call if Ki > K0 and a put if Ki < K0; both put and call if Ki=K0.
Δ Ki
the interval between strike prices – half the difference between the strike on either side of Ki:
(Note: K for the lowest strike is simply the difference between the lowest strike and the next higher strike. Likewise, K for the highest strike is the difference between the highest strike and the next lower strike.)
R
risk-free-rate-of- interest to expiration (MIBOR, i.e., 30 days/90 days)
Q(Ki)
midpoint of the bid-ask spread for each option with strike Ki.
The India VIX calculation measures the time-to-expiration in years, using minutes till expiration. The time-to-expiration is given by the following expression: T = {MCurrent day + MSettlement day + MOther days}/minutes in a year. The risk-free interest rate (R) is the Mumbai inter-bank offered rate (MIBOR). The relevant tenure of the NSE MIBOR rate (i.e., 30 days or 90 days) is being considered as a risk-free-interest rate for the respective expiry months of the Nifty option contracts. The NSE has an actively traded, large and liquid Nifty futures market. Therefore, the latest available traded price of the Nifty futures of the respective expiry month is considered as the forward index level (F).
The following steps are involved in the calculation of the India VIX (for more detail see India VIX, 2007):


Where:
NT1 = (number of minutes to expiration of the near month options) = 12960
NT2 = (number of minutes to expiration of the next month options) = 53280
N30 = (number of minutes in 30 days) =12960
N365 = (number of minutes in a 365-day year) = 525600
Using the above equation, σ = 0.2666 and India VIX = 100 * σ = 26.66
2.3 Summary Statistic
Table 1 shows the summary statistics for India VIX closing prices and log-return for the period 2007M11 to 2012M05. Panel A of Table 1 explains the behaviour of the VIX time series. The average VIX observed for the sample period is 30.13 per cent. Similarly, the maximum and minimum volatility of the underlying Nifty index measured are, respectively, 85.13 per cent and 15.22 per cent. As there is an inverse relationship between the Nifty and the India VIX index, the high (low) volatility of the VIX results in a fall (rise) in the underlying index.
The SD of the VIX at 10.83 implies that the India VIX experiences variability by 10.83 per cent over the sample period, depending upon good and bad shocks from news about macro indicators. The skewness and kurtosis clearly show that the VIX does not conform to a normal distribution like other benchmark indices in the financial market. The test of stationarity of the VIX in level shows that the ADF-test statistic is significant at the 10 per cent level of significance, so there is no trending in the India VIX during the sample period.
Summary Statistics for the India VIX
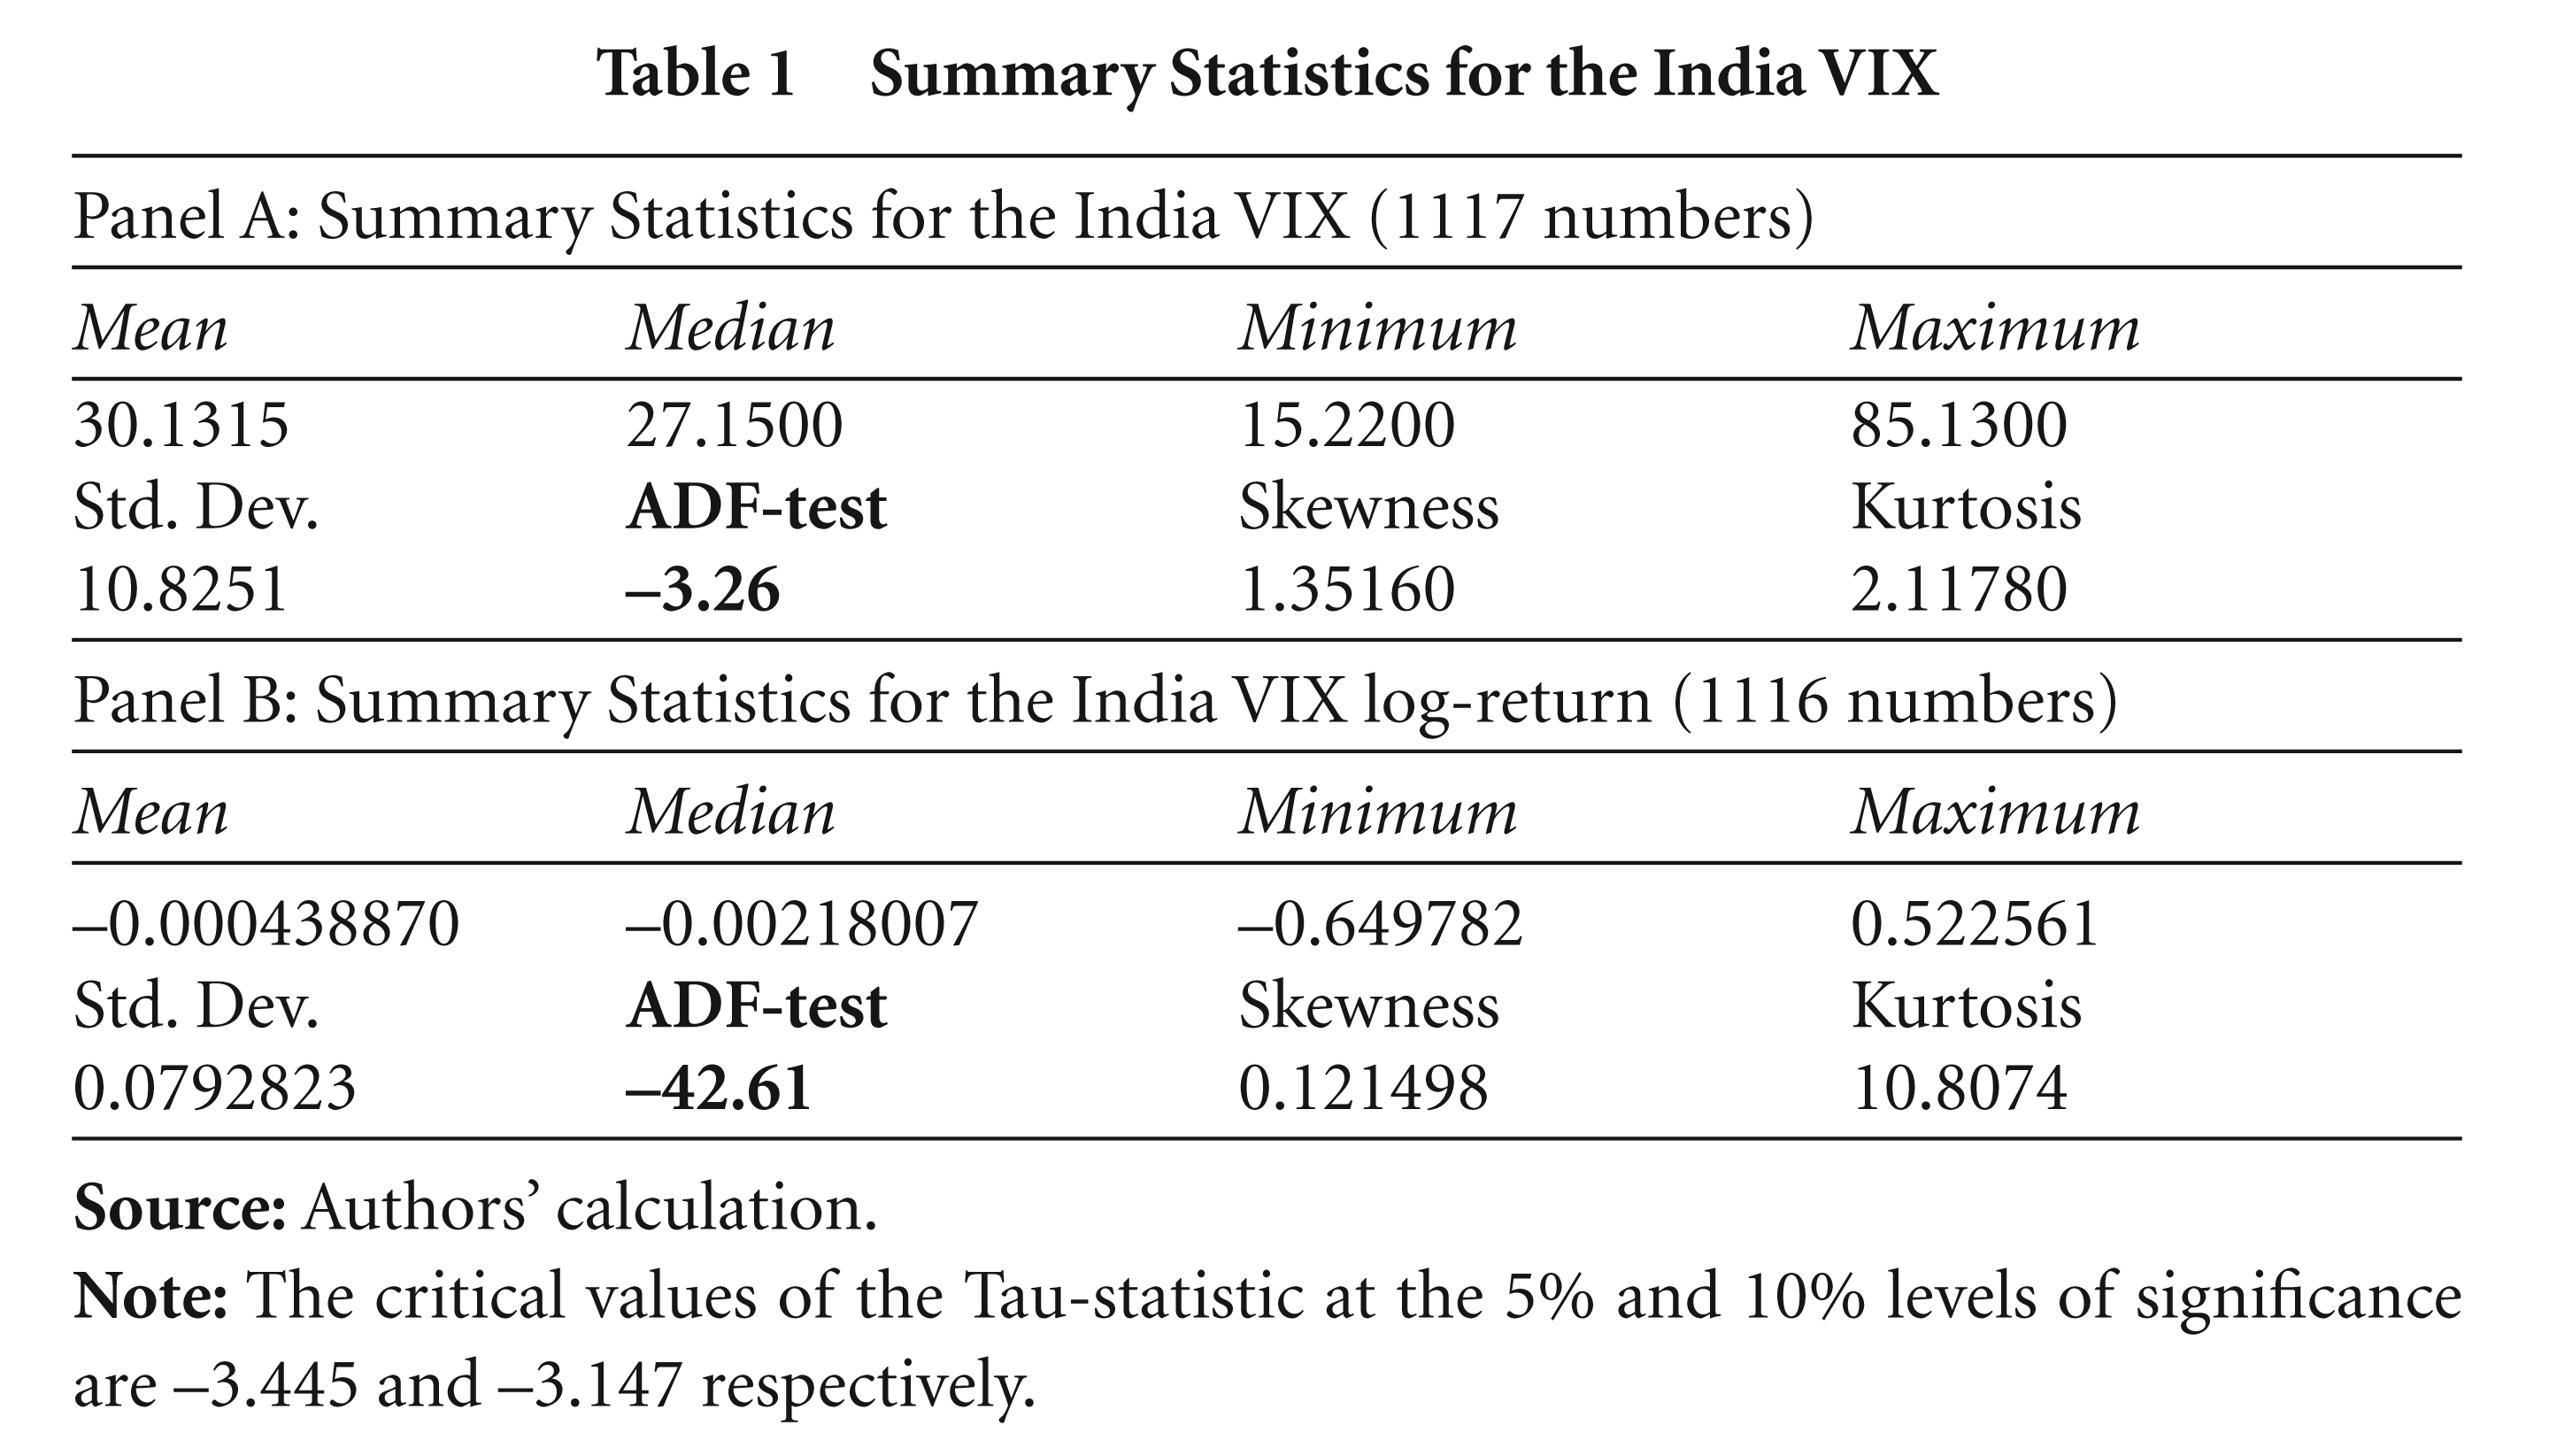
In Panel B the mean return of the India VIX was –0.04 per cent. The logreturn of the India VIX follows the basic principle of mean-reversing characteristics depicted in Figure 1. The ADF-test statistic explains that the log-return is stationary. The lowest negative log-return was 65 per cent and the highest positive was 52 per cent, with an SD of 8 per cent. The measures of skewness and kurtosis show that the log-return is non-normally distributed, with a peaked fat tail. Figure 1, portraying the time series of the log-return and the India VIX, shows that the VIX remains more volatile between 2008 and 2009. High volatility in the daily closing values of the India VIX implies more buying pressure on the Index options. Paying a higher premium rather than the theoretical price of the option results in an increase (decrease) in the VIX level. In addition, when the macro news is not in favour of the market, giving rise to greater uncertainty, agents buy more options to hedge their market position. Ultimately, the India VIX increases and the underlying index falls significantly. This phenomenon is well documented (see Harvey and Whaley, 1991).
Summary Statistics Surrounding Announcement and Non-announcement Days
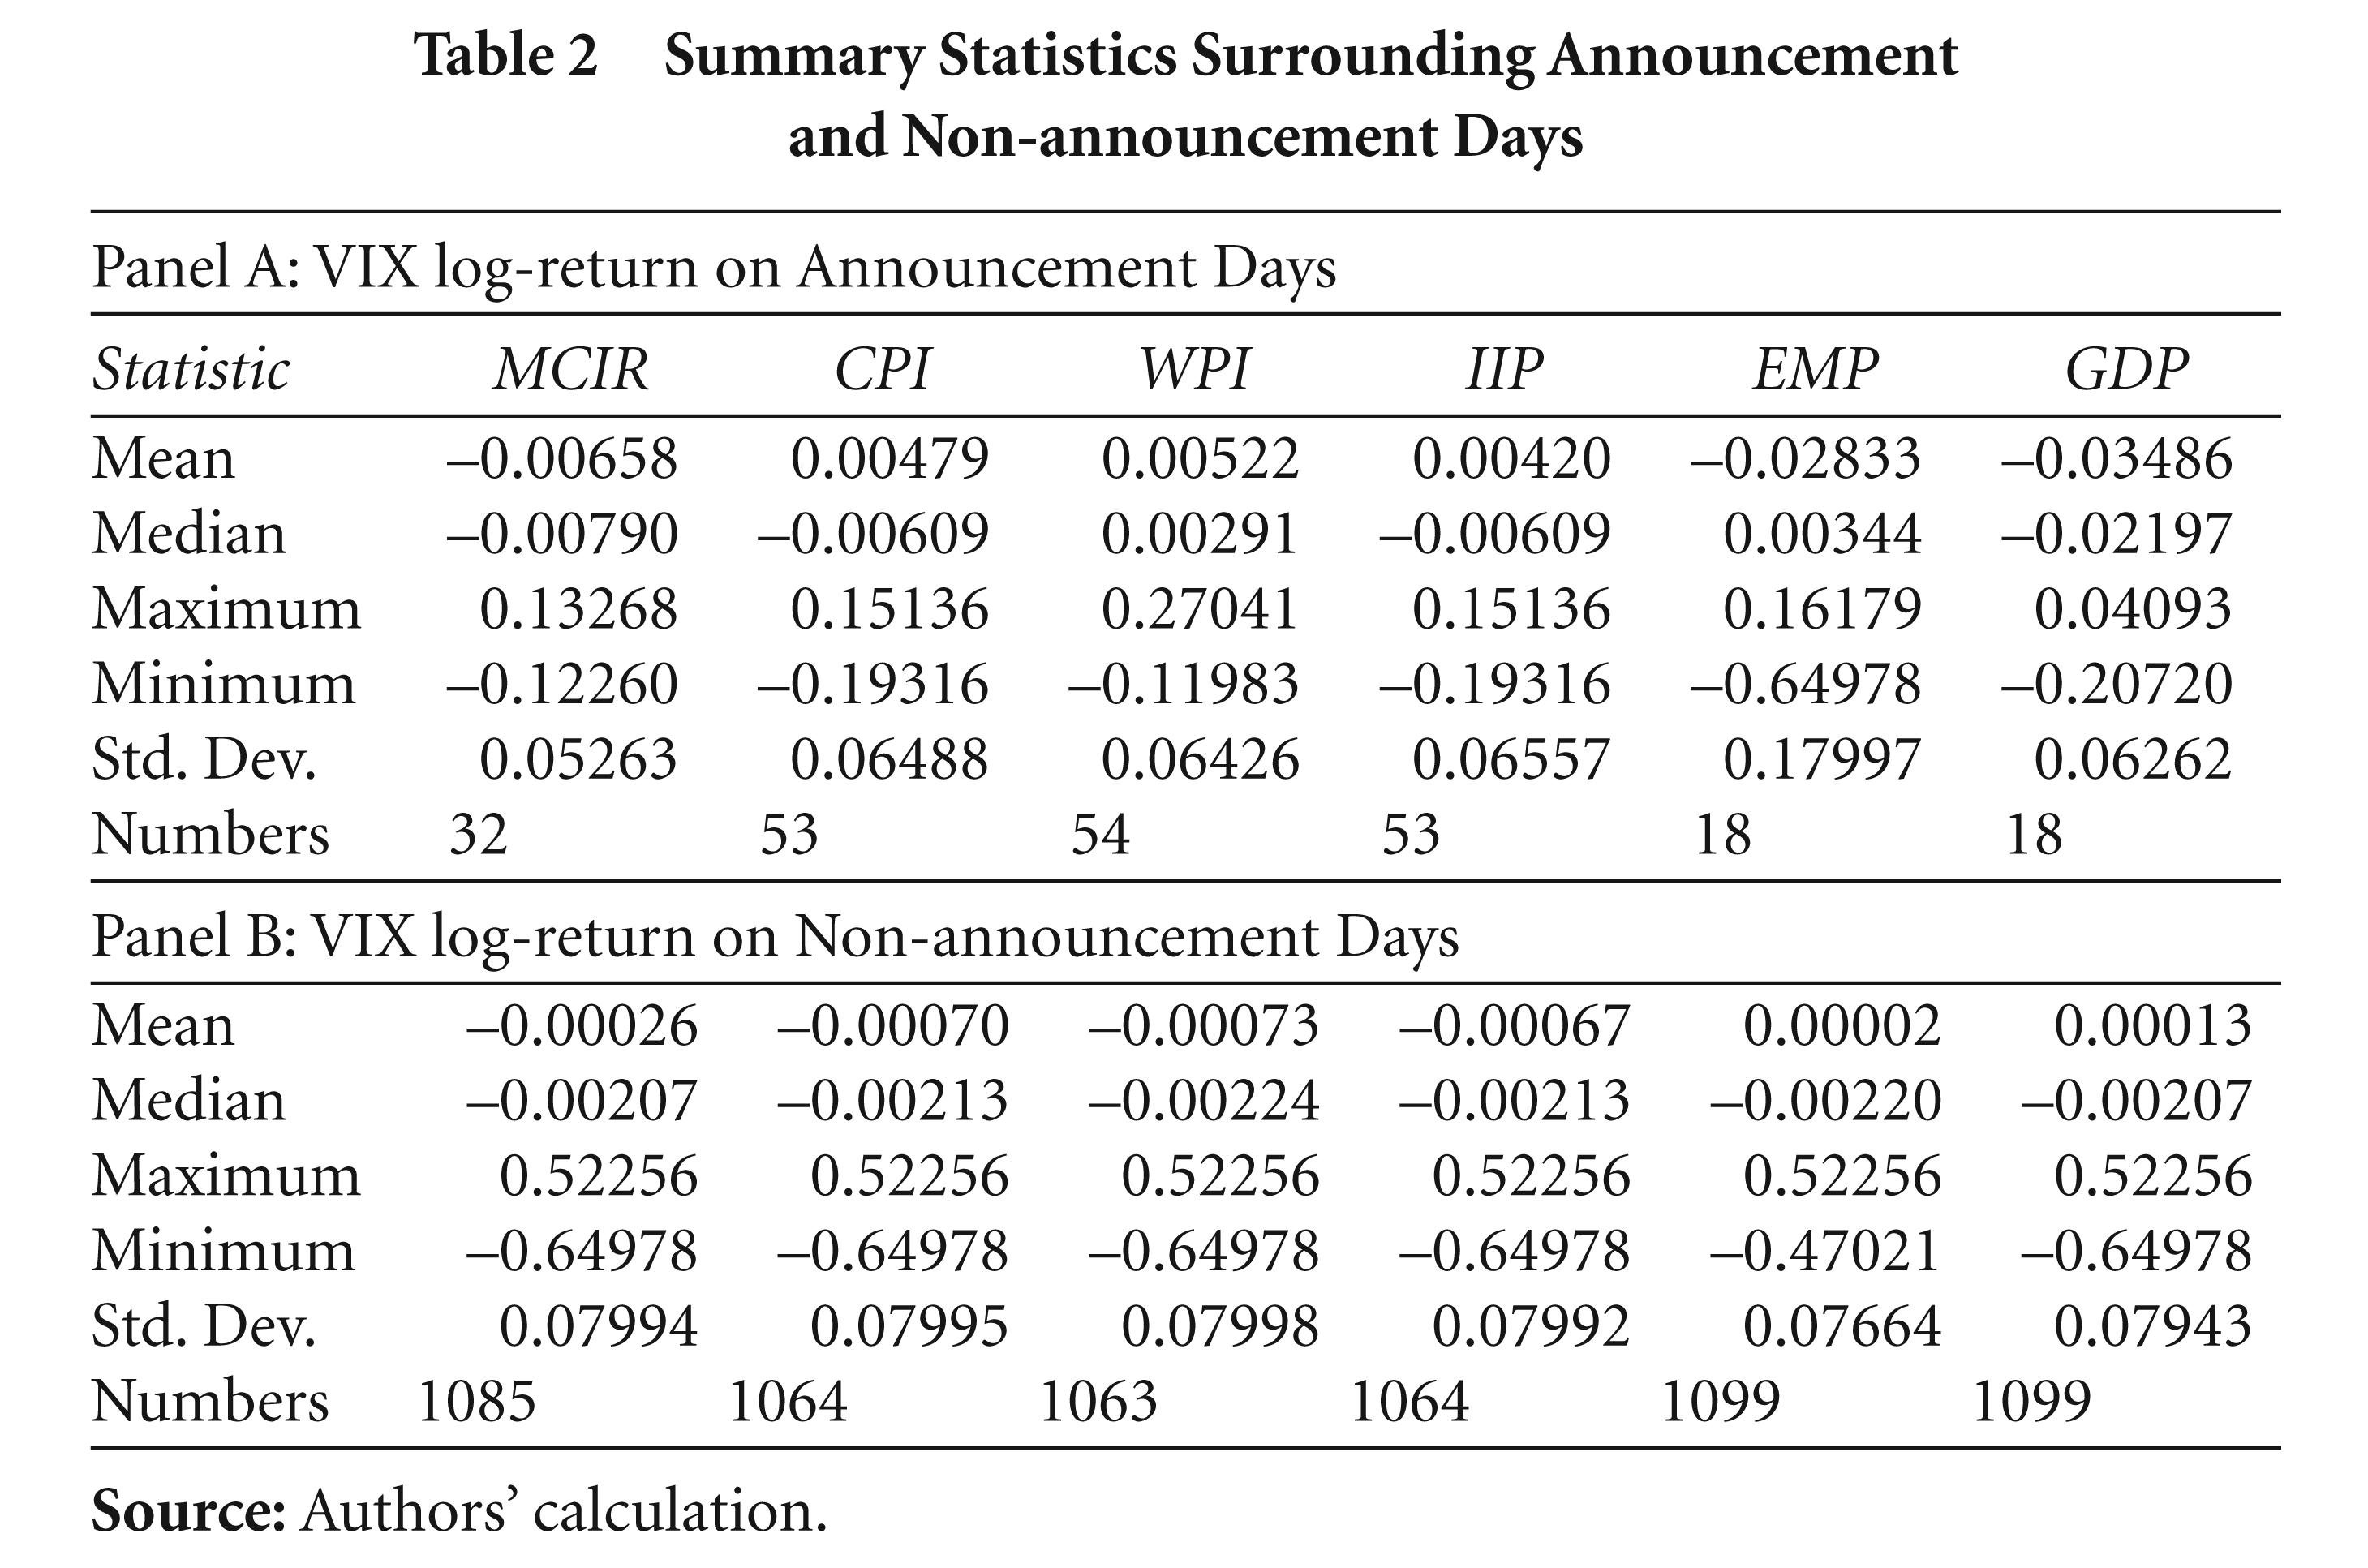
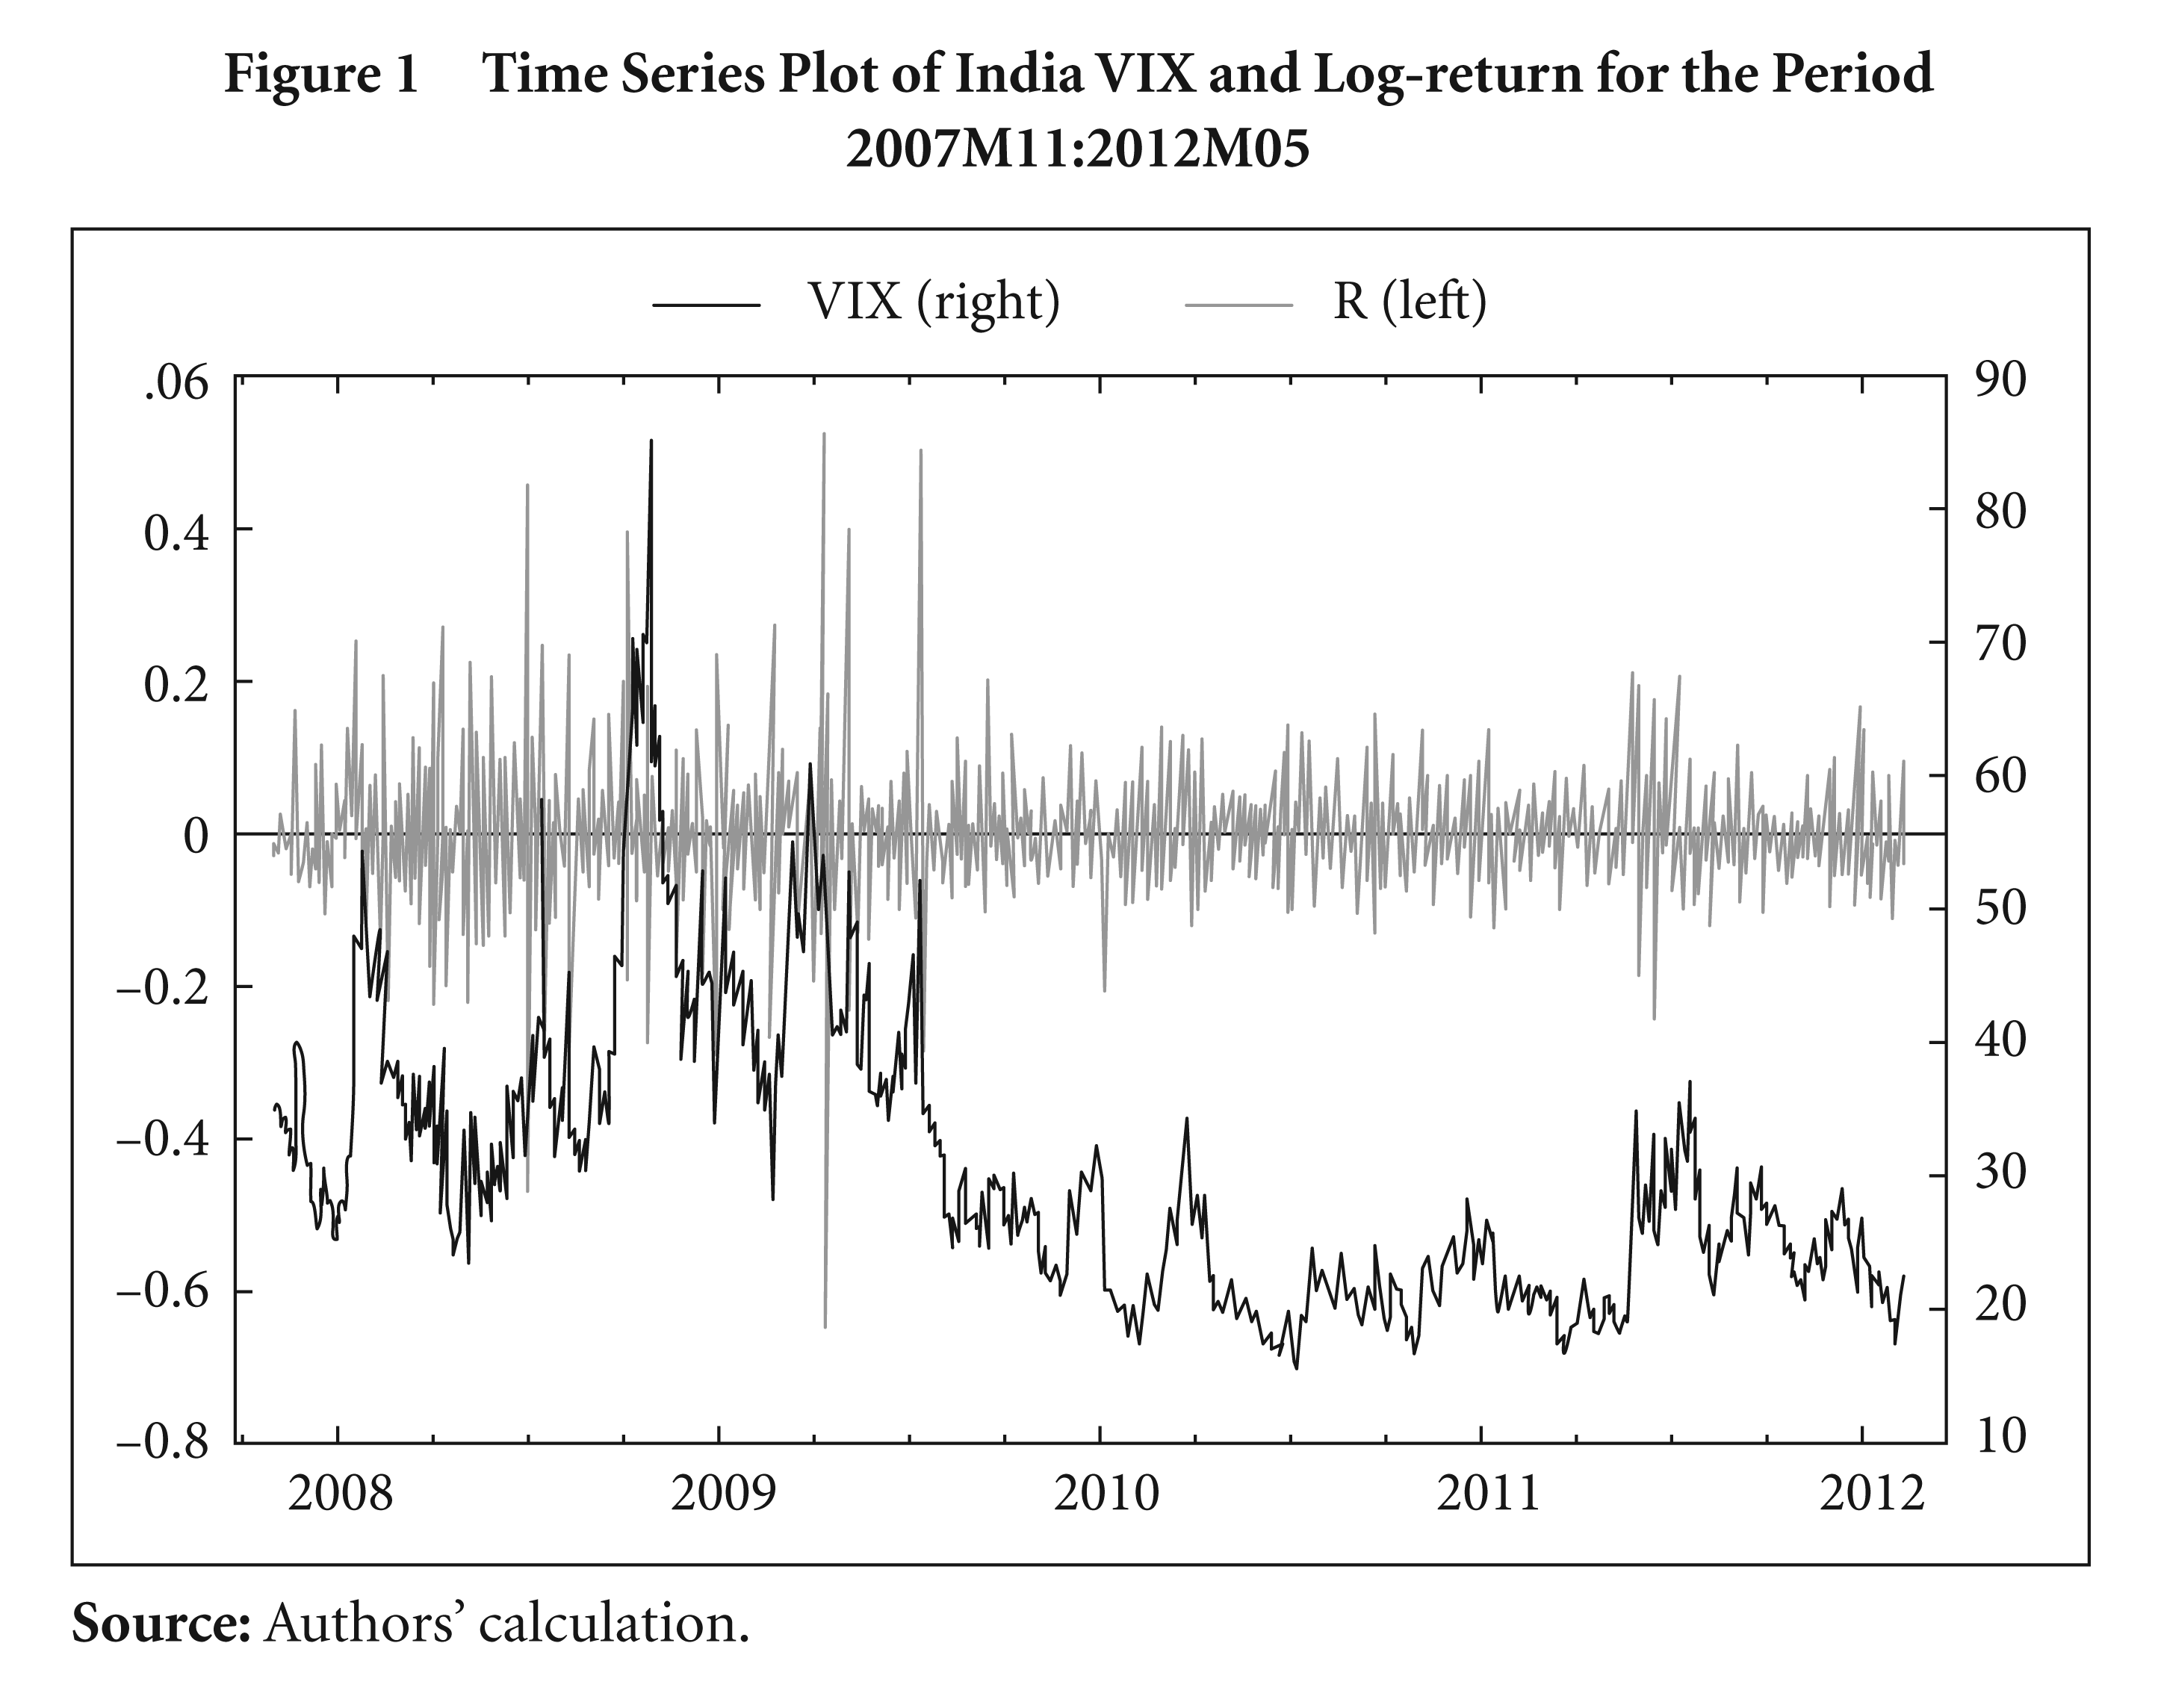
Table 2 reports the behaviour of the log-return of the India VIX surrounding the announcement and non-announcement periods. Panel A shows the log-return on important macro announcements days such as the MCIR and relating to the CPI, WPI, IIP, employment and GDP growth. The literature explains that on the day of the news release the India VIX reaches its maximum level and falls significantly after the news release. Generally it is observed that the positive (negative) shock of the macro news results in a fall (rise) in the India VIX. The log-returns of the India VIX were negative for MCIR, GDP growth and employment (Emp) for the sample period, implying that the monetary policy statement from the RBI, employment rate and GDP growth rate were in favour of the market. The average log-returns in the table indicate that when employment and GDP results were positive for the market, the India VIX fell by 2.8 per cent and 3.5 per cent, respectively. Similarly, the India VIX fell by 0.66 per cent on RBI policy statements, but was positive for the CPI, WPI and IIP reports. The WPI and CPI are proxies for the general price level of the Indian economy. The positive return on the announcements of inflation results on a monthly basis explains that the VIX increases due to a rise in the price index and, consequently, the underlying Nifty index also deceases. The average log-return on the announcement of IIP rates was positive (0.4 per cent) implying that a fall in industrial output results in a rise in the India VIX. The SDs of the CPI, WPI, IIP and GDP were around 6.5 per cent, but 18 per cent for employment, indicating that the index is highly influenced by employment rates.
In Panel B, the mean returns during non-announcement periods for GDP and Emp were positive, but negative for others indicators (that is, MCIR, CPI, WPI and IIP). However, a change in the India VIX during non-announcement periods was not so significant. An important finding from the descriptive statistics is that during non-announcement periods the SD’s of all the macro indicators are around 8 per cent, indicating that during periods of uncertainty, the India VIX varied by 8 per cent SD from positive (negative) shocks from macro news.
2.4 Methodology
2.4.1 Regression Model
The following regression models have been developed to analyse the behaviour of the India VIX during scheduled macro news releases. The log-return of the India VIX was measured in the mean-reverting framework. The regression models are expressed in terms of announcement dummies. The dummies capture the information content of important news releases. A significant problem of autocorrelation was detected in the log-return, hence, for each equation an AR(1) and MA(1) term was allowed to resolve the problem. In addition, the ARCH-test also shows the presence of time-varying volatility in the residuals (see Engle, 1982). Consequently, to tackle the problem of hetroskedasticity, estimation of the regressions is performed in the time-varying-volatility mechanism. A variant of the GARCH family model has been edited in the following sections (see Bollerslev, 1986).
The following are the regression models developed for the indicator/dummy variables:

Generally, speaking investors regard more than one announcement at one point of time in stock valuation. Therefore, the joint effects of macro news on the India VIX have been calculated. A Wald F-statistic is calculated for the group of negative (positive) slopes for the announcement dummies.

This equation captures the behaviour of the India VIX before and after announcements of scheduled macroeconomic news.
Variable description of Models 1 and 2:
2.4.2 Underlying Hypotheses of the Models
Models 1 and 2 are formulated based on the empirical work of Chen and Clements (2007) and Nikkinen and Sahlström (2004) and their underlying hypotheses are:
Intercept ( Slope coefficients ( The joint effect of announcements on the MCIR, CPI, IIP, WPI, Emp and GDP growth has been calculated because investors take into account more than one announcement at a point of time in their portfolio selection. Therefore, the F-statistic is assumed to be statistically significant if the impact is significant.
2.4.3 Symmetric and Asymmetric Impacts of News Announcements
To measure information asymmetry and the leverage effect on the India VIX return, some variants of the GARCH family have been estimated as follows: 4 Models 1 and 2 have been expressed in the ARMA (1, 1): OLS ordinary least squares specification using indicator variables. To control the autocorrelation problem, AR(p) and MA(q) terms have been added. The order of the autoregressive-moving average ARMA (p, q) has been chosen based on the minimum AIC (akike information criterion). The resulting residuals from the mean equation also tested for the autoregressive conditional heteroskedaticity (ARCH) effect, using the Lagrange’s multiplier, LM-ARCH test. The LM-ARCH test shows the significant presence of time-varying-volatility, hence, the conditional volatility framework has been used for further estimations.
From the mean equations for Models 1 and 2, the resulting residual,

where ht is the variance; it is a function of the intercept (δ0), the lagged squared residual from the mean equation and lagged variances; δ1 and δ2 are the slopes that measures the volatility, respectively, during the previous period and the fitted variance from the model during the previous period. The parameter of the model should be non-negative and the sum of δ1 + δ2 < 1 for stationarity.
To account for the volatility risk premium, the generalized autoregressive conditional heteroskedasticity in the mean GARCH-M (1, 1) has been estimated. The variance equation of GARCH-M (1, 1) is GARCH (1, 1), but in the mean equation an additional regressor has been included as the square root of the variance term (denoted by 
The GARCH model is a symmetric model in which positive and negative shocks are treated as of the same magnitude. However, Christie (1982) and Schwert (1989) conclude that downward movements in the market are often followed by higher volatility than upward movements of the same magnitude. Hence, an allowance for asymmetry in variance is made through the use of the exponential EGARCH model proposed by Nelson (1991).

The EGARCH model takes into account the leverage in the exponential form. Hence, forecasts of the conditional variance are estimated to be non-negative. As the non-negativity constraints in the linear GARCH model is too restrictive, he proposed the EGARCH in which the variance ht is an asymmetric function of the lagged disturbance εt, in which the presence of a leverage effect can be tested by the hypothesis δ2 = 0, where the impact of asymmetry is present if δ2 ≠ 0. In addition, the sum of δ1 and δ3 governs the persistency of volatility shocks in the GARCH (1, 1) model, while only the parameter δ3 governs the persistence of volatility shocks in the EGARCH (1, 1) model.
The literature indicates that the assumption of a normal distribution for the errors may not be appropriate for the GARCH model. Thus, the generalised error distribution (GED) variant has been assumed, where 
where the tail parameter r > 0. The GED is a normal distribution if r = 2, and fat-tailed if r < 2.
Regression Estimation of Model 1

3. EMPIRICAL RESULTS AND DISCUSSION
Models 1 and 2 have been structured to analyse the behaviour of the India VIX during scheduled macroeconomic announcements. The estimation output is presented in the following tables. A variant of Model 1 is estimated in Table 3. The estimation is performed by employing: (i) ARMA (1, 1): OLS; (ii) ARMA (1, 1): GARCH (1, 1); (iii) ARMA (1, 1): GARCH-M (1, 1); and (iv) ARMA (1, 1): EGARCH (1, 1). The best estimated model will ranked by minimum AIC value.
Results for Model 1
The first column of Table 3 [ARMA (1,1): OLS] shows the estimated output of Model 1 using the OLS dummy-regression. In this regression output, only GDP has a negative slope and is statistically significant, indicating that on the days of scheduled announcements related to the GDP, the India VIX fall significantly. The results are consistent with previous studies (Nikkinen and Sahlström, 2001, 2004). However, in case of the MCIR, IIP and Emp, the slope is negative but not significant and the intercept was positive and significant. The positive intercept signifies that during non-announcement periods, uncertainty prevails in the market hence the India VIX rises. The F-statistic shows that the MCIR, IIP, Emp and GDP have a significant joint impact (F-stat 3.17) on the India VIX, but the CPI and WPI have no significant impact (F-stat 0.36). Thus, the conclusion is that among the macroeconomic indicators, GDP results have a significant impact on the India VIX.
The second column [ARMA(1,1): GARCH(1,1)] shows the heteroskedastic consistent estimation results. In this estimation the slopes of the WPI and GDP are statistically significant. The positive slope of the WPI implies that the India VIX rises during announcements related to inflation rates for the economy. A plausible explanation for this is that, for the sample period, inflation was not under control so financial markets entered a phase of turbulence, propelling investors to buy more hedge funds to protect their stocks, resulting in a rise of the India VIX. Indeed, in this estimation the intercept (0.0021) appeared negative and significant. A potential explanation is that during non-announcement days, investors do not experience a high degree of uncertainty about forth-coming announcements, so the India VIX remains normal and keeps falling till news enters the market.
ARMA (1,1): GARCH (1,1)-M: In the previous regression, the India VIX log-return modelled only in terms of dummies and the GARCH model have been employed to capture time-varying volatility. Risk (volatility) was not allowed to explain the returns. Hence, in the mean-equation, the additional regressor, ‘volatility’ (
When the estimate of volatility is negative (positive) and significant, it causes a decrease (increase) in the mean return of the India VIX and investors experience relatively low (high) risk in the market. The effect of volatility can be interpreted as a risk premium. While the risk premium is considered to define the log-return on the India VIX, the intercept appears positive and statistically significant. This is one of the main findings of the study, which is also in support of findings by Chen and Clements (2007) and Nikkinen and Sahlström (2004). Nikkinen and Sahlström (2004) explained that this happens due to greater uncertainly during the non-announcement of results and is irrespective of the expected nature of the news.
The positive significant intercept signifies that, during the uncertainty period, investors overreact to the forthcoming scheduled news, their uncertainty increases and they pay higher premia on call/put options to hedge their market positions; this ultimately results in a rise in the India VIX. In this model, the GDP growth rate again appear negative and significant (implying that news related to GDP is in favour of the economy), so the market experiences a positive shock on the announcement of the GDP growth rate results and the India VIX falls. The other macro indicators, however, do not appear significant.
An interesting finding of the GARCH-M model is that the estimate of volatility is negative and significant. An explanation for this is that, for the extra premia, agents earn higher returns on the underlying assets of the Nifty Index.
ARMA (1,1): EGARCH (1,1) leverage effect on asset prices: The results show that the parameters, δ1, δ2 and δ3, are different from zero and statistically significant. Therefore, this model shows a strong leverage effect on the India VIX, both from ‘bad’ and ‘good’ announcements of macroeconomic indicators. Bad news has a greater effect on stock prices than good news, thus, according to the results all investors tend to remember the bad announcements for a longer time than they do the good information. Hence, when bad information appears in the market it is quite difficult to value the flows of positive information. The EGARCH model shows that the WPI and GDP have a significant impact on the India VIX: it rises on bad news related to inflation and falls significantly on good news related to the GDP.
Results for Model 2
The rationale behind Model 2 is to capture the behaviour of the market surrounding scheduled macroeconomic announcements. The OLS results show that on RBI monetary policy statement days, the India VIX is normal but not significant; the estimated slope of the MCIR is negative implying that investors regard the target rate of a fund, but there is little overreaction. According to the null hypothesis and literature, this is true only in the case of the MCIR and CPI. Further, the amount of rise in the India VIX before the announcement is not statistically significant. A plausible explanation for this could be that announcements of monetary policy and inflation rates are underestimated by the investors.
Regression Estimation of Model 2
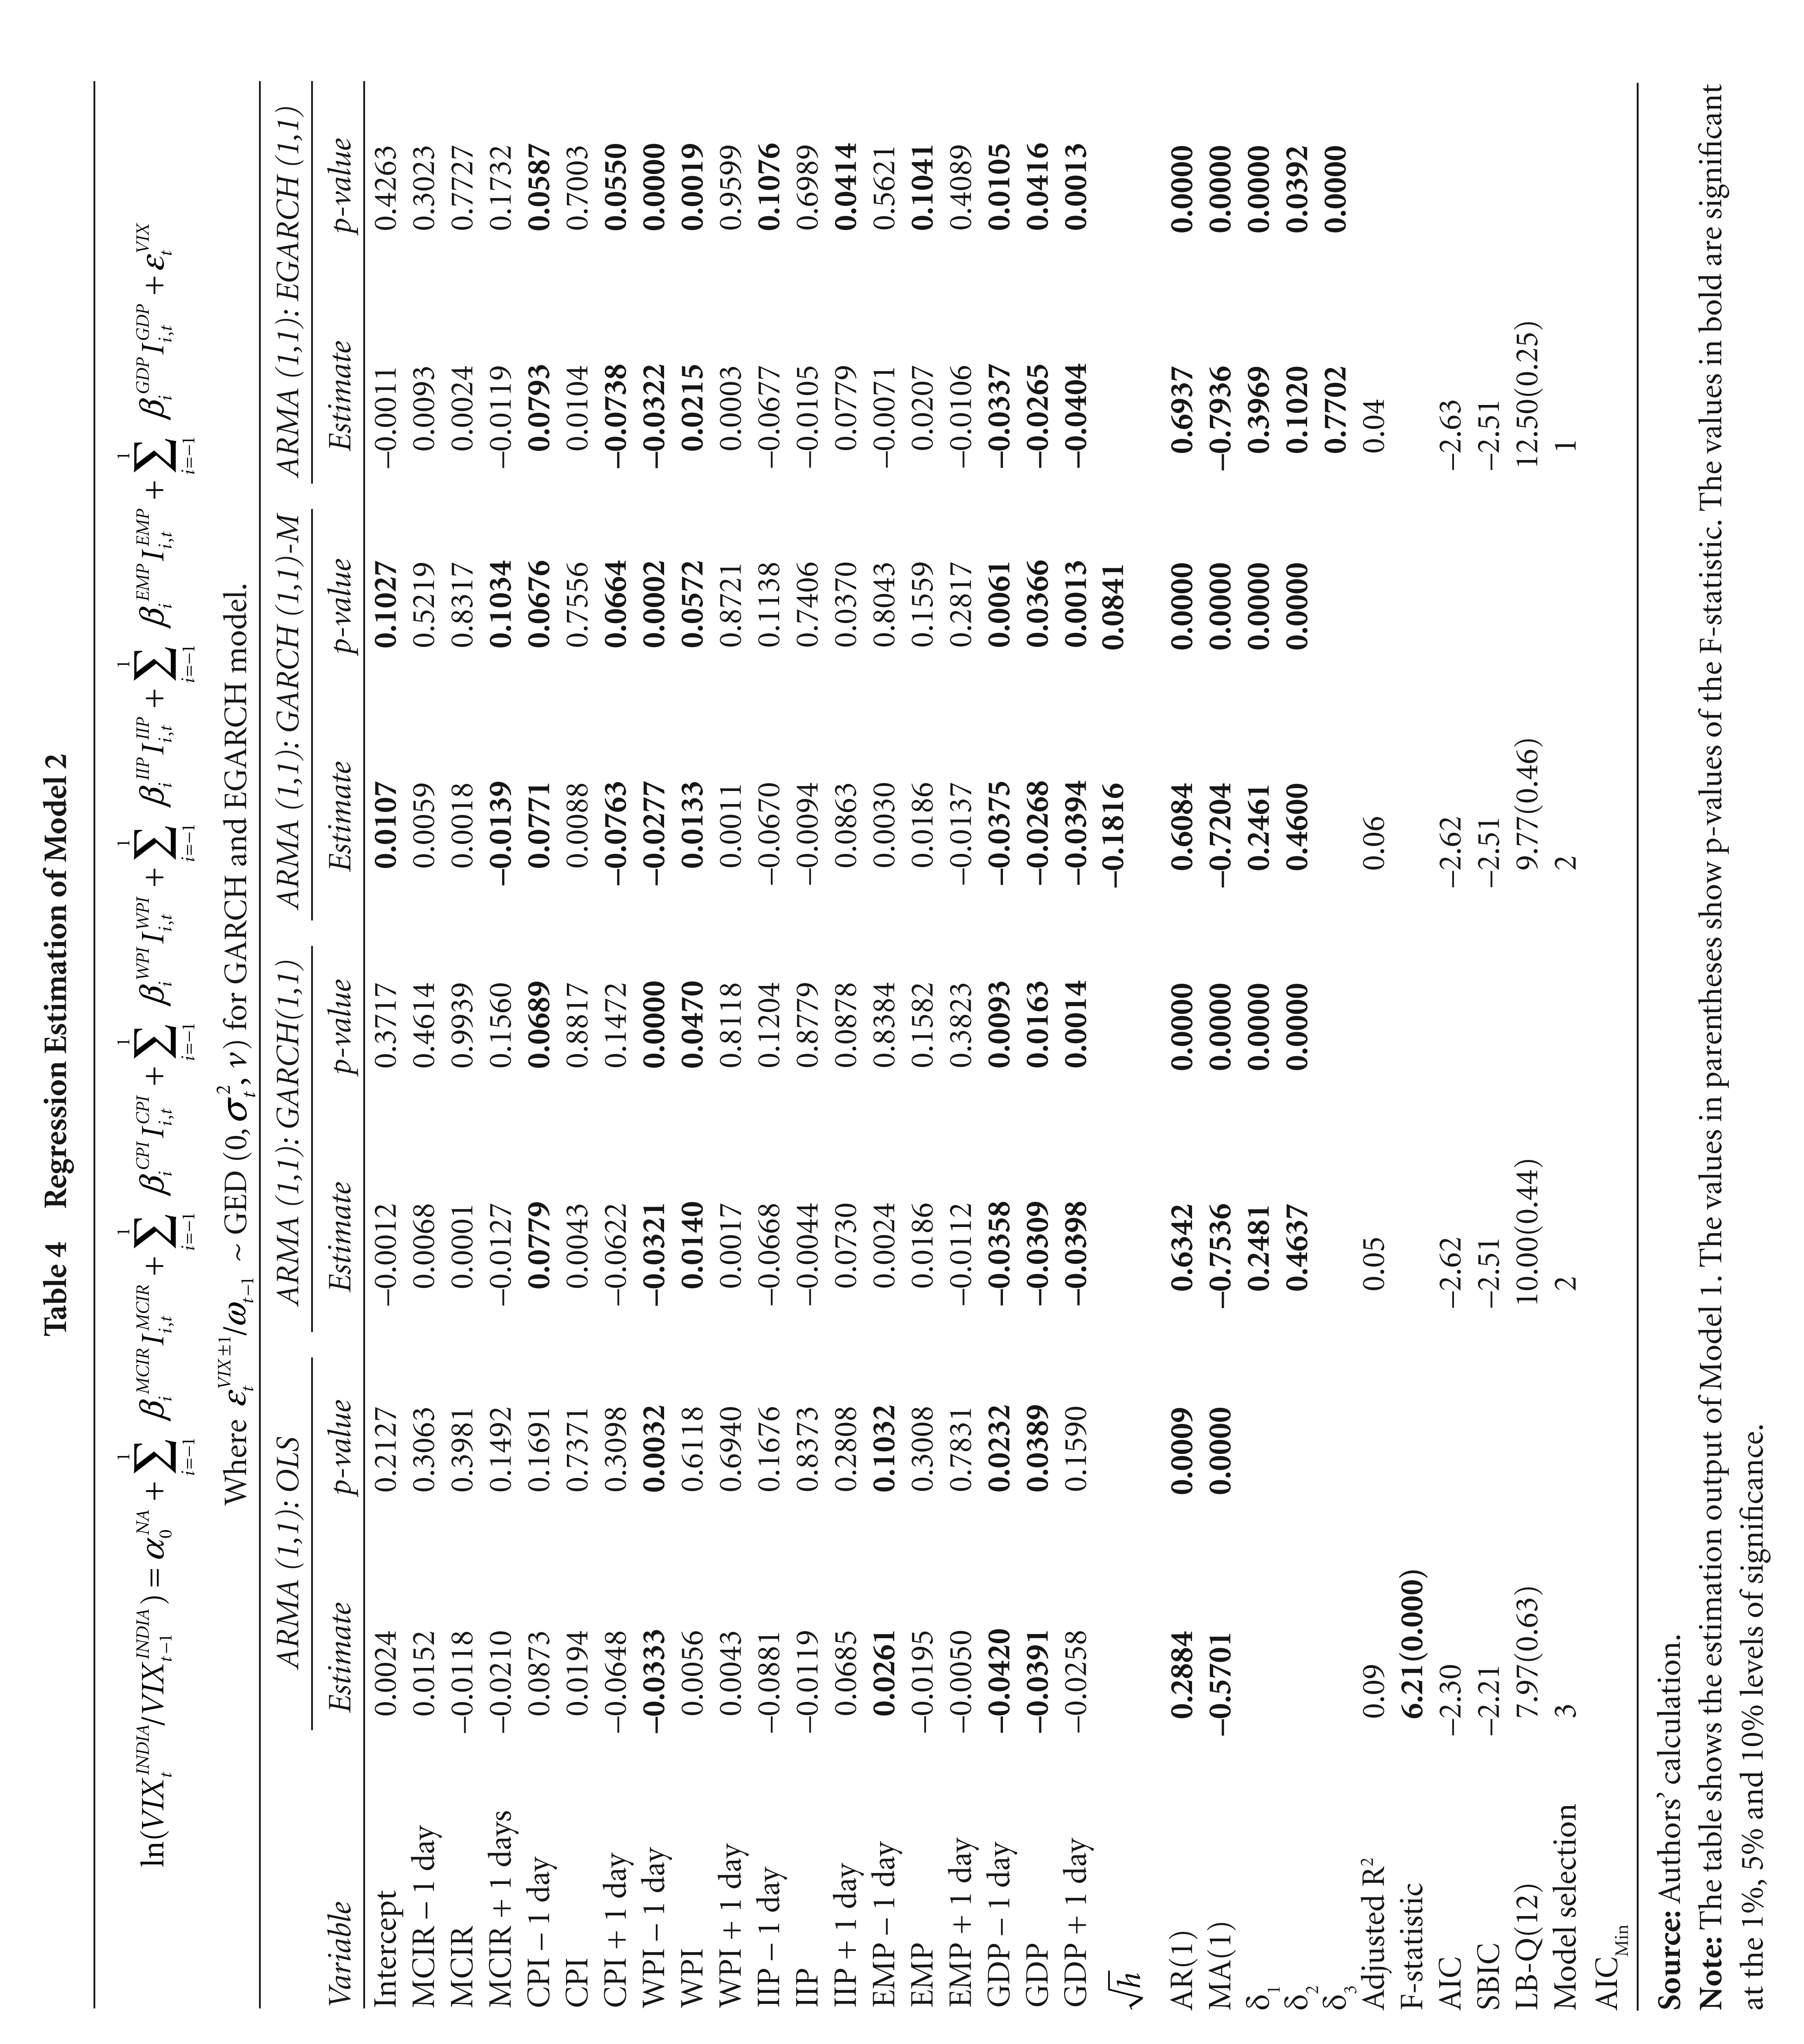
For the WPI (which is a proxy for inflation), the slope is –0.033 and significant, one day before the announcement. A potential explanation could be that inflation during these periods remains under control and, consequently, the India VIX keeps falling.
The results on the IIP reports are not statistically significant, implying that IIP announcements do not matter to trading volatility and profitable strategy. The results on employment are consistent with the literature and the formulated hypothesis: a day before announcements on employment, the India VIX is significant at the 10 per cent level; on the day of announcements it is negative but not significant; and the day after the announcement it falls to normal levels. Investor sentiment is thus more uncertain before the announcements and, once the results are known to everyone, they resume business as usual and, as a result, the India VIX falls to its normal level. The GDP results are statistically significant on the day of the report releases with a negative slope (–0.04). At this point, the results show that investors take into account GDP results in their portfolio planning.
Finally, according to the OLS results, the intercept and the parameters of the MCIR, IIP, Emp and GDP are estimated and are consistent with the literature. When the same OLS model is considered for the five-day window, only the MCIR and Emp are found to be statistically significant five days before the announcements, indicating that investors feel more uncertain about the information content of news on the RBI monetary policy statement and the employment rate.
According to the GARCH (1,1) model, the CPI (one day before the release of information) is found to be statistically significant and it was negative after the release, but not significant. This result is in compliance with past studies of Chen and Clements (2007) and Nikkinen and Sahlström (2004). In addition, the results of the announcements on the GDP growth rate a day before and after announcements, were found to be statistically highly significant. These results are, however, in contradiction of the study by Nikkinen and Sahlström (2004), who assume that before these announcements the VIX rises mechanically and returns to normal on announcement days.
Now, by introducing the conditional variance in the mean equation, the GARCH (1,1)-M has been estimated in Table 4. The estimate of the conditional variance (–0.18) is found to be statistically significant at the 10 per cent level, indicating that additional risk yields extra returns on the underlying stocks. Hence, this model shows that the VIX can be considered an index for volatility in trading. If the NSE introduces the India VIX futures (options), investors could make a profit from their hedging strategies. This market strategy would allow greater transparency and liquidity in the market.
An important finding of the GARCH (1,1)-M model is that the intercept is positive and significant [which is the findings from studies by Ederington and Lee (1996) and Nikkinen and Sahlström (2001, 2004)]. This implies that uncertainty rises before forthcoming macro news, thus the India VIX rises significantly before announcements. The GARCH-M model results on the MCIR, CPI, and Emp (before and after announcements) are as hypothesised and consistent with the literature, but for the WPI, IIP and GDP the results are in contradiction of the literature. A plausible reason could be the presence of information asymmetry. Therefore, the EGARCH (1, 1) model is employed to capture the leverage effect on the India VIX. In Table 4, the last column for all the parameters of the EGARCH (1,1) variance equation is found statistically significant, indicating that bad news has a more significant impact on the India VIX return than positive news.
Finally, the best model to explain the behaviour of the India VIX is the EGARCH model, which takes into account the leverage effect and asymmetric impact of information arrival in the market.The second most appropriate model could be either the GARCH (1,1) or the GARCH (1,1)-M.
4. SUMMARY AND CONCLUSIONS
This study investigates the behaviour of the India VIX during scheduled announcements on macroeconomic indicators—RBI monetary policy statements (MCIR), CPI, WPI, IIP, Emp and the GDP. These indicators have been chosen as announcement dummies and the period under study is from 2007M11 to 2012M05. This is the first such study in an emerging market like India. The empirical results show that the India VIX behaves like the VIX of developed markets.
It is observed that the India VIX rises significantly before the MCIR meeting of the RBI and becomes normal on the day of the report release. The impact of announcements relating to other macroeconomic indicators on the India VIX was also found to significant, especially those relating to the GDP.
The GARCH (1,1)-M model clearly shows that volatility trading provides an extra return on risky assets. The EGARCH (1,1) model, which account for leverage effects, confirms that bad news about macro indicators significantly impacts on the India VIX. The study of Nikkinen and Sahlström (2004) disregards the nature of news announcement and assumes the symmetric and mechanical impact of all macro announcements. In conditional variance all the parameters of the variance equation are found to be statistically significant, hence, volatility persists in the measurement of the India VIX return.
This study confirms that the India VIX significantly declines following scheduled GDP news, but rises on the announcement of monthly inflation rates (WPI). When the employment rate and GDP are in favour of the market, then the India VIX impounds these important results and falls by 2.8 per cent and 3.5 per cent, respectively. Further the finding that the joint effect of the MCIR, IIP, Emp and GDP is statistically significant (and negative), indicates that investors regard news on more than one macro indicator at a point of time.
The findings from this article can contribute to policy and strategy in two ways. First, it can impact profitable strategy. Since the India VIX is an ex-ante measure of future volatility, profits can be made by trading VIX futures (options). Second, through its impact on hedging and pricing; expected volatility can be used to price future options and help in portfolio selection. The study shows that there is a predictable movement in the India VIX around scheduled macroeconomic announcements. Hence, we believe that the NSE can launch futures on the India VIX for investors’ profitable strategy. The NSE could also develop some volatility products based on India VIX, which will provide liquidity and transparency in the market. This study provides preliminary evidence on the behaviour of the India VIX with macro news releases. The use of high-frequency data could give a more accurate analysis of the India VIX around macroeconomic announcements.
Footnotes
Scheduled Macroeconomic Announcements
| Time of News Release | Title of News | Full Name of the News | Source of News Release | Day-of-the-week |
||||
| Mon | Tue | Wed | Thu | Fri | ||||
| 11:00 am | MCIR | Monetary and Credit Information Review, of Reserve Bank of India | Reserve Bank of India | 1 | 15 | 1 | 6 | 12 |
| 11:00 am | CPI | Consumer Price Index | CSO, MOSPI | 23 | 8 | 8 | 5 | 9 |
| 11:00 am | WPI | Wholesale Price Index | CSO, MOSPI | 10 | 5 | 4 | 15 | 19 |
| 11:00 am | IIP | Index of Industrial Product | CSO, MOSPI | 6 | 7 | 6 | 4 | 18 |
| 11:00 am | EMP | Employment report | Ministry of Labour and Employment Bureau | 5 | 3 | 3 | 4 | 4 |
| 11:00 am | GDP | Gross Domestic Product | Ministry of Labour and Employment Bureau | 4 | 4 | 2 | 0 | 9 |
| Total | 49 | 42 | 24 | 34 | 71 | |||