



Abstract
This article examines whether large inflows of foreign direct investment (FDI) behave differently from smaller inflows in a sample of 56 developing countries for the period 1990–2017. We use the quantile regression method to investigate whether the responsiveness of FDI inflows to various push and pull factors differs across the conditional distribution of the former. Our results show that the magnitudes of the coefficients are significantly different across quantiles of FDI inflows for a number of covariates. That is to say, the coefficients are significantly larger for the upper quantiles compared to the lower ones. The interquantile regressions, which estimate the quantile differences, confirm the finding that large FDI inflows are more responsive to their covariates than smaller inflows. Our results suggest that large inflows of FDI are indeed different, both quantitatively and qualitatively, from smaller inflows. Therefore, it is necessary to investigate the causes of large and smaller inflows separately for a better understanding of the determinants of FDI inflows to developing countries.
Introduction
The world economy has become increasingly integrated through cross-border trade and investment. As a result, foreign direct investment (FDI) inflows to developing countries have increased drastically in the past two decades. 1 The inflows of FDI to developing countries have been episodic (Calvo, 1998). That is to say, there are periods of high and low inflows of foreign capital. Recent studies by Burger and Ianchovichina (2017), Forbes and Warnock (2012), and Ghosh, Qureshi, Kim, and Zalduendo (2014) examine the causes of surges (defined as sharp inflows of foreign capital) and stops (defined as slowdowns in capital inflows) in foreign capital inflows. It is well recognized that episodes of extreme capital movements are recurrent phenomena (Forbes & Warnock, 2012). Consequently, investigating the differential behaviours of large and smaller inflows of foreign capital is an important research question.
A good deal of research examines the fundamental factors determining FDI inflows into developing countries (Asiedu, 2002; Busse and Hefeker, 2007; Liargovas and Skandalis, 2012; Neumayer and Spess, 2005; Sahoo, 2012; Sahoo, Nataraj, & Dash, 2014). The existing literature provides a long list of determinants of FDI inflows, broadly categorized as push and pull factors. The push factors include global economic conditions, which are beyond the control of individual economies. Researchers typically use world output growth (a measure of world economic activity), long-term interest rate in developed countries and global risk aversion (which measures global economic uncertainty) as the push factors. The pull factors represent attractiveness of the host country as an investment destination. Specifically, the recipient country’s characteristics such as market size, infrastructure, human capital and natural resources are considered as the pull factors for foreign investment. The relationship between the host country’s political institutions (for instance, political stability and rule of law) and inward flow of FDI is well established in the literature. Several empirical studies have demonstrated that strong institutions in the recipient country attract more FDI (Buchanan, Le, & Rishi, 2012; Daude & Stein, 2007; Gani, 2007; Wheeler & Mody, 1992).
Although several studies examine the determinants of FDI inflows, no systematic effort has been made to investigate the behaviour of large inflows vis-a-vis inflows of a smaller size. We fill this gap in the literature by examining the differential impacts of the covariates across FDI inflows distribution. In this article, we examine the responsiveness of FDI inflows to its determinants across the distribution of the former using the quantile regression (QR) method. Simply put, we estimate the effects of the covariates at different quantiles of the FDI inflow distribution. Then, we test whether the coefficients are significantly different across quantiles. Our findings suggest that the coefficients are significantly large for the higher quantiles. Further, the results of the interquantile regressions (IQR) reconfirm the previous findings.
The remainder of the article is structured as follows. In Section 2, we present stylized facts on FDI inflows to developing countries. Section 3 describes the empirical framework. In Section 4, we discuss the QR results. The article is concluded in Section 5.
FDI Inflows to Developing Countries: The Stylized Facts
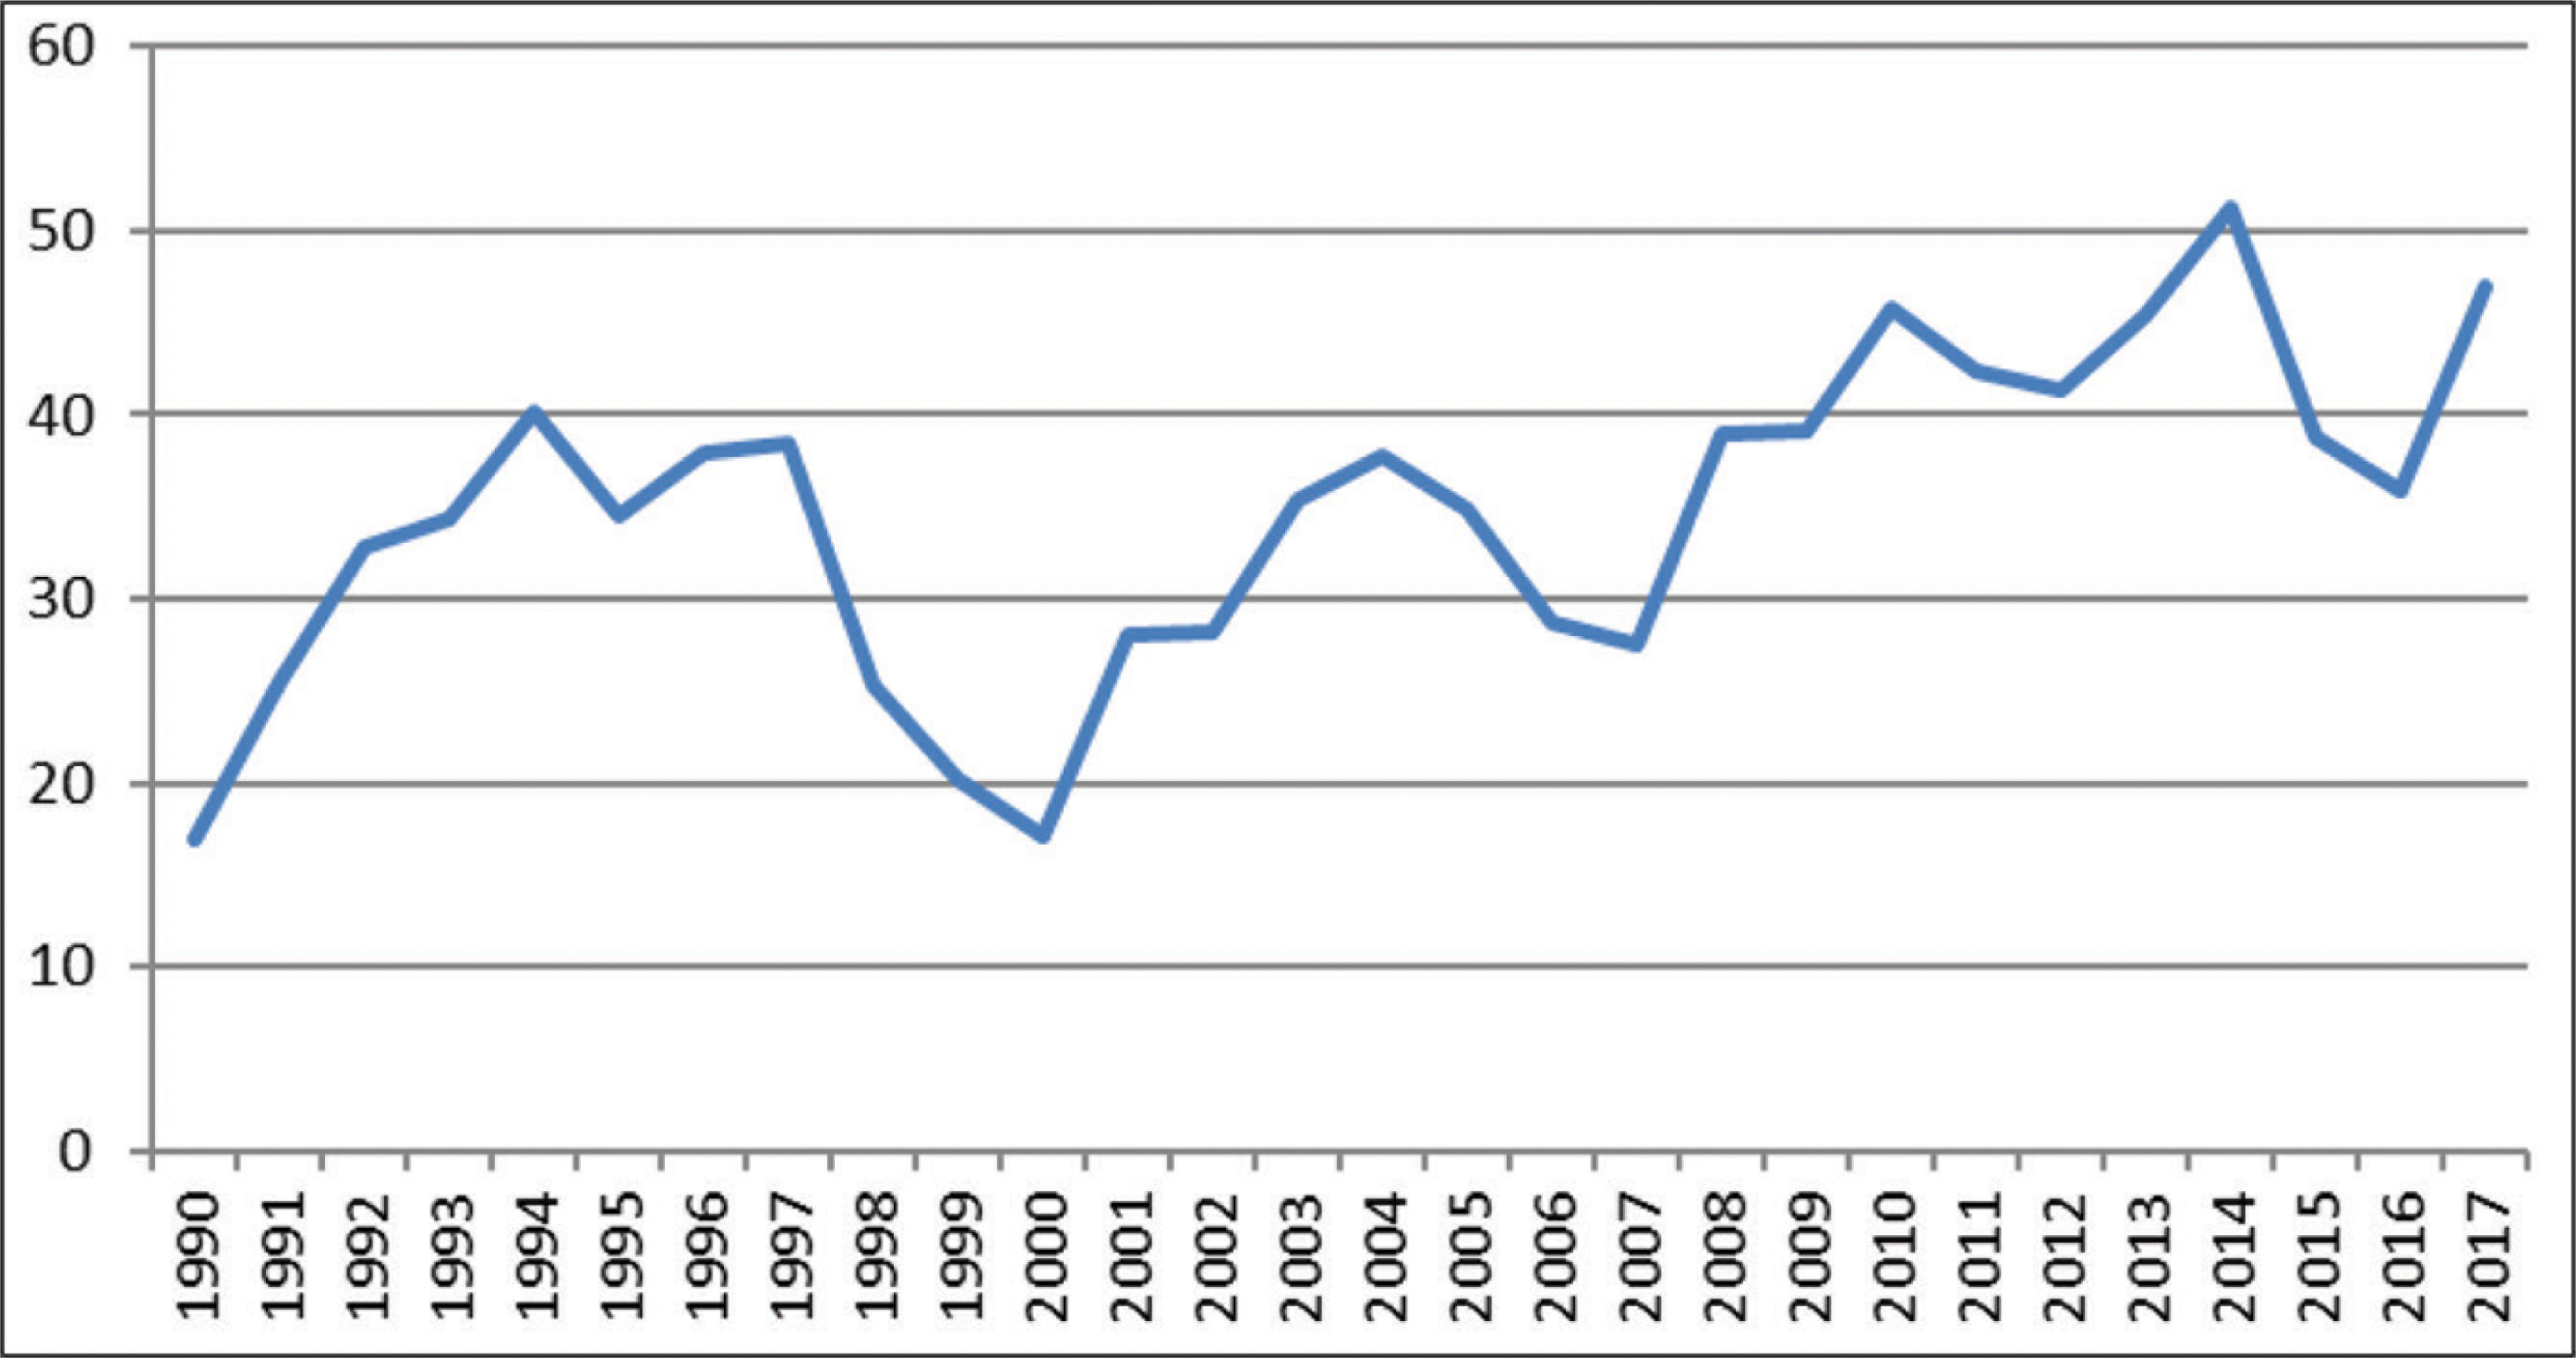
The share of developing countries in world total FDI inflows is increasing over time from 16.9 per cent in 1990 to 46.9 per cent in 2017 (Figure 1). However, the country-level data show an uneven distribution of inbound FDI among individual economies. Average FDI inflows to developing countries as a whole for the period 1990–2017 is 2.4 per cent of gross domestic product (GDP). Figure 2 depicts the trend of the FDI/GDP ratio for the developing country group. It is clear from the graph that the ratio has increased over the 1990s, and after a brief decline during 2000–2002 (primarily owing to the Asian financial crisis), it started increasing again from 2003 to 2007. The ratio has been declining since the onset of the global financial crisis in 2008. Further, a few countries have received a major fraction of total FDI inflows to developing countries during 1990–2017. For instance, the top 10 recipient countries draw more than 55 per cent of total FDI coming to developing countries 2 (see Table A1 in the Appendix).

Data
Our sample includes 56 developing countries, which have populations over 10 million and for which FDI inflow data are available for the entire period of the study, 1990–2017 (see Appendix). We use the normalized measure of FDI inflows (i.e., FDI inflows as a percentage of GDP) to account for the size of the economy, since larger economies are expected to receive higher amounts of FDI. Following the FDI literature, we have considered a number of factors that influence FDI inflows. We classify the determinants under global factors (known as push factors) and domestic factors (pull factors). The push factors represent external conditions (i.e., economic scenarios) that are beyond the control of individual economies. The pull factors represent the recipient country’s characteristics that influence the ability of a country to attract foreign investment. The global factors include world economic activity, the long-term risk-free interest rate in developed countries and global risk aversion.
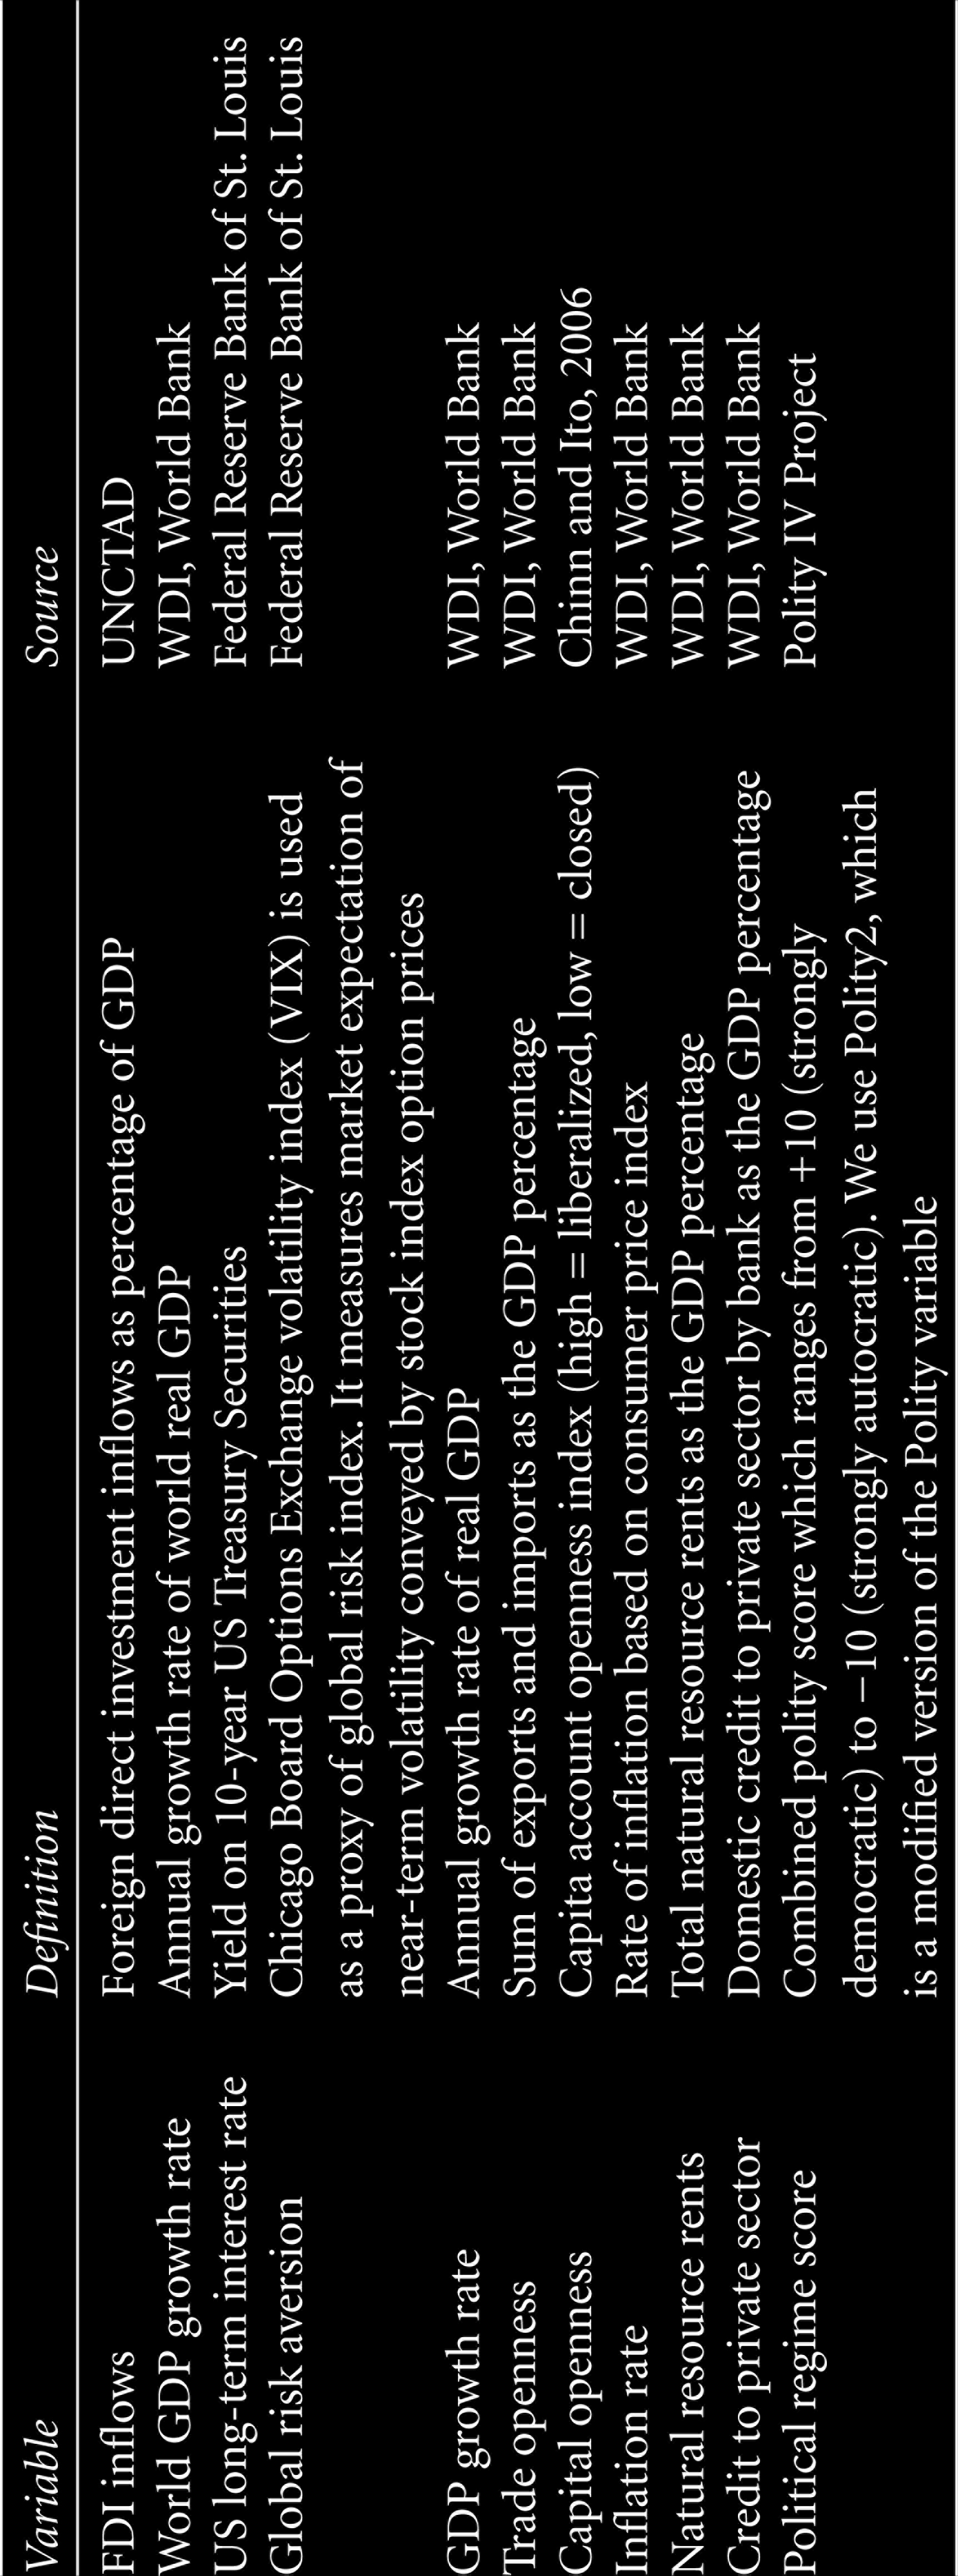
We have used suitable proxies for these variables in our analysis. For instance, world output growth is used as a measure of world economic activity, the yield on 10-year US treasury securities is used as a proxy for the long-term interest rate in developed countries and the volatility of Standard and Poor’s index options is used as a proxy for global risk aversion. The domestic factors include real GDP growth rate, trade openness (or capital openness index), natural resource rents (a proxy for the availability of natural resources), the political regime score (a measure of political stability) and domestic credit to the private sector (a proxy for financial development). The precise definitions of the variables and data sources are shown in Table A2 in the Appendix.
Estimation Method
We use the QR method (Koenker, 2005; Koenker & Bassett, 1978) to estimate the differential impacts of the push and pull factors on FDI inflows across the conditional distribution of the later (the response variable). The QR method has several advantages over the conventional ordinary least squares (OLS) regression method. The OLS regression estimates the conditional mean of the dependent variable as a function of one or more independent variables, whereas the QR provides a complete description of the relationship between the dependent and independent variables.
In simple words, the QR shows the association between the response variable and covariates across the conditional distribution of the former. Unlike the OLS regression, a QR is a semiparametric method. It does not require assumptions about the parametric distribution of the error process. Furthermore, the QR is robust to outliers in the data. It assigns different weights to deviations between the predicted values by the regression line and actual values and then minimizes the sum of weighted deviations. For example, a 75th per centile regression fits a regression line through the data so that 75 per cent of the observations are below the regression line and 25 per cent are above. In a QR, the estimated coefficient represents the change in a specified quantile of the response variable produced by a one-unit change in the predictor variable. This allows the researcher to compare the coefficients at different percentiles of the response variable. The QR can be specified as follows:

where FDIit denotes FDI inflows as a percentage of GDP to country i at time j; G and D denote the global ‘push’ and domestic ‘pull’ factors, respectively; α represents the constant term; Ԑit is the random error term and q indicates different quantiles/percentiles of the FDI inflow distribution. The pull factors include a range of country characteristics that represent the macroeconomic condition of the recipient economy. The push factors primarily represent the economic environment in the developed world. We use the lagged values of the domestic factors to deal with reverse causality in the model. The global factors are common across recipient countries. Therefore, we do not include time-fixed effects but control for region-specific effects by using region dummies. 3 We estimate two different versions of the model specified in Equation (1) to examine the sensitivity of the results. One set of regressions are run without region dummies, and the other set of regressions include region dummies. Furthermore, we substitute a capital openness index for the trade openness to check the sensitivity of our results. 4
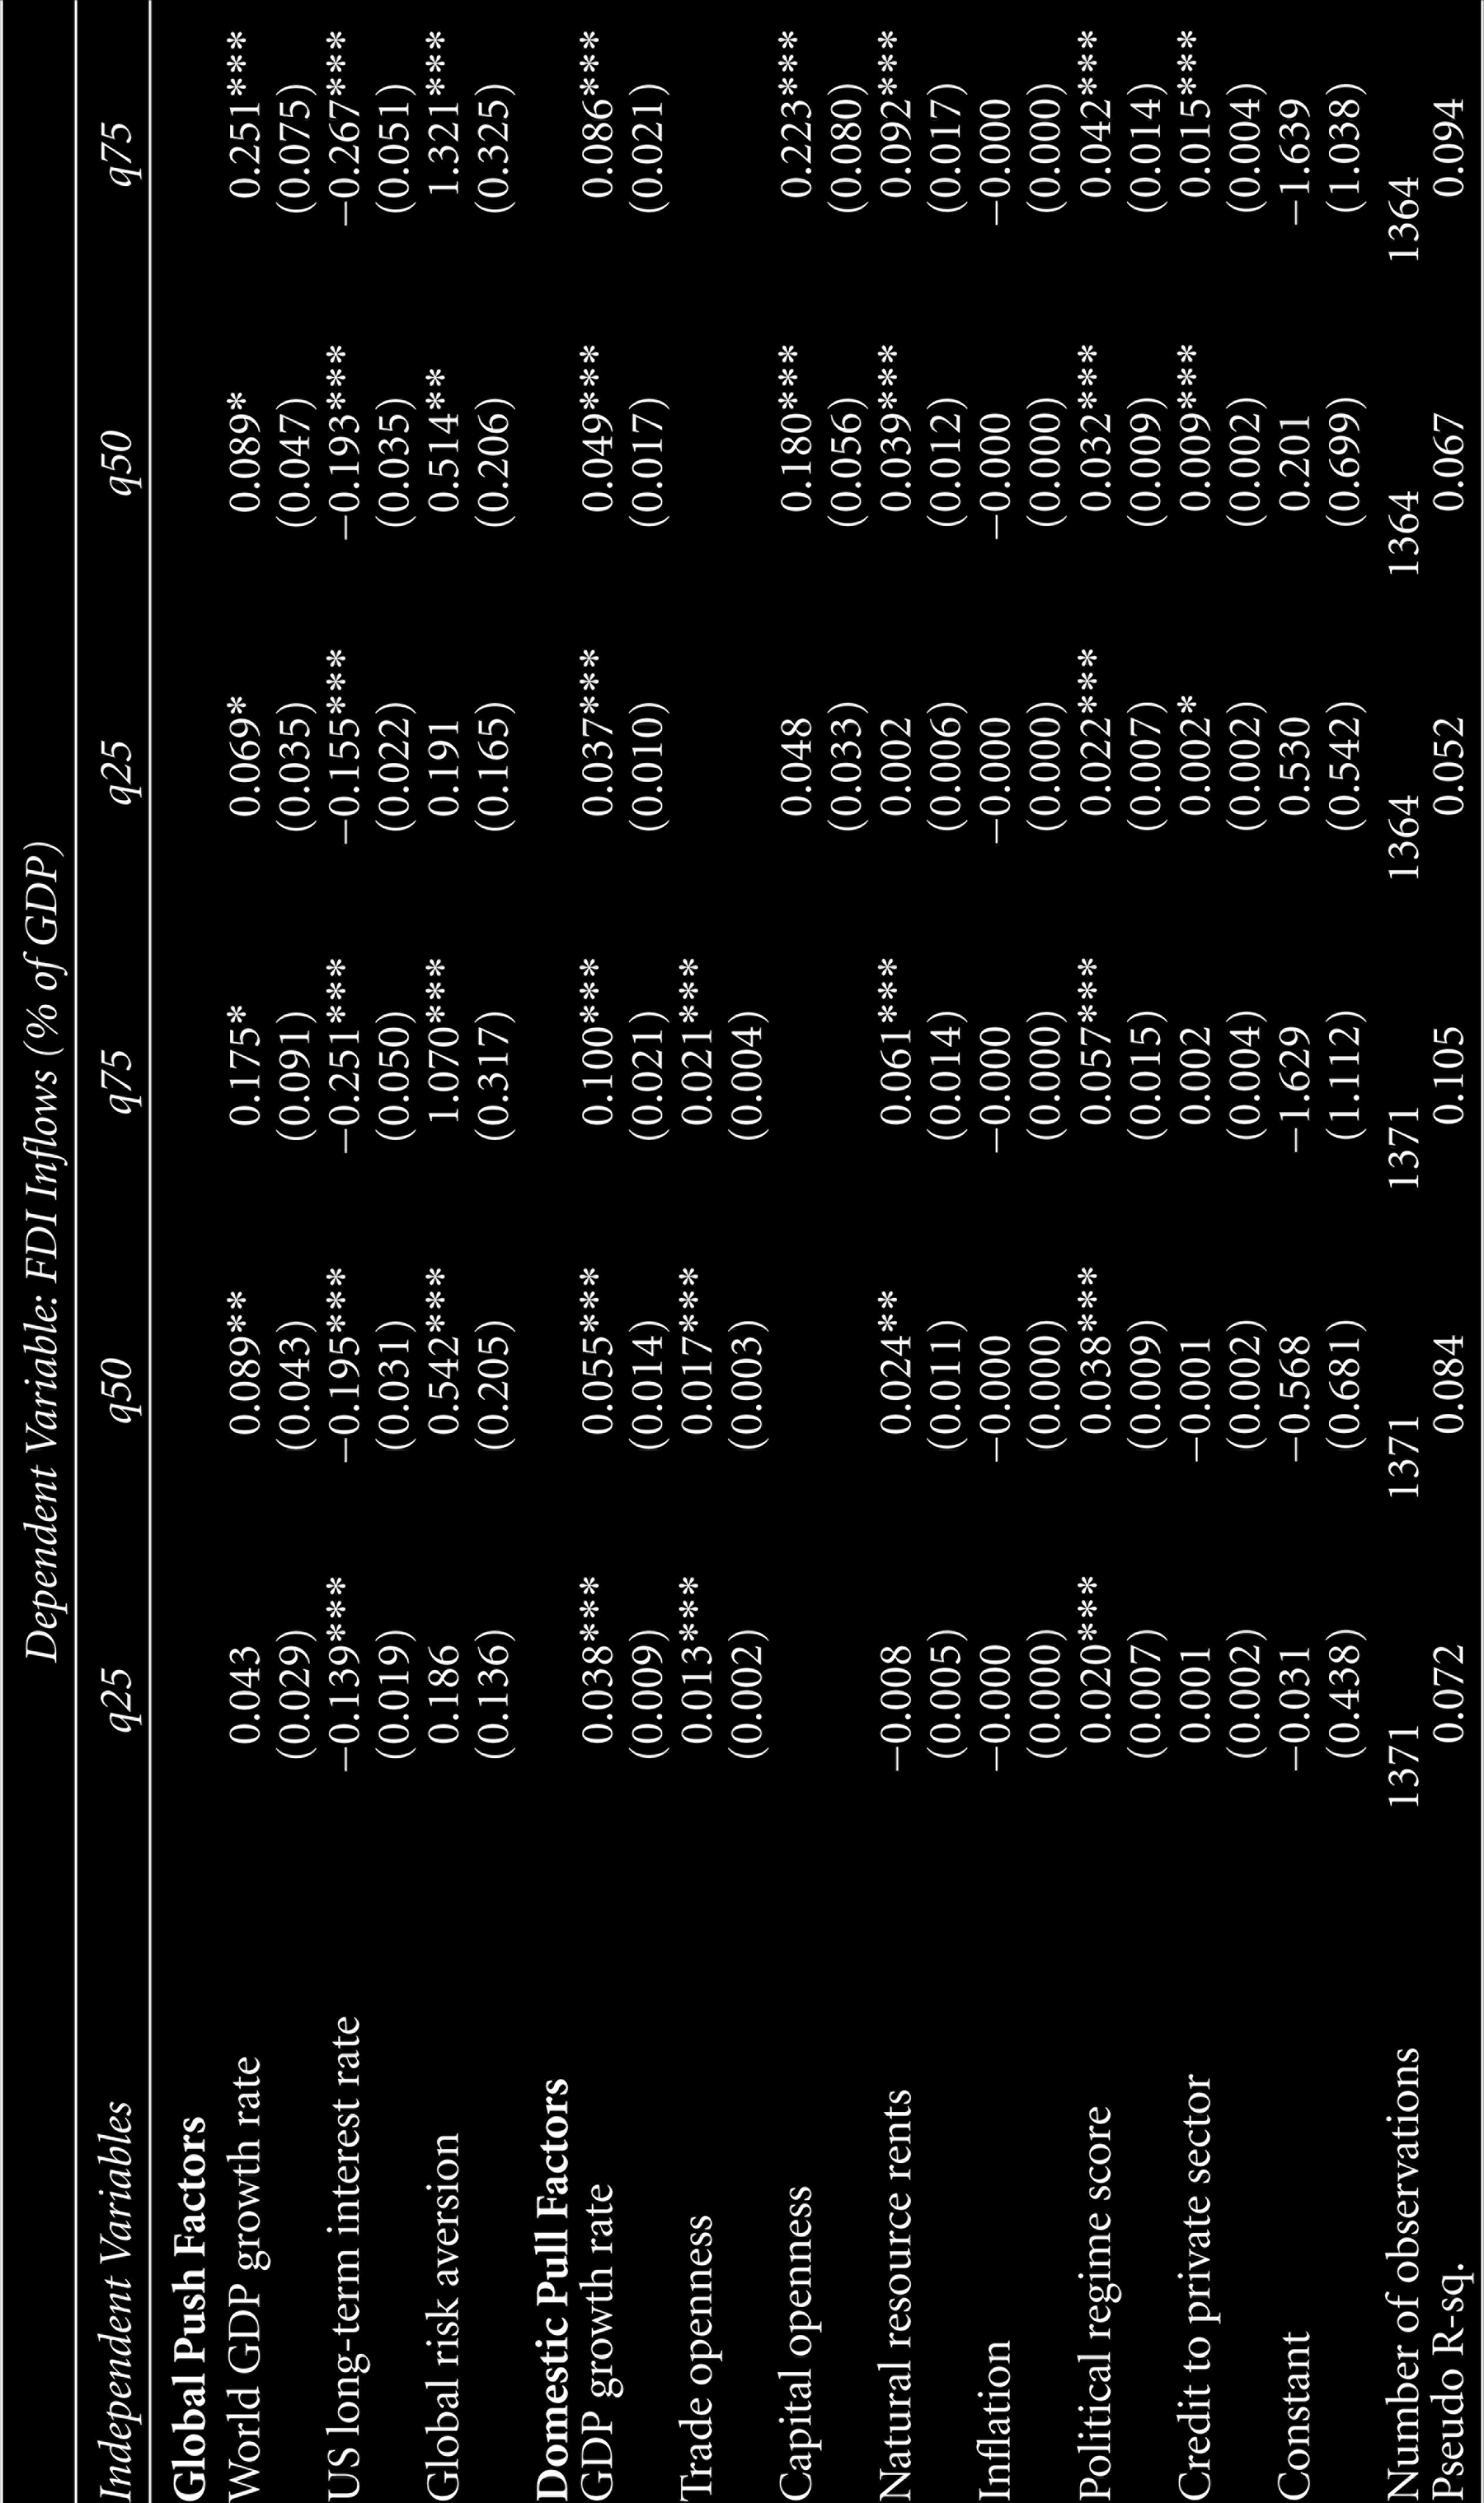
We estimate Equation (1) for each quantile simultaneously and obtain an estimate of the entire variance-covariance matrix, which allows us to perform hypothesis tests on the equality of coefficients across equations. We first estimate the model on pooled data without taking into account the region-specific effects. The results are shown in Table 1.
As evident from these results, the push factors such as world output growth, the long-term US interest rate and global risk aversion are significant determinants of FDI inflows to developing countries. World output growth has a positive impact, while the US long-term interest rate reduces FDI inflows to developing countries.
The positive coefficient on world output growth suggests that FDI inflows to developing countries are procyclical (i.e., FDI inflows to developing countries increase with an expansion in world economic activity). An increase in the long-term interest rate in developed countries significantly reduces FDI inflows to developing countries. In other words, an increase in the return on risk-free investment reduces capital flows to developing countries. Further, our results suggest that an increase in global risk aversion has a positive impact on FDI inflows to developing countries. This finding seems contrary to the commonly accepted view that developed countries are safe havens during an economic crisis. One possible reason for this could be that at the time of global economic uncertainty, investors pull out from short-term investment of a liquid nature and place their funds in fundamental and long-term physical investment like FDI. Our finding is consistent with that of Eichengreen, Gupta, and Masetti (2017) and Rey (2015), which suggest that global market uncertainty is less likely to have negative impact on FDI flows.
The domestic factors such as economic growth, trade openness/capital openness, natural resource rents, political regime score and domestic bank credit to private sector have a positive impact on FDI inflows. However, economic growth, trade openness and political regime in the host country are the most significant predictors of FDI inflows. These variables are found to be statistically significant in all the QRs (see Table 1). We find that the abundance of natural resources in the destination country is a significant determinant of large FDI inflows: the variable ‘natural resource rents’ is found to be statistically significant in the 50th and 75th percentile regressions. In other words, natural resource-rich countries are able to attract large amounts of physical capital from abroad. An increase in bank credit to the private sector (a proxy measure of financial development) increases FDI inflows to the host country. However, this variable is not significant in all the specifications.
Quantile Regression Results
Quantile Regression Results
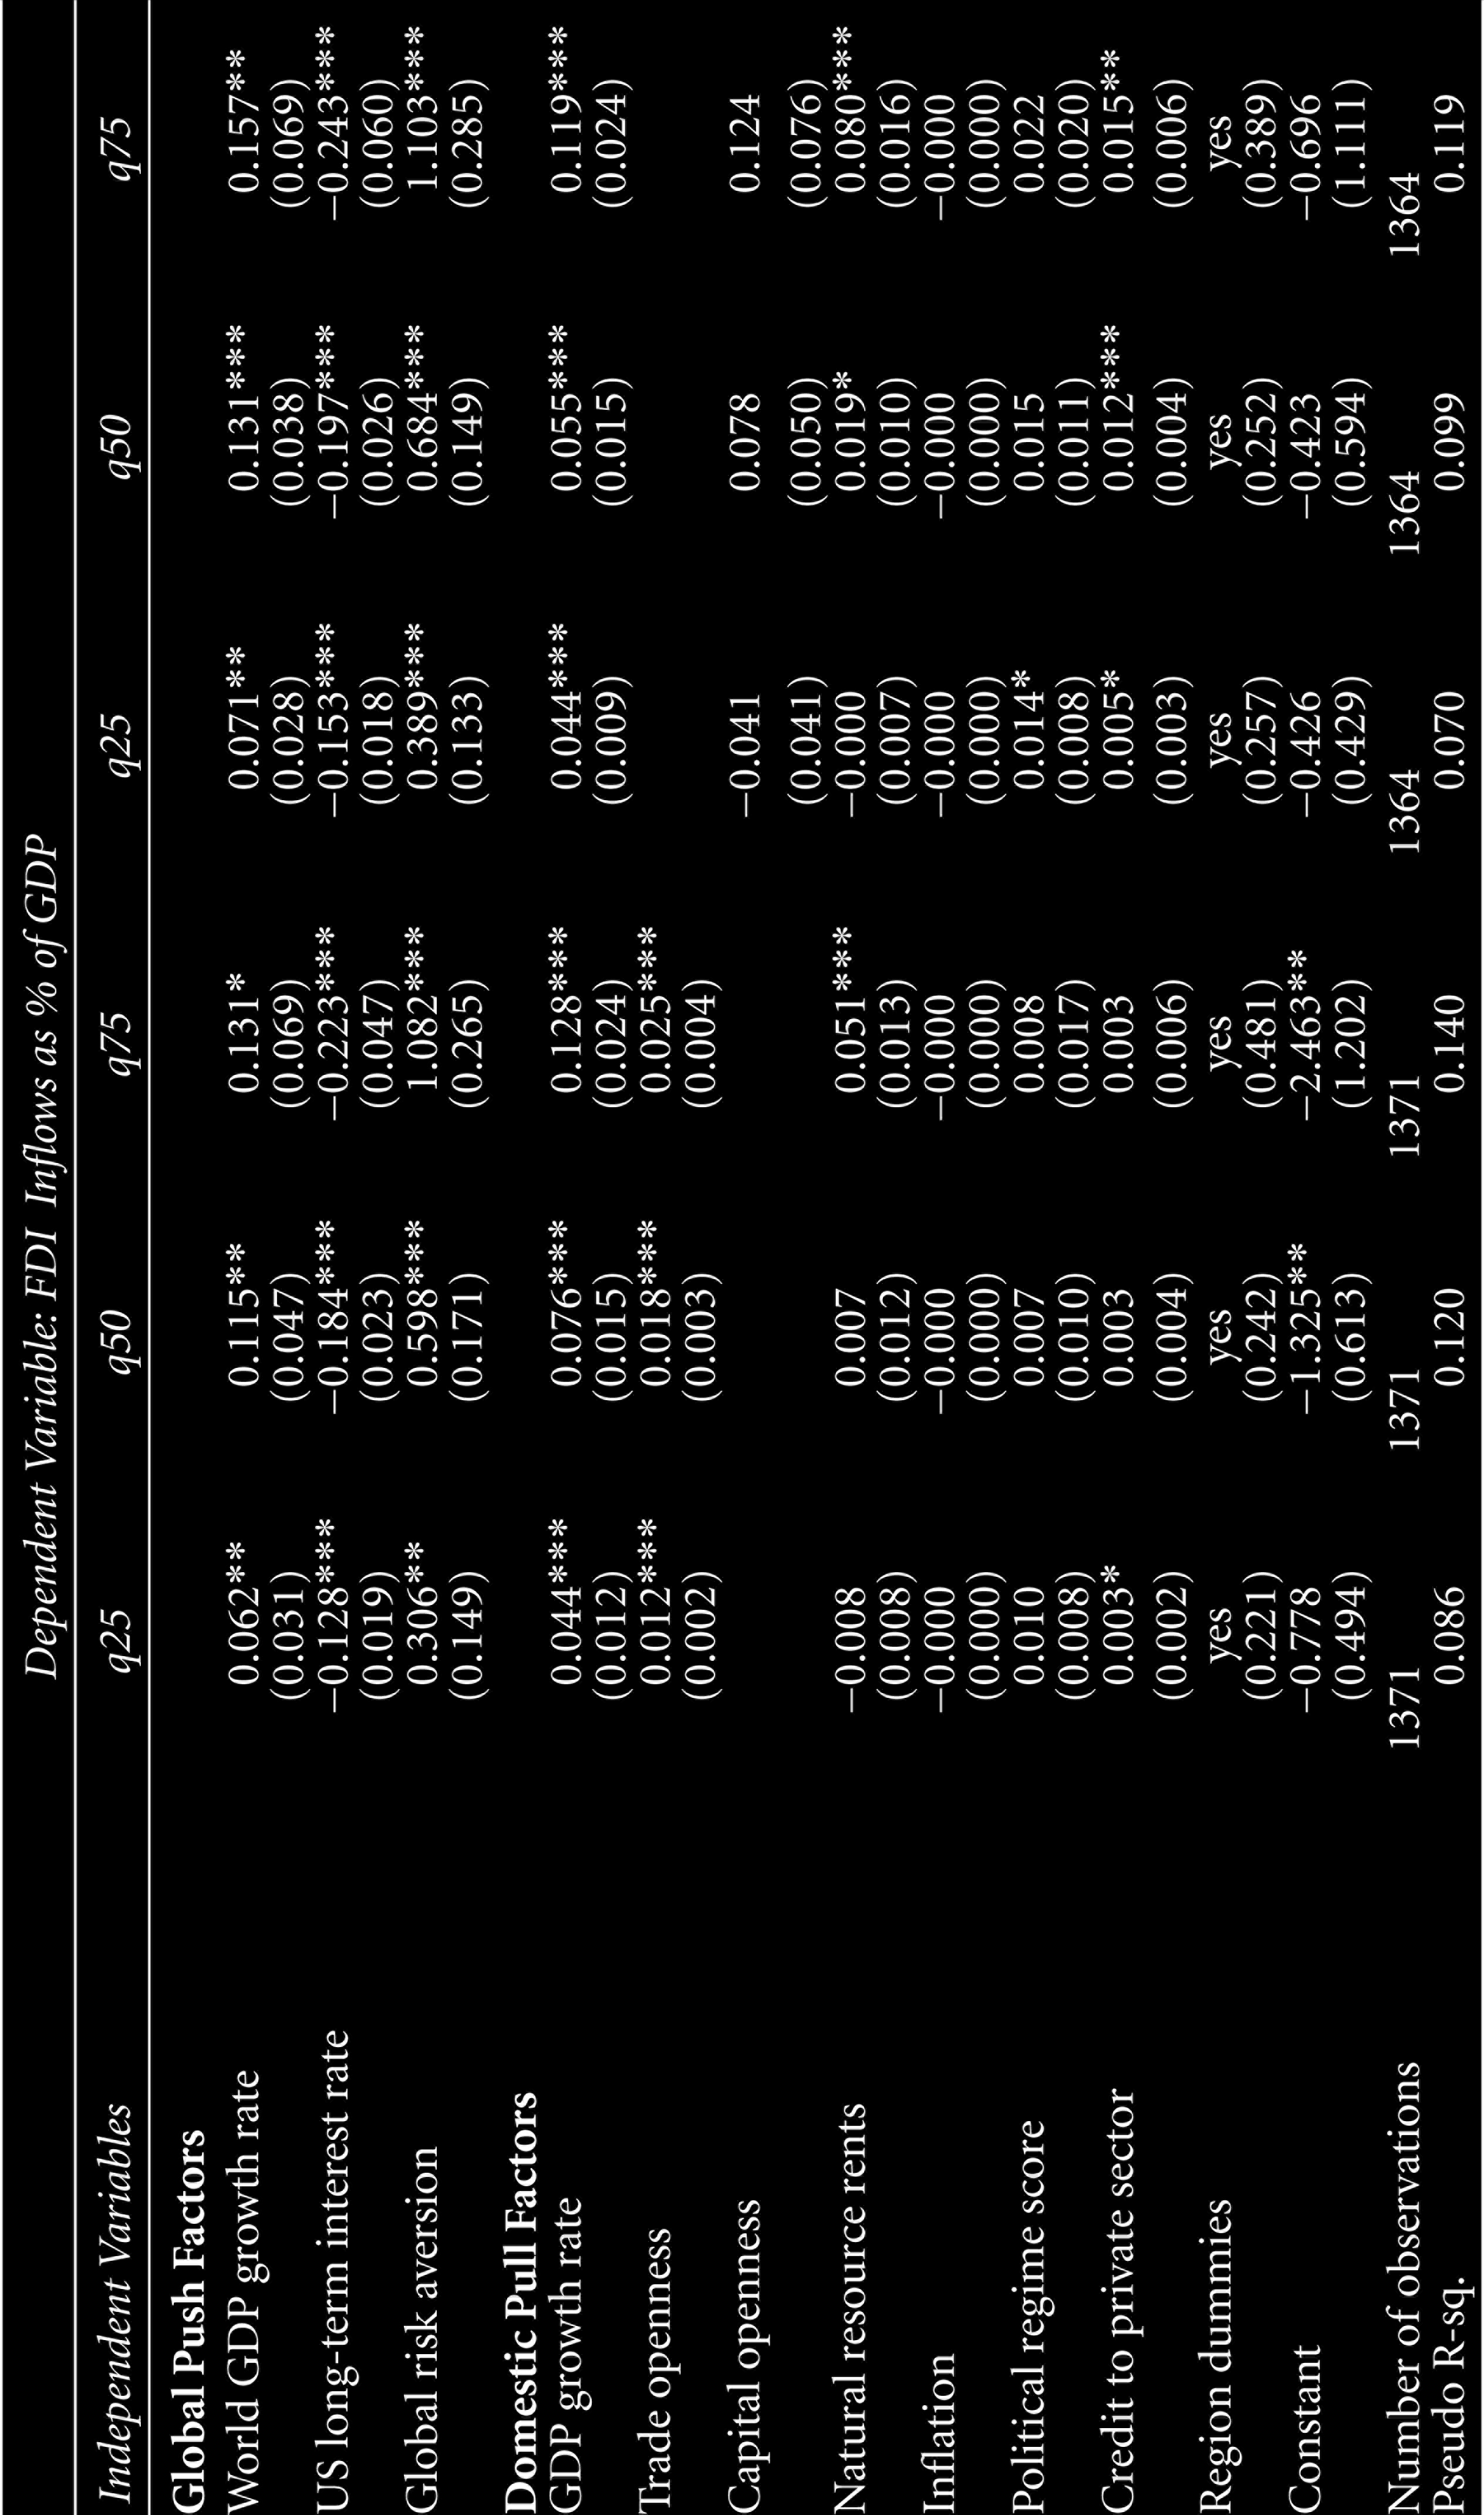
As a test of robustness, we also run the QRs controlling for region-specific effects (the results are reported in Table 2). The results are quite similar to our earlier findings. The global factors such as world output growth, long-term interest rate and global risk aversion are statistically significant in all the QRs (i.e., 25th, 50th and 75th percentile regressions). Among domestic factors, the GDP growth rate and trade openness are the robust determinants of FDI inflows. Natural resource is significant only in case of the 75th percentile regression. After controlling for region-specific effects, we find that political regime is not a robust factor to explain large inflows of foreign investment. In addition, although financial development has a positive effect on FDI inflows, it is not significant in all the specifications.
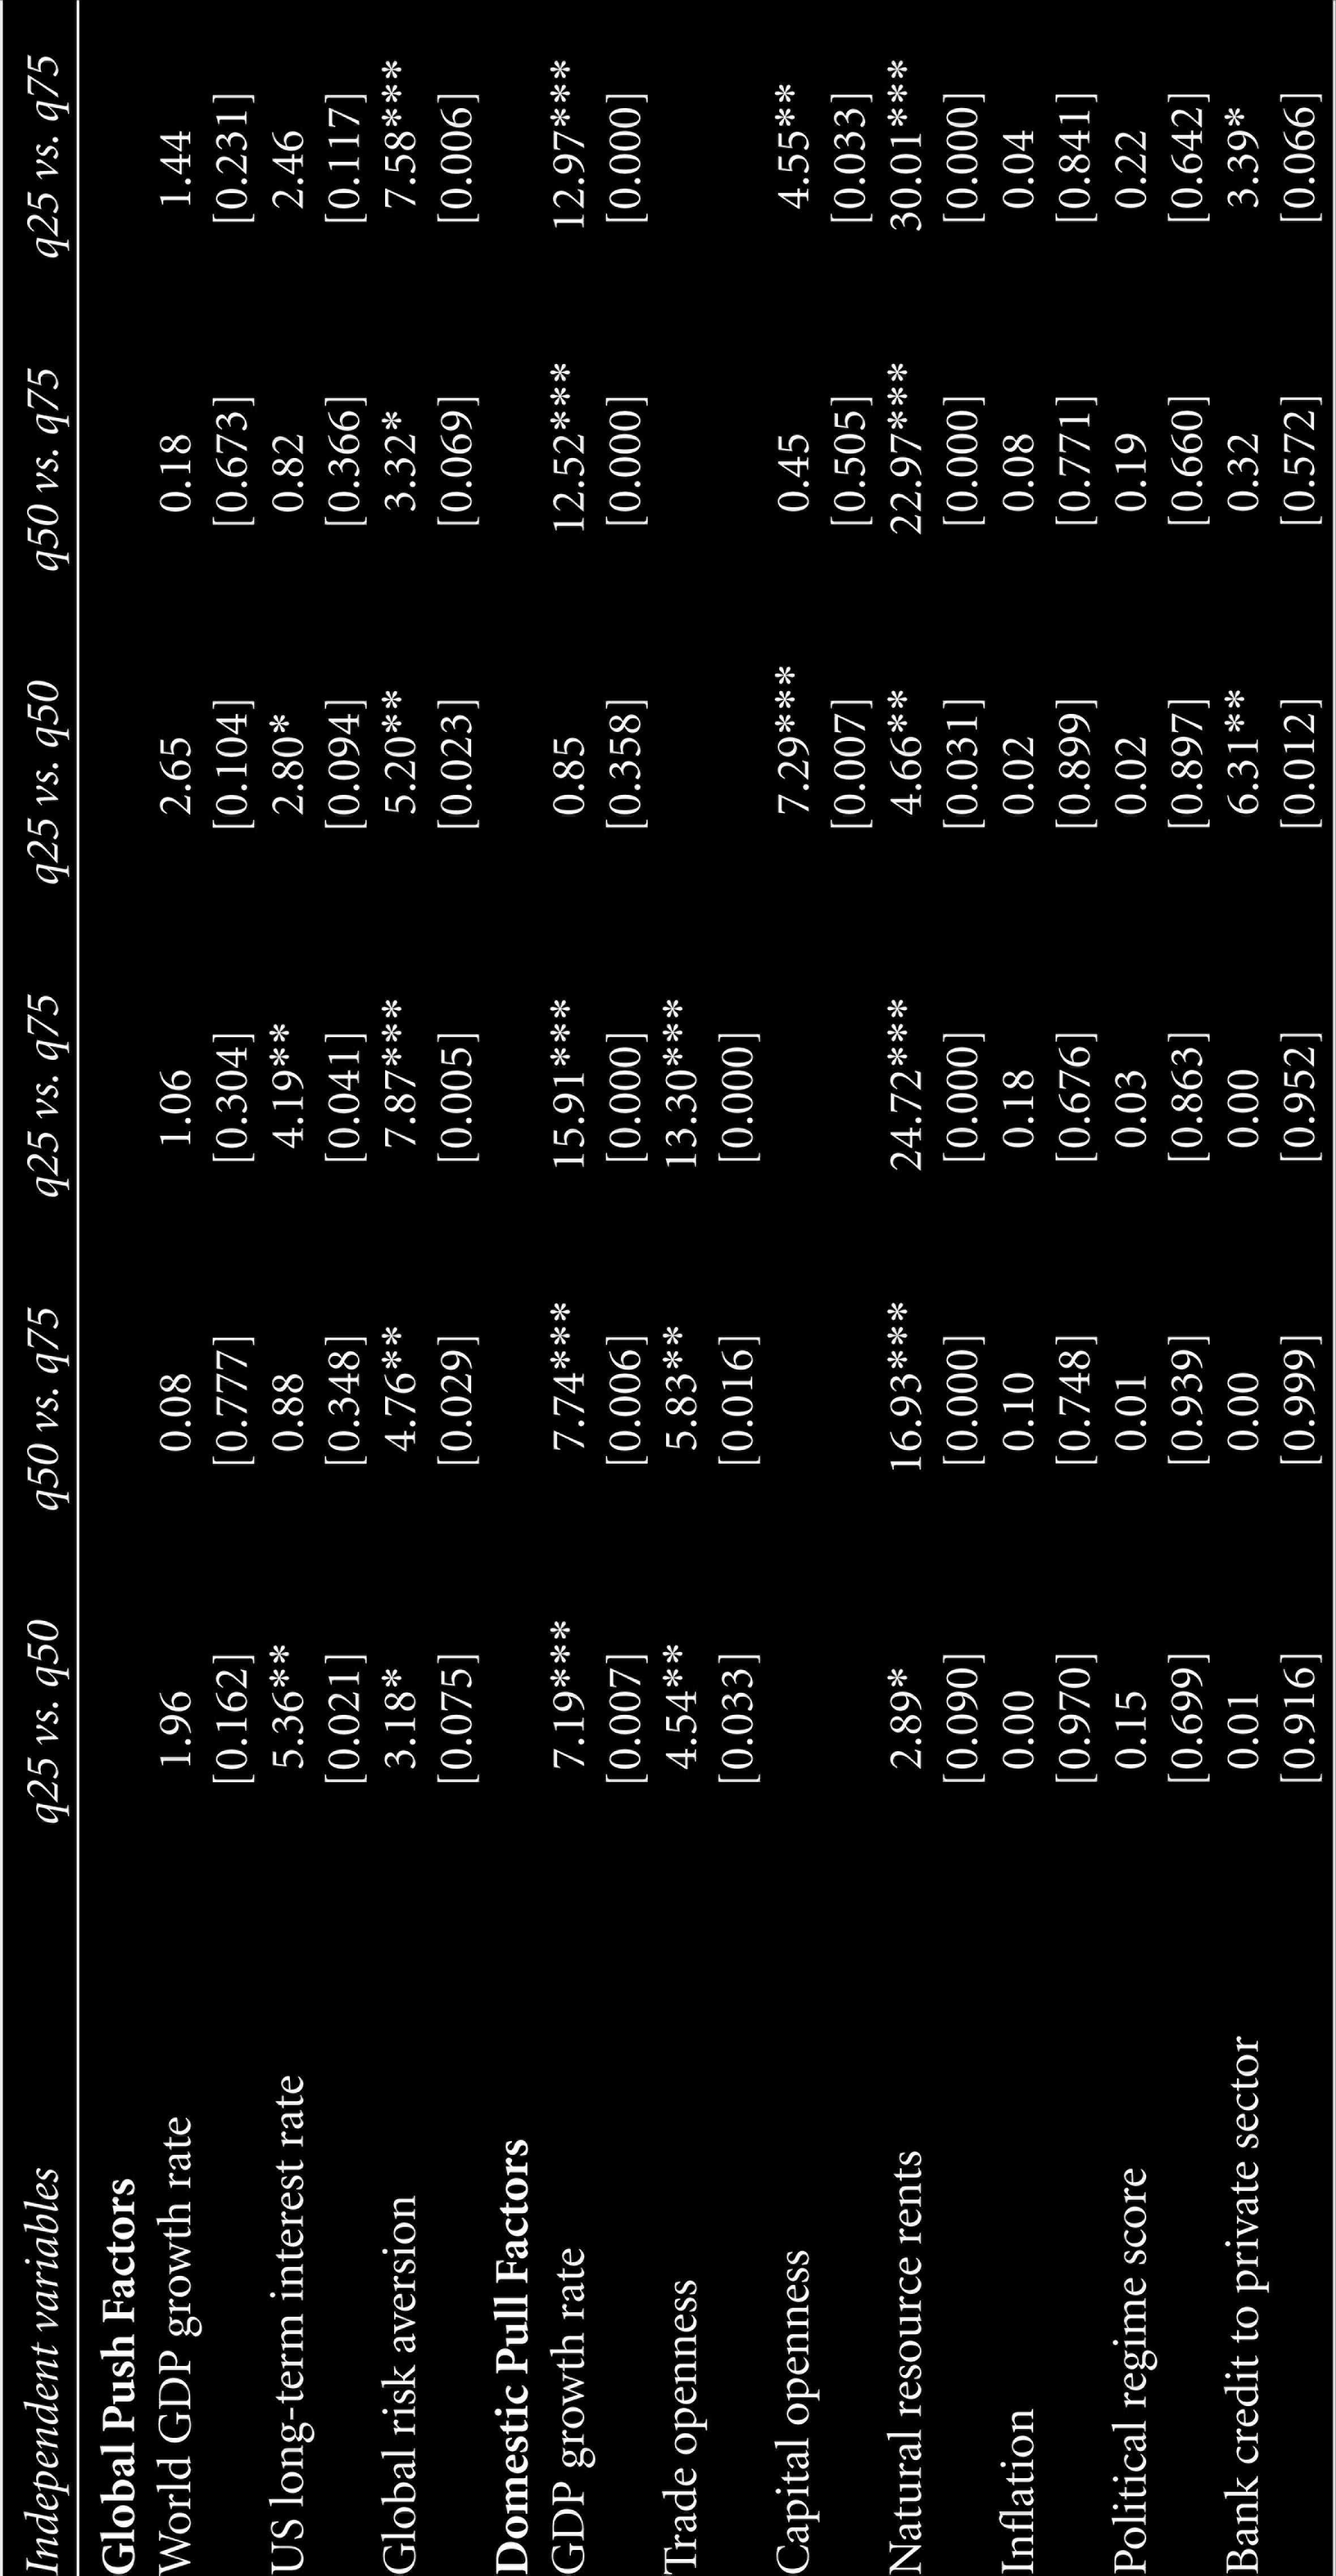
One interesting observation from the QR results is that the coefficients are larger at higher quantiles. Subsequently, we test if the coefficients from two distinct quantiles are significantly different from each other. We perform a hypothesis test to examine the equality of coefficients from two different quantiles. Specifically, we compare the respective coefficients across the quantiles (i.e., 25th vs. 50th percentile, 50th vs. 75th percentile and 25th vs. 75th percentile). We find that the coefficients are significantly different in several instances (see Tables 3 and 4). Table 3 shows the results for the QRs on pooled data, and Table 4 shows the results that of the QRs with region dummies.
Results from Quantile Regressions with Region Effects
Testing the Equality of Coefficients (F-Statistics)
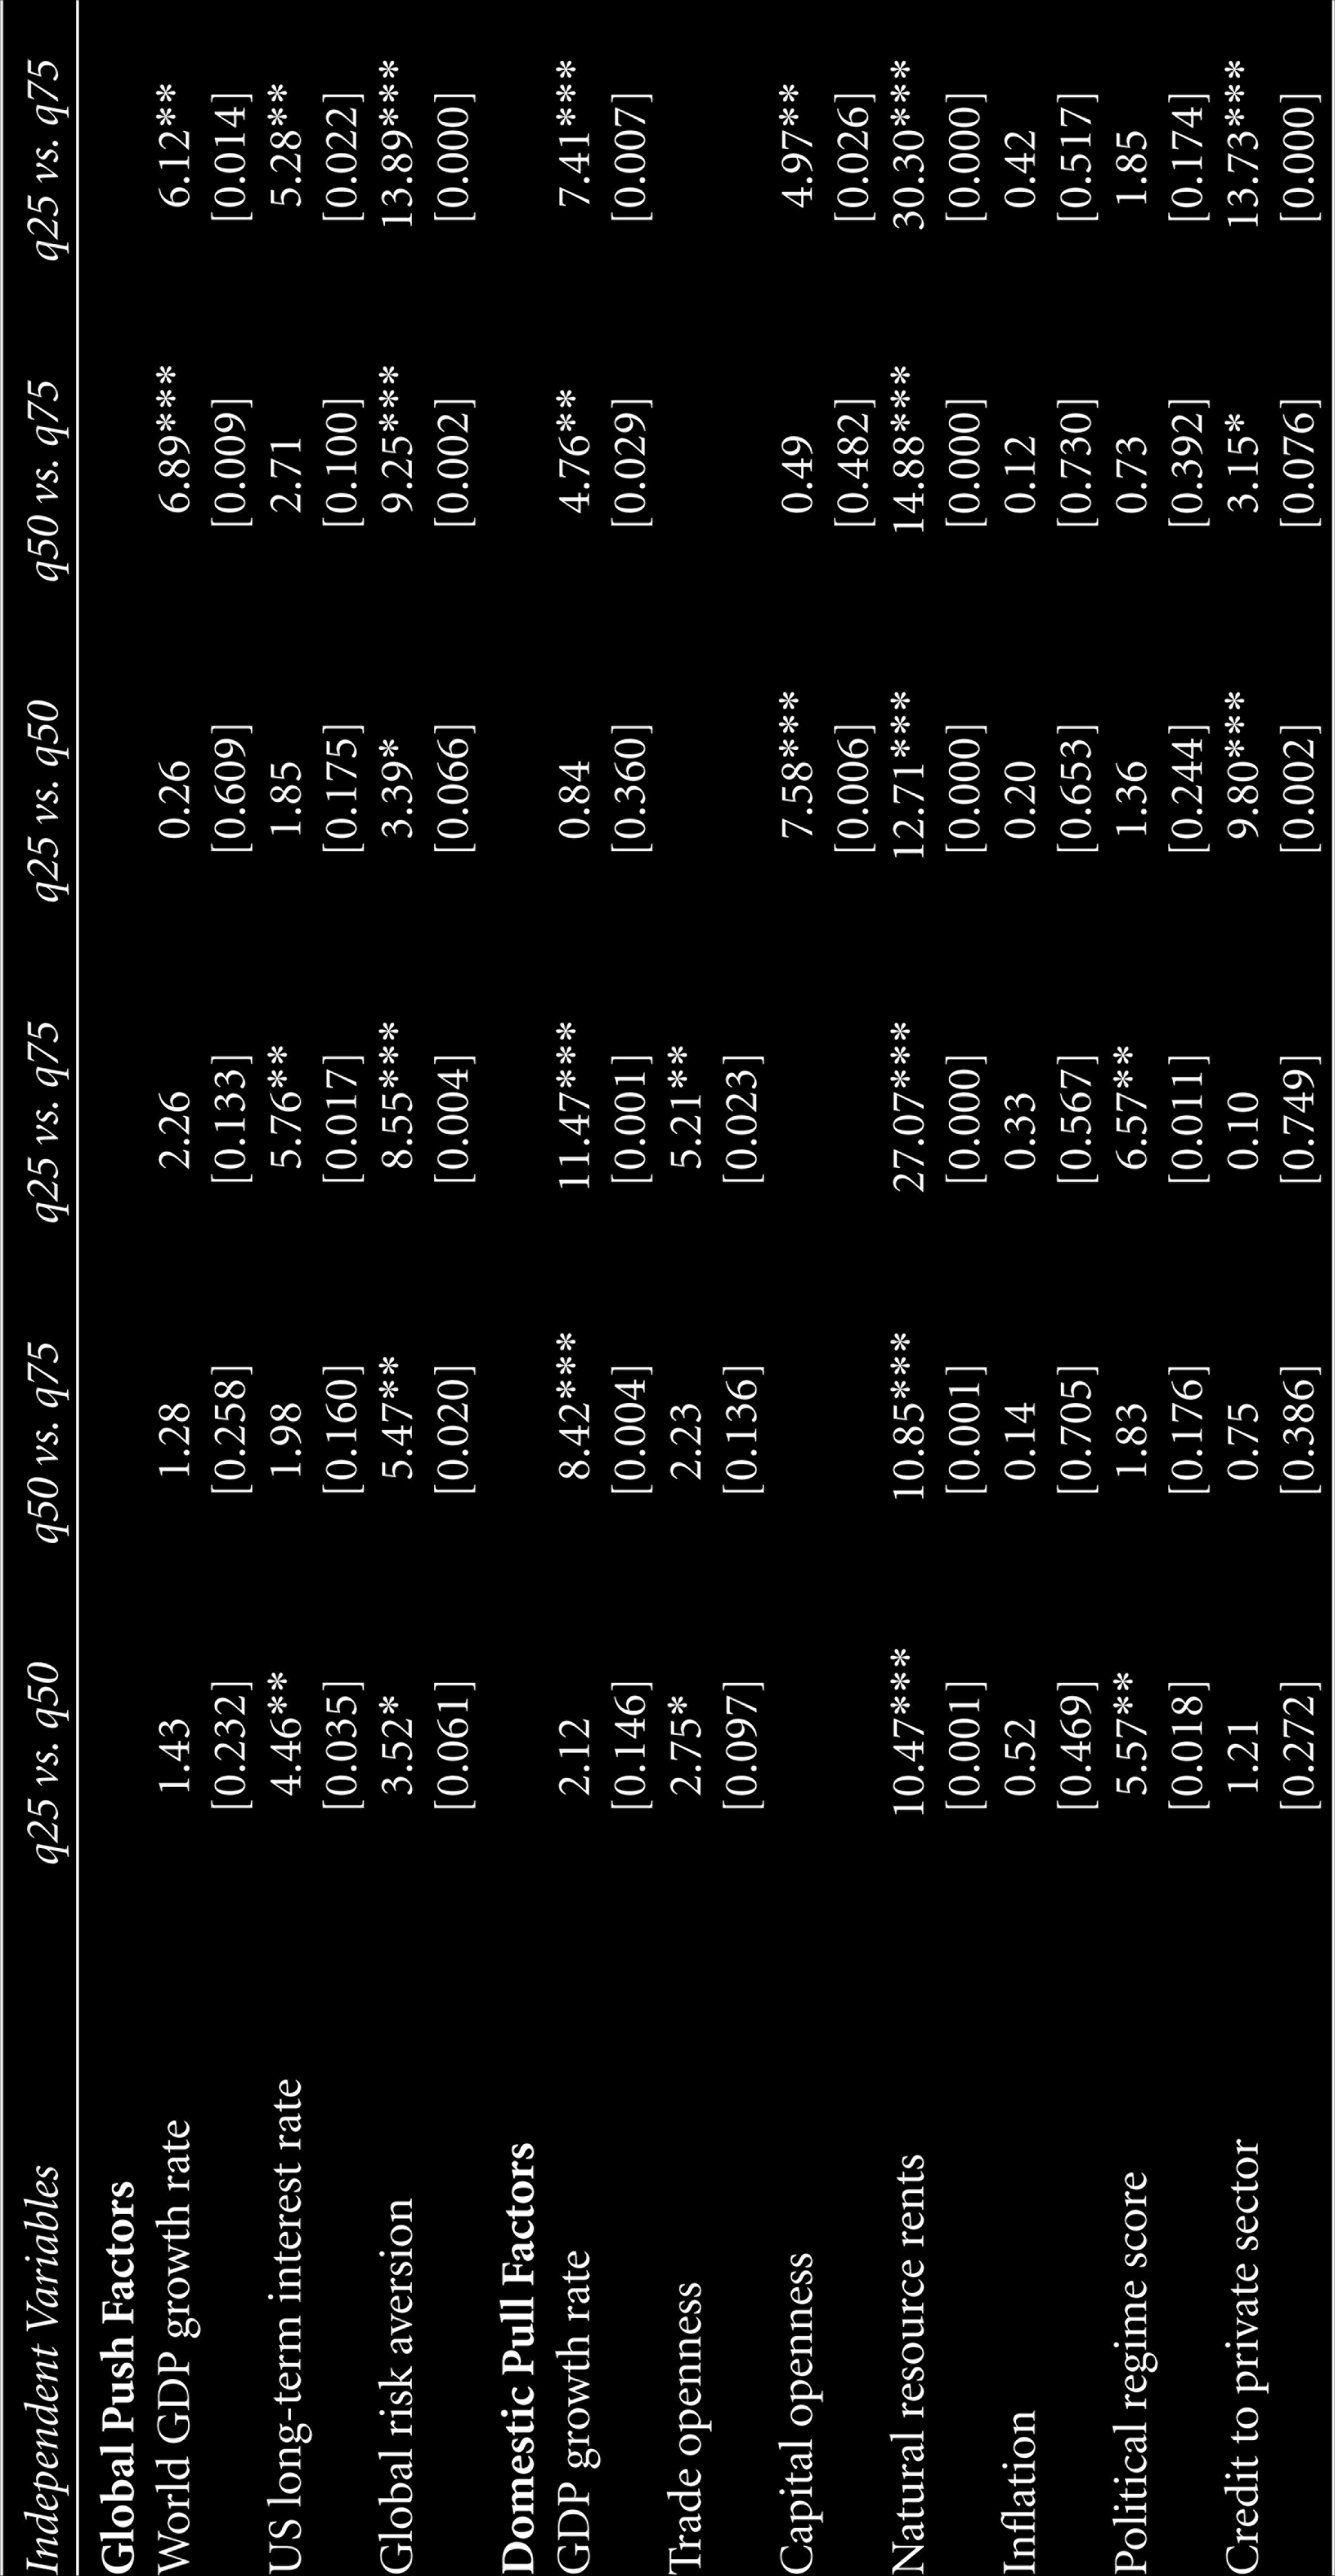
The results suggest that the coefficients on global risk aversion, GDP growth rate, trade openness and natural resource rents are significantly different across the quantiles (see Table 4). In other words, the elasticity of FDI inflows with respect to the above-mentioned factors changes significantly across the distribution of the response variable. There are significant differences between the 25th and 50th percentiles and the 25th and 75th percentiles in case of US long-term interest rates. We observe significant differences in the coefficients on world output growth, political regime score and credit to the private sector in some instances but not for all the specifications.
Testing the Equality of Coefficients (F-Statistics)
Finally, we estimate IQR to examine differences across quantiles. The results of the IQR are shown in Tables 5 and 6. The estimates represent the differences in quantile coefficients. For example, column 1 (of Tables 5 and 6) shows the difference between the 50th and 25th percentiles. Similarly, columns 2 and 3 show the differences between the 75th and 50th percentiles and the 75th and 25th percentiles, respectively.
Interquantile Regression Results
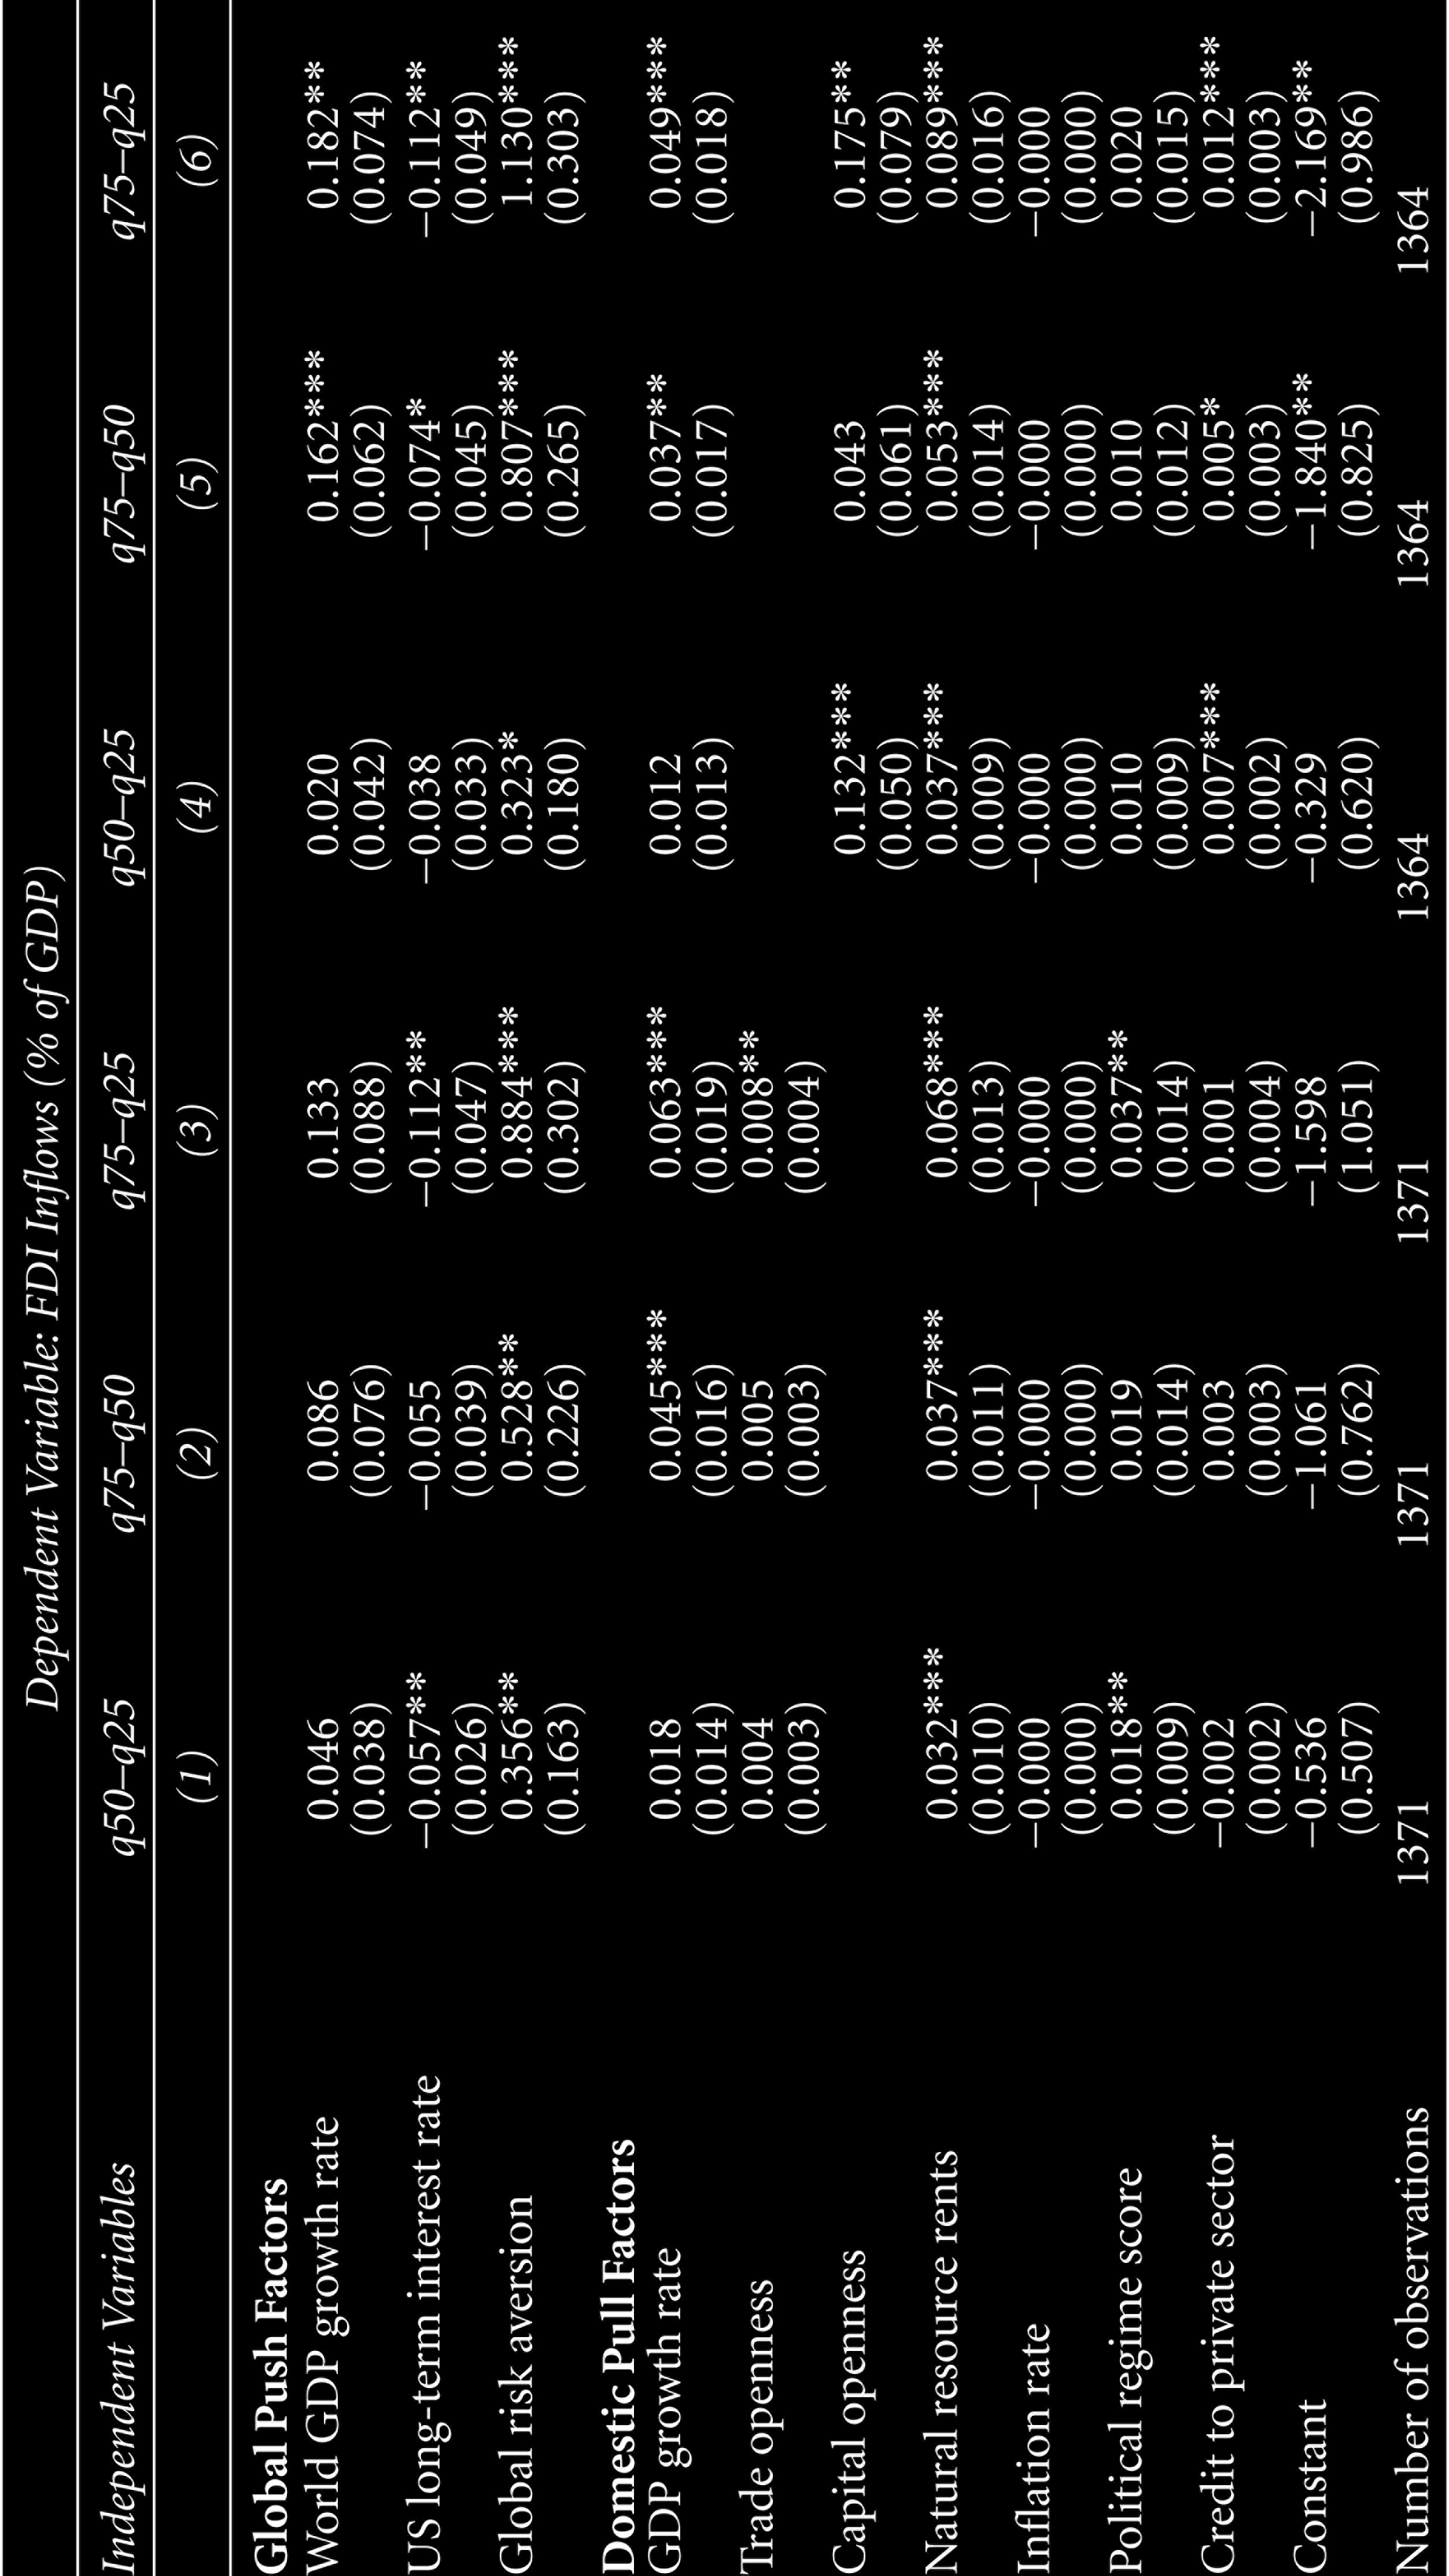
As evident from Table 5, the coefficients of the US long-term interest rate, global risk aversion, natural resource rents and political regime score are significantly different between the 50th and 25th percentiles. The difference is even more striking between the 75th and 25th percentiles as most of the coefficients are statistically significant (see columns 3 and 6).
When we include the region dummies in the IQR, we find that the coefficients of global risk aversion, the GDP growth rate, trade openness and natural resource rents are significantly different across the quantiles (see Table 6). Furthermore, the coefficient on the US long-term interest rate is significantly different between the 50th and 25th percentiles (column 1) and the 75th and 25th percentiles (column 3). In a nutshell, the IQR results suggest that the impact of several push and pull factors depend on the size of FDI inflows, that is, the impact varies across the FDI inflows distribution. We provide a visual description of the QR coefficients along with OLS estimates in Figures A1 and A2 in the Appendix. Figure A1 shows the coefficients obtained from the QR on pooled data, whereas Figure A2 depicts the coefficients from the QR with region dummies. The solid line in black represents the OLS estimate, and the dashed lines indicate its confidence interval. As obvious from these figures, the OLS estimates and quantile estimates do not coincide for most of the covariates. The quantile estimates lie outside the OLS confidence bands in both tails of the FDI inflow distribution. This indicates that the responsiveness of FDI inflows to its determinants depending on the size of the inflows.
Interquantile Regression with Region Effects


This article examines whether large FDI inflows behave differently from smaller inflows in a sample of 56 developing countries for the period 1990–2014. We use the QR method to investigate the differential effects of several push and pull factors on FDI inflows across the conditional distribution of the later. Then, we test whether the coefficients are significantly different across quantiles of the distribution of FDI inflows. The results suggest that the impacts of various push and pull factors depend on the size of FDI inflows, that is, the impact varies across the distribution of FDI inflows. To be precise, large FDI inflows are more responsive to its covariates than smaller inflows. Thus, the effects of push and pull factors are significantly higher at the upper quantiles of the distribution of FDI inflows than at the lower quantiles. To sum up, our results suggest that large FDI inflows are both quantitatively and qualitatively different from smaller inflows. Based on the empirical findings, we argue that large FDI inflows indeed behave differently from smaller inflows, and it thus necessitates a separate analysis to understand the occurrences of large FDI inflows.
Footnotes
Acknowledgements
The author would like to thank Professor Pradipta K. Chaudhury and Professor Sabyasachi Kar for their valuable advice and the anonymous reviewers for their useful comments that helped improve this article. The usual disclaimer applies.
Declaration of Conflicting Interests
The author declared no potential conflicts of interest with respect to the research, authorship and/or publication of this article.
Funding
The author received no financial support for the research, authorship and/or publication of this article.
Appendix
Variable Definition and Data Source
| Variable | Definition | Source |
| FDI inflows | Foreign direct investment inflows as percentage of GDP | UNCTAD |
| World GDP growth rate | Annual growth rate of world real GDP | WDI, World Bank |
| US long-term interest rate | Yield on 10-year US Treasury Securities | Federal Reserve Bank of St. Louis |
| Global risk aversion | Chicago Board Options Exchange volatility index (VIX) is used as a proxy of global risk index. It measures market expectation of near-term volatility conveyed by stock index option prices | Federal Reserve Bank of St. Louis |
| GDP growth rate | Annual growth rate of real GDP | WDI, World Bank |
| Trade openness | Sum of exports and imports as the GDP percentage | WDI, World Bank |
| Capital openness | Capita account openness index (high = liberalized, low = closed) | Chinn and Ito, 2006 |
| Inflation rate | Rate of inflation based on consumer price index | WDI, World Bank |
| Natural resource rents | Total natural resource rents as the GDP percentage | WDI, World Bank |
| Credit to private sector | Domestic credit to private sector by bank as the GDP percentage | WDI, World Bank |
| Political regime score | Combined polity score which ranges from +10 (strongly democratic) to −10 (strongly autocratic). We use Polity2, which is a modified version of the Polity variable | Polity IV Project |