
Abstract
This article examines the emerging market countries on their national strategic resources—farmland, fresh water, and fossil energy—which are analyzed from the perspectives of distribution, status of development, and existing issues. The study draws the following conclusions: Emerging market countries have abundant farmland resources yet inadequate per capita resources; because of extensive operation on farmland, grain yield is low, which threatens food security; emerging market countries are saliently short in water resources per capita and face imbalances and low productivity over water use, and their agriculture practices are water-intensive; emerging market countries are growing as global centers for production, consumption, and trade of fossil energy, with a long, coal-dominated consumption structure that has a growing momentum, which subjects them to a greater pressure to reduce carbon emissions; and emerging market countries are inefficient in the use of energy, though they have huge potential for energy conservation and consumption reduction.
Introduction
Farmland, water resources, and fossil energy are strategic natural resources that are closely related to people’s livelihood. Emerging markets represent countries with a large population size, rapid economic growth, promising structural changes, and strong development momentum around the global economic system. Research on the resource endowments of these countries is crucial for bilateral and multilateral cooperation. Based on the findings of Hu et al. (2018), this article takes a view on the basic features of farmland, water resources, and fossil energy across 30 emerging market countries (hereafter E30) 1 . It also analyzes possible issues involving food security, water crisis, and fossil energy utilization, which is intended to provide a research basis for further cooperation under the framework of E30 from the perspective of resource endowment.
Farmland and Food Security in E30
A country’s abundance of farmland determines its agricultural import and export and economic development, and impacts its food security. The limited expansion of farmland in recent years and rapidly growing population have aggravated the conflict between population and land and raised global concerns over food security. The capacity of farmland to meet human needs has drawn global interest, as indicated by Deininger et al. (2011) in Rising Global Interest in Farmland: Can It Yield Sustained and Equitable Benefits? The report attributes the rising global interest in farmland to the high population growth, price fluctuations, and environmental pressures.
E30 Faces an Immense Conflict between Population and Land
According to Food and Agriculture Organization (FAO) statistics, in 2016, the world’s total area of farmland was 1.426 billion hectares (ha), that is, 11.19% of the global total land area. E30 have 758 million ha of farmland, which is 53.14% of the world’s total. The top five countries with the richest farmland resources are the United States, India, Russia, China, and Brazil. The latter four rank 1st, 3rd, 4th, and 5th, with 156, 123, 119, and 81 million ha, respectively. These four countries of E30 account for half of the global farmland, which indicates the large role played by them. However, when demographics are taken into consideration, these countries seem to lose this advantage. The per capita farmland of E30 is below the world average, and especially very low for South Asia, the Middle East, and North African regions. North America boasts the world’s most farmland, with 0.546 ha per capita in 2016. In contrast, the per capita farmland area of E30 is below the world average at 0.163 ha, and East Asia and the Pacific region have the scarcest per capita farmland at only 0.107 ha.


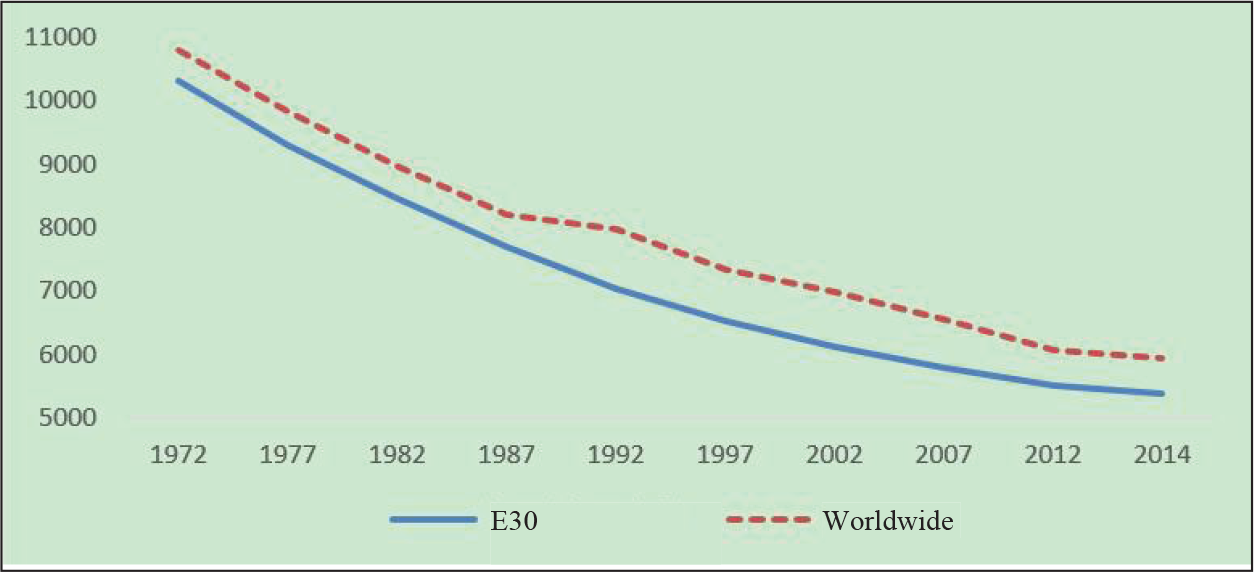
The conflict between population and land faced by the world now is even more serious. Since 1992, the global farmland area has fluctuated around 1.4 billion ha, without showing any signs of a steady growth. Yet, the population has grown exponentially since 1961, and is expected to reach 8.309 billion by 2030 and 9.15 billion by 2050, based on FAO projections. From the end of the 20th century till now, the world has been seeing an increasingly aggravated conflict between rising population and the generally unchanged farmland area. Comparing the changes of per capita farmland in E30 amid the stable fluctuation in farmland area worldwide from 1992 to now (Figure 1), the per capita farmland in E30 has continued to decline by a large margin, keeping pace with global changes. From the absolute value of per capita farmland, the per capita farmland area of E30 has long been below the world average since 1992, leaving the conflict between population and land even more acute.
E30 Have Extensive Production of Farmland and Low Yields of Grain
The rate of yield affects the grain yield of farmland, which further affects food security. Grain yield refers to the tons of grain produced per hectare of cultivated land used for grain production, which mainly includes wheat, corn, millet, buckwheat, etc.
As shown in Figure 2, the world average grain yield in 2016 was 3.967 tons/ha at the intersection of the horizontal and vertical axes, with the area on the right side of the vertical axis being above the world average and the area on the left below it. The average figure for E30 is 4.012 tons/ha, slightly above the world average. The grain yield among E30 in the Arab League, South Asia, the Middle East, and North Africa and sub-Saharan Africa is lower than the world average. Among them, sub-Saharan Africa registers a grain yield of only 1.4 tons/ha. The grain yields of developed regions—North America, the European Union (EU), OECD (Organisation for Economic Co-operation and Development) countries and East Asia and the Pacific—are above the world average, with 7.368 tons/ha in North America, almost double that of E30.


As shown in Figure 3, Egypt has the highest grain yield, producing 7.249 tons of grain per hectare of farmland, followed by Chile at 6.86 tons/ha and China at 5.98 tons/ha, ranking 9th, 15th, and 25th in the world, respectively; the grain yield of Morocco and Kazakhstan are relatively low, at 0.94 tons/ha and 1.35 tons/ha, respectively. E30 seem to display two extremes. We further observe the relationship between the grain yield and per capita farmland area of these countries, as shown in Figure 4.
Figure 4 showcases the relationship between grain yield rates and per capita farmland across E30. The intersection of the horizontal and vertical axes is the world average; the horizontal axis represents the world average grain yield of 3.967 tons/ha, and the vertical axis the world average per capita farmland area of 0.192 ha/person. The graph in Figure 4 is divided into four quadrants: The 1st quadrant includes E30 countries with a high grain yield and abundant per capita farmland, the 2nd quadrant those with a low grain yield but abundant per capita farmland, the 3rd quadrant those with a low grain yield and per-capita-farmland shortages, and the 4th quadrant those with a high grain yield and per-capita-farmland shortages. Figure 4 demonstrates that most E30 countries are concentrated near the world average and tend to be in the 3rd and 4th quadrants, indicating that generally their farmland are small and difference in grain outputs is large. More specifically, the best performer is Argentina in the 1st quadrant, which boasts high productivity and abundant farmland, with a grain yield of 5.203 tons/ha and per capita farmland of 0.899 ha/person. Kazakhstan in the 2nd quadrant is rich in per capita farmland, ranking among the top in the world, yet its grain yield is far below the world average at 1.348 tons/ha. The same is true of Russia, which has a rich per capita farmland but a low grain yield. In these countries, area sown with crops is large but the output per unit area is relatively low, as on their vast and sparsely populated land, the extensive mode of production which has been adopted since the early stages of agricultural development is still retained, reducing the economic benefits. Morocco, Tunisia, Ghana, and Guatemala in the 3rd quadrant have scarce per capita farmland and low grain yields. Those falling in the 4th quadrant are Egypt, Chile, China, and Saudi Arabia, which are much short of farmland and have high grain yields, but the lack of adequate farmland leads to low food self-sufficiency and higher dependence on imports.
E30 Face Pressing Issues of Food Security
Food is a distinctive commodity of strategic significance, and an essential part of national security strategy. Former US Secretary of State Henry Kissinger stated in 1970: “Control the oil and you control entire nations; control the food and you control the people.” From Japan’s Rice Riots in 1918 to the Food Aid that the United States used in Indian diplomacy, from Mexico’s Taco Revolts in 2008 to the Arab Spring in 2011, it is clear that food security is not only an economic issue but also a social and political issue, and even a diplomatic one. FAO defines food security as “to ensure everyone has access to enough food for future living and health at any place.” Specifically, it covers three goals: to ensure the production of a sufficient amount of food, to ensure the maximum stabilization of food supplies, and to ensure the needy people’s access to food. Grain yield is an important index measuring food security. This section draws on FAO data and makes international comparative analysis by using grain as the international standard of food, in reference to the study by Zhang (2018). Food demand increases with population growth, especially in developing countries. Food is the basic demand of the poor, and population growth leads to increased rigid demand. In the FAO-published report (2011) “The State of Food Insecurity in the World 2011: How Does International Price Volatility Affect Domestic Economies & Food Security,” it is noted that high food prices and continuous fluctuations worsen food insecurity, seriously impact the food security of those depending on food imports, and aggravate their economic crisis.
Grain yield is an important index of food security. The research team of the Chinese Academy of Agricultural Sciences proposed the necessity of 400 kg per capita grain yield in China on two different occasions in the 1980s and 1990s. Based on past experience and global practice, this article holds that the per capita grain yield can be taken as the key index to measure food security, fix 400 kg of annual per capita grain output as the baseline for food security regulation, and establish a mechanism for food security regulation. Figure 5 shows the trend of per capita grain yield in E30 and across the world during the period 1992–2017. This indicates that per capita grain yield in E30 has long been below the world average. The per capita food production of E30 peaked at 380 kg per person only in 2017, which is below the regulatory baseline of food security.


When analyzing E30 as a region, as shown in Figure 6, we find that its per capita grain yield is only slightly above that of South Asia, Africa, and the Arab League countries and far below that of North America, OECD members, Europe and Central Asia, and EU. North America’s per capita grain yield is the highest at 1.372 tons/person, and E30 face more pressing problems of food security, with an average level of 0.380 tons/person, which is 0.4 tons below the standard. The Arab League, in contrast, yields only 0.129 tons of grain per capita, well below the food security standard. Further analysis of per capita grain yield at the national level in E30, taking the world per capita grain yield of 0.397 tons/person in 2017 as the vertical axis, reveals that only 11 countries were above the world average in 2017, with Argentina with 1.735 tons ranking 1st among E30 and 4th worldwide in the same year. Australia ranked 1st worldwide, with 2.034 tons per capita. Romania ranked 2nd among E30, with 1.386 tons, second only to Argentina, and 8th in the world. Kazakhstan, Russia, and Poland ranked 3rd, 4th, and 5th, respectively, in per capita grain yield among E30, with 1.116, 0.908, and 0.841 tons, respectively, and ranked 12th, 18th, and 19th in the world, respectively. Except for the above five countries, the per capita grain yields of the other E30 countries were slightly around the world average, with China at 0.446 tons/person, slightly above the world average and slightly above the food security standard of 400 kg per person. Nineteen of the E30 countries were below the world average and below the food security standard, with Saudi Arabia yielding 0.043 tons of food per capita and Dominica only 0.06 tons. Nearly two-thirds of the E30 below the food security standard face serious problems of food security.
Figure 7 shows the per capita grain yield in E30 by region. The dotted line represents the food security standard and the three lines perpendicular to the horizontal axis from left to right divide the coordinates into four regions: Asia, Latin America, Africa, and Europe. The ranking of per capita grain yield in each region, from high to low, shows that the five E30 countries in Africa are all below the food security standard, whereas the three European countries are all above, with their per capita grain yield being very high. In Latin America, with the exception of Argentina and Brazil, the seven other countries are below the food security standard. Ten of the E30 countries in Asia are above the food security standard, among which Kazakhstan registers a high per capita grain yield, whereas Malaysia and Saudi Arabia are at very low levels.


According to the World Bank’s classification: economies with a per capita GNI (gross national income) of USD 1,025 or less are classified as low-income economies; those with a per capita GNI between USD 1,026 and USD 3,995 are low- and middle-income economies; those with a per capita GNI between USD 3,996 and USD 12,375 are referred to as middle- and high-income economies; and those with a per capita GNI of USD 12,376 or more are regarded as high-income economies 2 .
Figure 8 indicates that E30 are currently above the middle- and low-income levels, with Saudi Arabia, Chile, Argentina, and Poland being high-income economies. Argentina has the highest per capita grain yield of 1.735 tons/person, followed by Poland with 0.841 tons/person, both above the food security standard, whereas Saudi Arabia and Chile face pressing issues of food security, with 0.043 tons/person and 0.188 tons/person, respectively. Food security is already a strategic issue that needs high priority, particularly for the Gulf states such as Saudi Arabia. Saudi Arabia, the world’s largest desert country, owns a land area of 1.96 million km2, but its farmland area accounts for only 1.7%, of which less than 0.1% is used for permanent agriculture. It is under these inherent disadvantages that Gulf countries are weak in agricultural production and heavily dependent on imports for food supply, dependence being as high as 90%. Saudi Arabia has the lowest per capita grain yield, which has been declining yearly since 1992, as shown in Figure 9, facing severe problems of food security, with an unmet need for self-supply and growing dependency on imports.
Sixteen of the E30 countries, including Turkey, Malaysia, and Romania, are at middle- and high-income levels, seven of which, including China, are above the food security standard. More than half of the E30 countries at middle- and high-income levels face problems of food security. Among the 10 E30 countries at low- and middle-income levels, including the Philippines and Indonesia, only Vietnam and Indonesia register a per capita grain yield over 0.4 tons/person, while the eight other countries, including India, the Philippines, and Egypt, have food security issues.

Water Resources and Water Crises in E30
All social and economic activities depend heavily on the availability and quality of freshwater. Many countries are struggling with water shortages as a result of population growth and economic development. The surge in water use in most countries in the 2nd half of the 20th century, and even water crises in some regions, have aroused widespread concern. The United Nations Water Conference in 1977 had raised the issue of shrinking water resources at a global strategic level. With population growth and industrial urbanization, a growing problem is the imbalance between water supply and demand. In a 1998 report submitted by the World Commission on Environment and Development (WCED, 1989), it was noted that “water is replacing oil as a major cause of global crisis.” In January 2015, the World Economic Forum acknowledged that water shortage leading to a water crisis is the biggest risk in the world.


E30 Face per Capita Water Shortages and Water Stress
The per capita water resources in E30 are below the world average. According to the FAO statistics for 2014, the world had 42.81 trillion m3 of renewable inland freshwater, with 24.54 trillion m3 or 57.32% in E30, which account for 62.39% of the world’s population. These countries are relatively short of water, given that their per capita water resources are 5,180 m3, well below the world average of 5,930 m3.
Figure 10 shows the per capita water resources in E30 and their distribution across continents. The dotted line parallel to the horizontal axis represents the world per capita water resources at 5930 m3/person, with the three parallel lines from left to right dividing the coordinates into Africa, Latin America, Europe, and Asia. In general, 20 of E30, or 66.67% of the total, have per capita water resources below the world average. Among them are the five African countries, as they are located in arid and semi-arid regions, the world’s most water-scarce part. Egypt, in particular, suffers from extreme water shortages, with per capita water resources of only 19.91 m3. Two countries in Latin America, Dominica and Mexico, are below the world average at 2,310 m3 and 3,400 m3, respectively. Argentina and Guatemala are slightly above the world average at 6,840 m3 and 6,860 m3, respectively. Other countries, such as Peru, Chile, and Colombia, are rich in per capita water resources, which may reach 54,540 m3, 49,830 m3 and 45,670 m3, respectively, well above the world average. Brazil boasts the world’s richest water resources of 5.661 trillion m3, accounting for 13.22% of the world’s total freshwater (42.81 trillion m3). However, Brazil has a large population, and the per capita water resources are low at only 27,920 m3. Among the three European countries (except Russia), Poland and Romania have per capita water resources of 1,410 m3 and 2,130 m3, respectively, both below the world average. Russia’s per capita water resources are 2.998 cubic meters, ranking fourth among E30. Russia is also a country with a very high total water resources, ranking second only to Brazil in the world, accounting for 10.07% of the world.
As shown in Figure 11, the per capita water resources of the 13 Asian countries of E30, except Malaysia and Indonesia, are below the world average. China and India have the most water resources and rank 5th and 9th globally, with total water resources of 2.813 trillion m3 and 1.446 trillion m3, respectively, but their per capita water resources are seriously short at 1,120 m3 and 2,060 m3, respectively, far below the world average. In addition, a series of serious water crises have been caused by imbalanced spatial and temporal distribution of domestic water resources, rapid population growth, inefficient utilization of water, heavy pollution, climate change, and frequent water disputes around borders.
The United Nations defines water stress as per capita water resources below 1,700 m3, water shortage as that below 1,000 m3, and extreme water shortage as that below 500 m3 (Guo & Yu, 2016). Of the 50 water-scarce countries below the standard of 1,000 m3/person, seven (or 14%) belong to E30, namely, Egypt (19.91 m3/person), Tunisia (379.19 m3/person), South Africa (821.33 m3/person), and Morocco (848.14 m3/person), and in Asia, Saudi Arabia (77.63 m3/person), Pakistan (281.61 m3/person), and Uzbekistan (531.25 m3/person). Among the 29 countries below the standard of 500 m3/person, four (or 13.79%) belong to E30: Egypt, Saudi Arabia, Pakistan, and Tunisia. With a per capita freshwater of 76 m3/person, in the 50 years to come, Saudi Arabia is projected to be the 5th largest water-scarce country in the Middle East and Africa (Mo, 2013), facing a major water crisis. Despite the large total amount of water resources, E30 witness a rapidly growing population that makes their water shortage extremely acute and require immediate attention.
E30 See Inefficient Use of Water and Worsening Water Shortages
The latest World Water Development Report, published by the United Nations in 2012, points to severe global water wastage. Many countries lose about 30% of their water resources each year as a result of mismanagement, pipeline obsolescence, and channel leaks (Wang, 2014). Figure 12 shows that per capita water resources in E30 3 have been below the world average since 1972, and per capita water resources are declining yearly. In most E30 countries, water availability falls short of the need for irrigation, exacerbated by the rapidly growing population and the inefficient use of water.
In E30, agriculture consumes 71% of the water resources. Some countries have heavy wastes, while the gravity flood irrigation that allows water to flow into lower farmland continues to be a common irrigation practice. With the flood irrigation over the years, most irrigation systems consume far more water than is needed. Due to evaporation and leakage, agricultural irrigation water is usually lost by half, resulting in land salinization and waterlogging, soil degradation, and declining yield, and even translating into zero income. China’s water resources are abundant; however, the “water delivery by soil channel and flood irrigation” is still adopted for agricultural irrigation, causing water leakage and evaporation, and hence the utilization coefficient is low, with 65% of the irrigation water wasted (Jing & Wang, 2000). China’s effective use of agricultural water is only 40%, which is 70%–90% lower than in developed countries. It consumes 1,300 kg of water to produce 1 kg of grain, while developed countries use less than 1,000 kg of water for the same (Zhang, 2014).
India also faces water shortages, which are bordering to a water crisis. India is one of the countries with most of the world’s water resources and has an enormous total population of over 1.2 billion. Past statistics indicate that India’s water availability has continued to deteriorate over the recent years, with its per capita water resources falling from 1,444.7 m3 in 1997 to 1,116.1 m3 in 2014, well below the world average and well below the water shortage threshold of 1,700 m3 per capita. In contrast, its water consumption has increased rapidly, from about 500 billion m3 in 1990 to 761 billion m3 by 2014, and it is expected to reach 1.093 trillion m3 by 2025 and 1.447 trillion m3 by 2050. India uses water extensively for agriculture and uses it inefficiently. Its agricultural water in 2014 reached 688 billion m3, accounting for 90.4% of the total consumption, yielding only about 377 g of grain per cubic meter of water consumed, compared to about 1,200 g of grain produced in China with the same water consumption. The utilization rate of irrigation water is extremely low, due to India’s outdated irrigation system. The utilization rates of water by means of surface irrigation, sprinkler irrigation, and local irrigation are 60%, 75%, and 90%, respectively. Surface irrigation (97%), sprinkler irrigation (2%), and local irrigation (1%) irrigate a total of 63.962 million hectares in India. A comprehensive calculation indicates that the utilization rate of irrigation water is only 35%–40%, and that by surface water is 38%–40%, while the situation of groundwater is even worse. In addition, the inefficient and wasteful use of domestic water is extremely serious. Water losses from leaks and burst pipes in Delhi are estimated to be as high as 40% of the water supply, while losses from water theft and aging pipeline in Mumbai are even higher at 40%–50%; in addition, a similar situation exists in other cities as well.
E30 Have Low Water Productivity Caused by Excessive Use of Water in Agriculture
Water productivity is a measure of economic development and water consumption. The productivity of water is calculated by dividing the constant-price GDP by the annual total extraction of water, and Figure 13 represents the constant-price GDP per cubic meter of water in 2010.
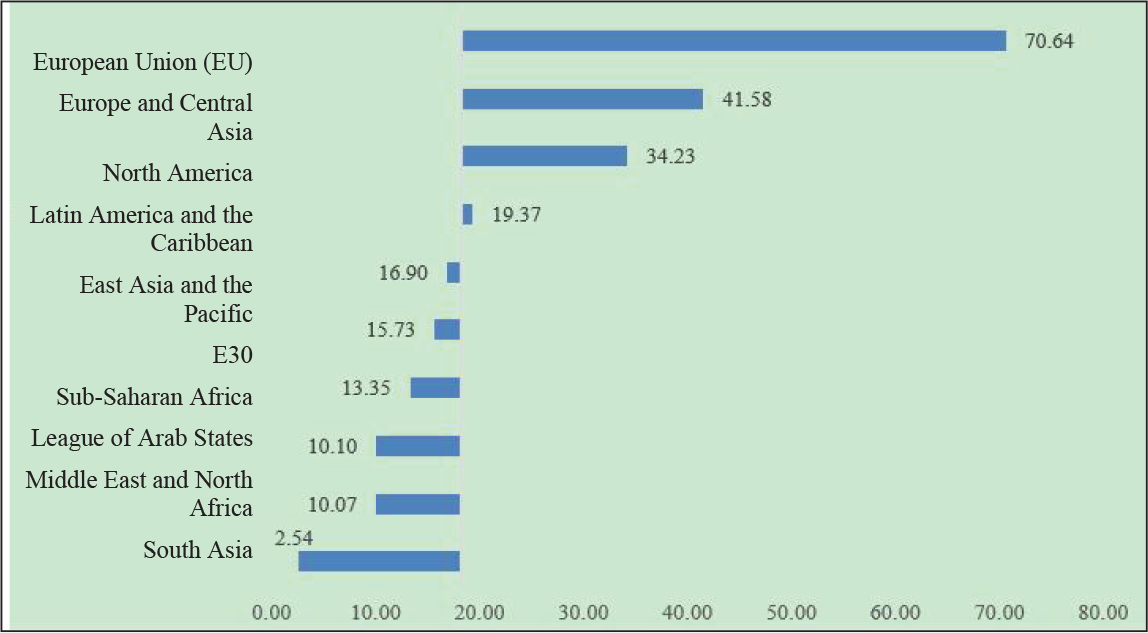
Global average water productivity is 18.22 USD/m3 at the intersection of the horizontal and vertical axes in Figure 13, which represents a GDP of USD 18.22 per cubic meter of water consumed. The average water productivity of E30 is below the world average at 15.73 USD/m3, which includes the Arab League, South Asia, the Middle East, and North Africa; especially, South Asia stands at only 2.54 USD/m3. EU has the highest water productivity of 70.64 USD/m3, followed by OECD (44.31 USD/m3) members and North America (34.23 USD/m3), where the water utilization rates are only 16.45%, 10.13%, and 9.25%, respectively. Twenty of the E30 countries, or two-third of the total, have water productivity levels below the world average. Uzbekistan has the lowest water productivity at 0.96 USD/m3, followed by Pakistan, Vietnam, and India at 1.12 USD/m3, 1.77 USD/m3, and 2.8 USD/m3, respectively, making about USD 2 of GDP with 1 m3 of water. Globally, Singapore has the highest water productivity of 1,480.88 USD/m3. Among E30, Poland has the highest water productivity at only 46.65 USD/m3. The water productivity in China is 13.71 USD/m3, also below the world average.
The low water productivity in E30 is likely the result of agricultural waste, with the lowest levels in the Arab League, South Asia, and the Middle East and North Africa, where agriculture consumes the most water, reaching 84.25%, 91.15%, and 85.21%, respectively. These regions also reflect the low water productivity, of only USD 2.54 in South Asia, which has the largest water consumption for agriculture, followed by the Middle East and North Africa with USD 10.07, and finally the Arab League with USD 10.1. Figure 14 shows a scatter plot of water productivity and agricultural water share across E30, marking a trend line, with the horizontal axis representing the agricultural water share and the vertical axis the water productivity. This indicates a clear negative relationship between the two, and the coefficient of agricultural water to water productivity is negative, with a value of 0.386 and an R-squared value of 0.54. The fitting effect is good; a one-unit increase in agricultural water leads to a 0.386-unit decrease in water productivity.
The industrial water and production water are also considered. The relationship between water productivity and utilization is observed through correlation analysis to test the previous assumptions. From the results of the correlation analysis as shown in Table 1, a negative correlation is found between water productivity and agricultural water, the correlation coefficient being −0.732, while there is a positive correlation of water productivity with industrial water and domestic water at 0.612 and 0.717, respectively. A significant negative correlation is seen among agricultural water, industrial water, and domestic water, with the correlation coefficient of industrial water reaching −0.951. This shows that agricultural water is seriously crowding out industrial water, posing a threat to the water-intensive industries in E30 amid their rapid industrialization, and this is certainly not good for improving water productivity.

Results of Correlation Analysis.
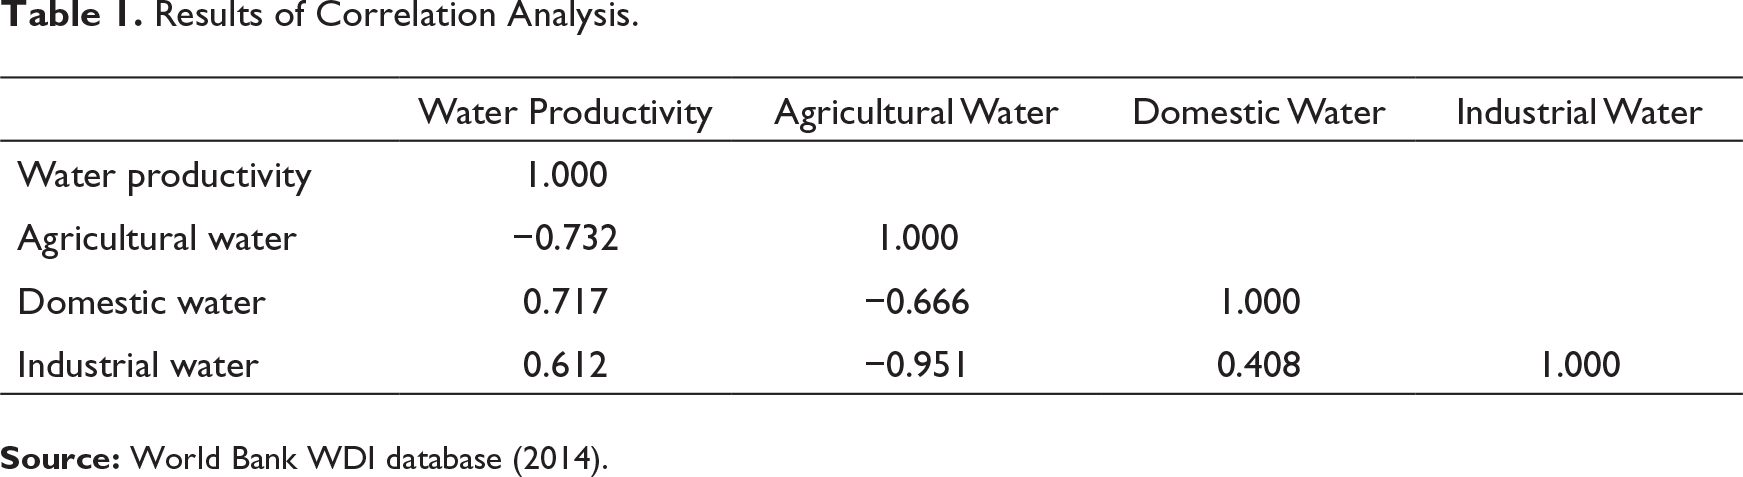
Source: World Bank WDI database (2014).
Fossil Energy and Energy Security in E30
Energy is industrial food, and energy security is closely related to national security. By 2030, fossil fuels will still constitute 83% of the world’s primary energy (Wang et al., 2009). According to the Energy Information Administration (EIA), fossil energy, mainly coal, oil, and natural gas, will continue to dominate energy production and consumption by the mid-twenty-first century with the abundant reserves and advanced development technologies. The energy security situation facing E30 is grave. The subsequent section analyzes the prevailing situation and discusses issues of fossil energy across E30 4 to promote energy cooperation among them.
E30 Are Growing as a Global Center for Fossil Energy Production, Consumption, and Trade
We see great potential for energy cooperation among E30, which are emerging as the global center for fossil energy production, consumption, and trade. On the one hand, E30 are the world’s largest energy producers. In 2017, global production of fossil energy reached 11.32-billion-ton oil equivalents, with E30 contributing 6.482-billion-ton oil equivalents (57.26%), followed by the Asia-Pacific region (31.8%), North America (only 18.93%), South America (5.2%), and lastly Africa (6.5%) with the lowest production. Russia, Kazakhstan, Turkmenistan, and Saudi Arabia are major oil and gas exporters among E30. China and India are the world’s 1st and 4th largest coal producers, respectively. Russia is the world’s 2nd largest producer of natural gas. In 2017, E30 produced 50% of the oil, 45% of the natural gas, and 77% of the coal in the world. On the other hand, global consumption of fossil energy by E30 is rapidly rising. In Energy Outlook 2030, published in December 2012, British Petroleum predicted that by 2030, primary energy consumed in developing countries would account for 93% of the global total, especially representative countries of E30, such as China and India (Peng et al., 2014). Global consumption of fossil energy in 2017 reached 11.509-billion-ton oil equivalents, with E30 using 6.217-billion-ton oil equivalents (54.01%) of the total. E30 consumes 43.16% of the oil, 44.44% of the natural gas, and 75.55% of the coal across the globe. The Asia-Pacific region consumes 44.18% of fossil energy, slightly below E30, and North America consumes 19.84%. The fossil energy consumed in the Middle East, Africa, and South America is relatively low, at only 7.73%, 3.57%, and 4.35% of the total, respectively.
However, the fact that E30 vary in spatial distribution of energy supply and demand causes a serious mismatch in the regional distribution of production and consumption, making E30 the global center for energy trade. Russia and Saudi Arabia are important exporters of fossil energy, and the Asia-Pacific region is the largest source of fossil energy, which points to a spatial separation of production from consumption.
Figure 15 shows fossil energy production–consumption differences in E30. Positive values represent that production is greater than consumption, and negative values that production is less than consumption. Production–consumption differences in E30 fluctuate from −641-million-ton to 697-million-ton oil equivalents, meaning that production and consumption are separated spatially and energy flows across these countries to fill the consumption gaps. As shown in Figure 15, China, India, Turkey, and Thailand are large energy consumers, and Russia, Saudi Arabia, and Indonesia are large energy exporters.
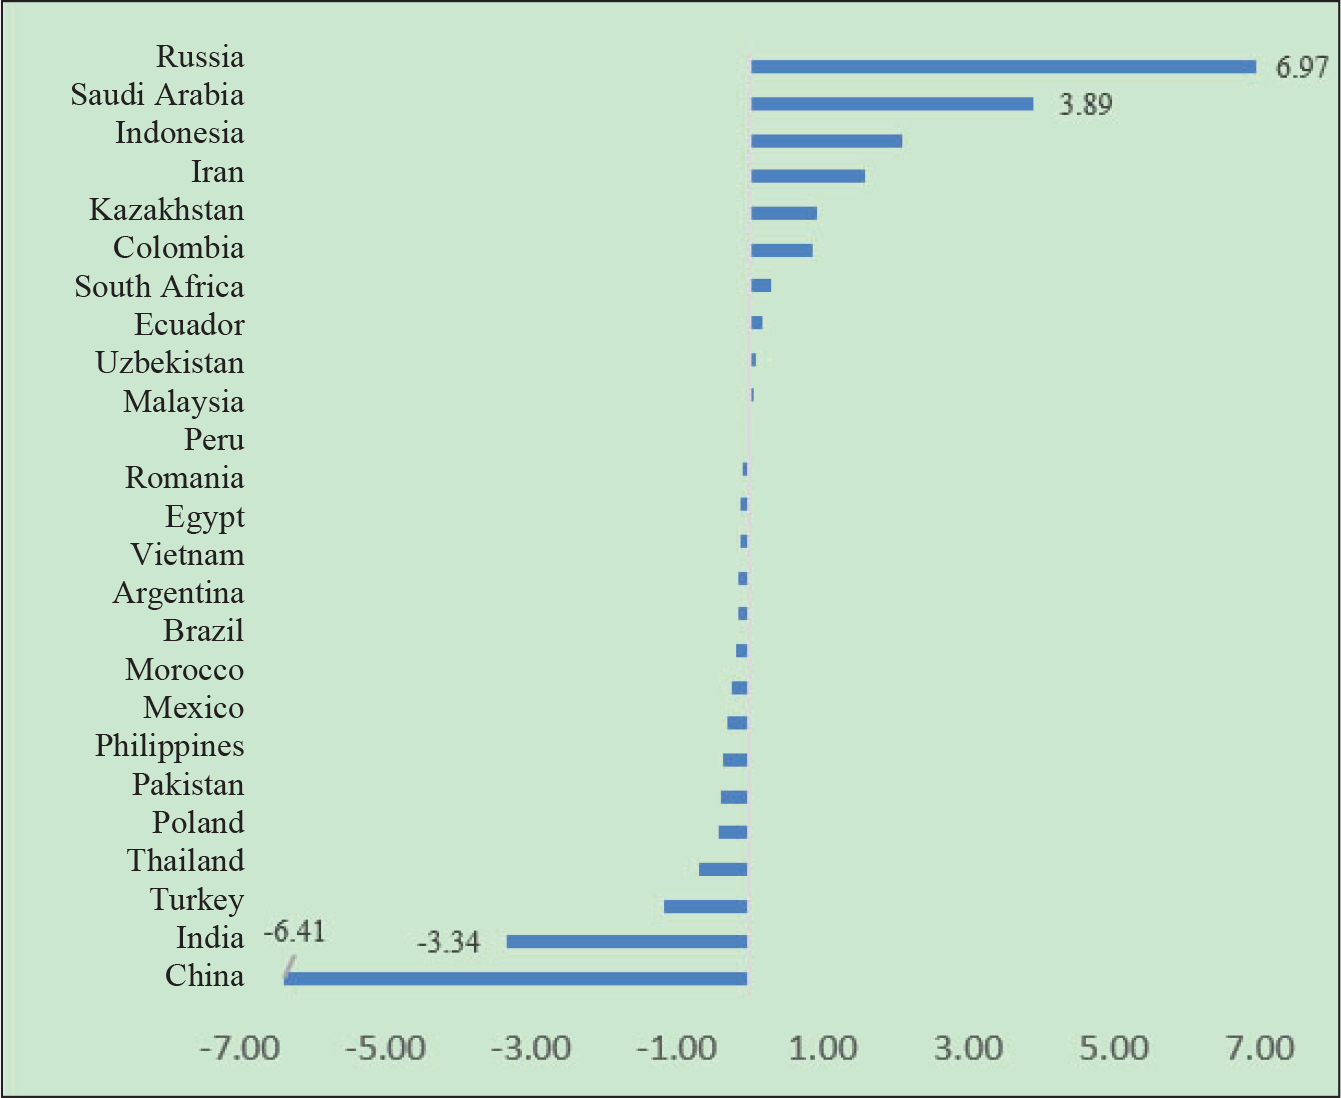
The energy trade among E30 has been boosted by the separation of production and consumption. Figure 15 shows that Russia and Saudi Arabia are the world’s major exporters of fossil energy, whose 2017 exports of crude oil and petroleum products accounted for 25.52% and 20.83% of the global total, respectively. China and India are major importers of fossil energy, and their imports of crude oil and petroleum products accounted for 26.76% and 2.65% of the global total, respectively. However, import and export trade ties among these countries are very weak. In 2017, Russia and Saudi Arabia exported a total of 831-million-ton oil equivalents and China imported 457-million-ton oil equivalents, and India 244 million tons. However, Russia and Saudi Arabia only contributed 25.6% to China and 28.6% to India in the latter’s imports of oil, showing great potential for bilateral energy trade. Among E30, Russia and Indonesia are important exporters of natural gas, including pipeline and liquefied natural gas, and in 2017, Russia exported 231 billion m3 of natural gas (20.37%) of the world total. In terms of natural gas demand, China is the largest buyer of natural gas, importing 39.4 billion m3 of pipeline natural gas and 52.6 billion m3 of liquefied natural gas in 2017, which was 8.12% of the world total. Mexico and Turkey are also major importers of natural gas, importing 4.29% and 4.735% of the global total, respectively. Yet, Russia exported only 600 million m3 of liquefied natural gas to China in 2017. China imported 23.7 billion m3 and 10.3 billion m3 of liquefied natural gas from Australia and Qatar, respectively, and 31.7 billion m3, 3.4 billion m3, and 1.1 billion m3 of pipeline natural gas from Turkmenistan, Uzbekistan, and Kazakhstan. In short, E30 contributed 4.5 billion m3 of pipeline natural gas and 10.761 billion m3 of liquefied natural gas, a total of 15.261 billion m3 of natural gas, which is only accounts for 16.59% of China’s total imports. This indicates that energy trade cooperation under the framework of E30 has huge potential.
The Coal-based Energy Consumption Structure Puts E30 Under Greater Pressure to Reduce Carbon Emissions
Greenhouse gases from energy consumption contribute to global warming. Energy-related carbon dioxide (CO2) emissions are projected to grow to 41 billion tons in 2030, up by 45% compared to 2006. This may cause the global average temperature to rise by 6°C, and 75% of the emissions may come from China, India, and the Middle East (Wang et al., 2009). Fossil fuel–based energy consumption structure is a major cause of climate change (Fan et al., 2013). Most E30 countries are developing countries undergoing heavy industrialization. As China and India have moved into the energy-intensive stage of development, their energy demand has grown dramatically, and with a coal-based energy consumption structure with higher CO2 emissions, E30 will be facing even more serious environmental problems.

The CO2 emissions analyzed in this section are those generated from combustion of fossil fuels and cement production, including the CO2 generated from the consumption of solid, liquid, and gaseous fuels, as well as the combustion of natural gas. In 2014, global CO2 emissions totaled 36.1386 billion tons, with E30 contributing 20.325 billion tons (56.24%), more than half of the total. The dynamics of CO2 emissions by major regions are shown in Figure 16. E30 have shown consistently higher CO2 emissions than other places since 1992, showing a yearly growing trend similar to East Asia and the Pacific. The global share of CO2 emissions by E30 has increased by 16.65 percentage points, from 39.59% in 1992 to 56.24% in 2014. Especially after 2000, the share has grown rapidly as a result of increased energy demands of E30 for rapid industrialization, with E30 rarely focusing on energy conservation and environmental protection. As demonstrated in Figure 17, the share of CO2 emissions dropped in North America and Europe but kept rising in the Asia-Pacific region and E30 since 2000.
Figure 17 shows the dynamics of CO2 emissions by OECD, the Arab League, EU, and E30. In 1992, the CO2 emissions of OECD exceeded those of other regions, reaching 11.479 billion tons, which was 51.75% of the world total. This was the time when most OECD members were in the midst of industrialization, with high demand for energy and larger attention to economic growth than energy conservation and environmental protection. In 1992, the CO2 emissions of E30 were 8.782 billion tons, accounting for 39.59% of the world emissions. This proportion increased rapidly from 2000 onwards, to 56.24% in 2014.


According to World Bank statistics, in 2014, the world produced 33.81 billion tons of CO2 from fossil energy combustion, with 12.028 billion tons (35.57%) generated from oil combustion, 6.685 billion tons (19.77%) from natural gas combustion, and 15.097 billion tons (4.465%) from coal combustion. Figure 18 shows that CO2 emissions from fossil fuel combustion in E30 are much higher than elsewhere at 18.45 billion tons, with 4.746 billion tons (58.57%) generated from coal combustion, well above the world average. The CO2 emissions by E30 are mainly from coal combustion, resulting from the coal-based consumption structure. As indicated from regional comparisons, CO2 emissions from burning coal are 69.87% of the total emissions from all energy combustion in the Asia-Pacific region, while the figure is the highest at 58.57% across E30. It is expected that optimizing the energy consumption structure and reducing coal consumption across E30 will help cut CO2 emissions.
As shown in Figure 19, CO2 emissions from fossil energy combustion in E30 account for an increasing share of the world total on a yearly basis, contributed to largely through coal combustion. The global share of CO2 emissions from fossil fuels in E30 increased by 10.85 percentage points from 66.9% in 1992 to 77.78% in 2014, and the emissions have remained high over a long period of time. More specifically, the share of E30 in the global CO2 emissions from coal combustion increased rapidly from 50.16% in 1992 to 71.58% in 2014. The increase was slightly above 50% before 2001 but has registered a marked increase since 2002, which may be related to the rapid industrialization and urbanization in E30. E30’s desire for rapid economic growth has increased the demand for coal fuel to its overuse, ignoring the consequent environmental problems and lacking measures to cut carbon emissions.

E30 Have Low Energy Efficiency and Large Potential in Energy Conservation and Consumption Reduction
Energy intensity is an index for energy efficiency, which refers to energy consumption per unit GDP, measured by dividing a ton-oil equivalent by 10,000 USD of GDP. The higher the energy intensity, the more is the energy consumed per unit GDP, and the lower is the energy efficiency. The global average energy intensity is 1.264-ton oil equivalents/10,000 USD, and that of E30 is slightly below the world average at 0.999. Nearly one-third of E30 have an energy intensity above the world average, including Uzbekistan (2.801 ton oil equivalents/10,000 USD), South Africa (2.176 ton oil equivalents/10,000 USD), Russia (1.924 ton oil equivalents/10,000 USD), Kazakhstan (1.88 ton oil equivalents/10,000 USD), Iran (1.786 ton oil equivalents/10,000 USD), China (1.758 ton oil equivalents/10,000 USD), Saudi Arabia (1.389 ton oil equivalents/10,000 USD), Thailand (1.326 ton oil equivalents/10,000 USD), and Vietnam (1.304 ton oil equivalents /10,000 USD). Their energy efficiency is very low, but their consumption is high. These E30 countries are rich in fossil energy but short of per capita resources and wasteful in energy utilization. Considering the energy intensity of Switzerland, a developed country with only 0.535-ton oil equivalents/10,000 USD, we see a long way for E30 to go in improving their energy efficiency. Considering the major international organizations, EU registers a low energy intensity of only 0.878-ton oil equivalents/10,000 USD and OECD 1.097-ton oil equivalents/10,000 USD, both below the world average, with high energy efficiency and low energy consumption per unit GDP. As for major regions of the world, the energy intensity of sub-Saharan Africa is very high, reaching 1.699-ton oil equivalents/10,000 USD, and the energy efficiency is very low. The energy intensity of the Asia-Pacific region is higher than the world average at 1.428-ton oil equivalents/10,000 USD, while that of Latin America is much lower at only 0.931-ton oil equivalents/10,000 USD with high energy efficiency.

Most E30 countries with abundant fossil energy, including China and India, are experiencing per capita energy shortages, and when making a comparative analysis of per capita fossil energy production and energy intensity, we see the pattern shown in Figure 20. The E30 countries, whether in Africa, Europe, or Asia, generally show higher per capita fossil energy production and higher energy intensity. The situation is better in Latin America, with per capita energy shortages and low energy intensity. The energy intensities of nine countries in the continent are below one-ton standard oil/10,000 USD, while those of Argentina and Guatemala is below the world average at 1.072- and 1.161-ton oil equivalents/10,000 USD, respectively. In the region with scarce resources but low energy intensity, Argentina has the highest per capita fossil energy of 1.340-ton oil equivalents/person, below the world average of 1.51-ton oil equivalents/person. A point to note is that among all E30 countries in Latin America, Colombia has the highest per capita resource of 2.344-ton oil equivalents, above the world average, and a very low energy intensity at 0.562-ton oil equivalents, ranking 6th among the least energy-intensive countries around the world. It is a special E30 country with its relatively rich energy and efficient utilization.
South Africa has a high energy intensity of 2.176-ton oil equivalents, and its per capita fossil energy is the richest in Africa at 2.521-ton oil equivalents. In Europe, Russia has the highest energy intensity of 1.924-ton oil equivalents, above the world average, and its per capita fossil energy is 9.046-ton oil equivalents. The situation in Asian countries is variable. Despite the positive correlation between energy intensity and per capita resources, the characteristics of each country vary largely. Saudi Arabia, with the richest per capita fossil energy in Asia, registers an energy intensity of 1.389-ton oil equivalents, which is not the highest but slightly above the world average. This means that Saudi Arabia is relatively resource-rich and less energy-intensive, a special case among E30 countries. Uzbekistan, with the highest energy intensity, has a per capita fossil energy of 1.529-ton oil equivalents, slightly above the world average, while its energy intensity is 2.801-ton oil equivalents, well above the world average. The country is short of resources and inefficient in energy utilization, which needs to improve in the near future.
Energy intensity is staying high in E30 with rich per capita fossil energy production. Figure 21 shows a positive correlation on the left, while the fitting line on the right is steeper after excluding Colombia and Saudi Arabia, with a higher impact coefficient of 0.127 and a higher R-squared value indicating that with each unit increase in the per capita fossil energy production, the energy intensity grows by 0.127 units. Most E30 countries conform to the pattern that the more abundant the energy, the lower is the energy efficiency, perhaps because the energy wealth makes them less focused on efficiency in using energy resources.


The top six countries of E30 in terms of energy intensity in 2014 are Uzbekistan (2.801-ton oil equivalents/10,000 USD), South Africa (2.176-ton oil equivalents/10,000 USD), Russia (1.924-ton oil equivalents/10,000 USD), Kazakhstan (1.880-ton oil equivalents/10,000 USD), Iran (1.786-ton oil equivalents/10,000 USD), and China (1.758-ton oil equivalents/10,000 USD). Figure 22 shows the dynamics of energy intensity and the world average from 1990 to 2014 across the six countries. Global energy intensity decreased on a yearly basis, from 1.792 in 1990 to 1.264 in 2014, indicating that energy efficiency has been improving at the global level. Except for Iran, other least energy-efficient E30 countries have witnessed a yearly dropping energy intensity. In particular, Uzbekistan experienced a rapid decline from 8.713-ton oil equivalents/10,000 USD at the peak energy intensity in 1998 to 2.801-ton oil equivalents/10,000 USD in 2014 and saw a yearly climbing energy efficiency. Since its independence in 1991, according to data from the National Bureau of Statistics of Uzbekistan, after about 5 years of fluctuation and adjustment, its domestic economy gradually embarked on a stable growth track, and its energy intensity has begun to decrease and energy efficiency improve. However, its low energy efficiency is still a problem that needs reforming.
Iran ranked 5th among E30 in energy intensity at 1.786-ton oil equivalents/10,000 USD. Its energy efficiency is very low. Observing the changes over the years, Iran’s energy intensity has fluctuated, increasing from 1.082-ton oil equivalents/10,000 USD, below the world average, in 1990 to well above 1.786-ton oil equivalents/10,000 USD in 2014. Over the past two decades, Iran’s energy efficiency has been reducing yearly and energy consumption has increased, and it now faces enormous pressure for energy conservation. China’s energy intensity has decreased yearly, from 5.04-ton oil equivalents/10,000 USD in 1990 to 1.758-ton oil equivalents/10,000 USD in 2014, still above the world average, but its energy efficiency has clearly improved.
Improving energy efficiency is a major concern for policymakers. In 2011, China announced its target of reducing energy intensity to 16% by 2015. However, there is still a huge potential for raising its energy efficiency, which reached almost 80% in the construction sector and more than 50% in the industrial sector (IEA, 2012). With global progress in energy technology, energy consumption is gradually reducing, and E30, including China, are projected to have the highest potential to cut energy consumption, by almost 2.3–3.2 times as that of developed countries (Wang et al., 2009).
In addition to development of new energy sources, energy conservation is also an important way to solve the energy crisis. In developed countries, the concept of energy conservation has evolved from saving and shrinking in response to the energy crisis in the early 1970s to increasing energy efficiency, with more focus on profitability/cost-saving and environmental protection, while making the working and living environments more comfortable. Energy conservation technology has become a comprehensive index to measure a country’s national energy utilization and a symbol of its scientific and technological prowess. A study in the United States suggests that energy conservation may reduce US energy consumption by about 50% without lowering public living standards (Wang et al., 2009). Many countries have enacted an Energy Conservation Act, and a large number of energy conservation technologies are being promoted, and new technologies, including energy-saving vehicles, cogeneration, new fluid fuels, and high-performance batteries, have been rapidly developed as well. Faced with fossil energy shortages and low energy efficiency, E30 are under great pressure to conserve energy, making the improvement of energy efficiency an urgent task now. The experience of developed countries should be further drawn up to develop and advance effective energy reforms for higher efficiency, based on the situation of each emerging market country.
Footnotes
Declaration of Conflicting Interests
Funding
The author disclosed receipt of the following financial support for the research, authorship, and/or publication of this article: This article is supported by “the Fundamental Research Funds for the Central Universities” (2020NTSS37).