
Abstract
This paper examines the impact of renewable energy policies as well as three renewable energy policy instruments (demand pull, technology push and systemic) and their interactions on renewable energy innovation in 15 European Union member states for the period 1995–2014. We first develop a conceptual framework and hypotheses, and then we test these by employing a unique and comprehensive data set. We find that renewable energy policies as a whole as well as demand pull and technology-push instruments affect renewable energy innovation positively and significantly. The impact of interactions between instruments on renewable energy innovation is also positive and significant, but that of specific pairs of instrument interaction is contingent on the specification used. We discuss reasons for these findings, implications for public policy, as well as limitations and opportunities for further research.
Keywords
Introduction
The use of fossil fuel as the primary energy source has been associated with environmental and climate challenges and concerns (Stern, 2006). In this context, a transition to renewable energy technologies (RETs) is widely regarded by the international community and national governments to be essential in addressing environmental degradation (Jacobsson and Bergek, 2003). It is widely held, however, that it is unlikely for the required transition to take place through market forces alone. The generation, diffusion, and deployment of RETs are said to face a number of barriers (Beck and Martinot, 2004), and market failures (Arnold et al., 2014; Wustenhagen et al., 2007). Such failures in turn can require suitable government intervention in support of renewable energy (RE) sources (Atkinson and Stiglitz, 1980; Helm, 2010; Mazzucato, 2013).
Public policy intervention can take place at the international, national or regional and province levels. International cooperation is often deemed as important to address problems of free riding, for example, countries not being diligent enough to foster requisite change for cost and/or competitiveness considerations (Bailey et al., 2015). Important public policy intervention at the inter-national level aimed to redirect innovative efforts towards RE has been initiated by the Kyoto Protocol (Rawlins and Allal, 2003). More recently, the global Paris agreement, adopted in November 2016, has set a binding limit in the global temperature increases to below 2°C. Such inter-national agreements can function as a constraint and/or incentive for national policy makers to adopt RE policies to reach the agreed targets. Key questions, however, are not only whether and how national governments can foster RE innovation but also through what types of policies and policy instruments.
If markets alone could solve the problem of transition to RE, no international agreements and no government intervention would be required. In addition, if government policies are not effective, or they create more problems than they solve (Atkinson and Stiglitz, 1980), the case for RE policies weakens. In order to address the above, we need a theory as to why public policy can be necessary, effective and useful. Many scholars have argued that public policy is indeed required in order to solve market failures and/or that the relationship between markets and governments is complementary and symbiotic, and hence public sector intervention can be of the essence in fostering RE transitions even in the absence of pervasive market failures. In this argument, governments can help create and indeed co-create markets (Pitelis and Teece, 2009), with the RE market being a key candidate and example (Atkinson and Stiglitz, 1980; Mazzucato, 2013; Rennings, 2000; Weber and Rohracher, 2012). Others, however, have argued that governments too fail and that such failures weaken the case for interventionist public policy (Helm, 2010).
A large body of the literature has addressed the extent to which RE policy fosters RE by focusing on the impact of RE policy on RE innovation. On balance, this has shown that public policy fosters RE innovation (Jaffe and Palmer, 1996; Johnstone et al., 2008; Nesta et al., 2014). However, for public authorities, it is also important to know which types of policies, different policy instruments as well as any interactions between them, are more effective (Sijm and van Dril, 2003; Sorrell, 2003 ). These issues need to be further examined in order to help ascertain the role of the policy instrument mix and provide useful information for public policy makers (Landini et al., 2017).
Our aim in this paper is to examine the relationship between public policy towards RE and RE innovation, at the aggregate level of all RE policies and all RETs, as well as at the level of three types of RE policy instruments and their interactions. Despite recognition of the importance of RE policy, and of the existence of different types of RE policy instruments and their interactions (Boots et al., 2001; del Rio et al., 2013; Gunningham and Sinclair, 1998; Oikonomou and Jepma, 2008; Simões et al., 2005), there exists little agreement on a common classification of the instruments concerned and little empirical evidence in the context of a common conceptual and empirical framework. These are important gaps that we aim to contribute in filling.
The conceptual framework employed in the RE literature often goes little further than the recognition of market failures as a basis for RE policy, while the link to industrial policy (IP) is rarely made. This is rather paradoxical as RE is an industry where substantial public policy intervention (IP) takes place. Moreover, and also because despite the interest in IP and strategy (Bailey et al., 2015), there is very little empirical-econometric work in support of its alleged positive effects. Our focus on IP in the RE sector helps address this gap in literature. 1 We focus on the EU member states because the EU is widely perceived as a leader in this area. In particular, the EU has aimed to develop EU-wide RE and innovation policies that aim to achieve the requisite targets with some degree of success (EC COM 130 final/2, 2014).
In the next section, we develop a conceptual framework and three hypotheses for estimation. First, we test for the impact of overall RE policies. Then, the impact of three types of RE policy instruments and their interactions on RE innovation is tested. To do so, we employ a unique database that we have constructed for EU15 member states (i.e. Austria, Belgium, Denmark, Germany, Greece, Spain, France, Ireland, Italy, Luxembourg, Netherlands, Portugal, Finland, Sweden, and the United Kingdom) for a period of 19 years (1995–2014) for which data were available. The results support the three hypotheses.
The remainder of the paper is structured as follows: The next section focuses on the background, conceptual and empirical literature and proposed hypotheses of the paper, then the empirical protocol is described. Then results are presented and discussed, and the last section provides concluding remarks, limitations and opportunities for further research.
Background to the study and hypotheses
Background
In the context of the widely acknowledged need for international collaboration to mitigate the impact on climate change of anthropogenic emissions, conventions relating to climate change known as conference of parties (COP) are held annually. The objective of the COPs is to review observance of the United Nations Framework Convention on Climate Change (UNFCCC) which came into force in 1994. A key meeting was COP3 (1997) where the Kyoto Protocol was adopted. By acting as a constraint and incentive for policy makers to adopt policies related to RE (Sterk et al., 2007), these help redirect the innovative efforts of national governments towards RE. Among those, the Kyoto protocol is important and is believed to have helped increase the expected size of the global market for clean energy and foster energy transition. Particularly, in the EU, the basis for a Europe-wide RE policy was set by the White Paper for a Community Strategy and Action Plan Energy for the future: Renewable sources of energy, in which a number of targets were proposed, including doubling the use of RE in the EU gross energy consumption (European Commission, 1997). 2
Most EU governments have adopted specific RE policies and policy instruments in order to satisfy the aforementioned objectives. As recently noted by Christensen et al. (2016), further development of innovation policy should include addressing what the most relevant instruments are, and how these are most appropriately designed and mixed. Among other challenges, this requires deciding on the right taxonomy (Martin, 2016). In the above context, we are interested in the extent to which IP in the RE sector is a success or not and in particular what types of IP instruments (and any interactions between them) are more effective. This adds to the literature in important ways, not least by providing econometric evidence on the effectiveness of IP which is lacking (Bailey et al., 2015).
In order to answer this and develop our conceptual framework and hypothesis, we first look into the extant theory and evidence on these matters.
Literature and hypotheses
Discussion about the nature and importance of innovation dates at least as far back as in the work of Joseph A Schumpeter (1934), who defined technological change as new combinations pertaining to the organization of production and exchange and distinguished among three different aspects of innovation; invention, innovation, and diffusion (Schumpeter, 1934). Since then, innovation has been widely seen as a desirable generator of positive knowledge spill-overs, which help engender systemic benefits. Like all ‘externalities’ (factors whose economic impact is not reflected on market prices), however, it is widely believed that innovation is subject to market failures, making it likely that in the absence of supporting measures and policies, it will be undersupplied (Mazzucato, 2013; Stoneman, 1995; Varian, 2003). In addition to knowledge externalities in the research and innovation phases, RE innovations can engender positive externalities in the adoption and diffusion phases. 3 The undersupply of RE innovations can result from the lack of incentives for firms to invest in RE innovation since the private return on R&D in RETs is less than its social return. This helps justify the need for public policy intervention (Oltra, 2008; Rennings, 2000). 4 In addition, innovation does not automatically guarantee that the development it fosters will be sustainable. For sustainable development, innovations in RE are required as they may facilitate the transition to RE. This renders important the question of the determinants of innovation that help foster RE transitions and sustainable development.
There are two main theoretical perspectives concerning the determinants of innovation at the national level. One is the economics-based endogenous growth theory of Romer (1990) and the other is Nelson’s (1993) research on national innovation systems (NISs) based on institutionalist economics (Furman et al., 2002). Drawing on these, Furman et al. (2002) proposed that national innovative performance is determined by a broad set of complementary influences which include institutional and policy-related factors, industry and cluster-related factors and their interactions. Furman et al. (2002) argued that public policy has a significant role in shaping a country’s national innovative capacity. This view is shared by the NIS approach which moreover emphasizes complementarities between different actors and institutions of innovation. In the IS framework, innovation is seen as a complicated evolutionary process ‘distributed in a system of multiple socio-economic agents whose behaviour and interactions are governed not only by market forces but to a greater extent by non-market institutions’ (Bleda and del Río, 2013: 1039). 5 This view is complemented by arguments of scholars such as Arnold et al. (2014), Mazzucato (2013), Rennings (2000) and others who suggest that solving market failures with complementary public and private policies is a good way through which we can achieve the requisite transition to RE. A challenge, however, is how exactly and what type of RE public policy and instruments can be more potent in helping achieve the targets (Beck and Martinot, 2004; Sterk et al., 2007; Wustenhagen et al., 2007).
Moreover, while it is widely recognized that markets alone cannot guarantee requisite transition to RE, there is also an understanding that government policies too can lead to failures (Atkinson and Stiglitz, 1980). These result from errors in targeting and implementation, lobbying by interest groups, and rent seeking (the pursuit of self-interest that can lead to corruption) of government officials, (Atkinson and Stiglitz, 1980; Helm, 2010; Jaffe et al., 2005). Despite acknowledging government failures, there seems to be a degree of consensus in the literature that at the aggregate level RE policies will have a positive effect on RE innovation (Böhringer et al., 2014; Brunnermeier and Cohen, 2003; Dechezleprêtre and Glachant, 2014; De Vries and Withagen, 2005; Lanjouw and Mody, 1996; Popp, 2006; Wagner, 2007). Eventually, however, this is an empirical question, not a matter of belief; hence, it is a key aim of this paper. 6
An important advantage of econometric investigation is that it helps gauge the extent to which RE policies have a positive and significant effect on RE innovation, after having controlled for other determinants. Hence, it is mostly through an econometric investigation that the added value of REPs, or their ‘additionality’, namely ‘the difference between the presumed underinvestment in RTD by firms and the actual joint investment by firms and public agencies in RTD prompted by the public programmes’ (Luukkonen, 2000: 712) can be assessed. We summarize the aforementioned discussion in a schematic way in Figure 1. In brief, the Figure suggests that in the context of pervasive market failures, international agreements such as the Kyoto Protocol operate as a constraint and incentive for governments to adopt RE policies and RE instruments (government intervention) aimed at fostering RE innovation. These are in addition to other reasons governments may have to adopt RE policies. Hence, innovation in RE becomes our dependent variable and RE policy instruments become our main independent variables (IVs). RE innovation is also affected by various other factors which we use as control variables.
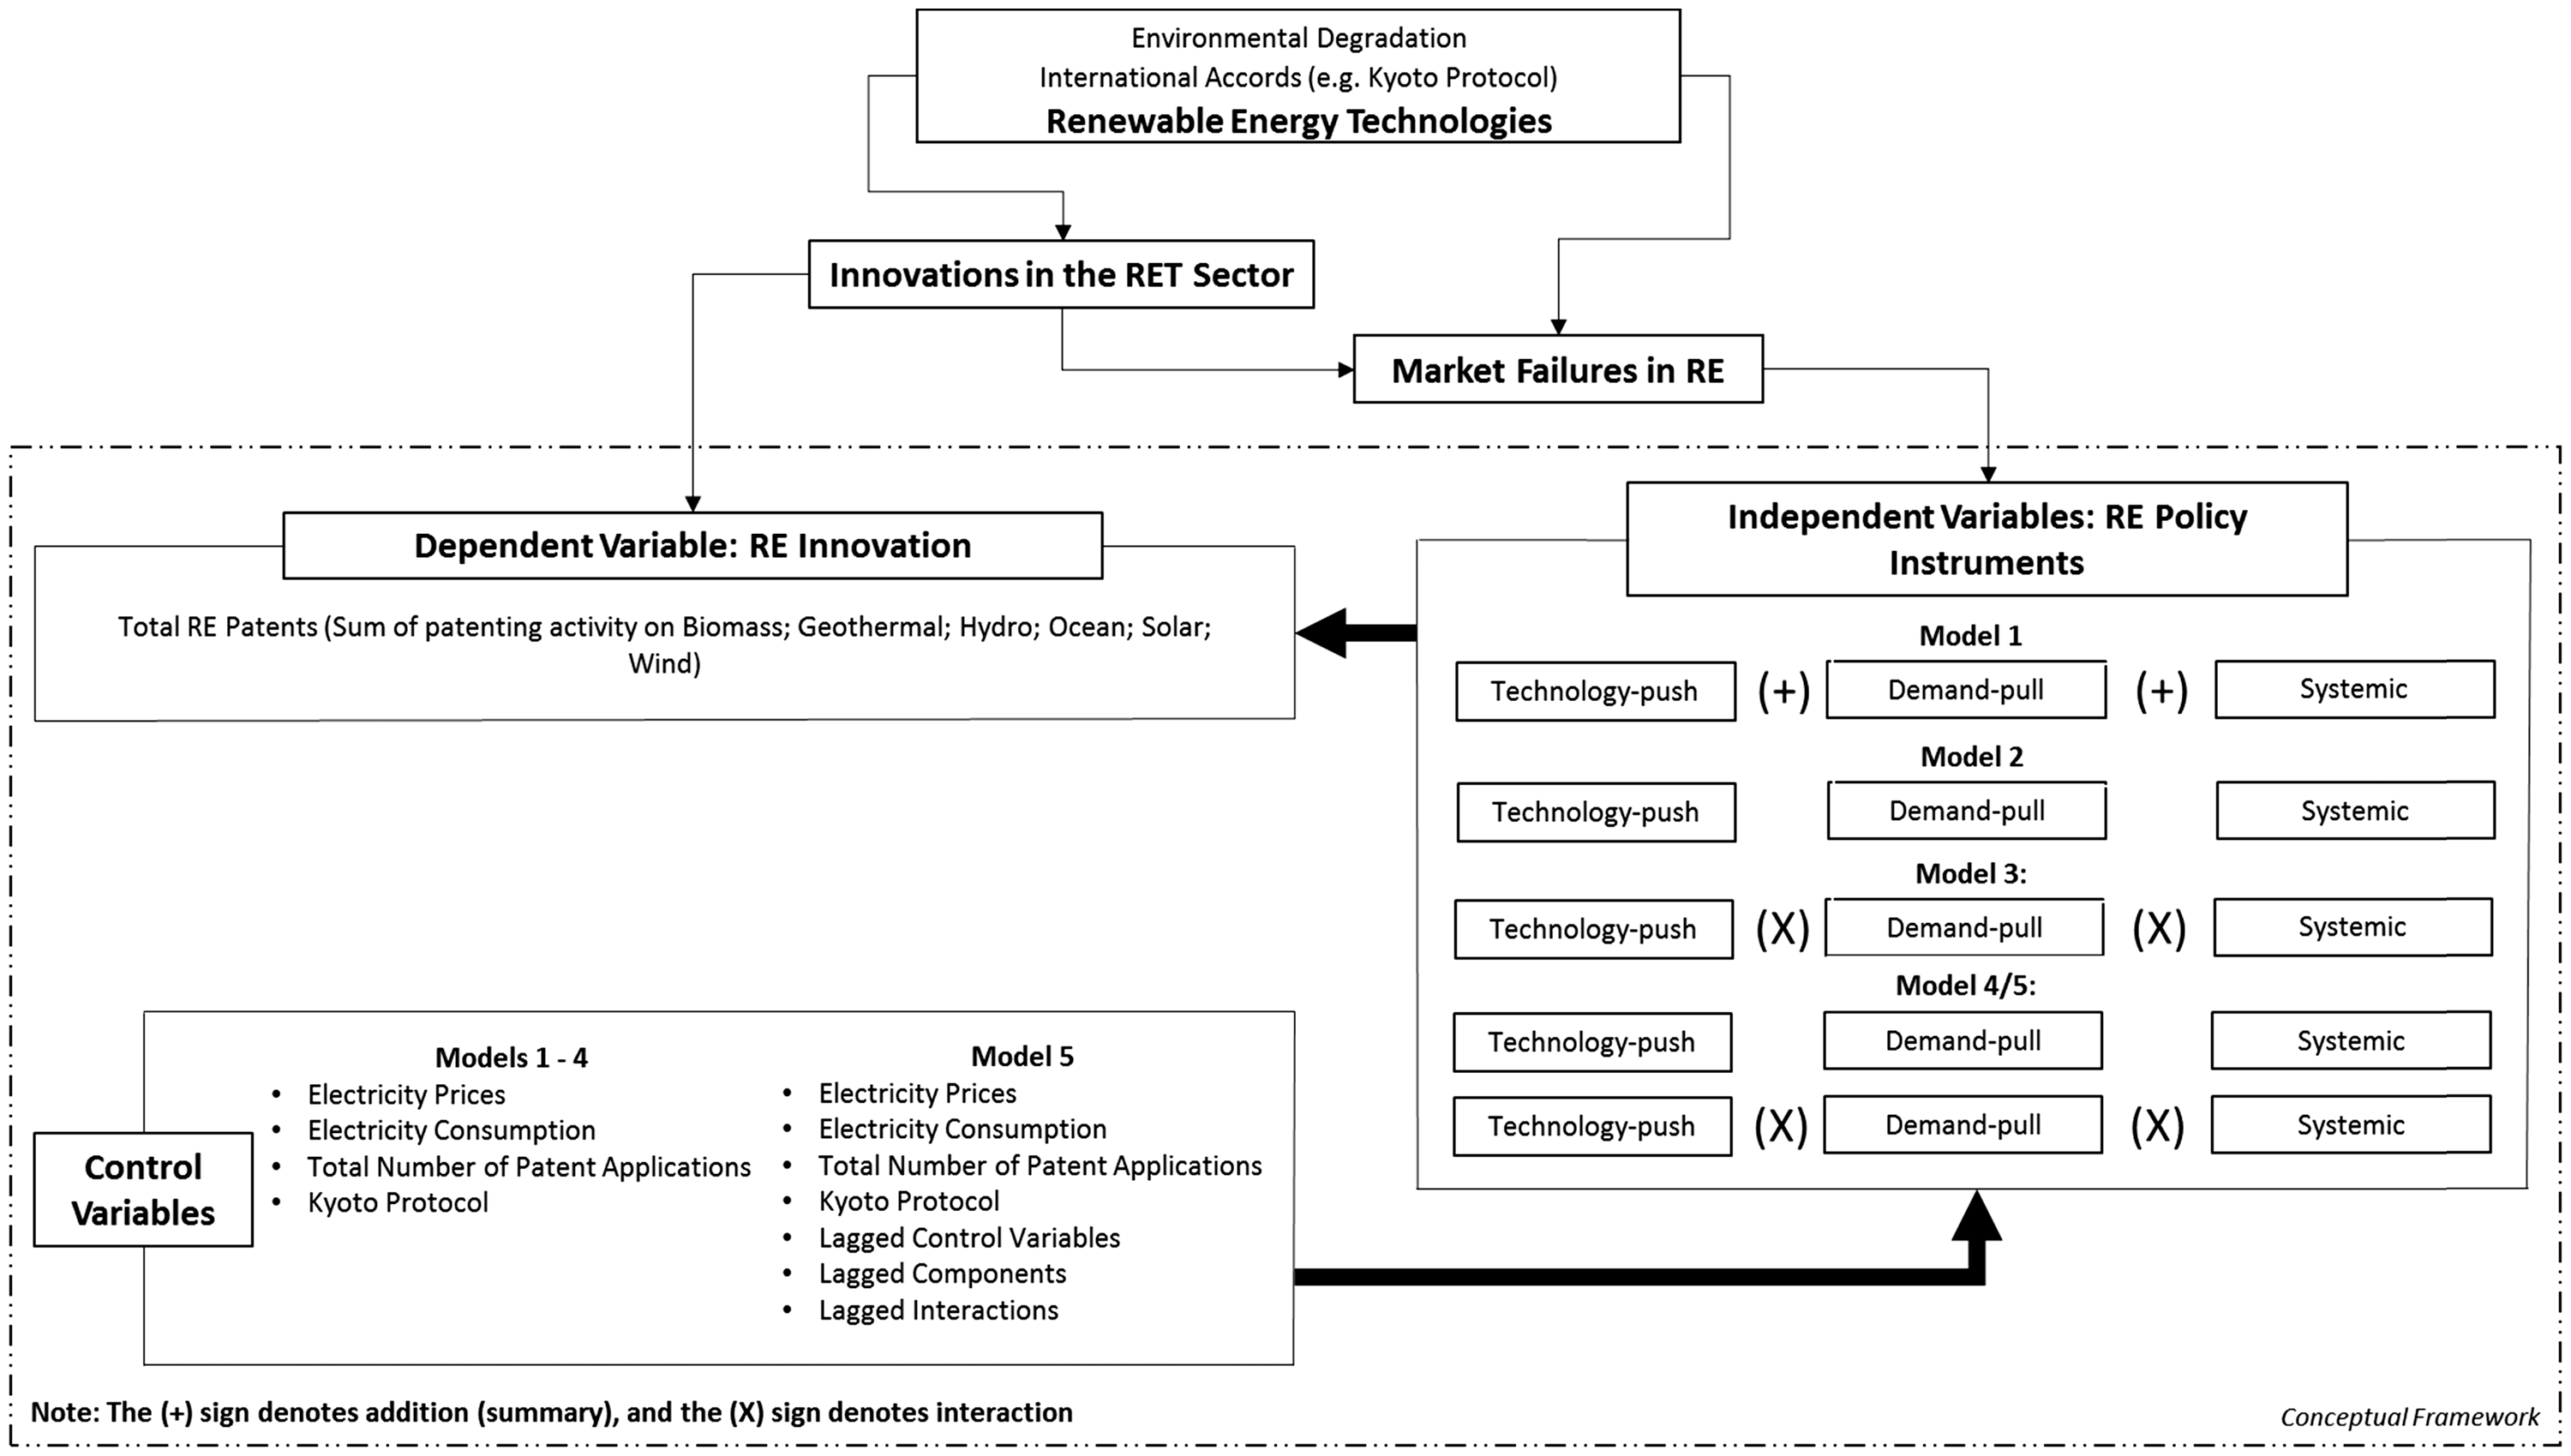
Background to the study and conceptual framework schematic (Source: Author).
The above discussion leads us to formulate our first hypothesis in the following way.
The basis of our second hypothesis lies in the fact that public authorities can use a number of different instruments in order to promote RE. However, there is not a uniform classification of instruments types. This is problematic in that it renders findings from different studies that use different classifications hard to compare. 7 Drawing on earlier work on innovation (see for example Nelson, 2009; Nemet, 2009; Rosenberg, 1974), Rogge and Reichardt (2016) have argued for a consistent terminology and went on to propose that in terms of purpose served, three types of instruments, namely technology-push, demand-pull, and systemic are in line with extant theory and can help with comparability (Rogge and Reichardt, 2016).
Technology-push are policy instruments that aim to foster technological change in RE from the supply side (the innovators), while demand side policies aim to foster RE innovation by increasing the demand for it (Nemet, 2009). Examples of technology-push include government-sponsored R&D and tax credits for companies to invest on R&D. The technology-push argument assumes that advances in scientific understanding help determine the rate and direction of innovation. This has been criticized in terms of ignoring changes in economic conditions (e.g. prices) that affect the profitability of an innovation, as well as ignoring feedback effects within the stages of the innovation process (Nemet, 2009). In addition, the technology-push idea has been argued to be dependent on the exploitable ‘technological opportunities’ and the ‘strength of science’ in each sector (Klevorick et al., 1995; Nelson, 2009; Rosenberg, 1974). Moreover, it has been argued that firms need to invest in scientific knowledge in order to develop their ‘capacity to absorb’ 8 knowledge and leverage the opportunities that emerge from advanced technologies (Cohen and Levinthal, 1990; Nemet, 2009; Rosenberg, 1990). As a result, it has been suggested that technology-push-type policies work better when they are supported by other policies (Mazzucato, 2013; Nemet, 2009).
The demand-pull perspective sees demand as a driver of the rate and direction of innovation, arguing that demand factors increase the market for and improve the incentive of firms to innovate. Demand is a critical test of the existence of a market for any product, and an indication that prices are aligned with the willingness to pay by buyers. Supply without demand is not sustainable and eventually leads to the failure of the suppliers, as they cannot realize the benefits of their investment. Examples of demand-pull instruments used to prop up demand include tax credits and rebates for consumers of new technologies and taxes on competing technologies.
The third type, titled systemic instruments are said to include those which act at the level of the innovation system as a whole instead of specific parts of innovation systems (Smiths and Kuhlmann, 2004). They act as a platform that helps the better realization of demand pull and technology-push advantages. They also aim to align the instrument mix to the needs of the actors involved and to promote collaboration and knowledge transfer, like for example cooperative R&D programs, and clusters or infrastructure provisions (Smiths and Kuhlmann, 2004). Examples include tax and subsidy reforms, infrastructure provision, cooperative RD&D grants among other (Rogge and Reichardt, 2016). Some scholars have seen systemic instruments as novel means that can stimulate technological innovation for sustainability (Smiths and Kuhlmann, 2004; Wieczorek and Hekkert, 2012).
Hence, our second hypothesis takes the following form.
Furthermore, RE policy instruments may interact with each other, as noted before. The role of an interaction variable is akin to that of moderating variable, which are deemed important when the impact of an IV on the dependent one is based on a third variable, known as the moderator; and the fit between the IV and the moderator is what determines the dependent one (Venkatraman, 1989). 9 In the case of policy instruments, their interactions have been argued to be potentially important in that there may exist synergies, overlaps and/or clashes between instruments (Michelsen, 2005; Mundaca and Neij, 2010; Rogge and Reichardt, 2016; Sorrell, 2003).
The exact type and significance of interactions can depend on numerous factors that cannot be known in advance. These include context, design and technology type among others (see Cantner et al., 2016; Costantini et al., 2015), as well as different lag structures. Cantner et al. (2016) for example identified differences between different examined RETs. 10 In one of the first studies conducted by Gunningham and Sinclair (1998), the authors concluded that the combination between different regulatory instrument combinations was important and that different combinations had different effects (Gunningham and Sinclair, 1998).
This leads to our third hypothesis.
Empirical evidence
Below we look at existing empirical evidence in terms of two major categories: first studies on the overall impact of REPs and REP instruments on total RE innovation as well as on different RETs; and second, studies that looked into interactions between REP instruments. In the first category, we distinguish between general studies, those focusing on specific RETs and those that examine the role of different institutional settings. This is followed by our assessment of the evidence.
Evidence on the impact of REPs on RE innovation
Johnstone et al. (2008) analysed a panel of 25 countries over the period of 1978–2003. By employing a Poisson regression analysis and with patent counts as their dependent variable and the RE policies as their independent, the authors concluded that RE policy plays a significant role in determining patent applications, and also that different types of policy instruments are effective for different RE sources (Johnstone et al., 2008). Marques and Fuinhas (2012) examined the extent to which public policies towards RE are effective, using panel corrected standard errors estimator (PCSE) over the whole spectrum of RE technologies. They used the contribution of renewables to total energy supply as their dependent variable, and aggregated and disaggregated RE policies as their independent (Marques and Fuinhas, 2012). They concluded that policies of incentives/subsidies (incl. feed-in tariffs) (demand-pull instruments) and policy processes (systemic instruments) are significant drivers of improved RE use.
In terms of the impact of REPs on specific RETs, Lee and Lee (2013) also supported the idea that REPs have a positive effect on RE innovation, by having explored patterns of innovation and of evolution in energy technologies (incl. solar, photovoltaic, biomass, wind, tidal (ocean), and geothermal), focusing in particular on similarities and differences across technologies. They employed two different techniques (static portfolio and dynamic portfolio analysis) and patent data over the period 1991–2010 and concluded – among others – that customized policies are likely to be required for each technology (Lee and Lee, 2013).
Hoppmann et al. (2013) conducted comparative case studies to a sample of 9 firms globally, producing solar photovoltaic modules, complemented by in-depth interviews with 16 top photovoltaic industry experts. They concluded that demand-pull policies have a greater impact when they target more mature technologies (Hoppmann et al., 2013). Dechezlepêtre and Glachant (2014) examined the influence of both domestic and foreign REPs on innovation activity in wind power using patent data from 1995 to 2005 for OECD countries. They distinguished between demand-pull policies and technology-push policies and concluded that public R&D expenditures (technology-push instruments) only affect domestic inventors, contrary to demand-pull ones.
Costantini et al. (2015) explored the differentiated impact of demand-pull and technology-push instruments but in shaping technological patterns and in the biofuels sector. The empirical analysis was based on a database containing patents in the field of biofuels as the dependent variable for 32 countries (incl. some EU) using a negative binomial regression analysis (NBR). They concluded that demand-pull and technology-push factors are important drivers of innovation in the biofuels sector. In addition, technology exploitation activities in first generation technologies were mainly driven by quantity and price-based demand-pull policies. In contrast, the pace of technology exploration efforts in advanced generation biofuels was shown to react positively to price-based demand-pull incentives and to technology-push policy (Costantini et al., 2015).
In the third sub-category, Nesta et al. (2014) examined the effect of various RE policies on innovation for different levels of competition. In line with Johnstone et al. (2008), the authors employed a Poisson regression analysis, with patent data as the dependent variable and the RE policy index (sum of all implemented policies – as in Johnstone et al. (2008) – expressed as dummies), and the product market regulation index – PMR index for electricity and gas as the independent. They found that RE policies are more effective in forecasting green innovation in countries with deregulated energy markets as well as that public support for RE is crucial only for the generation of high-quality green patents, while competition enhances the production of green patents regardless of their quality (Nesta et al., 2014).
Evidence on the role of interactions
In 2003, the INTERACT project explored the relationships between the EU ETS and other climate policy instruments. A basic distinction in this study was the internal and external interaction. The former referred to two or more climate policy instruments, while the latter to a climate and a non-climate policy instrument (environmental or energy policy). A typical example is an emission trading scheme and a carbon tax that affects the same participants, while for the second case, an emissions trading scheme that targets electricity generators and an energy tax at the point of consumption, irrespective of the carbon content of the energy used (Sijm and van Dril, 2003; Sorrell, 2003). Furthermore, an important division in the same study at the level of governance was horizontal and vertical interaction. Horizontal referred to the same level of governance (e.g. EU ETS and EU labelling for energy efficiency appliances) while vertical to different levels (e.g. RE Certificate System (RECS) with TGC in one-member state). Other types of policy interactions distinguished in this study were operational, sequencing and trading (Sorrell, 2003).
In a similar vein, Oikonomou (2004) in the EU SAVE project ‘White and Green’ analysed the issue of compatibility between different policy types and types of interactions. Simões et al. (2005) assessed the overlap between energy and environmental policy instruments in place among electricity systems. She concluded that a tangled web of policies exists, which in some cases pushes towards complementary objectives but that most of the times these are antagonistic. The most relevant conflicts are between hidden subsidies provided to energy supply infrastructures and environmental command-and-control regulation. Although there are policy instruments acting both on the supply and the demand side, this was found not to foster the integration of supply and demand-side policy instruments (Simões et al., 2005).
Later studies have focused mainly on the interactions of various policy instruments with the EU ETS (Kautto et al., 2012; OECD, 2011a), on interactions of climate change and other environmental policies and the tax (fiscal) system (Goulder, 2013) or like in del Rio’s (2014) study, on the theoretical and methodological framework for assessing the success of complex policy mixes, in order to identify conflicts between individual instruments and other elements within those mixes. Del Rio (2014) concluded that instruments may lead to conflicts, complementarities or synergies with regard to one criterion when the addition of one instrument to another leads to reductions, adding or magnifying the impact of the combination of both instruments (del Rio, 2014).
Guerzoni and Raiteri (2015) concluded that supply-side subsidies (technology-push instruments) are not as effective as suggested in the previous literature when controlling for the interaction with other policies and also that innovative public procurement (a demand-pull instrument) seems to be more effective that other tools. Overall, technology policies were found to exert the highest impact when they interacted with other policies (Guerzoni and Raiteri, 2015).
Assessment of evidence
Overall and with the exception of Cantner et al. (2016) and Guerzoni et al. (2015), studies on instrument interactions have mainly focused on qualitative methods, by focusing on specific aspects of instruments (such as the scope, operations, implementation, timing (see Sorrell, 2003), mechanism, target stakeholder (see Simões et al., 2005) and objective (Sorrell, 2003 and Simões et al., 2005), on specific RETs (see Kautto et al. (2012) who focused on biomass). In addition, they have done so by employing mostly qualitative methodologies, including possible scenarios (Boots et al., 2001) and optimal designs (best-case scenarios) (Boots et al., 2001), case studies (see Sorrell, 2003), literature reviews (Goulder, 2013; Oikonomou and Jepma, 2008) and other (Kautto et al., 2012 (literature review and interviews); Boots, 2003 (conclusions reached by discussion). This renders further econometric work on this topic very important.
In addition to the limited empirical evidence on this matter, existing studies have focused on different types of RE technologies, such as for example Johnstone et al. (2008) and Nesta et al. (2014) on Biomass, Geothermal, Ocean, Solar, Waste-to-energy, Wind; Hoppmann et al. (2013) on PV modules; and Dechezleprêtre and Glachant (2014) on wind energy. In addition, there is not consistency in the RE policy instruments examined, therefore making the comparison of results difficult. For public authorities, it is important to know which types of instruments are more effective in achieving the required targets, both in general and as regards fostering particular types of technologies and with particulate types of instruments.
In conclusion, there are various gaps and limitations in literature that pertain mostly to the underlying theory (particularly that of IP), the limited econometric evidence, and the comparability between the results. These gaps we aim to address below to the best of our ability, based on our conceptual framework and hypotheses as well as our unique and comprehensive data base.
Description of the empirical protocol and results
Empirical method, sample, and estimated equation
In order to test our three hypotheses econometrically, we have collected data on the EU15 Member States in the time-span between 1995 and 2014. We have employed five different models, as follows.
In Model 1, we examined the first hypothesis, i.e. the effects of REP instruments at the aggregate level, on the overall RE innovation activity, using the sum of all RE patent counts as our DV, and sum of all instrument types as our IV. A standard model setting was considered, in the following form
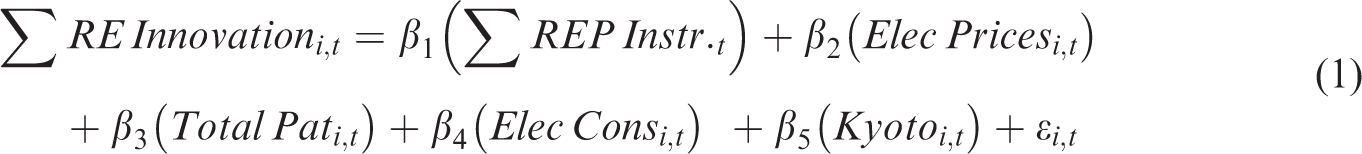
In Model 2, we examined the effects of the three types of RE policy instruments on RE innovation at the aggregate level (second hypothesis), i.e. sum of all RE patent counts as our DV, and sum of each type of instrument as our IV. A standard model setting is again considered in the following form

In Model 3, we have introduced the interaction terms
11
in order to assess their effects (third hypothesis). The sum of all RE patent counts is used as our DV, and REP instruments interaction as our IV. Again, a standard model setting was considered, in the following form
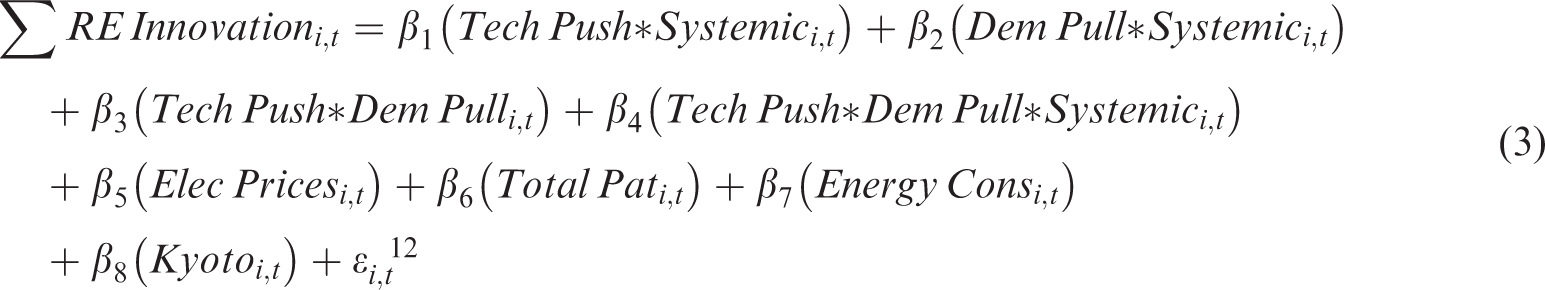
Model 4 is a variation of Model 3 and its form therefore will be the addition of equations (2) and (3). It examines the effect of the aforementioned interaction terms alongside their component variables (the three types of RE policy instruments) on RE innovation. A standard model setting was again considered, where the sum of all RE patents is used as our DV, and the sum of each type of instrument as well as the REP instruments interactions as our IV.
Given some differences in the results when instrument interactions were examined in isolation, versus alongside their components, we have rerun Model 4 with the first lag of all IVs (Model 5). Our aim here was to test for the extent to which any observed differences between the two variants of Model 4 could be attributable (among of course other factors) to different lag structures.
The use of data for various countries over various years implies the need for analysing panel data, while the use of patent data as a proxy for innovation implies that we have count variables. Marques and Fuinhas (2012) argued that in such cases, conventional panel data estimators, random effects and fixed effects are inefficient and can lead to the erroneous exclusion of (the examined) policies (Marques and Fuinhas, 2012). In addition, count data can be econometrically examined either by using the Poisson regression model (PRM), or the negative binomial regression model (NBRM) (Greene, 1994). These methods are used in order to estimate the number of occurrences of an event which in the case of this paper, the event count 13 is the number of patent applications filed in the EPO/PCT (Johnstone et al., 2008). However, using the PRM can result in biased results when there are a lot of zero values as well as over-dispersion (i.e. when the variance exceeds the mean – the case in our study). This can be overcome by using the NBRM which transforms the equations to log linear and introduces unobserved heterogeneity across the Poisson means (Costantini et al., 2015). The main way, however, to choose between the two is by examining the variance and the mean of the dependent variable. The variance of our dependent variables was found in all cases to be larger than the mean, implying over-dispersion. Therefore, the NBRM method was employed, which allows the variance to be greater than the mean, while scaling the standard errors (Hilbe, 2011).
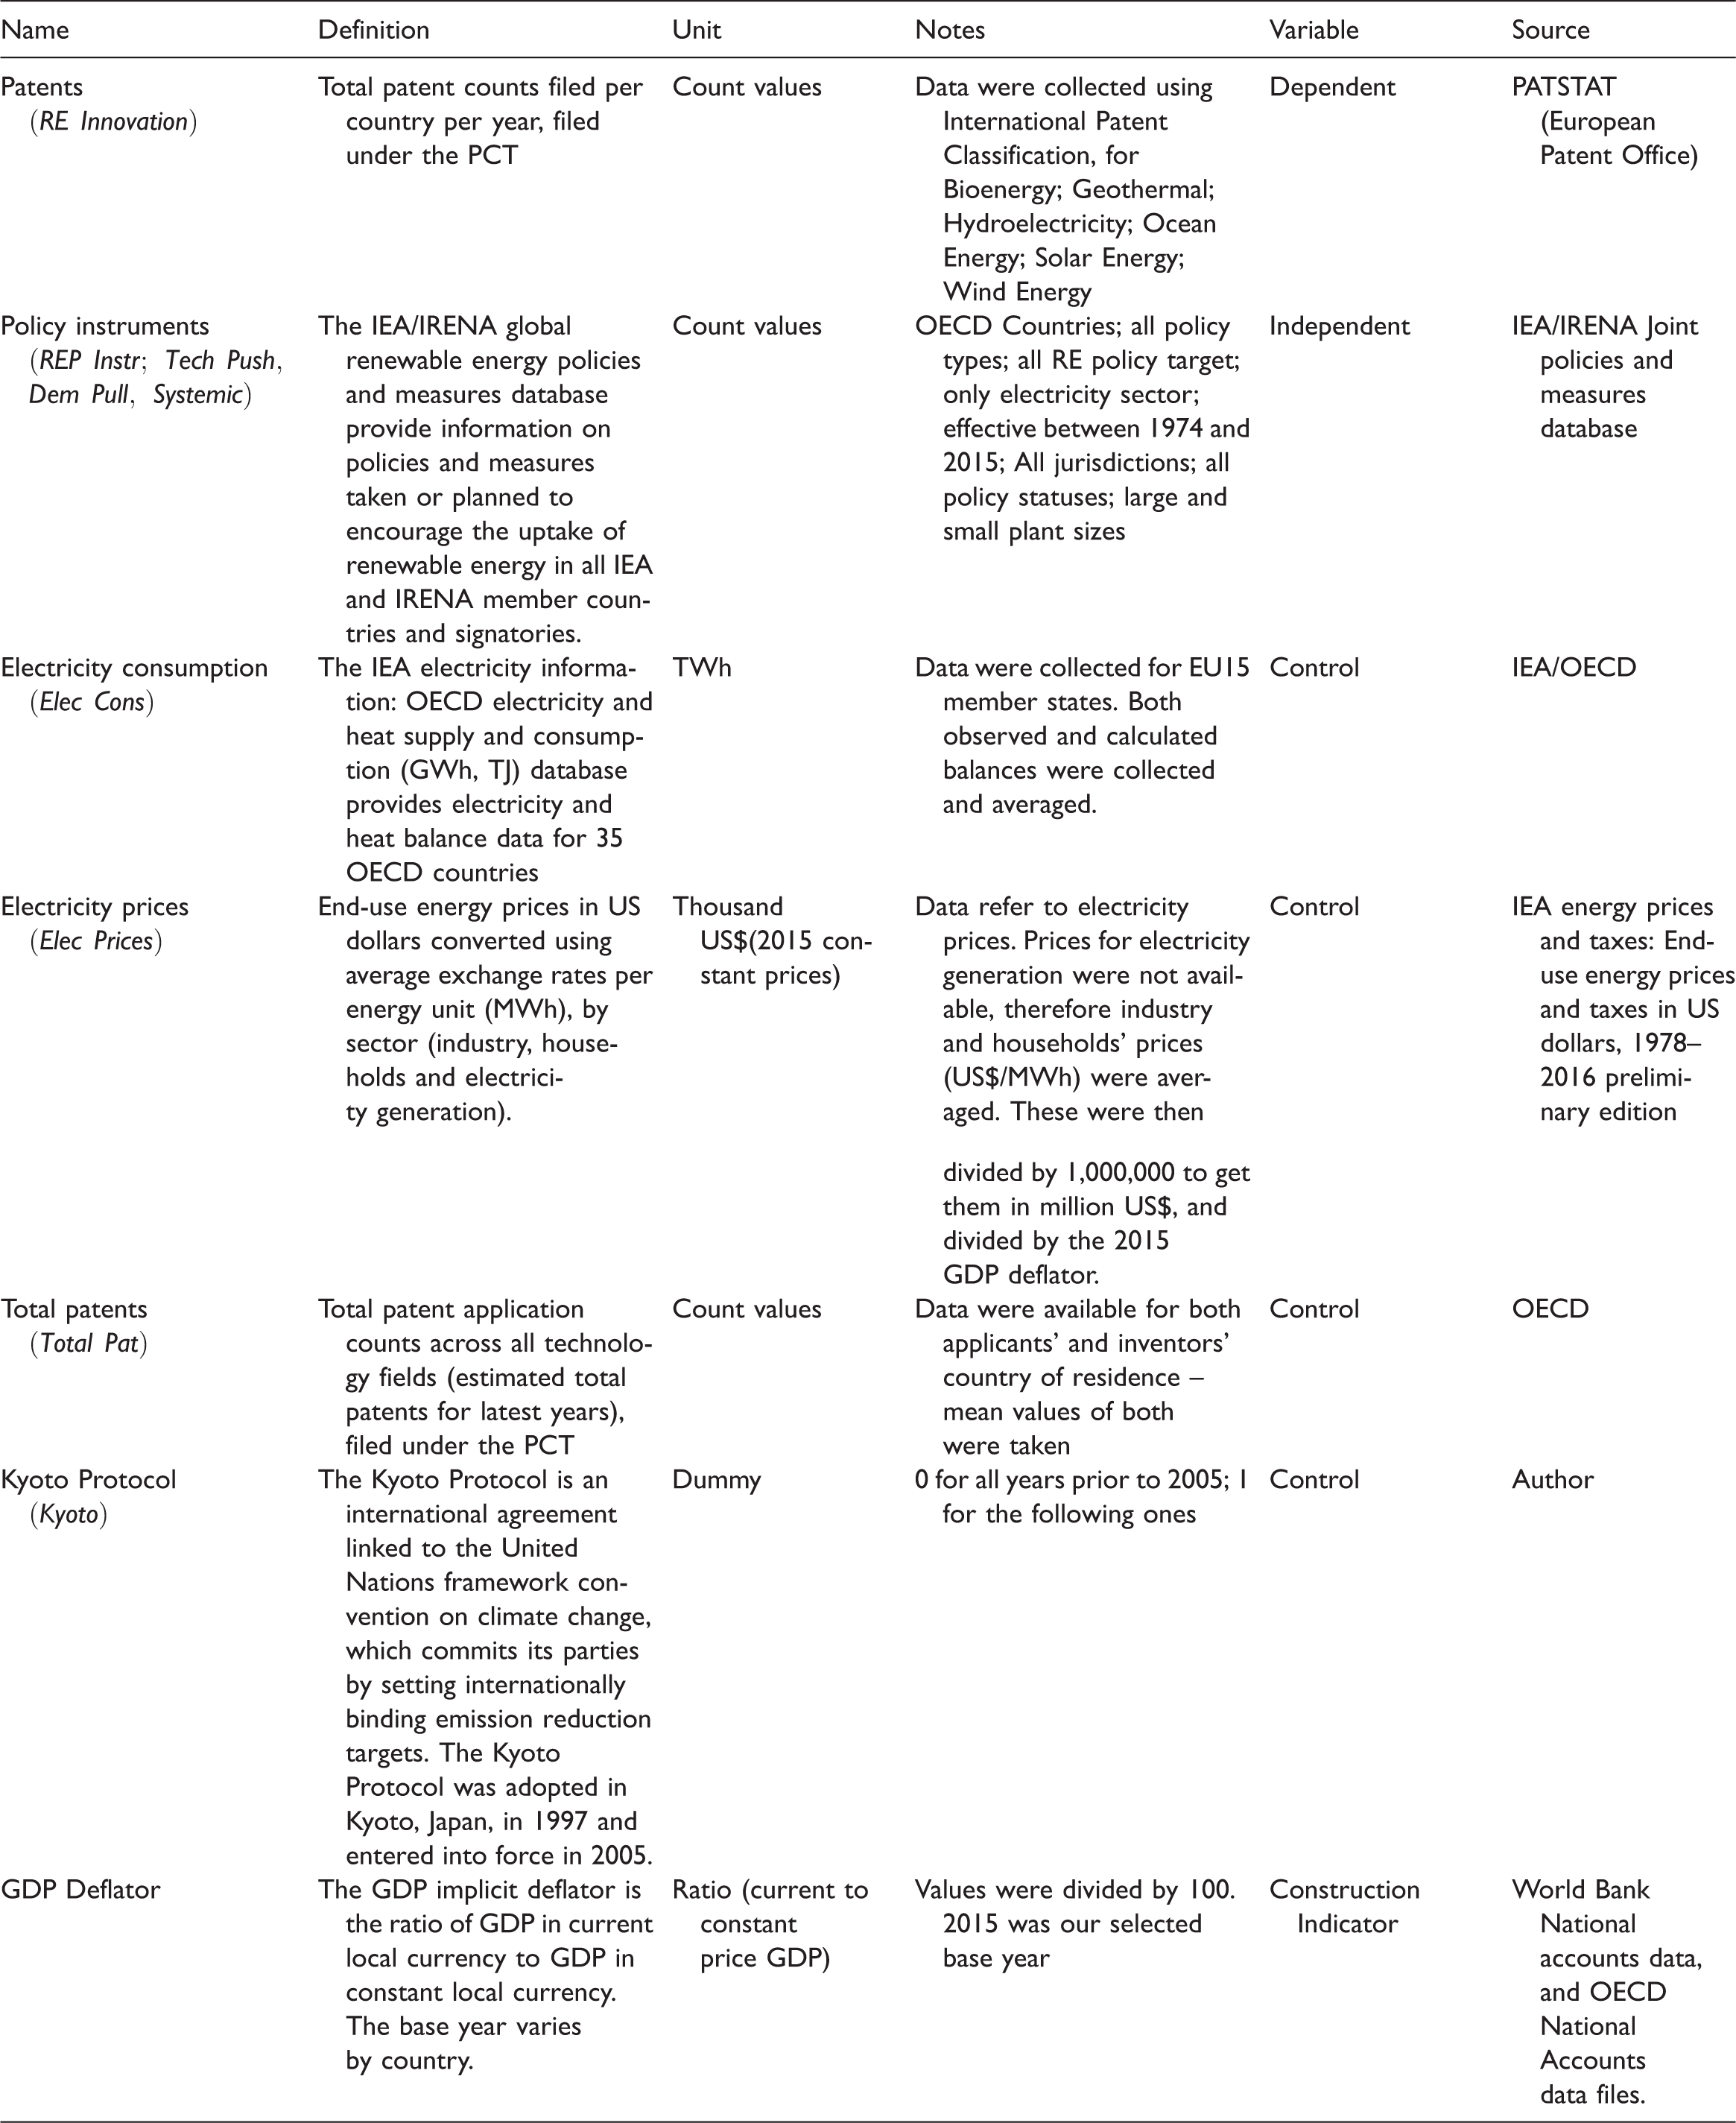
The following sections describe the various variables employed in our estimations, a summary of which can be found in Table 1. The descriptive statistics of all our main variables are reported in Table 2.
Summary of variables and variables’ abbreviations (in brackets).
IEA: international energy agency.
Descriptive statistics of variables.
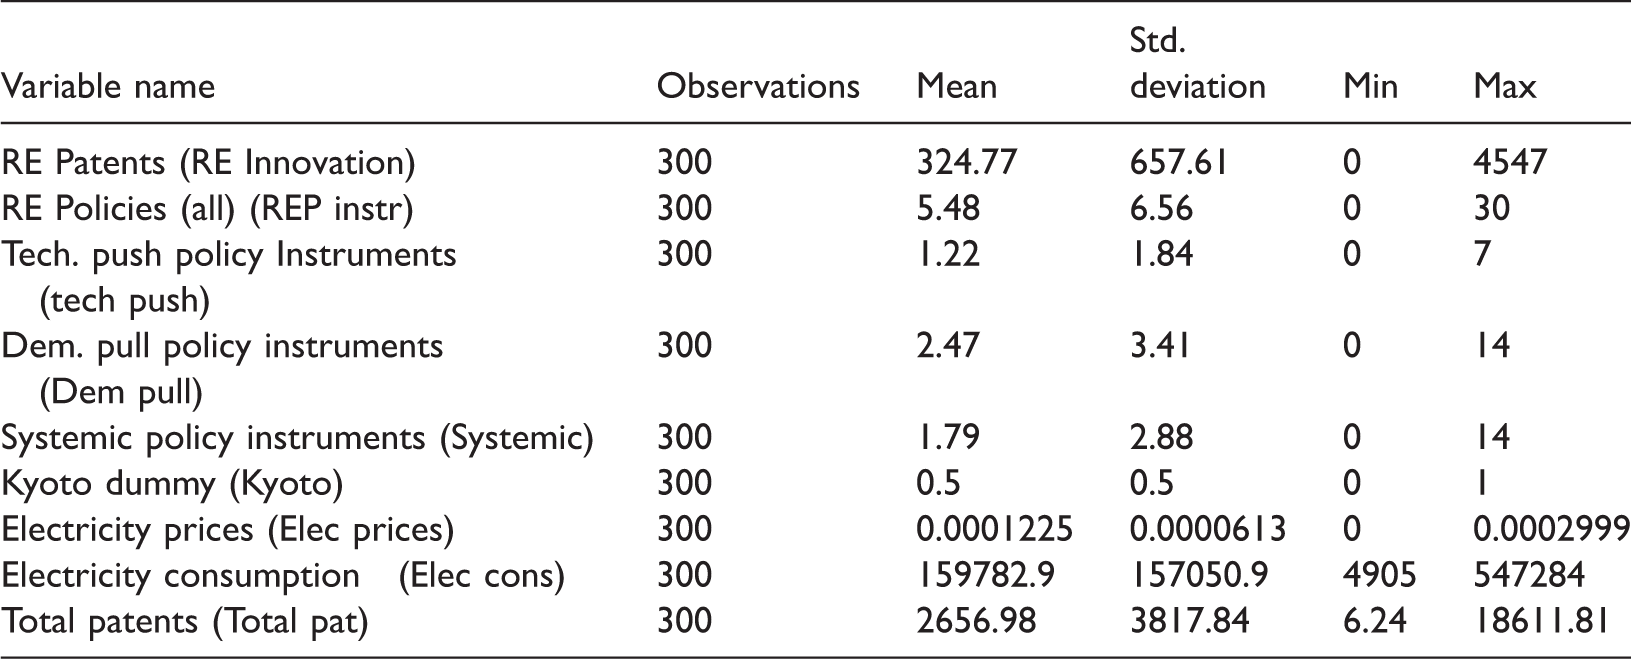
RE: renewable energy.
Dependent variable: RE innovation
In general, innovation can be measured both by means of input measures (such as R&D expenditure), and output (yield)-oriented measures which account for the results of the innovation process, such as patenting activity (OECD, 1996; Smith, 2004). Since we are mostly interested in the output of the innovative process, and in accordance to the OECD (1996) Oslo Manual, innovation will be measured using patent statistics (related to RETs). Data availability and comparability of results are additional reason for this choice.
The use of patents has been criticized in terms of their efficacy in proxying innovation and for potential biases (Nelson, 2009), for their importance, their existing variation in the propensity to patent across countries and sectors, and their uncertainty in comparing information as a result of the differences in patent regimes for different countries (Johnstone et al., 2008). Despite these limitations, a number of advantages of using patents as an innovation indicator are cited in the literature, such as the fact that patents are granted for ‘inventive technologies with commercial promise’ (i.e. innovation) (Smith, 2004: 159), the availability of data, and their long history of records (the only innovation indicator extending back over centuries), and the classification of technologies into a detailed and slow-to-change system (Smith, 2004). Therefore, patent data are the most commonly used measure of innovation, and it has been suggested that they should not be excluded as a statistical indicator (OECD, 2001).
We have collected patent data from the latest (2016) online free version of European Worldwide Patent Statistical Office (EPO) database (PATSTAT) for the OECD member states. In accordance to the existing literature (Johnstone et al., 2008; Nesta et al., 2014), the International Patent Classification (IPC) system was used as it allows distinguishing between inventions across different RE technological fields in Biomass, Geothermal, Hydro, Ocean, Solar, and Wind. PCT patent applications in the international phase were considered, and filed directly at the International Bureau of the World Intellectual Property Organisation (WIPO). The patents were assigned to a country on the basis of the address of the inventor. The date of the patent is the earliest priority date.
Since EPO/PCT applications are more expensive than national patent office’s applications, inventors usually first file a patent application in their home country, and then apply to the EPO/PCT in the case when protection in multiple European countries is desired (Johnstone et al., 2008). However, costs will be much lower by filing with the EPO/PCT than if individual applications are made to each country (Popp, 2006). As a result, the EPO data are more suitable than national patent offices’ data since the difference in costs provides a quality hurdle which eliminates applications for low-value inventions (Johnstone et al., 2008).
Overall, a total of 102,830 patent counts were, with most coming from Denmark, followed by Luxembourg and Austria. As compared to the overall EU RE patenting activity (EU27 for the same years 1995–2014), the aforementioned member states account for 98.3%. 14
Independent variable: RE policies and RE policy instruments
For the purpose of this paper, data on RE policies were obtained from the International Energy Agency (IEA) database for all EU member states for the years 1995–2014. Policies can target one or more RETs, as well as one or more RE sector. For example, in 2000, the UK introduced the RE obligation, which targeted all RETs and was applicable across all sectors (e.g. electricity, heating and cooling, and transport). In the same year, the UK also introduced the Energy Crops Scheme, which targeted only biomass-related technologies, and was only relevant to sectors related to power and heat. In a similar manner, in 1990, Germany introduced the Environment and Energy Saving Programme which provided loans specifically for onshore and offshore wind technologies, for biomass technologies related to power, heat, and transportation, and for solar technologies related to the heating sector. Germany’s Integrated Climate Change and Energy Programme (2007), however, targeted all RETs across all sectors. 15
Instruments were classified as technology-push, demand-pull, and systemic, by systematically reviewing the descriptions of each individual policy, in accordance to the examples provided by Rogge and Reichardt (2016), and Groba and Breitschopf (2013). It should be noted that some instruments fell into more than one type. In such cases, a count was attributed to both. Previous studies have also summed all implemented policies (see Johnstone et al., 2008; Nesta et al., 2014). Our adopted classifications allowed for the treatment of the resulting variables as count variables, as they were not diverse in character.
Control variables
Inducing green innovation is not only a matter of public policies. We therefore need to control for factors other than policies, which may foster innovation. In line with the literature, it is expected that the price of electricity would amplify the incentives for innovation in RE (Johnstone et al., 2008). It is assumed that these prices are exogenous; given that RE sources have in the past and up until recently contributed fairly small percentages towards the overall share of electricity production (World Bank, 2010) (although many countries have now reached their targets e.g. Denmark and Germany). Values per year and per country for end-use electricity prices in US dollars were obtained from the IEA Energy Prices and Taxes database. These were converted in constant 2015 US$ using average exchange rates per energy unit (MWh), by sector (industry, households and electricity generation).
In addition, to the above, the total number of patent applications across the whole spectrum of technological areas per year, per country filed in the PCT was also included as a control variable. This variable accounts for the overall propensity of a country to innovate, while taking into consideration only patents filed in the PCT (Johnstone et al., 2008; Nesta et al., 2014). Furthermore, returns on innovation are affected by the potential market for this innovation. In the case of RE, this is best reflected in trends for electricity consumption. A large growing market for electricity should increase incentives to innovate with respect to RETs. Data on household and industry sector electricity consumption were obtained from the IEA/OECD Database, in GWh.
Finally, we augmented our model by including a dummy variable set to unity for years after the Kyoto protocol came into force in 2005, in order to capture changes in expectation on both the context for future policy and the global market size for RE (Nesta et al., 2014). We have also included year dummies in order to reduce the impact of any aggregate trends. Significant coefficients show the importance of such effects in particular years, and it is sometimes suggested that even in the case of non-significance, the direction of the relationship can be important (Grotenhuis and Thijs, 2015). In Model 5, we have used the one year lags of all (non-dummy) IVs also in order to check for any specific lagged effects, as opposed to using an all-inclusive LDV (see Blundell et al., 1995).
Empirical results and discussion
Table 3 summarizes the main results of the NBRM in which the main variables of interest for the first three Models (as explained in the previous section) are presented. Regarding our first Model, RE innovation is found to be positively and significantly affected by RE policy. This supports our first Hypothesis.
Estimated coefficients of the NBRM for the first four models.
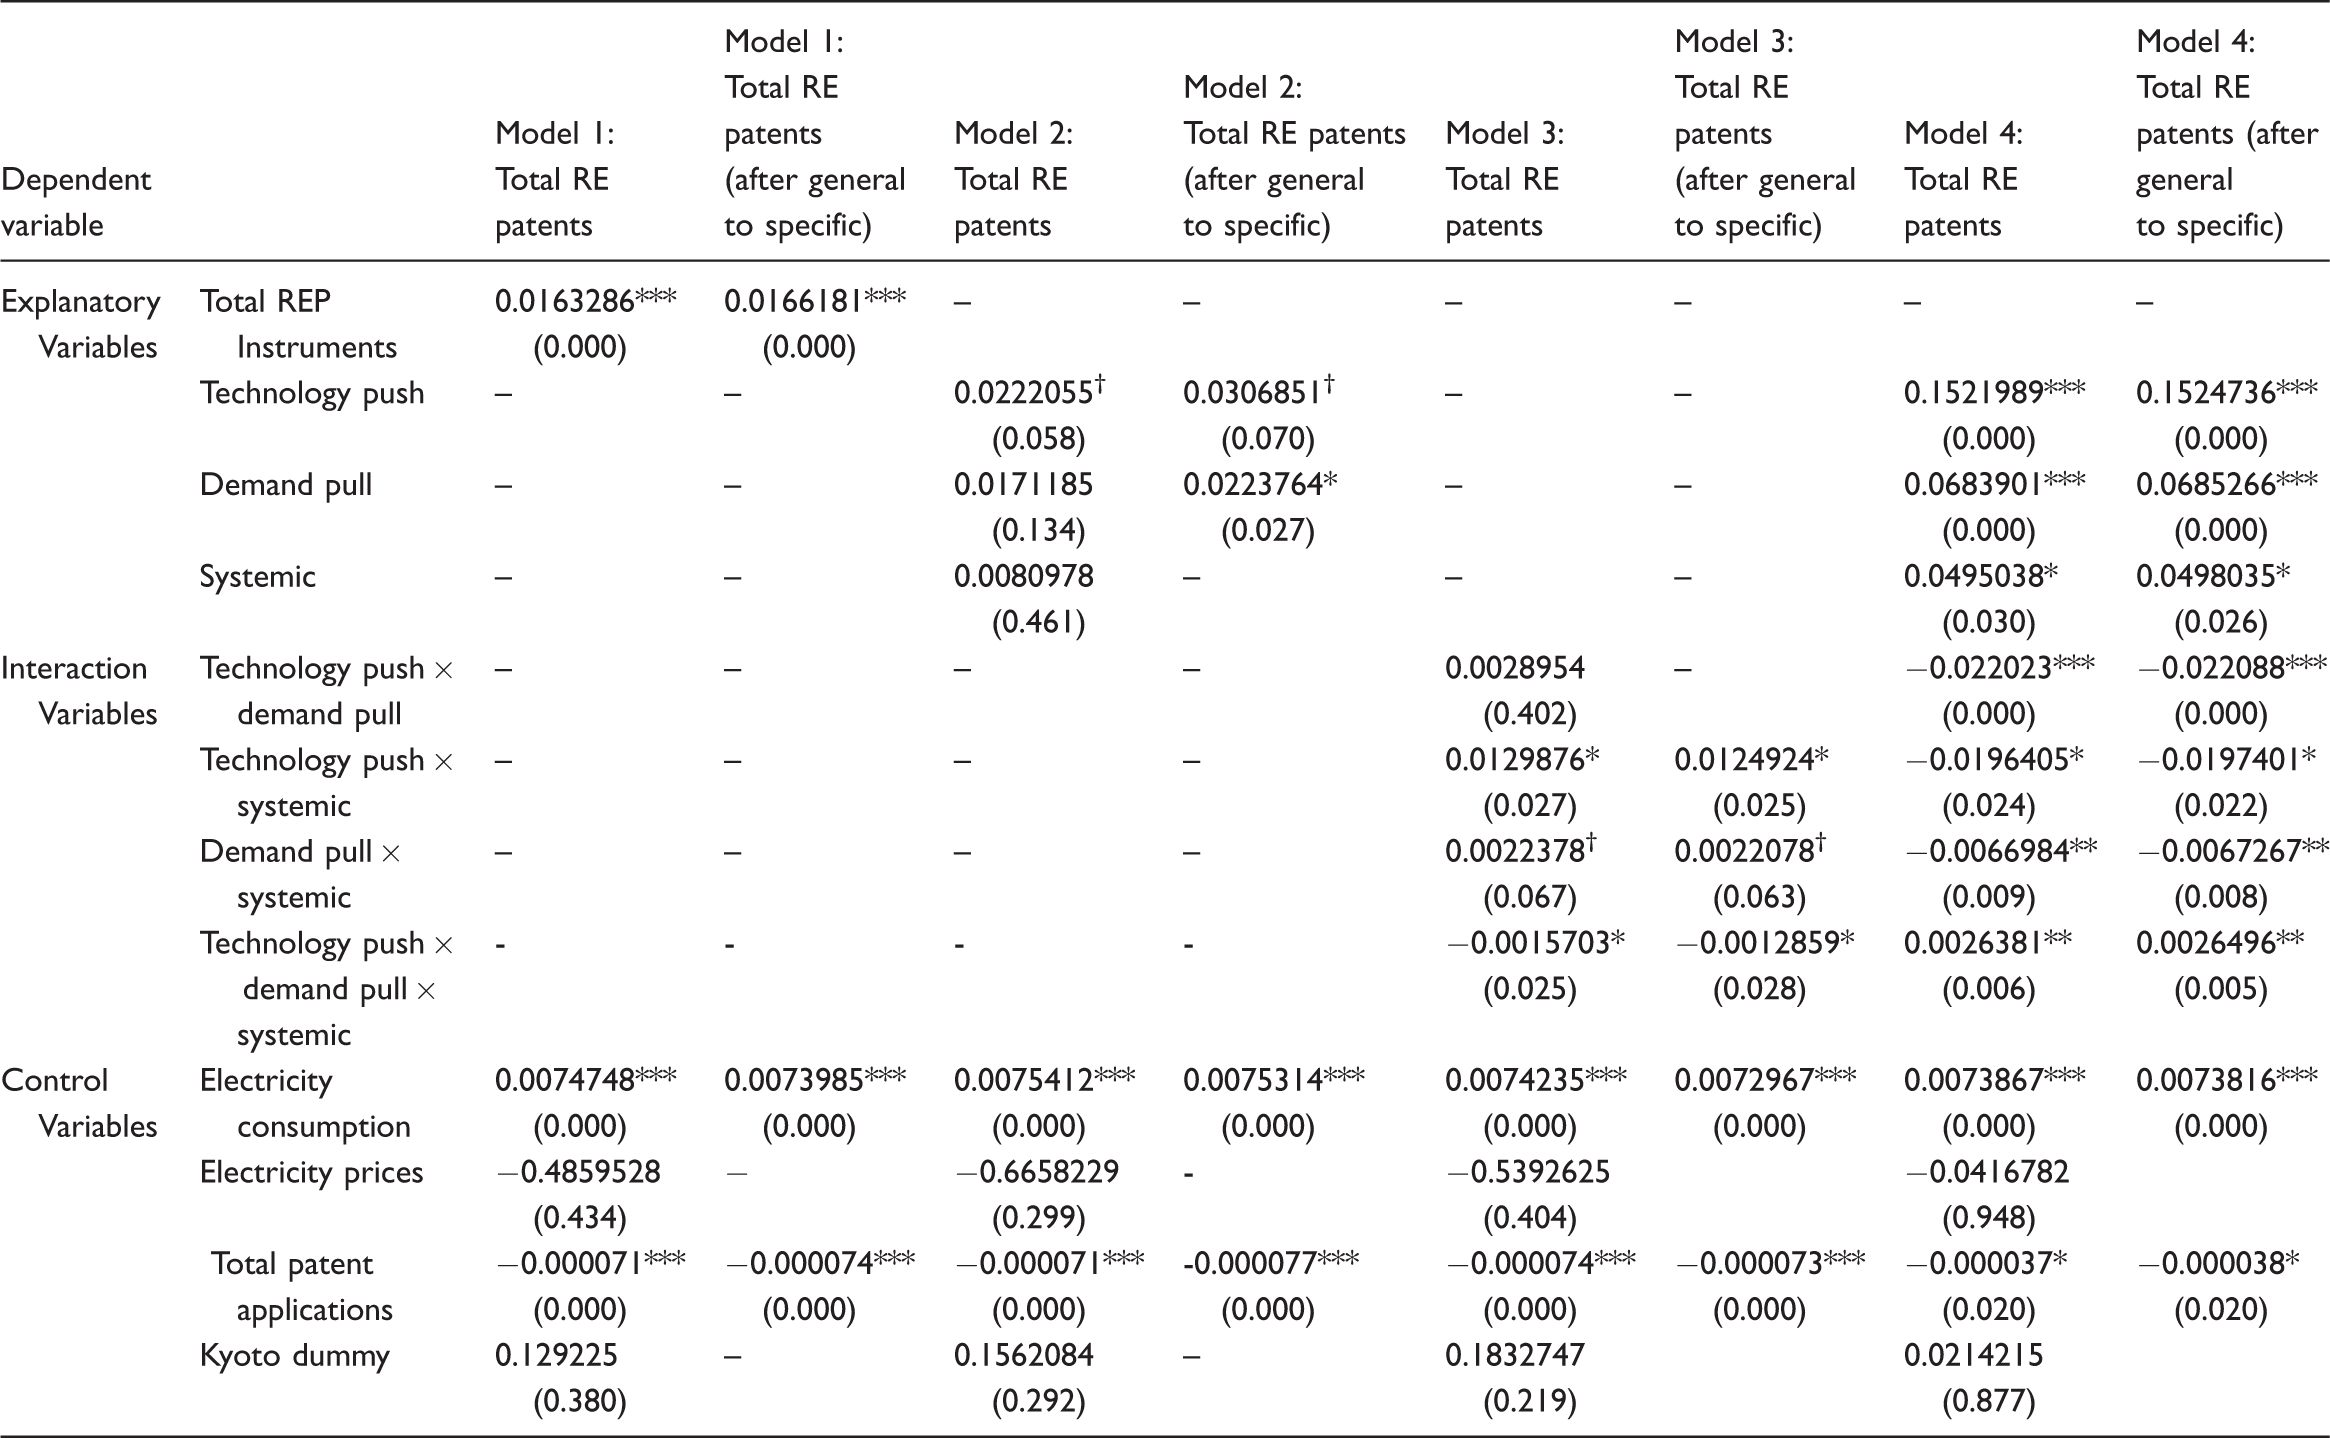
RE: renewable energy; NBRM: negative binomial regression model.
*p<0.05; **p<0.01; ***p<0.001; †p<0.1.
Our Model 2 shows that demand-pull and technology-push instruments have a positive and significant effect on RE innovation. Our findings on demand-pull are similar to those of the extant literature, such as Marques et al. (2012), Wangler (2013), Peters et al. (2012) and partly Johnstone et al. (2010) (only for the case of tradable certificates). Costantini et al. (2015) also found that demand-pull policies are dominant (in the biofuels sector). Systemic instruments were found to be insignificant when examined on their own. This lack of significance of systemic instruments when acting in isolation is explicable in terms of the argument that systemic policy instruments are aimed to support and align the instrument mix, i.e. support the other instruments, demand pull and/or technology-push (Smiths and Kuhlmann, 2004), hence the result is partly in line with our expectations.
Regarding the interaction terms in our Model 3, when examined in isolation, we found that technology-push and demand pull instruments interact positively with systemic ones. This is in line with the literature, as systemic instruments are meant to act in support for other instruments. Cantner et al. (2016) have also found that systemic instruments interact positively with demand-pull (Cantner et al., 2016). The interaction between demand pull and technology-push was found to be negative. This supports the idea that demand pull and technology-push policies can have different effects and targets and the two may well be incompatible.
Finally, it can be seen that the interaction between all three instruments has a negative and significant effect on RE innovation. Howlett and Rayner (2013) pointed out that instruments in a mix are consistent when they reinforce each other, and inconsistent when they work against each other in achieving a policy target (Howlett and Rayner, 2013; Kern and Howlett, 2009). Therefore, a negative interaction among policy instruments could signify an inconsistent mix (Sorrell, 2003). Indeed, and as mentioned earlier, while the EU has aimed at developing EU-wide RE and innovation policies, most EU governments have adopted nation-specific RE policies and instruments, providing an extra source of potential inconsistency of the instrument mix. Michalena and Hills (2012) who undertook a meta-analysis of the international scientific literature of the European RE generation found a total 54 challenges related to the implementation of RE technologies on a local basis. The authors concluded that the RE policies in the EU partially fail as they are limited in their scope in dealing with RE on a local basis (Michalena and Hills, 2012), thus being inconsistent with their targets. Fouquet (2013) policies aimed at the 2020 target appear to be successful, but there remain challenges like grid access and that some member states are reconsidering their policies, which prejudice the ability of the EU to meet this target (Fouquet, 2013).
In Model 4, we have included all interactions alongside their individual components. The results are interesting in that now all three instruments are positive and significant and only the interaction of all three instruments is positive and significant. The pairs of the three interactions instead are negative and significant. This could suggest that when components as well as interactions are included, the positive effects are fully captured by the components (and in our case by the interaction of all three components). One potential source of incompatibility that could explain the findings could involve different lag structures of the IVs. For this reason, we have rerun Model 4 with all IVs lagged by one period (Model 5). The results are interesting (Table 4) in that now only technology-push is significant and positive at its level, while the demand pull ones are positive when lagged by one period. The interaction between the two is negative as in Model 3. These findings suggest that lag effects can be a source of incompatibility between the various instruments and their interactions. In all models, we have run also a general to specific specification that involved removing gradually the least significant variables in order to identify the model preferred by the data (Campos et al., 2005; Pesaran, 1974).
Estimated coefficients of the NBRM for Model 5.
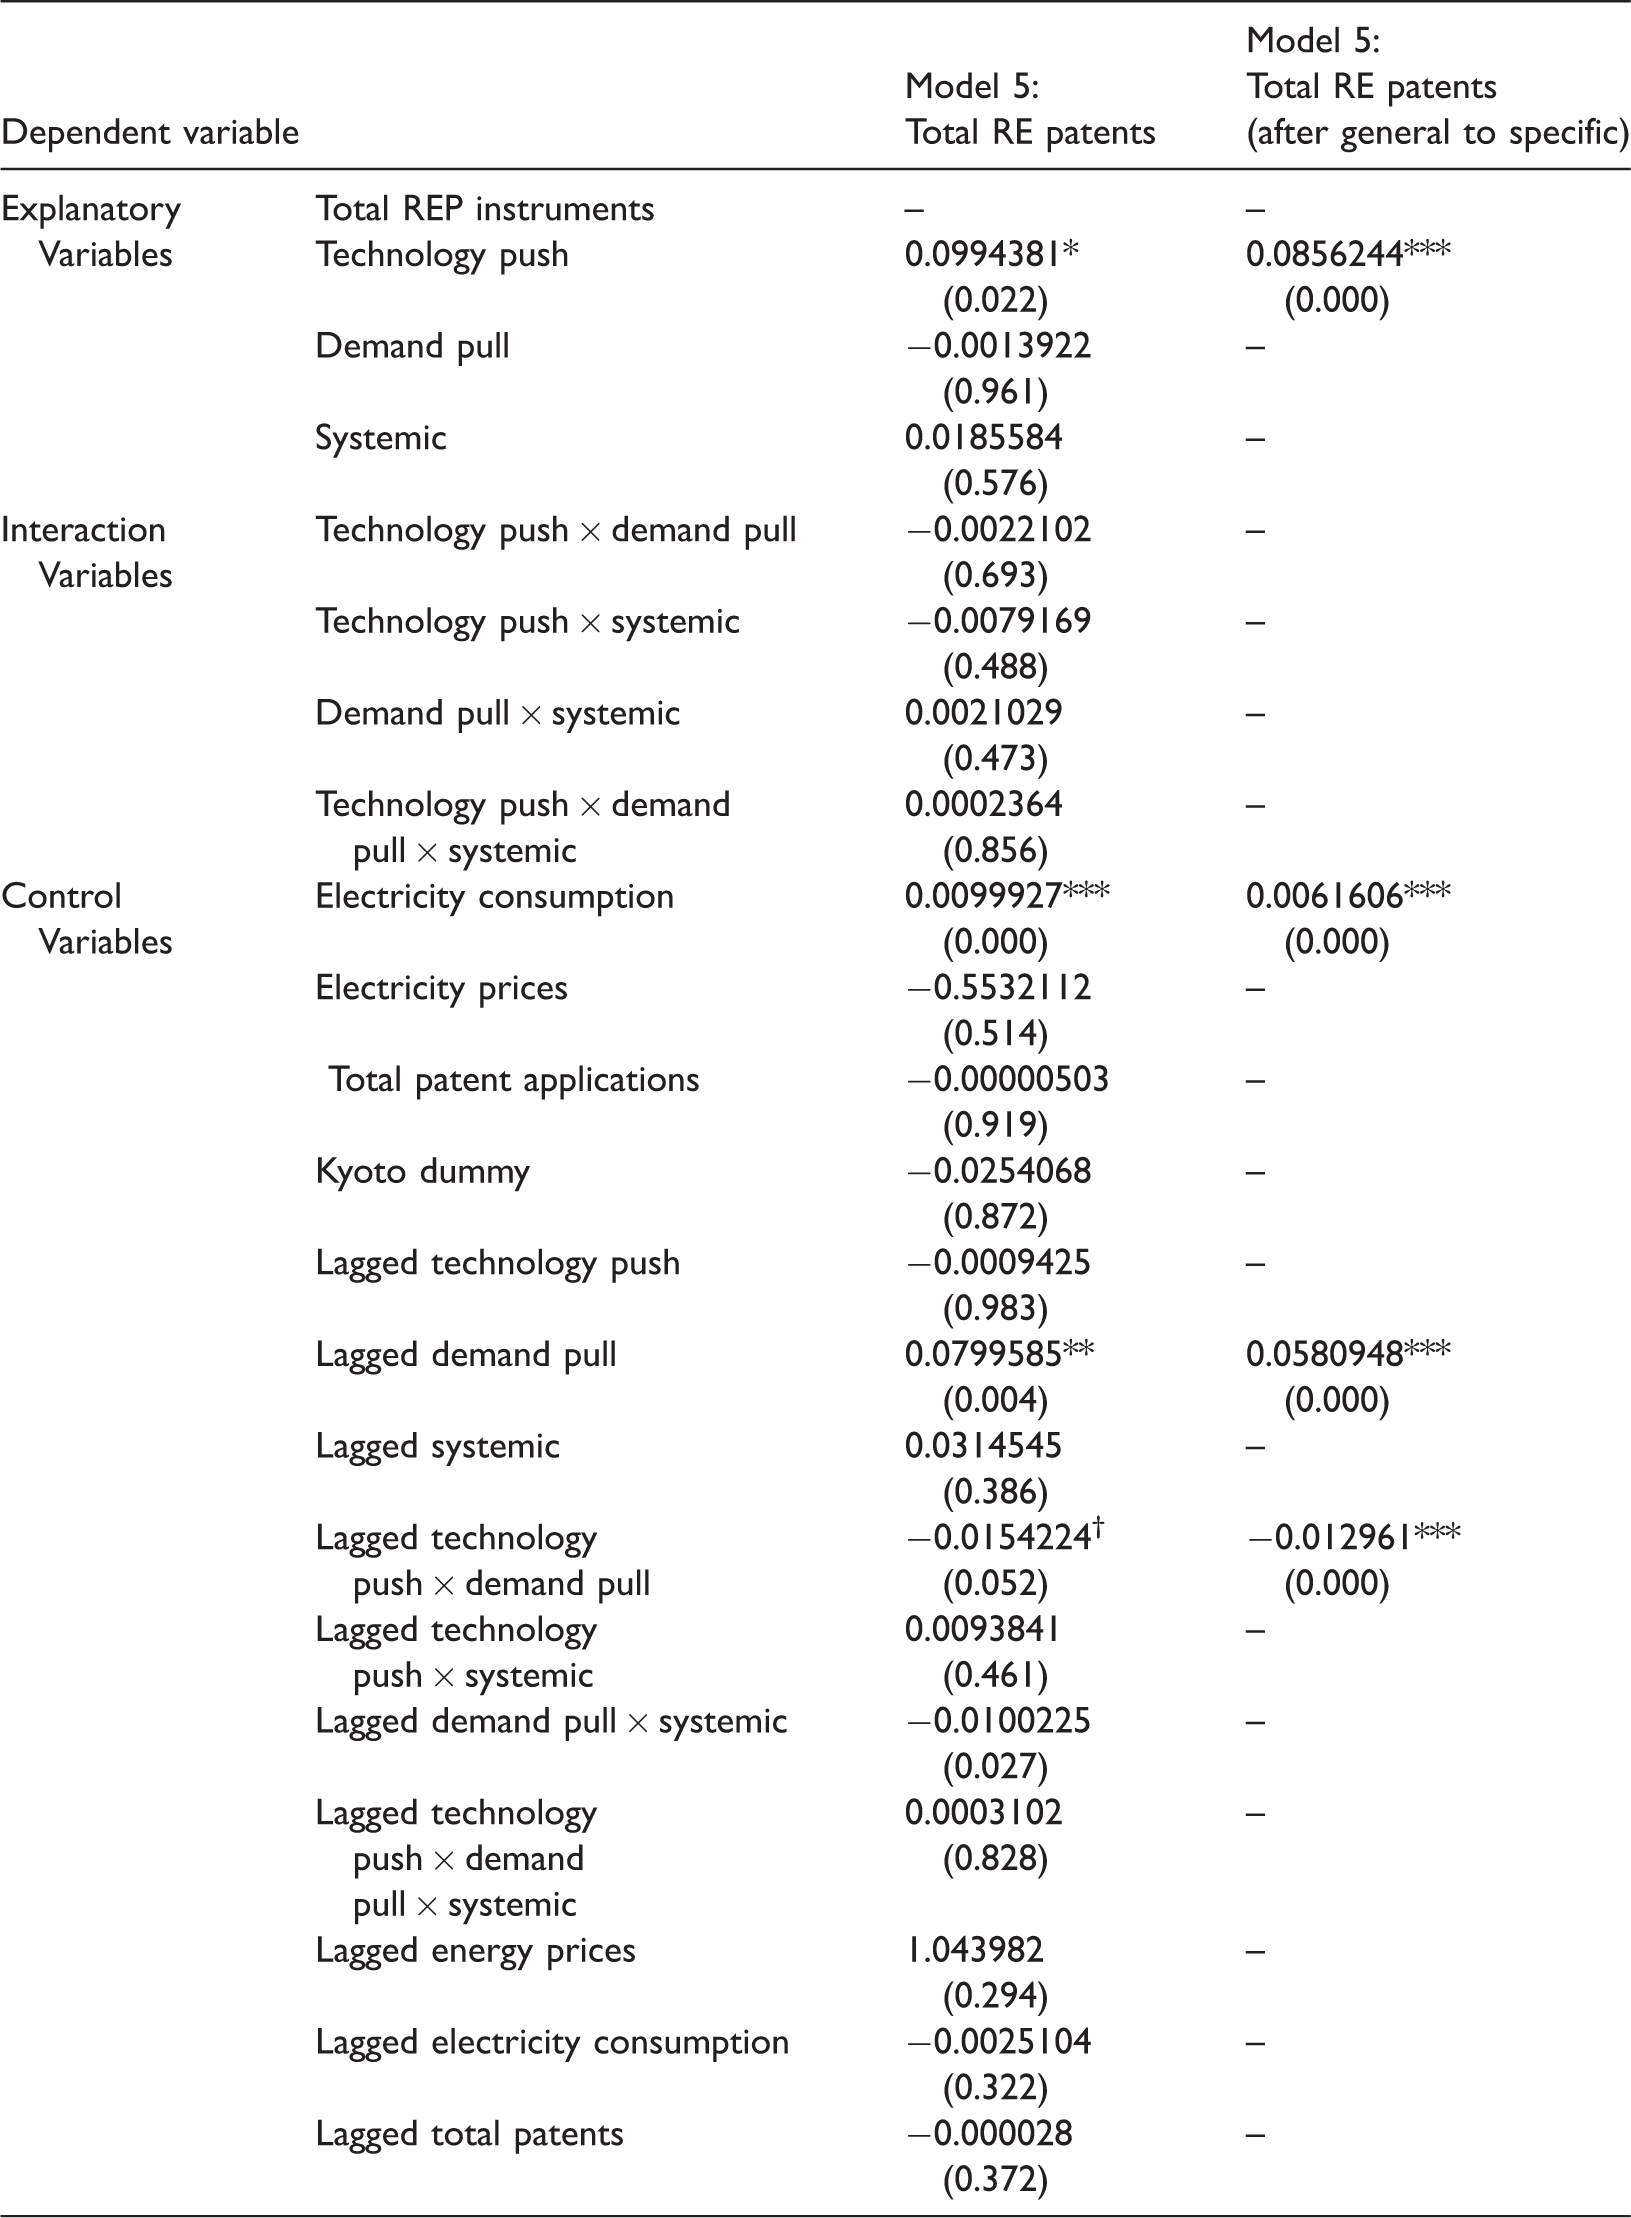
RE: renewable energy; NBRM: negative binomial regression model.
*p<0.05; **p<0.01; ***p<0.001; †p<0.1.
Quantitatively we found that technology-push policies are slightly larger in all cases than demand pull ones which in turn are larger than systemic, which in turn are larger than the effects of the interactions. In more detail, from Model 1, we can see that the expected number of RE Patents will increase by 1.7% (this is derived from the exponential of the constant, i.e. exp(0.0166181) when REP instrument also increases. From Model 2, however, we can see that not all instruments are equally potent with systemic instruments having no effect on RE patenting activity, while technology-push will increase RE patenting activity by 3.1%, and demand pull instruments by 2.3%. Model 3 indicates that the effect of the technology-push instruments increases by when they interact with the systemic instruments, and demand pull instruments increase by 0.2%, when they interact with the systemic instruments. Model 4 indicates that technology-push instruments increase patenting activity by 16.5%, demand pull instruments by 7.1%, and systemic instruments by 5.1%. While different specifications and lag structures can lead to some changes in the observed effects, on balance the findings for the key variables were fairly close in most specifications.
From our control variables, electricity prices are found to be of no statistical significance, (possibly suggesting that higher electricity prices do not provide an incentive for increased patenting activity). There are various reasons for this, first that such prices can sometimes be influenced by public policy considerations to keep them low, (Cherni and Kentish, 2007), second that RE contributes to electricity generation (14.3% of the final EU energy use in 2012) (EEA, 2016), thirdly that, certain REP instruments, and specifically that of feed-in tariffs, require grid companies to pay for electricity generated from renewable energies higher prices, as compared to those from fossil-fuel generated (Zhao and Jiarong, 1998).
The estimated coefficient of the total number of PCT filings is negative and significant, suggesting that total patenting propensity negatively affects the variation in RE patenting activity. It could be argued that the RE sector is less responsive to changes in the patenting propensity. This may relate to the issue of ‘lock-in’, namely that countries that have a history in non RE patents are ‘locked-in’ these types of innovations, hence having no impact on RE innovations (Beck and Martinot, 2004).
The Kyoto protocol dummy was also found to be insignificant. As noted, the Kyoto Protocol has increased the expected size of the global market for clean energy, redirecting the innovative efforts of the EU15 member states towards renewables. Such treaties usually create incentive frameworks for the diffusion of energy technologies, yet most are not designed to specifically foster energy technology innovation (Aguayo et al., 2012). Only one other study had controlled for the Kyoto Protocol (see Nesta et al., 2014) who also found it to be insignificant.
The coefficient of the final energy consumption has a positive and significant sign and it is statistically significant at 1% in all Models. This is in line with the literature suggesting that RE innovations are more likely to take place when there exist a market for them. Previous studies argued that growing electricity consumption can be used to control for possible dimension of the possible market for RE (Johnstone et al., 2008; Nesta et al., 2014).
In terms of the year dummies, for Models 1 to 4 and from 1995 to 1998, the coefficients were found to be negative and significant. From 1996 to 2005, the coefficients were mostly insignificant and in most cases negative. In Model 5, from 1995 to 2005, the coefficients were mostly insignificant and varied in terms of their direction. From 2006 to 2013, the coefficients were in all Models positive and significant. This could be attributed to aggregate trend effects becoming more potent during that period. From a number of possible aggregate trend triggers, we note that the period in question coincided with the adoption of the Kyoto protocol.
Concluding remarks
We have examined the effects of RE policy on RE innovation at the aggregate level but also in terms of three different policy instruments (technology-push, demand-pull, and systemic) and their interactions on RE innovation, in a cross-section of 15 EU countries 16 over the period 1995–2014. We have built on existing literature to develop a conceptual framework and hypotheses. We found evidence in support of our three hypotheses.
Our research adds to the literature in a number of ways. The first is related to the focus on the three types of instruments. This classification seems appropriate in terms of theory (see for example Nelson, 2009; Nemet, 2009; Rogge and Reichardt, 2016; Rosenberg, 1974) and has been adopted in some recent studies (see Costantini et al., 2015). The second relates to the examination of instrument interactions. We found that RE policy has a positive and significant effect on RE innovation as a whole, and that RE policy instruments also have significant effect on RE innovation. We have also found that the interactions between instruments (especially those between technology-push and demand pull on the one hand and systemic on the other) are positive and significant when analysed on their own. However, when examined alongside their components, we found all component instruments as well as the interaction of all three to be positive and significant, while the interaction between the three individual pairs was negative and significant.
We have examined reasons for this including the possibility of different lag structures, a suggestion supported by our findings. Quantitatively, we found the coefficients of technology-push to be larger than those of demand pull which in turn were found to be larger than those of systemic effects and of interaction effects. While reluctant to place much weight on precise quantitative effects given some sensitivity of results to lag structures and specifications, we have found our results to be on balance robust in terms of the direction of the key relationships and in line with theory and our theory-informed Hypotheses, albeit not with all specific suggestions by scholars. For example, the effects of the usually favoured demand side policies were found not to be larger than those of technology-push, while the two were not found to be complementary to each other. In general, our results supported the ideas that RE policy has a positive effect on RE innovation and that REP instruments can have different but important roles, and that interactions are important, albeit the precise effects can depend on whether they are examined in isolation or alongside their individual components and the lag structures of the variables.
All the above have important implications for policy makers. They highlight that different instruments matter, their interactions matter and the way in which they interact and how they interact (for example alongside their components instruments or not) also matter. So do lag structures. Accordingly, much care should be taken to identify and leverage complementarities, while eschewing from potential inconsistencies and interactions. Such interactions between these instruments have not been properly taken into account in the existing literature, depriving policy-makers from a significant source of information (Magro and Wilson, 2013). Based on the above, it would appear that the optimal approach is for a government to employ policy instruments that complement, and are consistent with, each other, and that this is a matter for empirical design and can be contingent on each specific case. This in turn calls for further research, more disaggregated findings and triangulation, including case studies to support the quantitative econometric findings.
As with other studies, this research has limitations. The first limitation relates to the use of patent data as a proxy for innovation, which – as noted – can be problematic. Nevertheless, in the absence of suitable and comparable alternative measures, it remains the most plausible and highly used indicator for this type of study. The second limitation relates to the fact that there are more determinants of RE innovation than accounted for in our paper. We have, however, used a more comprehensive set of determinants than other studies, not least the separate instruments and their interactions. This and the consistency of our results with the literature and our Hypotheses render confidence in our findings. Overall, our results seemed to be rather robust to various specifications used, and in line with theory and previous evidence.
Clearly more work is required to complement our work and findings. Potential areas of interest include the role of targeting particular RETs, the impact of RE policies on economic productivity and performance, and others. In this paper, we have added to the literature in a number of novel ways, including the unique data base, the conceptual framework, the instrument types, the comprehensive coverage of possible relationships and their interactions. We aim to pursue this research and hope to motivate others to explore further this very important topic. In all, while we have not and indeed could not hope in single study to provide definitive and conclusive evidence, we believe we have added significantly to the literature and opened up new avenues for future research.
Footnotes
Acknowledgements
We would like to gratefully acknowledge the useful feedback and comments on earlier drafts by Konstantinos Chalvatzis, Mariana Mazzucato, Pari Patel, Christos Pitelis, Michael Pollitt, Karoline Rogge, Ed Steinmueller, and David Teece. Last but not least, we would like to gratefully acknowledge the time, effort, and comments devoted to reviewing this paper from the editors and referees of this journal. The usual disclaimer applies.
Declaration of Conflicting Interests
The author(s) declared no potential conflicts of interest with respect to the research, authorship, and/or publication of this article.
Funding
The author(s) disclosed receipt of the following financial support for the research, authorship, and/or publication of this article: We are especially thankful to the Onassis Foundation (Greece) for the financial support received.