
Abstract
This article studies the economic determinants of intra-European student mobility. We constructed a panel of 33 European countries for the period 1998-2009. The dependent variable is the inflow of foreign students (International Standard Classification of Education [ISCED] 5-6) from European Union (EU)-27, European Economic Area (EEA), and candidate countries. Results show that (a) the expenditure per student appears to be a crucial determinant. It is reasonable to maintain that students are likely to choose countries where the students are granted with adequately funded services and perhaps monetary incentives. Eventually, other significant determinants are (a) the actual level of safety, (b) the degree of openness of host country, and (c) the GDP per capita of host country.
Keywords
Introduction
Internationalization of higher education has become a crucial issue in the recent years. Although the notion of internationalization in higher education is broader than student mobility, the number of international degree-seeking students is an important manifestation of the way the sector becomes more international. The first decade of the 21st century has seen the number of globally mobile students nearly double from 2.1 million in 2000 to more than 4.5 million in 2012, according to Organisation for Economic Co-Operation and Development (OECD), an increase of more than 100%, and an average annual growth rate of almost 7% (OECD, 2014). More than half of the international degree-seeking students study in the five main recipient countries, namely, United States, United Kingdom, Australia, France, and Germany. Europe is the top destination region (48% overall and 39% for the European Union [EU] 21 countries, of which 74% from within the EU 21), followed by North America (21%) and Asia (18%). In Australia, Austria, Luxembourg, New Zealand, Switzerland, and the United Kingdom, the overall percentage of international students is above 10%, while in these countries and The Netherlands and Belgium the percentage in advanced research programs is above 30%.
China exports the greatest number of students abroad, followed by India and South Korea. A total of 53% of the international students come from Asia.
Evidently, what appears to be clear is that trends in higher education follow the globalization of economy. In other words, trade liberalization and trends in global economy have a significant impact on higher education (Bashir, 2007; Knight, 2002; Tilak, 2008). In particular, internationalization of higher education cannot be disentangled from the international regulations on trade in services held at World Trade Organization (WTO). In fact, education is now one of the 12 services covered by the General Agreement on Trade in Services (GATS). The sector includes primary, secondary, postsecondary, and adult education services, as well as specialized training. 1 However, in spite of this, with the exception of Australia 2 and more recently the United Kingdom, most WTO members still do not collect accurate statistics that disaggregate education services from other items. Available figures relate to the total expenditure on goods and services for people traveling for education purposes. Those figures generally support the trends in student mobility. Predominant exporters of education services are developed economies. Table 1 is drawn from the WTO secretariat (Council for Trade in Services—Education Services—Background Note by the Secretariat, Doc No. 10-1798, April 1, 2010) and reports the main figures of travel expenditure related to education. The top 10 exporters in 2007 included the United States (US$15.9 billion), Australia (US$10.3 billion), United Kingdom (US$7.6 billion), and Canada (US$2.2 billion). The average rate of growth in total exports from 2002 to 2007 was 12%. Top 10 importers included Korea (US$5 billion), United States (US$4.7 billion), Germany (US$2.4 billion), and India (US$2.1 billion). Developing countries such as Malaysia (US$199 million) also have performed as significant exporters. In general, developing countries are supposed to be increasingly major importers of education services, with India (US$2.1 billion), Malaysia (US$1.3 billion), and Nigeria (US$1 billion) featuring among the top 10 importers for 2007. 3
Exporters and Importers of Education-Related Travel Expenditure in 2007 (Figures in Million U.S. Dollars and Percentage).
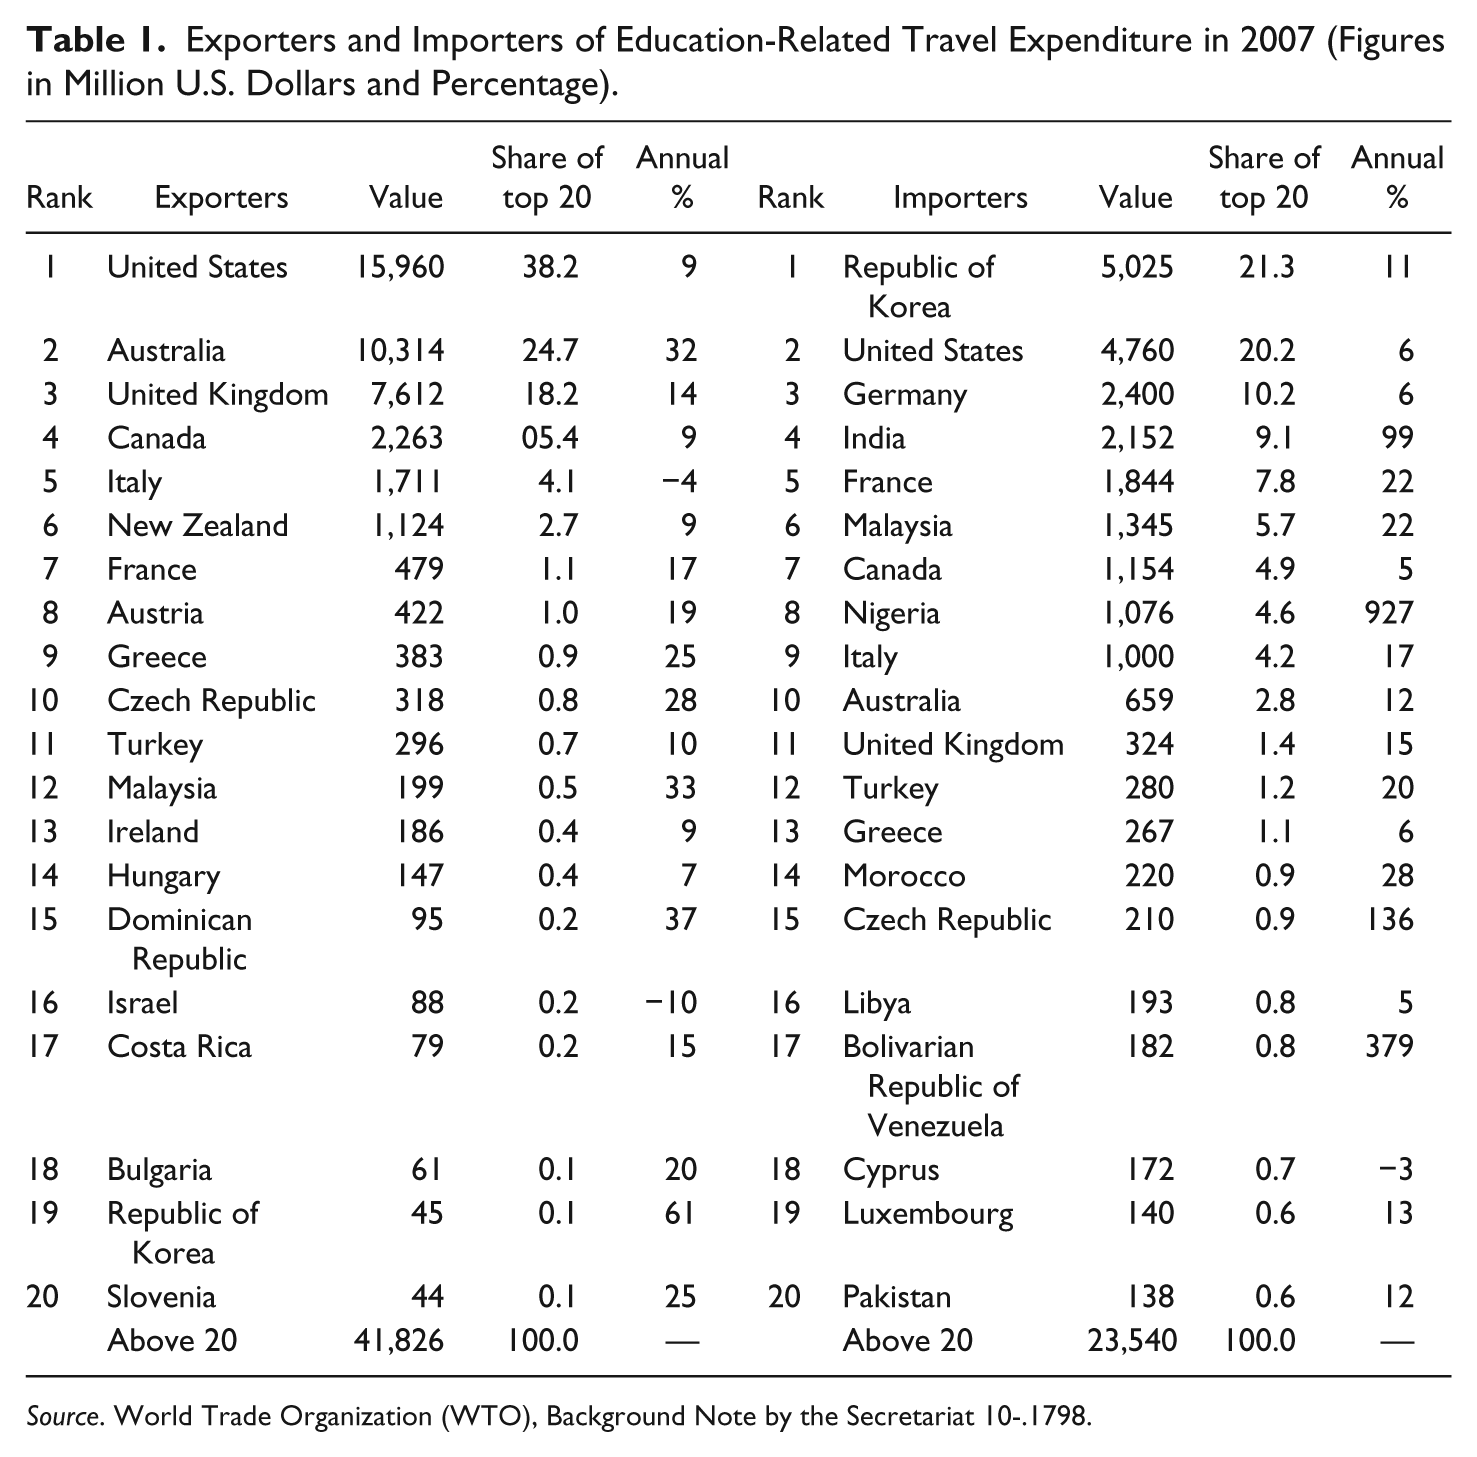
Source. World Trade Organization (WTO), Background Note by the Secretariat 10-.1798.
There are, however, significant gaps in the data. For instance, as noted above, although not listed among the top 10 importers of education services, China is an important importer. Moreover, it must be noted that China is committed to become also a significant exporter of education services by attracting a larger number of foreign students. The Chinese Ministry of Education is targeting the number of 350,000 students in 2015 4 and also is planning to provide cross-border education in London and other parts of the world. 5
However, in spite of the growing significance of mobility, its quantitative dimension is uncertain. As pointed out by Rumbley (2012), the data on international mobility of students are unclear and inaccurate for many reasons that range from the complexity of the phenomenon to the actual process of collecting data. Hereafter, we will use the data drawn from Eurostat. Among European countries, in 2009, according the data provided by Eurostat, United Kingdom and Germany are the main recipients of foreign students flowing from EU-27, European Economic Area (EEA), and candidate countries. 6 Table 2 reports the actual figures. The criterion underlying these figures is the citizenship.
Inflow of Foreign Students (ISCED 5-6) From EU-27, EEA, and Candidate Countries (Figures in 000s).
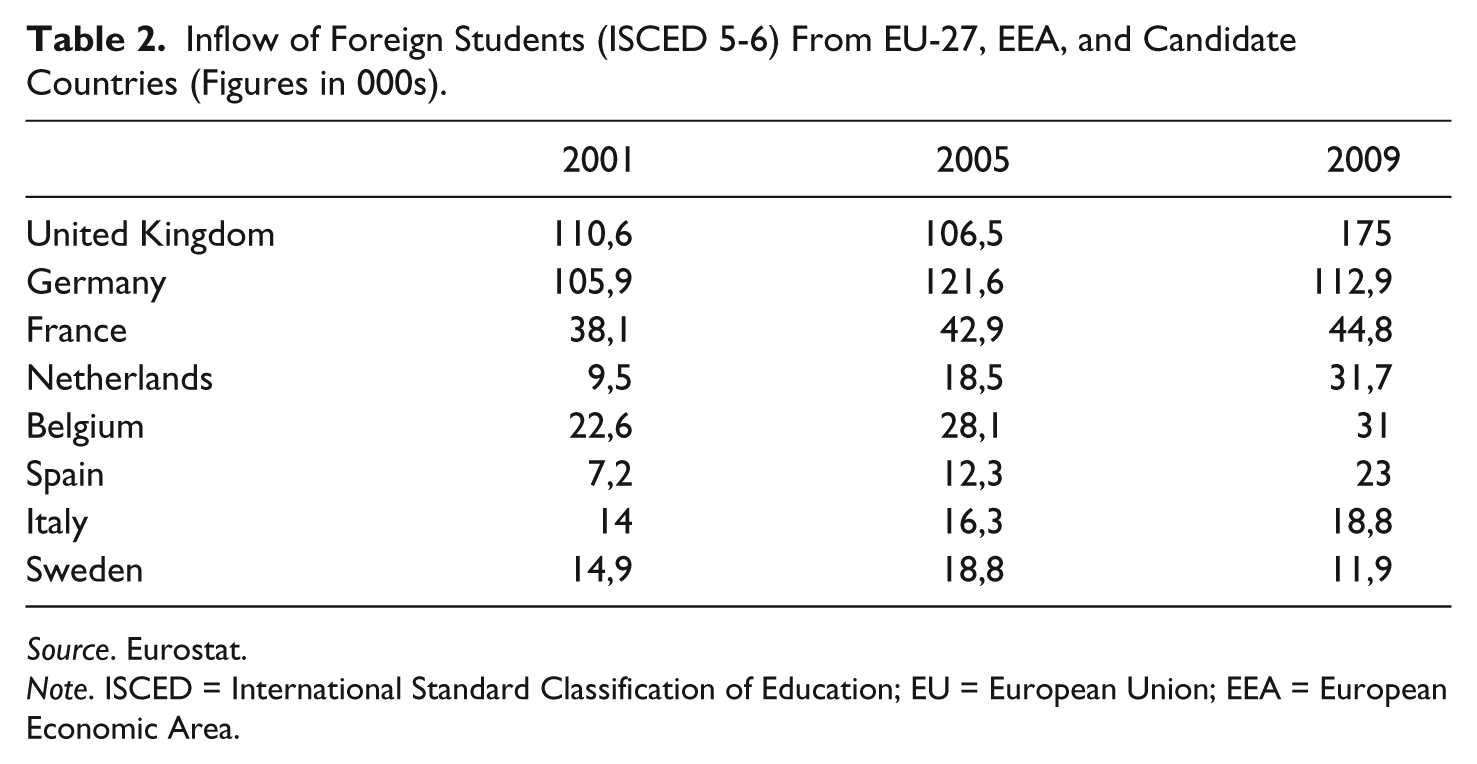
Source. Eurostat.
Note. ISCED = International Standard Classification of Education; EU = European Union; EEA = European Economic Area.
The aim of this article is to study the determinants of student mobility for a panel of 33 European countries in the period 1998-2009. The dependent variable is the actual number of incoming students in a country per year. Explanatory variables depend on established literature on internationalization of higher education. In particular, the analysis is focused on “institutional” variables, namely, on socioeconomic variables that capture the general environment in which students are willing to relocate themselves. In other words, the analysis is intended to highlight the “institutional” variables associated with the inflow of foreign students. As noted above, insights to choose the explanatory variables have been drawn from prevailing literature on internationalization of higher education, in particular De Wit (2008), Bode and Davidson (2011), and Adams, Banks, and Olsen (2011).
The article is structured as follows: In the “Push and Pull Factors of International Student Mobility” section, we look at push and pull factors of international student mobility. In “The Data and the Empirical Application” section, we present the hypothesis testing, the data, and the empirical application. Eventually, we refine the empirical results by applying an instrumental variable approach to deepen the relationship between crime and the inflow of foreign students. The final section summarizes the results.
Push and Pull Factors of International Student Mobility
International student mobility is stimulated or refrained by a series of push and pull factors. Agarwal, Said, Sehoole, Sirozi, and De Wit (2008) identify four broad categories of push and pull factors: mutual understanding, revenue earning, skill migration, and capacity building. They give the following push factors:
Educational factors, such as availability of higher education, basic human resource capacity, ranking/status of higher education, enhanced value of national versus foreign degree, selectiveness of domestic higher education, increasing presence of private and/or foreign providers, experience with international mobility, and strategic alliances with foreign partners;
Political/social/cultural factors, such as linguistic isolation, cultural disposition, colonial ties, political instability, regional unity, information isolation, emigration policies, strategic alliances, and academic freedom; and
Economic factors, such as dependence on world economy, financial capacity, human development index factor, employment opportunities on return, and geographic distance.
Pull factors are the opposite of these:
Educational factors, such as higher education opportunities, system compatibility, ranking/status higher education, enhanced value of national degree, diversity of higher education system, absorptive capacity of higher education, active recruitment policy, cost of study, existing stock of national students, strategic alliances with home partners;
Political/social/cultural factors, such as language factor, cultural ties, colonial ties, lure of life, regional unity, stock of citizens of country of origin, immigration policies, strategic alliances with home country, and academic freedom;
Economic factors, such as import/export levels, level of assistance, human resource development index, employment opportunities during and after study, and geographic distance.
The OECD (2014) gives the following drivers: language policy (around 41% of the students study in English-speaking countries and the offer of English-taught courses in other countries is also a factor), quality of the programs, tuition fees, immigration policies, as well as others.
A study of World Education Services (Choudaha, Orosz, & Chang, 2012), has made manifest that one can and should not place all international students under the same category as for their push and pull factors. It identifies for the United States, the following types of international students: Strivers (30%), Strugglers (21%), Explorers (25%), and Highfliers (24%).
Strivers, according to them, are the largest segment of the overall U.S.-bound international student population. Among all segments, they are the most likely to select information on financial aid opportunities among their top three information needs (45%). Financial challenges do not deter these highly prepared students from pursuing their academic dreams: 67% plan to attend a top-tier U.S. school.
Strugglers make up about one fifth of all U.S.-bound international students. They have limited financial resources and need additional preparation to do well in an American classroom: 40% of them plan to take English as a second language (ESL) program in the future. They are also relatively less selective about where they obtain their education. Only 33% of them selected information about a school’s reputation among their top three information needs.
Explorers are very keen on studying abroad, but their interests are not exclusively academic. Compared with the other segments, they are the most interested in the personal and experiential aspects of studying in the United States, with 19% of this segment reporting that information on student services was in their top three information needs during the college search. Explorers are not fully prepared to tackle the academic challenges of the best American institutions and are the most likely to plan to attend a second-tier institution (33%).
Highfliers are academically well-prepared students who have the means to attend more expensive programs without expecting any financial aid from the institution. They seek a U.S. higher education primarily for its prestige: Almost half of the respondents in this segment (46%) reported that the school’s reputation is among their top three information needs.
There have not been made similar analyses of types of international students for Europe or other regions, but one can assume that the picture will not fundamentally differ from the U.S. context. It is important to recognize these distinctions in connection with push and pull factors of student mobility, as too easy mobile students are considered in analyses as a nondiverse group (see also Choudaha & De Wit, 2014).
Another issue in connection to push and pull factors is related to mobility of talents and the stimulus of increased stay rate of mobile students. Northern America, Europe, Australia, and Japan face a demographic challenge. The knowledge economies of the OECD member countries require highly skilled people which, due to aging and also due to less interest of their own youth in the hard sciences, will not be sufficiently available, and so skilled immigrants are needed to fill the gaps. The pattern of low-skilled immigration from the so-called South to the North of the past century is replaced by a need for high-skilled migrants. Several countries, over the past decades, have made it more attractive for highly skilled people to come and work, while restricting immigration of lower skilled people (Sykes, 2012)
Countries increasingly understand that immigration of skilled people is not always effective, and for that reason “International students have come into the spotlight as an attractive group of prospective skilled immigrants” (Sykes, 2012, p. 8). Where in the past, these countries would have an open mind to the receipt of international students in general and even subsidized their education, one can observe in several countries, in particular in Europe, a shift toward a more controlled immigration of international students and measures to increase their stay rate. The Netherlands, Denmark, and Sweden are clear examples of such policies. Over the past decade, they have on one hand introduced full cost fees for non-EU students and at the same time developed scholarship schemes to stimulate selectively targeted talents and created opportunities to stay after graduation. The percentage of international students who stay after their graduation in the country of study, the so-called “stay-rate,” is for OECD-countries on average 25% (Sykes, 2012, pp. 10-11), where the regional and local alumni retention rate in general is 60% for all graduates and 70% for master’s and doctoral graduates 7 (see also Hawthorne, 2012).
International students are increasingly becoming calculated rational consumers who explore the best options in their home country, their country of study, as well as other countries. Lack of integration, discrimination, and lack of support are important push factors driving international students away after graduation.
Another crucial factor that has been becoming a key issue in many countries is personal safety of international students. Needless to say, perception of safety may be taken into account by rational mobile students within a broader consideration of standard of living (see, among others, Broekemier & Seshadri, 1998; Brown, 2009; Brown & Jones, 2013; Sawir, Marginson, Forbes-Mewett, Nyland, & Ramia, 2012; Shanka, Quintal, & Taylor, 2005; Warwick & Mansfield, 2003). In particular, Ziguras and McBurnie (2014) explore the concerns about violent crime perpetrated on Indian students in Australia and on Chinese students in New Zealand. Interestingly, the authors highlight that safety is not exclusively an individual component of rational decision making. In fact, if in a host country there are large numbers of students from a particular sending country, its government may be expected to intervene officially to contribute to safety measures of their students/citizens abroad.
In sum, in an analysis of international student mobility one has to look at the broad range of push and pull factors, the types and drivers of international students related to these factors, as well as changing policies on the relation between recruitment of international students and skilled immigration needs.
The Data and the Empirical Application
In the light of the previous discussion, hereafter we present an empirical estimation on some key social and economic factors, of inward mobility. As noted above, we analyze a set of socioeconomic factors that are associated with the inflow of foreign students. The variables under investigation would capture the territorial and institutional factors that contribute to shape behavior of individuals on specific choices. In such a case, the variables chosen would proxy socioeconomic factors that influence choices of students so determining and shaping aggregate flows. As expounded above, in fact students can be expected to take into account rationally characteristics of the countries and not only of the higher education institutions. Other factors that play a key role, such as the language of instruction (English) and the reputation of the system and institutions in the systems (rankings) are not dealt with in this analysis. In fact, these variables would be related to individual characteristics of higher education institutions and not of countries.
The previous discussion leads to the following hypotheses:
In sum, if the null hypothesis turns to be true, therefore, mobility of students would depend much more on individual characteristics of higher education institutions rather than on country-specific characteristics. Contrariwise, if the alternative hypothesis is confirmed, it would be possible to maintain robustly a specific role of public policy making to favor inflow of foreign students.
In what follows, we apply an ordinary least squares (OLS) estimation in which the dependent variable is the number of foreign students in a specific country. The estimation is based on a panel of 33 European countries 8 for the period 1998-2009. The dependent variable is the inflows of foreign students (International Standard Classification of Education [ISCED] 5-6) from EU-27, EEA, and candidate countries (expressed in thousands of units). Eurostat defines foreign students as follows: “Students are non-national students or foreign students if they do not have the citizenship of the country for which the data are collected.” 9
The explanatory variables are listed below: (a) a measure of crime recorded in the host country. Crime is intended to proxy the perceived safety of a country; (b) a measure of cost of living proxied by means of current inflation change. In particular, it does capture a change in the cost of living; (c) a degree of economic openness; (d) GDP per capita, which is the traditional measure of long-run prosperity; and (e) the current expenditure per student at ISCED 5 and 6 levels. This variable is intended to proxy the national commitment to higher education.
To have a straightforward interpretation of results, all the variables have been logged. Therefore, the coefficients would be interpreted as elasticities. Most data are drawn from the Eurostat data set. Data on GDP and population are drawn from the Penn World Tables 7.0. Data on tuition fees are drawn from Cesifo Database for Institutional Comparisons in Europe (DICE) report 2007/2008 and from an independent website www.studyineurope.eu. Table 2 reports the definition, sources, and descriptive statistics of data.
The econometric model can be easily described as

where expst denotes the current expenditure per student; open, the degree of openness; GDPpc, the GDP per capita; and eventually tuit, the level of tuition fee. All variables are indexed by i (with i = 1, . . ., 33) and by year (t = 1998, . . ., 2009).
Table 3 below reports the results of a first OLS regression with random effects estimators. To avoid predictable issues of collinearity, GDP per capita and expenditure per student are regressed separately with regard to the dependent variable (in fact, the correlation between the two variables is .845).
Variables and Descriptive Statistics.
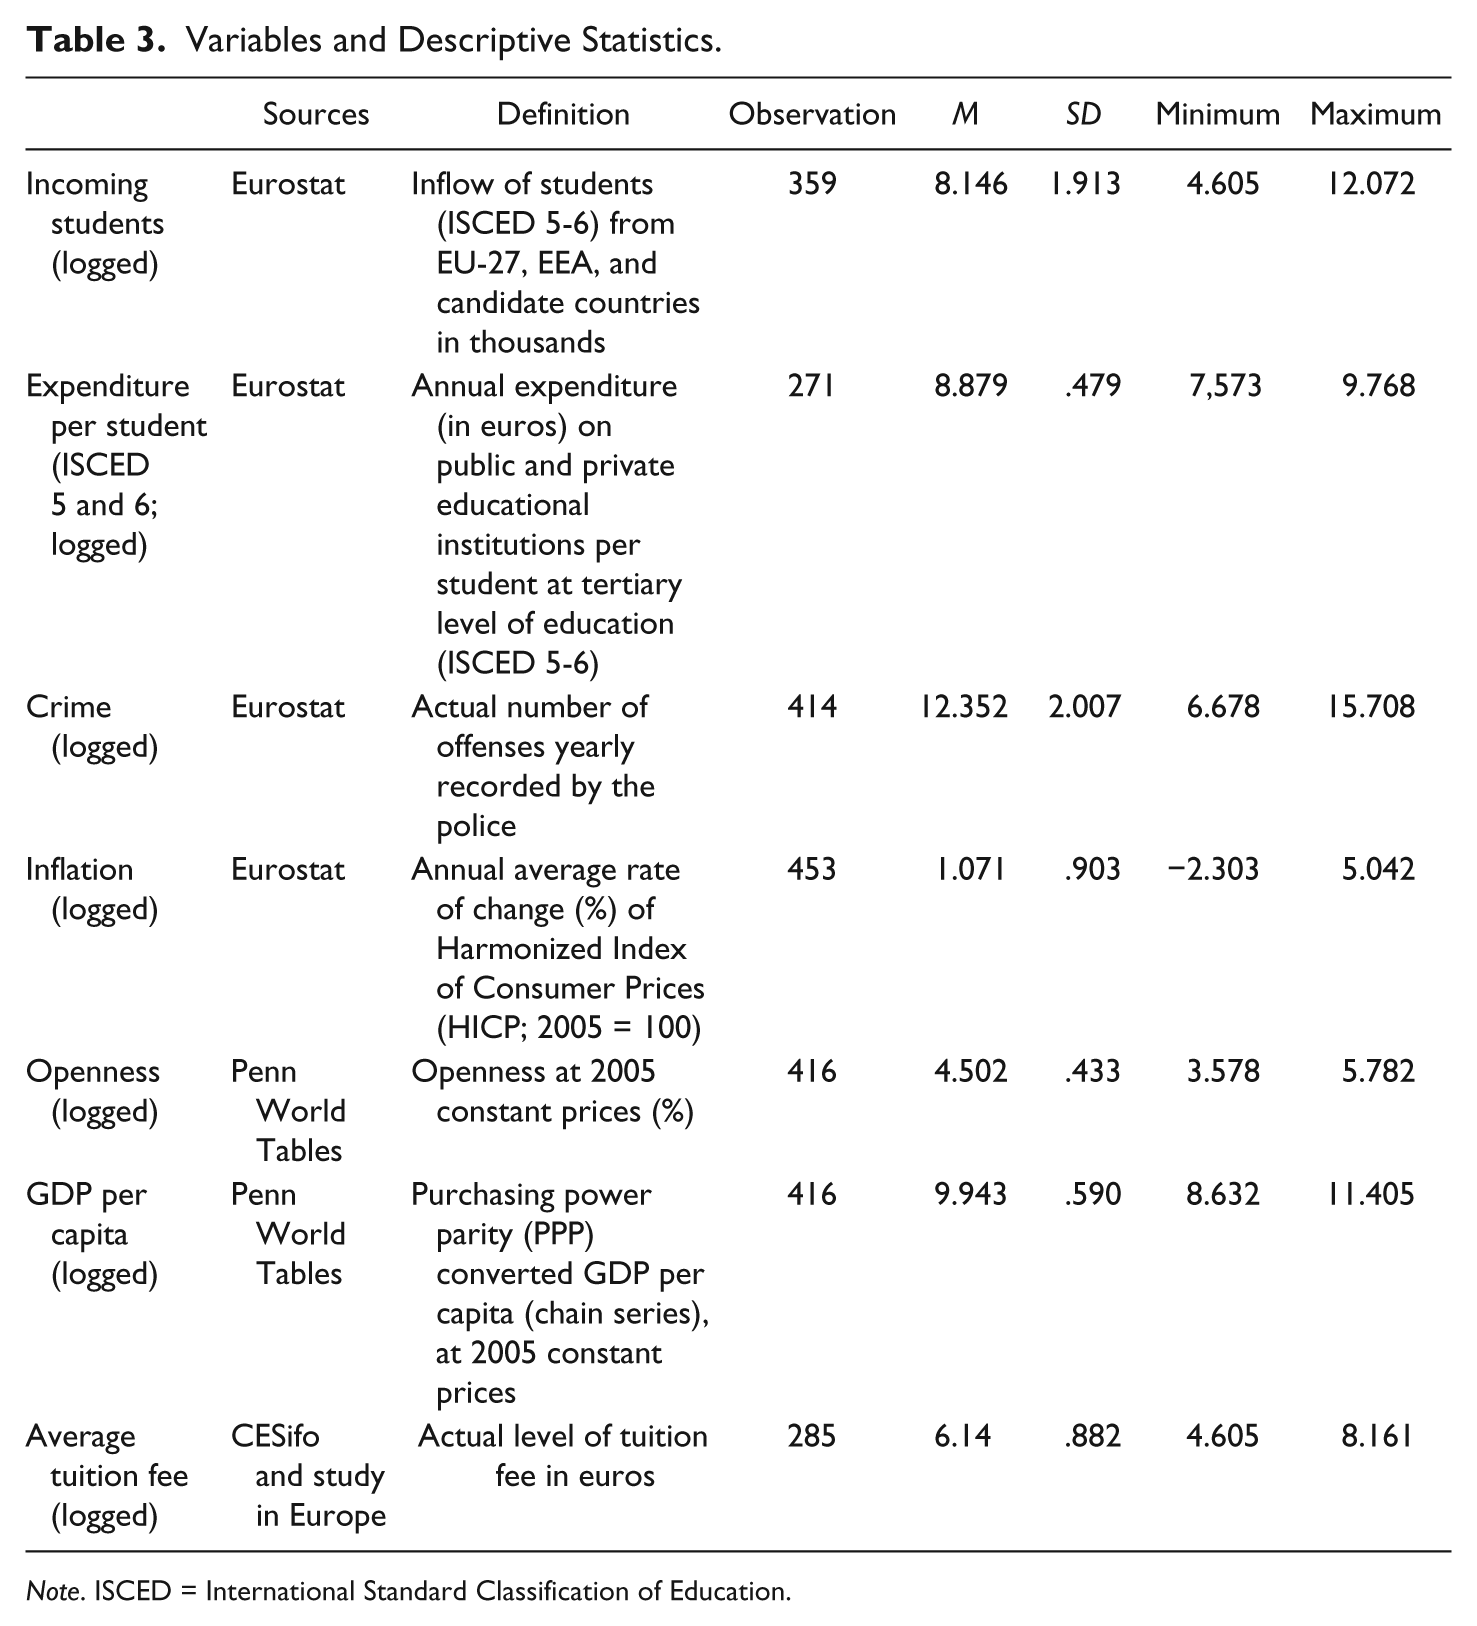
Note. ISCED = International Standard Classification of Education.
Some results appear to be conclusive with respect to the alternative hypothesis expounded above. First, the higher the expenditure per student in the host country, the higher is the inflow of foreign students. A higher level of expenditure per student seems to attract a large number of international students. Put differently, students seem to take into account rationally the set of economic opportunities and services related to higher education. In particular, the computed elasticity of students’ inflow with respect to the expenditure per student is positive and very close to unity (.98). That is, we find evidence that an increase in public expenditure per student has a positive effect on inflows from EU-27 countries. In particular, the increase in the number of students appears to be exactly proportional to an increase in the expenditure per student. In simpler words, if the expenditure per student increases by 1%, the actual number of European foreign students should increase by the same percentage.
The level of tuition fee presents a nonlinear association with inflow of foreign students. That is, the inflow of students seems to be positively associated with the level of tuition fee until a threshold. Put differently, students are willing to pay some tuition fees until a threshold. Then, when the level of tuition fee is too high, it discourages the inflow of foreign students. Put differently, it appears that tertiary education exhibits a bell-shaped demand curve. Such picture is plausible when considering that price can be assumed to be an indicator of quality in education sector (Mixon & Hsing, 1994; Dotterweich & Baryla, 2005). Put differently, mobile students take into account tuition fees and interpret them as proxy of quality. Therefore, they are willing to pay the tuition fee until a maximum is reached. After that point, the demand takes the shape of a downward-sloping demand curve. This had been highlighted in Gilmore (1990, 1991) with regard to the American scenario and it has been recently confirmed for United Kingdom in Soo and Elliott (2010). This suggests that in Europe there is a significant “highfliers” according to the definition explained above.
The degree of openness also matters. That is, the higher is the economic openness of a country, the higher is the number of foreign students. In other words, internalization of higher education seems to follow the globalization of the economy. Moreover, if considering GDP per capita as explanatory variable, it turns out that students inflow is higher for richer countries. 10 This confirms the idea expounded in Sykes (2012), according to which mobile students are likely to prefer richer countries because of the employment opportunities during and after the study period. The cost of living, proxied by the level of inflation, seems not to be relevant in the students’ choice. Only the interaction term between inflation and tuition fee turned to be negatively significant. In brief, students as rational actors prefer richer countries irrespective of the cost of living. Preference for richer countries can be also motivated in terms of reputation. That is, richer countries do retain an overall reputation that is higher than poorer countries. In this respect, inclusion of GDP per capita does accurately capture the long-term prosperity of a country fitting so perfectly with this perspective. In brief, it is plausible that a combination of reputation and opportunities do enter the decision framework of mobile students.
Deepening the Relationship Between Mobility and the Perception of Crime: An Instrumental Variable Estimation
According to the results presented in Table 4, the relationship between crime and number of incoming students is inconclusive. However, this result needs to be deepened because of the relevance given to safety in literature (as noted above, see, among others, Broekemier & Seshadri, 1998; Brown, 2009; Brown & Jones, 2013; Sawir et al., 2012; Shanka et al., 2005; Warwick & Mansfield, 2003; Ziguras & McBurnie, 2014) and because safety is increasingly considered as a component of a complex and multifaceted framework of peaceful societies (Levy, 2014). In statistical terms, we may think that the error term in the panel OLS regression is correlated with the level of crime because of some omitted variables. In particular, it is reasonable that the omitted variables may be related to some structural factor either institutional or economic. Therefore, we may deepen this relationship by applying the instrumental variable approach. That is, hereafter, we attempt to find a variable that is correlated with the actual level of crime but uncorrelated with the unobserved factors included in the error term. To do that, we exploit the knowledge drawn from economic literature on crime. In particular, we can use youth unemployment as instrument. In fact, recent works clearly confirm that youth unemployment is significantly associated with crime (see Beraldo, Caruso, & Turati, 2013; Caruso, 2011; Cotte Poveda, 2011; Falk, Kuhn, & Zweimueller, 2011; Fougère et al., 2009).
Inflows of Students From EU-27, EEA, and Candidate Countries (OLS), Random Effects.
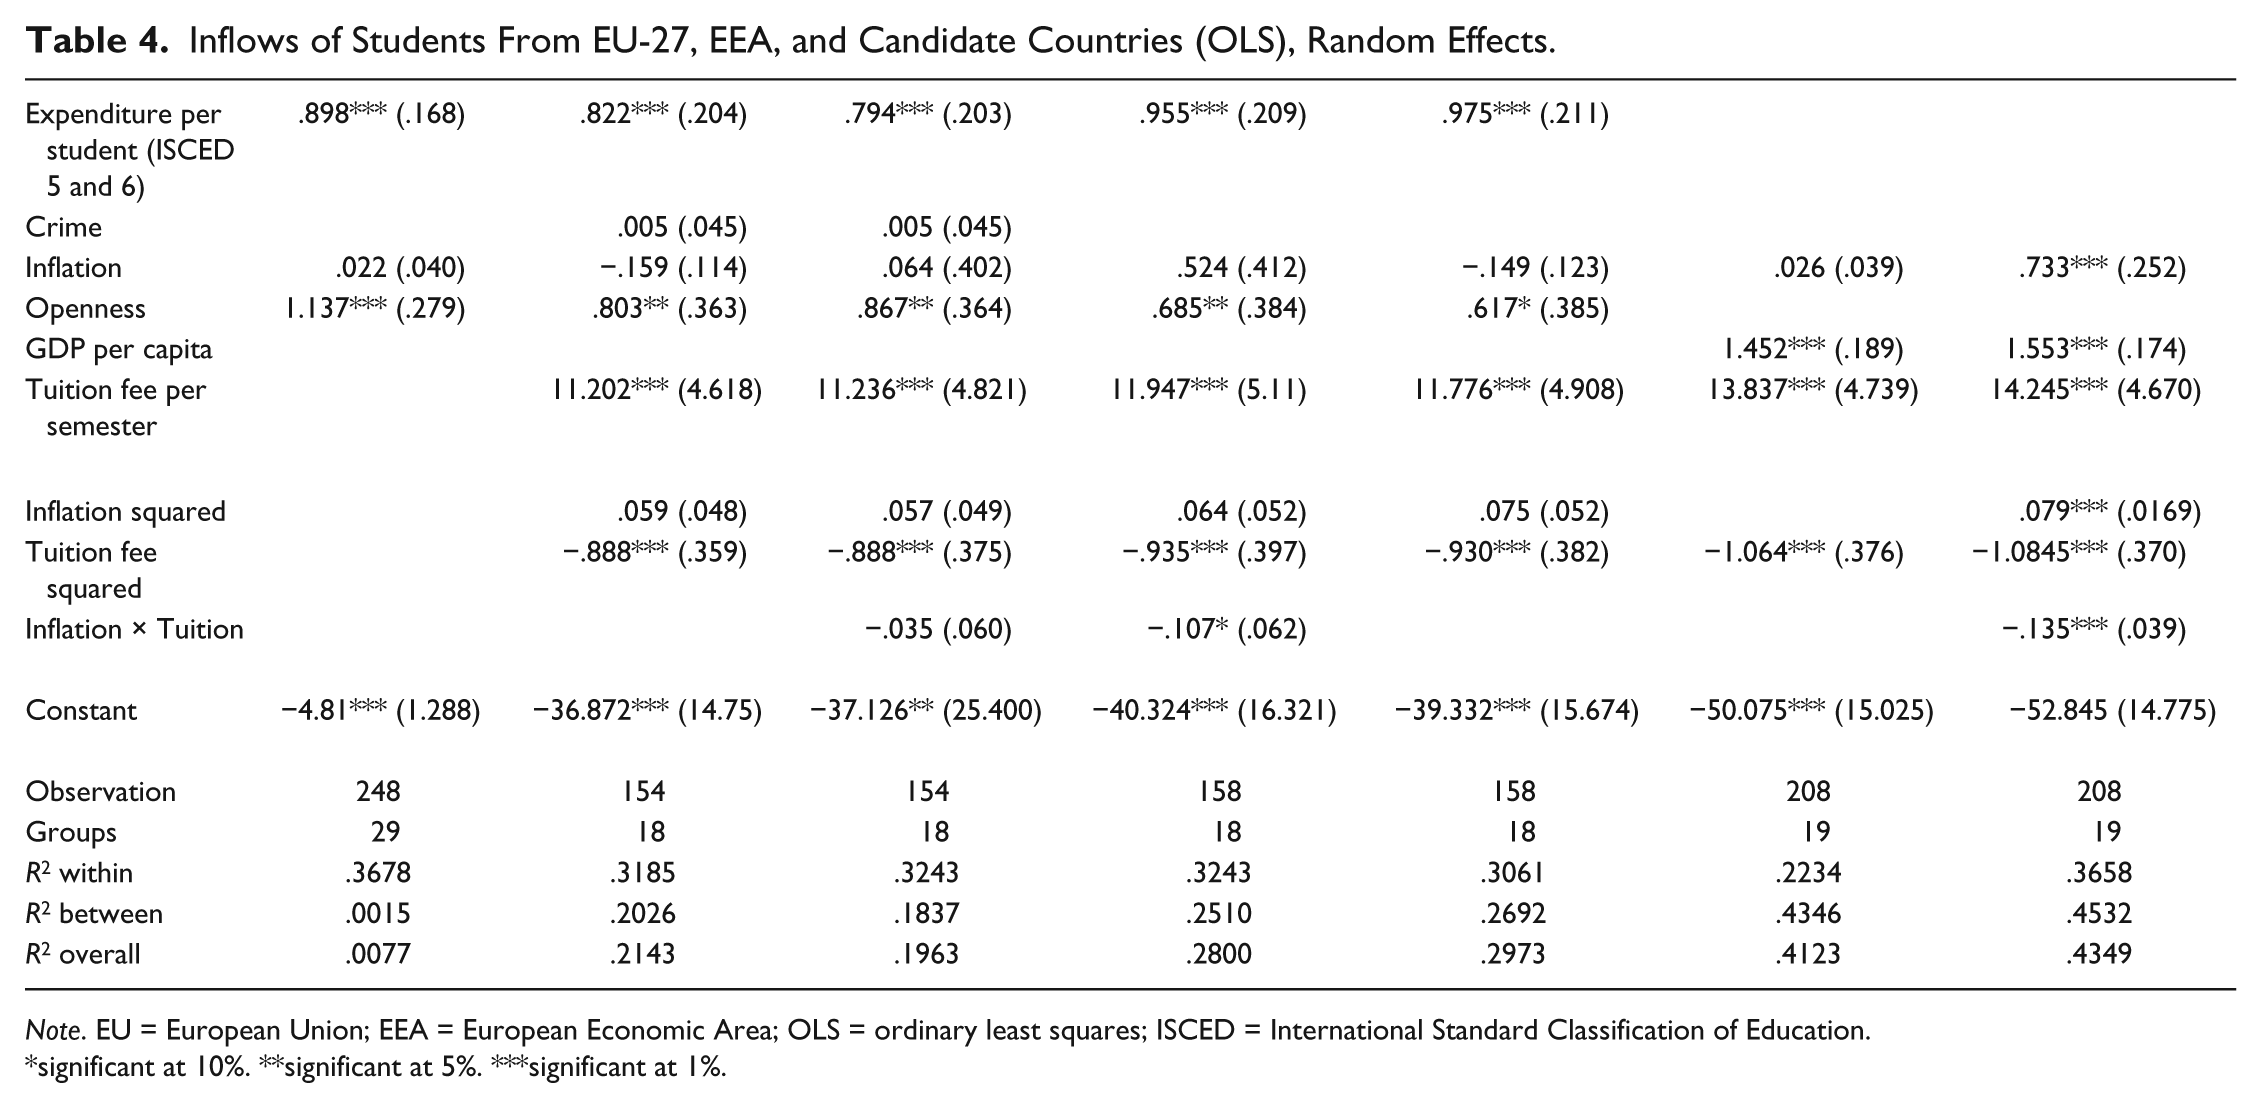
Note. EU = European Union; EEA = European Economic Area; OLS = ordinary least squares; ISCED = International Standard Classification of Education.
significant at 10%. **significant at 5%. ***significant at 1%.
Eventually, to deepen further such analysis, we apply three different measures of crime: (a) the actual number of offenses recorded by the police, (b) the actual level of violent crime, and (c) the number of robberies. Results of a fixed effects model are reported in Table 5. The three measures of crime seem to be significantly and negatively associated with the number of incoming students. That is, the actual level of crime and feeling of lack of safety decreases the number of foreign students. Students as rational actors take into account the degree of insecurity. Two examples can illustrate that the negative impact on two incidents with students from India in Australia on the number of students from that country to Australia, and the negative feelings on racism felt by several students in countries like Germany, France, Sweden, The Netherlands, and the United Kingdom, as reported in Sykes (2012).
Inflows of Students From EU-27, EEA, and Candidate Countries, IV Estimation, Fixed Effects.
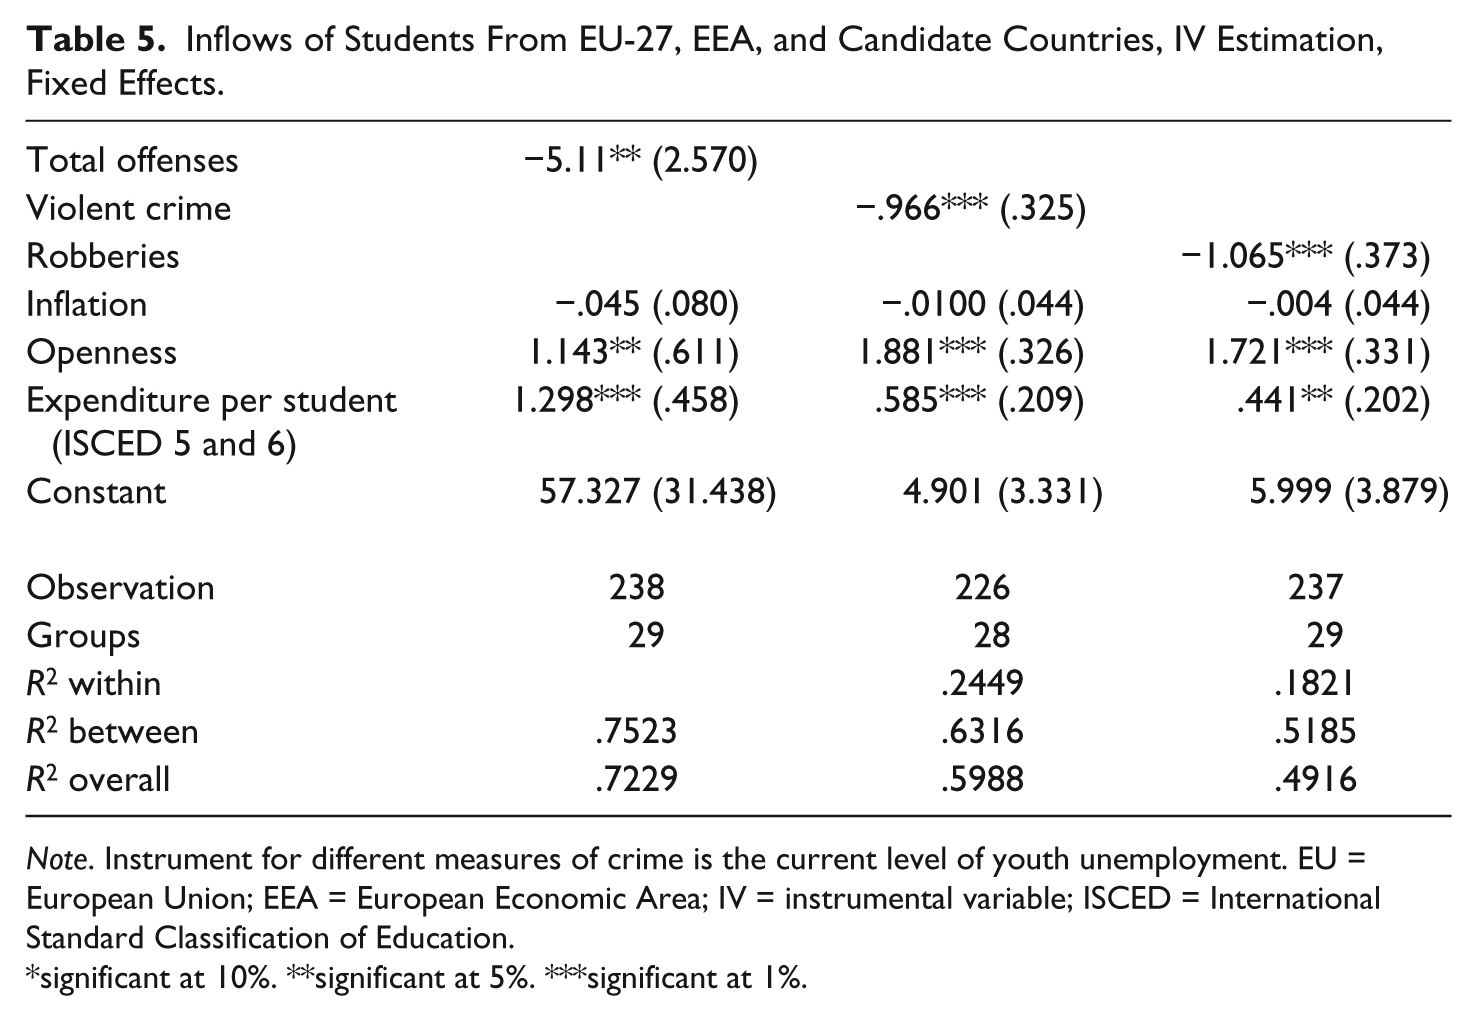
Note. Instrument for different measures of crime is the current level of youth unemployment. EU = European Union; EEA = European Economic Area; IV = instrumental variable; ISCED = International Standard Classification of Education.
significant at 10%. **significant at 5%. ***significant at 1%.
In general terms, it is interesting to note that the actual level of crime appears to be a very good proxy to evaluate the “perception of insecurity” retained by foreign individuals. 11 Eventually, the other variables present the same signs and the statistical significance reported in Table 3 so confirming the general results of this study.
Eventually, Table 6 reports the results of instrumental variable regressions with a random effects estimator. As we are estimating a random effects model, we have to find some variables able to capture some unobservable and invariant factors. Within Europe, the main distinguishing factor is still the difference between Western and Eastern (formerly communist) countries. Then, we added a dummy variable “eastern” that takes the value of unity if the country is a former communist country and zero otherwise. Evidently, this dummy variable is supposed to capture a set of unobservable factors that are country-specific. Put differently, there are some structural aspects in former communist countries, which can affect significantly any social outcome. In other words, the rationale behind distinguishing between Eastern countries and the rest of Europe is that institutions as “rules of the game,” either formal or informal, take time to evolve over time. That is, as it is often argued, the process of reforming transition countries is highly asymmetric across countries but it also shows some significant path-dependency. Moreover, as we noted above, there is a quota of international students that take into account economic factors and employment opportunities in host countries. Eastern countries are perceived to be less desirable in this respect because of some structural deficiencies. Therefore, to capture such specific institutional characteristic at country level we simply add this dummy variable. Results show a significant association with the inflow of foreign students so stating that Eastern countries are by no means yet attractive for international students. 12
Inflows of Students From EU-27, EEA, and Candidate Countries, IV Estimation, Random Effects.
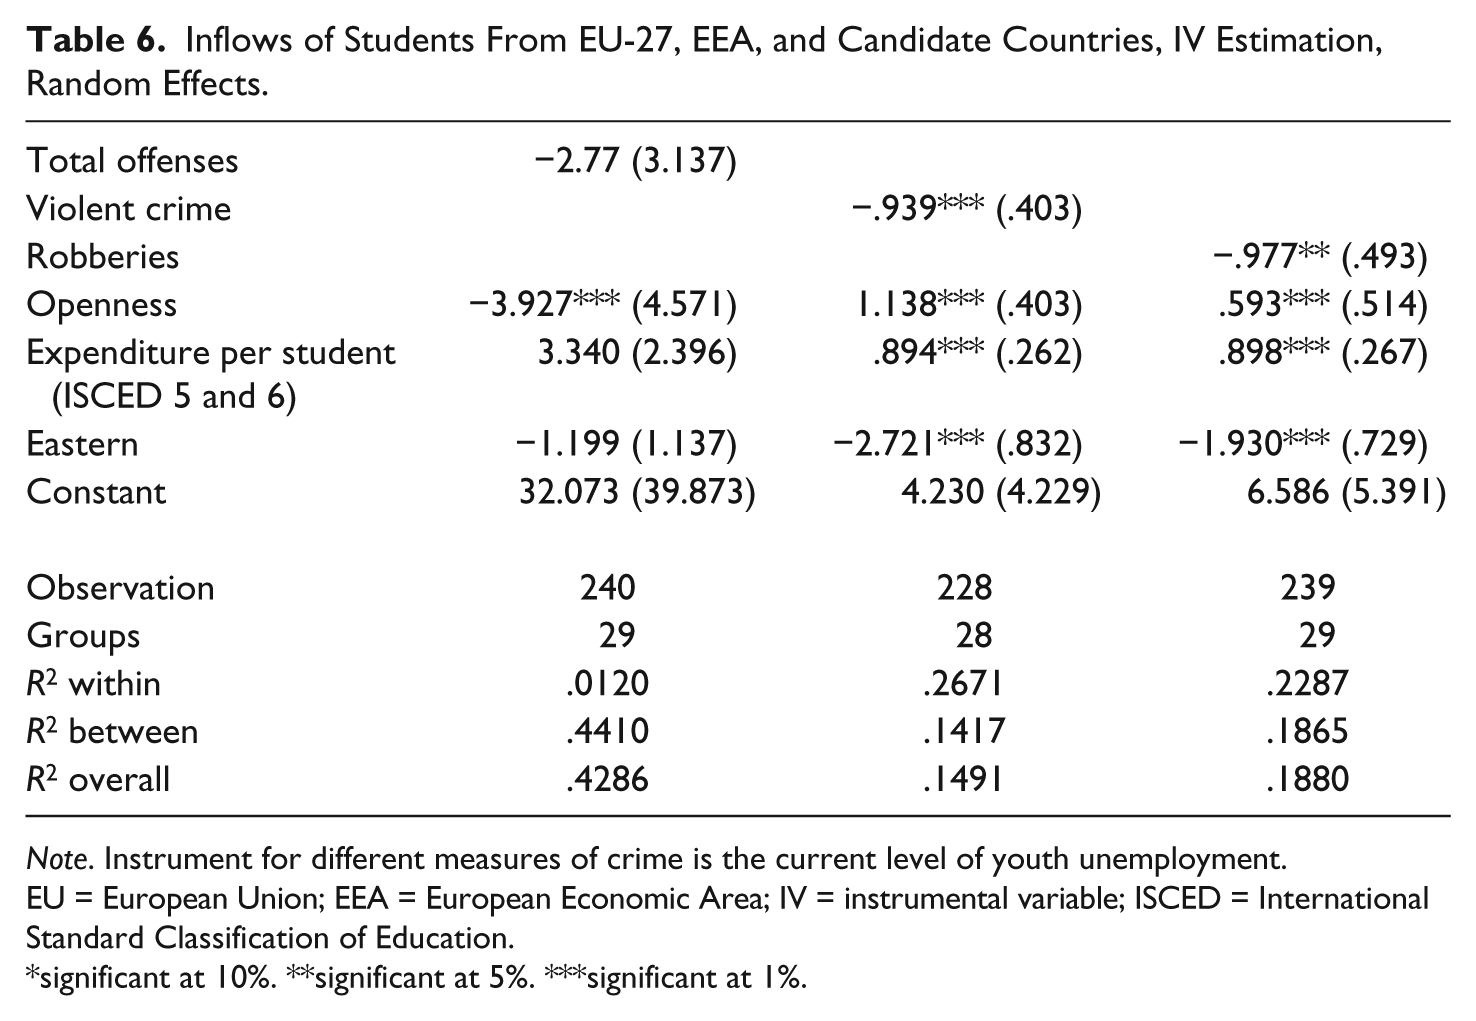
Note. Instrument for different measures of crime is the current level of youth unemployment. EU = European Union; EEA = European Economic Area; IV = instrumental variable; ISCED = International Standard Classification of Education.
significant at 10%. **significant at 5%. ***significant at 1%.
Summary and Concluding Remarks
The main result we would claim for this work is the novel evidence on the determinants of students’ mobility within Europe. In summary, one can conclude that the results confirm some hypotheses developed in prevailing literature on the topic. In particular, it might be argued that in Europe students behave mainly either as “strivers” or “highfliers.” In sum, the main results are as follows:
The expenditure per student seems to be an important variable. That is, students are likely to choose countries where the students are granted with adequately funded services and perhaps monetary incentives. The degree of elasticity is significantly high. If the expenditure per student increases by 1%, the actual number of European foreign students should increase by the same percentage. Evidently, this is a relevant suggestion for economic policy. Moreover, it must be noted that the level of expenditure is also a proxy for the quality of the universities and national educational systems.
Perception of lack of safety and insecurity in the host country reduces the inward mobility of students. Proxying such insecurity by means of the actual number of offenses recorded by police is based on the assumption that potential incoming students are rational and take into account the actual level of crime.
International mobility of students also follows the globalization of the economy. In fact, the more open is the host country, the larger is the number of incoming students.
Economic conditions of the host country are taken into account. Richer countries are more attractive. Richer economies are likely to secure a larger set of employment opportunities during and after study. This is taken into account by mobile students.
In particular, the magnitude of coefficients suggests that the attractiveness of richer countries leads the other pull factors considered here. However, in terms of economic policy design, more interesting is the result on the expenditure per student. On the other side, among detrimental factors, the impact of crime is dominating the negative effect or raising cost of living. The cost of living in itself does not seem to discourage the inflow of international students. Only the interaction term between inflation and tuition fee turned to be negatively significant. In brief, students as rational actors prefer richer countries irrespective of the cost of living. In this respect, these results do not confirm the evidence proposed by Beine, Noel, and Ragot (2012) that show a significant impact of living costs on students’ international mobility. In general, these econometric results can be compared with those presented in the quantitative study by Kahanec and Kralikova (2011) that stressed the quality of higher education institutions and the supply of programs taught in the English language as fundamental pull factors.
These results pave the way for further research. First, a more accurate collection of data is necessary to have robust results. Interestingly, what appears clear is that the choice of universities for international mobile students comprehends a set of factors that are related to the institutional (either formal or informal) landscape of regions and territories. Put differently, higher education institutions do not operate in a vacuum. Countries play a role in determining the conditions that allow universities to implement successful policies of global enrollment.
Footnotes
Declaration of Conflicting Interests
The author(s) declared no potential conflicts of interest with respect to the research, authorship, and/or publication of this article.
Funding
The author(s) received no financial support for the research, authorship, and/or publication of this article.