
Abstract
Mental-spatial representations are often used for processing quantities and magnitudes such as numbers or pitch. The present study investigates whether the active creation of associations between space and pitch magnitude leads to a better estimation of the distances between pitches (musical intervals). Non-musicians performed an aurally presented comparison task in which musical intervals had to be estimated both before and after a training phase. Experiment 1 shows that the experimental group participants who were given the opportunity to establish associations between space and pitch (by means of spatial visualizations presented during training) improved significantly regarding their skill of estimating musical intervals compared with a control group without exposure to spatial visualizations during training. Experiment 2 replicated these findings, and a supplementary experimental group showed that the establishment of these associations is hindered when, additionally to pitch, task-irrelevant information about the point in time at which a tone is played during a trial, is also presented spatially during training (which does not decrease performance in training). We found that explicitly creating associations between space and pitch leads to a better estimation of the size of musical intervals, and we conclude that using analogies between space and pitch, e.g., in aural training in music education, is an efficient way to train the perception of pitch distances between musical notes.
It is fascinating that many professional musicians hear a tune once and are able to play it straightaway on their instrument; some are even able to improvise on the newly heard melody without previous preparation. For non-musicians, this astonishing ability includes (in addition to the perception of other musical parameters, such as the perception of beat and rhythm) the perception of pitch. How can musicians perceive the distances between the notes of a tune simply by listening to it? How do they obtain the required information when they want to reproduce the pitches of the notes, given that the pitch of the first tone is provided and, as with most musicians, they do not have perfect pitch? How can this skill of determining the distance between different pitches and, thus, the ability to reproduce a just-heard melody be learned and trained correctly?
The present study investigates whether the spatial visualization of pitch presented on a computer screen during a training phase can help improve the perception of distances between different musical notes that are only presented aurally. We assume that supporting the creation of a mental-spatial representation of pitch with the abovementioned spatial visualizations helps participants determine musical intervals more precisely.
When humans process quantities and magnitudes, a spatial component can often be detected (Brugger, 2008; Walsh, 2003). There is evidence that even magnitudes with no spatial dimension are still represented spatially in the mind. Brugger even raises the question of “Are there non-spatial magnitudes?” (2008, p. 271) and postulates that every magnitude is represented spatially in some manner.
The mental-spatial representations of numbers have been studied in great detail. Humans in western cultures associate higher numbers on the right-hand side spatially compared with lower numbers (e.g., a faster reaction occurs on the right side for higher numbers, even when the magnitude is irrelevant) and vice versa, which is known as the SNARC effect (spatial numerical association of response codes; Dehaene, Bossini, & Giraux, 1993). This association between space and numerical magnitude is amodal (Nuerk, Wood, & Willmes, 2005), which means that the association is independent of the modality in which the number is presented. Therefore, this association is of an abstract nature. The direction of the spatial-mental representation of numerical magnitude is affected by reading habits (Shaki, Fischer, & Petrusic, 2009) and is not limited to the horizontal level. The character of the spatial representation therefore differs depending on how the association was learned. Educational research shows that spatial-numerical training can support the numerical development of children (e.g., U. Fischer, Moeller, Bientzle, Cress, & Nuerk, 2011). However, once the association between space and numerical magnitude is established, this association is not rigid: after experiencing incongruent mappings that contradict SNARC, the SNARC effect is reduced (M. H. Fischer, Mills, & Shaki, 2010). A reduction of the SNARC effect can be found even when manipulating the congruency within an experiment after incongruent trials (Pfister, Schroeder, & Kunde, 2013). In summary, we can conclude that numerical magnitudes are associated with space. We can also conclude that this association is learned and probably assists numerical processing and that the character of spatial associations for numerical magnitudes is flexible.
Just like numerical magnitudes, pitches are associated with space. The SMARC effect (spatial musical association of response codes; Rusconi, Kwan, Giordano, Umiltà, & Butterworth, 2006) leads to an assumption that a higher pitch has a stronger mental-spatial association with the right side compared to a lower pitch, and vice versa. This association is also known as the SPARC effect (spatial pitch association of response codes, Lidji, Kolinsky, Lochy, & Morais, 2007), but SMARC is the common label. Reactions to a tone with relatively high pitch are faster when responses on the right side are required compared to responses that are required on the left side, even when the pitch level is irrelevant to the task. When a reaction to a tone with relatively low pitch is required, the reactions are faster when responding on the left side compared to reactions on the right side. This effect can be found for professional musicians for whom musical pitch is spatially represented as a “mental piano”. However, the mental-spatial representation is not limited to the horizontal level, as a vertical spatial association can also be identified: tones with higher pitches are associated with a higher position in space than tones with lower pitches, a phenomenon that is suggested by the nomenclature for high and low pitches, which was presented and tested in a very early stage of research (Pratt, 1930; Stumpf, 1883).
Non-musicians also show associations between space and musical pitch, but these associations are not as distinct as for professional musicians and can be shown only on the vertical dimension or when a reference tone is given (Cho, Bae, & Proctor, 2012). Thus, associations between space and musical pitch are learned because professional musicians show notably stronger associations compared with non-musicians. There is also evidence that mental-spatial representations are developed to a greater extent (a compatibility effect with mappings comparable to SMARC does not increase) with growing musical experience (Keller & Koch, 2008). Additionally, the character of space-pitch mappings is influenced by the way in which associations were formed. Different mental representations of pitch can be found in languages in which thick and thin (as translated into English) are used instead of low and high to describe pitch. Also, by learning new space-pitch metaphors mental representations can change (Dolscheid, Shayan, Majid, & Casasanto, 2013). However, there are indications that there is a type of predisposition for vertical spatial-mental representations of pitch. Three- to four-month old infants are sensitive to the congruency of animations and corresponding sounds, for example, higher pitch and smaller visual images, which are placed higher in the visual space (Walker et al., 2010). The anatomical structure of the human inner ear appears to increase the volume of high-pitched sounds that originate from a source high in space and low-pitched sounds that originate from sources low in space (Parise, Knorre, & Ernst, 2014).
To summarize, when dealing with musical pitch, humans establish mental-spatial representations of pitch. Exactly how these representations appear depends on how they were initially established. It can be assumed that these representations are very flexible, and there is some evidence that a predisposition for associations between pitch and space exists. When professional musicians demonstrate these associations, is it possible to explicitly create associations between space and pitch for non-musicians and, in so doing, enhance their perception of the distances of pitch between musical notes (similar to spatial-numerical training for children to improve their understanding of numbers)?
Another hint for the assumption that spatial representations are helpful or even necessary when learning to estimate musical intervals may be that people who suffer from amusia (an inability to process pitch correctly that affects the ability to recognize melodies) also have impairments in spatial thinking (Douglas & Bilkey, 2007). Therefore, one can speculate that spatial thinking is necessary for processing pitch. Because the creation of spatial representations is probably hindered due to very low spatial abilities, perhaps high spatial abilities affect the creation of spatial representations, as well.
We hypothesize that the creation of explicit associations between pitch and space enables non-musicians to improve their ability to determine musical interval distances. For this reason, we expect non-musicians, who use spatial visualizations of pitch on a computer screen during a training phase (in which every auditory frequency is represented by a round circle in space that appears when a tone is played), to improve to a greater extent in a task where aurally presented musical interval distances must be estimated, in comparison to non-musicians who are not provided with visual information about pitch positions in the training phase. In addition, we assume that high spatial thinking abilities support this expected improvement in the experimental group.
Pilot study
A pilot study was conducted to generate and select appropriate items to test the ability to estimate the distance of musical intervals. University students (N = 127; Age: M = 20.54, SD = 1.74; 108 were women; years of formal training on a musical instrument, including singing: M = 1.64, SD = 3.03) were asked to participate voluntarily. In each group (a maximum of 23 students), the stimuli were presented aurally, and the participants answered simultaneously on an answer sheet that had been given to them beforehand. In addition to the single-choice questions for the task, the answer sheet also included questions about demographics and formal training in music.
For the main task, the participants listened to two musical intervals (the distance between two notes) that were played on loudspeakers, after which they had to decide whether the second interval was larger or smaller than the first one. The four tones of the two intervals were played separately (the total length of an item was 5.5 seconds); the first tone of an item was played at the very beginning of the item and the second tone after 1.25 seconds for the first interval, and the third tone after 3.25 seconds and the last tone after 4.5 seconds for the second interval. The tones were presented as piano sounds, i.e., dynamic compressed recordings from a stage piano with a fixed velocity. The length of a single note, including decay, was approximately 900 milliseconds. Associations between space and pitch (the SMARC effect) can sometimes only be found in non-musicians when a reference tone (a tone to which the pitches of other notes can be related) is given (Cho et al., 2012). For this reason, we decided to use a type of reference tone in our task as well because the aim of the study is to help non-musicians build associations between space and pitch. To establish a reference tone, the second tone of the first interval and the first tone of the second interval had an equal pitch in every item. The seven possible notes were taken from a whole note scale on a middle C (C4, D4, E4, F♯4, G♯4, A♯4 and C5), which means that the distances between the notes are always the same. For the items, all possible interval combinations (except primes and intervals of the same size) were used, regardless of whether they were ascending or descending. Therefore, it was possible to create 192 different items when applying these rules. For every group of participants, a third of the items (64 items) was presented. The lowest Cronbach’s α for a block of 64 items was α = .830. The participants’ performance did not vary over time because the number of correct answers from the first 32 items (M = 22.44, SD = 4.72) was not different to the number of correct answers in the second set of 32 items (M = 21.81, SD = 4.66; repeated measures ANOVA: F(1, 126) = 3.57, p = .061, ηp2 = .028).
To sum up, we were able to create appropriate items to test the ability to estimate the size of musical intervals. Because of the surprisingly high internal consistency of the items for non-musicians, we decided also to use a selection of items from the pilot study for the training phase in the following experiment (the item selection is described in the task and procedure).
Experiment 1
Method
Participants and experimental design
The participants were university students (N = 47). Six participants were excluded because they made no mistakes in the pre-test of the study; thus, there was no possibility for them to demonstrate better performance in the post-test, which used the items from the pre-test. Another participant was excluded as an outlier because his spatial ability score (for more information, see the learner characteristics section) was greater than three standard deviations above the average. Hence, 40 participants (Age: M = 20.95, SD = 2.40; n = 33 female; 3 left-handed; years of formal training on a musical instrument including singing: M = 3.03, SD = 3.66) remained for further analysis. The participants were randomly assigned to one of two groups: an experimental group with visualizations presented during training (n = 20) and a control group without visualizations during training (n = 20). These groups showed no differences in the amount of formal musical training (control group: M = 2.60, SD = 3.38; experimental group: M = 3.45, SD = 3.97; F(1, 38) = .53, p = .470, ηp2 = .014).
Task and procedure
The ability to estimate the distance of musical intervals was tested before and after a training phase (pre-test and post-test) with the task described in the pre-study above. Fifteen items were selected from the 192 possible items from the pilot study, with item difficulties (controlled for guess probability) ranging from pid = .05 to pid = .36. We decided to use items with item difficulties just above guess probability and selected items with high item-total correlations. The number of items with smaller second intervals (8 items) was nearly the same as items with a larger second interval (7 items). These items were used for both the pre-test and post-test (α = .78, always in a random order).
Between the pre-test and post-test, the participants passed through a training phase that consisted of two blocks. Each block included 15 items that were also selected from the pilot study. In contrast to the pre-test and post-test in the training phase, the participants were given feedback after each item, and each item was presented a second time after the feedback was given. For the first training block, easier items were given (ranging from pid = .41 to pid = .50); for the second training block, the item difficulty levels were comparable to the items used in the pre-test and post-test (ranging from pid = -.03 to pid = .38). In the experimental group, the participants were provided with spatial visualizations in the two training blocks, and in the control group, a fixation cross was presented (as in the pre-test and post-test for both groups).
Between each block, the participants were able to take as long a break as they wished. During the breaks, gentle nature sounds were played for the participants to “neutralize” the auditory senses.
The experiment was run on PCs with a 22-inch display that used the E-Prime software (Schneider, Eschman, & Zuccolotto, 2002). The sounds were played via professional closed headphones (AKG K-44 Perception).
Visualizations during training
In the experimental group spatial visualizations were presented during the training phase. Every time an item was presented in the training phase, a line from the lower left to the upper right appeared on the screen (see Figure 1). This line was displayed throughout the duration of the item. Blue circles appeared on this line whenever a tone was played and were hidden when the decay of the tone was over. Every possible tone had a specific place on the line, and the distances between the possible positions of the circles (only whole notes) were equal. The tones were ordered according to their pitches. The lowest tone (C4) was represented by a circle on the lower left side of the screen, and the highest tone (C5) was represented on the upper right side.
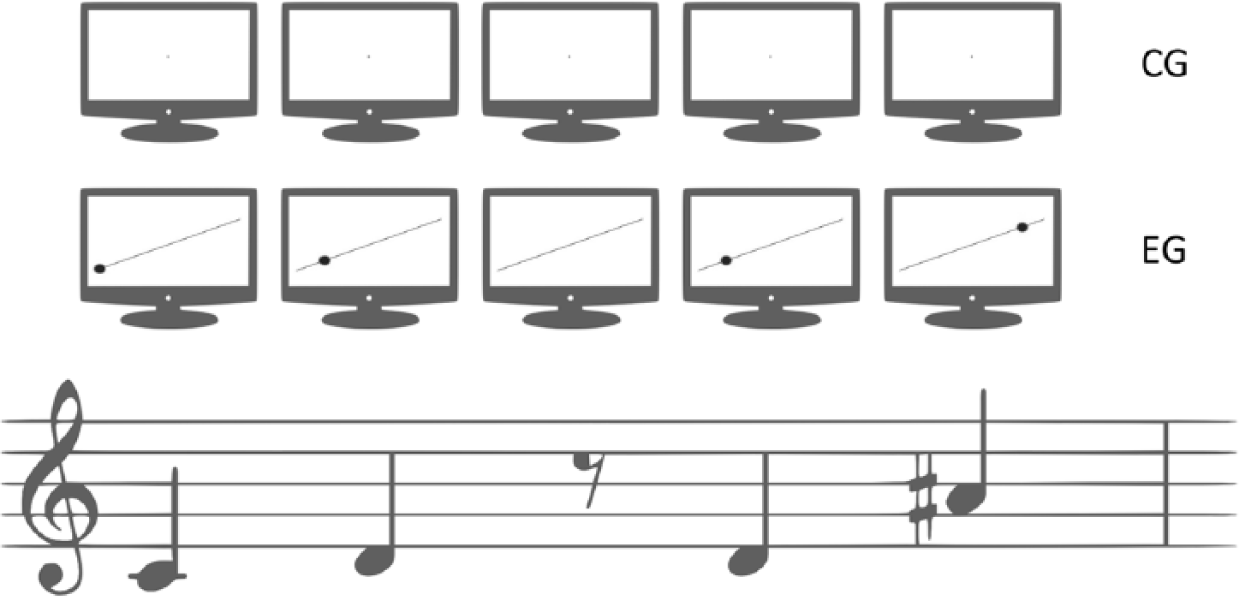
Example of the spatial visualization of pitch in Experiment 1. The example shows an item shown to the experimental group in the training phase. For the control group, a fixed cross was presented during training.
Learner characteristics
After the main experiment, the spatial abilities were tested. To measure spatial abilities, the 20 items (Cronbach’s α = .825) of the Spiegelbilder subscale [mirror images] of the Wilde-Intelligenztest-2 (WIT-2; Kersting, Althoff, & Jäger, 2008) were used and presented on a computer screen. In the event that the participants finished all items before the time limit was reached (3 minutes), the items were presented for a second time until the time limit was reached.
Data analysis
A mixed-design ANOVA was conducted to test whether the estimation abilities of the participants increased in general after the training session between the pre-test and post-test and whether participants from the experimental group who were shown spatial visualizations during training showed a greater ability increase compared with the control group. Furthermore, a correlation between spatial abilities and increases from the pre-test to the post-test was calculated for the experimental group to examine whether spatial abilities have an influence on learning when using spatial visualizations. Additionally, a correlation between the participants’ years of formal training in music and the increase from the pre-test to the post-test was calculated.
Results
When comparing the performance (number of correctly solved items) between the pre-test and post-test (see Figure 2), the main effect of the within-factor in a mixed-design ANOVA is significant, F(1, 38) = 4.21, p < .05, ηp2 = .10. The participants’ performance in the post-test was better than that in the pre-test. A significant interaction, F(1, 38) = 4.21, p < .05, ηp2 = .10, indicated that the main effect is due to the improvement of the experimental group from the pre-test (M = 10.25, SD = 2.69) to the post-test (M = 11.80, SD = 2.07). The control group showed no improvement (pre-test: M = 10.65, SD = 3.38; post-test: M = 10.65; SD = 3.33). A high correlation for all participants between pre-test and post-test was found, r(38) = .637, p < .001.
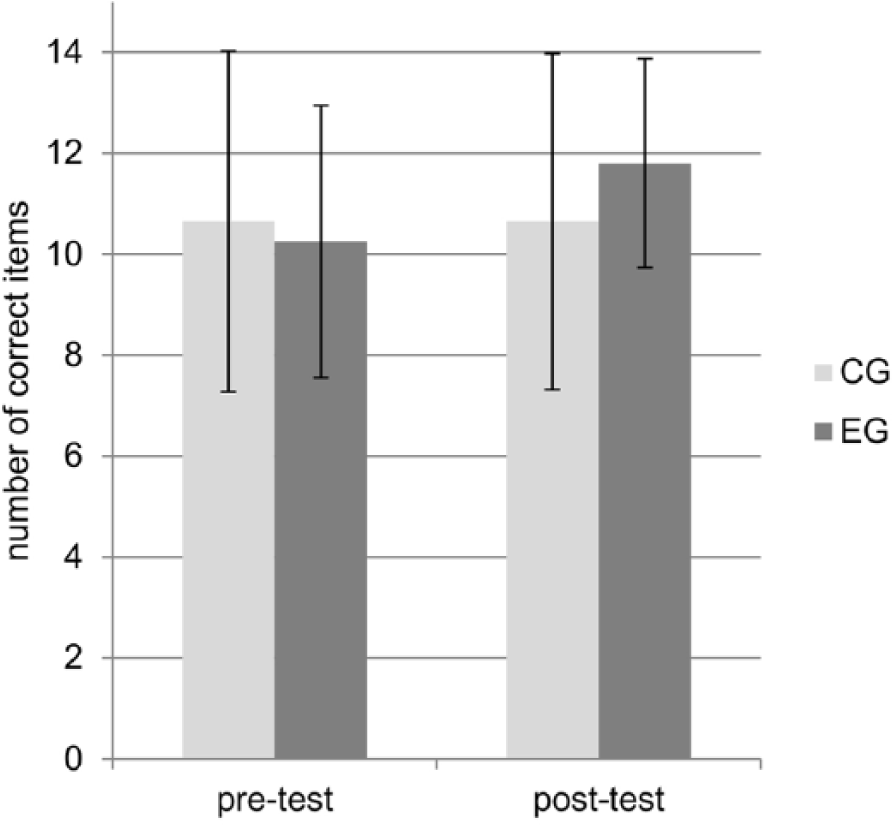
Number of correctly solved items in pre- and post-tests in Experiment 1, in which musical intervals (presented aurally) were to be compared. The pre- and post-tests consisted of the same 15 items presented randomly. The participants of the experimental group (EG) were supported by spatial visualizations of pitch during a training phase. The participants of the control group (CG) practiced without spatial visualizations.
To test whether spatial abilities (M = 14.60, SD = 4.72) have an impact on the amount of learning experienced by the experimental group participants using spatial visualizations, the improvement of the participants was calculated by subtracting the test scores of the pre-test from the test scores of the post-test (M = 1.55, SD = 2.31). No significant correlation was found for the spatial abilities scores and the improvement scores, r(18) = –.18, p = .455. The amount of formal musical training and the improvement seen in the experimental group participants and control group participants did not correlate significantly with the improvement scores, r(38) = .23, p = .145.
Post-hoc, the performance in the training phase was analysed more closely using a mixed-design ANOVA. The groups were used as a between-factor, and the two blocks of the training phase were used as a within-factor. The number of correctly answered items in each block was used as the dependent variable. The main effect (between-factor) showed that the participants who were shown the spatial visualizations answered more items correctly in the training phase than did the participants in the control group, F(1, 38) = 45.04, p < .001, ηp2 = .54. Considering the descriptive data, the experimental group made almost no mistakes in the 15 items in both blocks of the training phase (Block 1: M = 14.80, SD = .41; Block 2: M = 14.90, SD = .31). A significant main effect showed that the participants performed better in the first block of the training phase, which consisted of items that were easier to solve, than in the second block of the training phase, which consisted of items that were comparable in difficulty to the items in the pre-test and post-test, F(1, 38) = 8.43, p < .01, ηp2 = .18. The significant interaction, F(1, 38) = 10.92, p < .01, ηp2 = .22, showed that this decrease was due to the performance of the control group (Block 1: M = 11.60, SD = 2.66; Block 2: M = 10.05, SD = 3.27).
Discussion
We assumed that non-musicians who were presented with spatial visualizations in the training phase would show a greater improvement in the estimation of the size of musical intervals compared with non-musicians who practiced without the use of spatial visualizations. A significant interaction between the point of measurement (pre-test and post-test) and the type of treatment (experimental group and control group) confirms our hypothesis. The participants who practiced with spatial visualizations showed a significant improvement in their ability to estimate the distance of pitches of musical notes. When practicing with identical items but without visualizations, no improvement from the pre-test to the post-test can be seen in the control group.
The experimental group also shows better performance in the training phase. Nearly all items were solved correctly when the participants were able to use spatial visualizations. This fact indicates that the experimental group participants were able to benefit from the visualizations when answering the items as the items are solved correctly ab initio. Thus, one can assume that these participants solved the items primarily by looking at the visualizations. However, they created an association between the visualized pitch and the sound because their performance on items in the post-test (that had not been seen as visualizations in the training phase) was higher than that observed in the control group; thus, the experimental group participants probably had a more precise mental representation of musical interval distances. The fact that the participants were still required to estimate musical intervals likely shows that they integrated the sound played during the items, even if they solved the items only by looking at the visualizations. The participants of the control group performed better in block one of the training phase than in block two. This is not surprising because the items in block two were more difficult than the items in block one, as mentioned above.
Participants’ spatial abilities showed no influence on their improvement from the pre-test to the post-test in the experimental group. Because of the sample size, it is not possible to detect small relationships between improvement and spatial abilities in our experiment; thus, we can only conclude that spatial abilities do not have a substantial influence on the formation of associations between space and pitch in our experimental setting. Because people who cannot process pitch correctly also demonstrate lower spatial abilities (Douglas & Bilkey, 2007), we assume that a certain level of spatial abilities is needed to create spatial associations and, therefore, spatial representations. However, as long as a minimum level of spatial ability is present, the associations can probably be established.
To summarize, Experiment 1 shows that the explicit creation of associations between space and pitch can improve the ability to determine the distance between the pitches of different musical notes. Already existing associations between space and pitch are strengthened, and explicit associations can be formed, with the use of spatial visualization which helps improve the estimation of the size of musical intervals.
However, these associations are usually not formed via such simple spatial visualizations. When practicing or performing music, pitches are normally presented as musical notes. Musical notes contain both pitch and time information in a spatial representation. The vertical dimension of notes contains information about the musical pitch in a horizontal dimension of time (the time at which the note of a musical piece is played).
Similar to many quantities and magnitudes, time is represented spatially in the mind, just like pitch (Ishihara, Keller, Rossetti, & Prinz, 2008). What happens when spatial visualizations also contain information about the point in time at which a note is played? Is it more difficult to establish associations between musical pitch and space when space is not exclusively used for pitch? This question is investigated in the following experiment.
Experiment 2
Experiment 2 investigates whether additional information for a note, about the point in time at which the note is played during a trial is presented spatially on a horizontal dimension, together with information about the pitch of the note, which is presented spatially on the vertical dimension, interferes with the establishment of associations of space and pitch. We hypothesize that participants who practice with spatial visualizations that contain only information about musical pitch show greater improvement in tasks in which the distances between aurally presented pitches must be estimated than do participants who practice with visualizations containing spatial information about musical pitch and the point in time at which a note is presented.
Method
Participants and design
The number of required participants for the second experiment was calculated with parameters from the first experiment (a medium effect size and correlation among repeated measures of r(39) = .637). Therefore, a total sample size of 33 participants was needed when planning to calculate an interaction in a mixed-design ANOVA with three groups and two measurement periods (α = .05 and 1− β = .80).
As in Experiment 1, the participants were university students (N = 36), were naïve to the purpose of the experiment and had not participated in the previous experiment on pitch. Two participants had to be excluded because they made no mistakes in the pre-test of the study and thus would not have been able to demonstrate better performance in the post-test. Hence, 34 participants (Age: M = 22.12, SD = 4.04; 23 were women; 2 left-handed; years of formal training on a musical instrument including singing: M = 2.79, SD = 3.21) remained for further analysis. The participants were randomly assigned to three groups (two experimental groups that used visualizations during training and a control group that did not use visualizations during training). These groups showed no differences in the amount of formal musical training (control group: M = 3.83, SD = 3.66; experimental group with visualization of pitch only: M = 1.91, SD = 2.55; experimental group with visualization of pitch and time: M = 2.55, SD = 3.24; F(2, 31) = 1.09, p = .350, ηp2 = .07).
Task and procedure
The task, procedure, all items and measured learner characteristics were identical to those in Experiment 1. The only difference was the three-group design, with a control group (CG, n = 12) that was similar to Experiment 1 and two experimental groups with modified spatial visualizations.
Visualizations during training
In the experimental group that used spatial visualization of pitch only (EG_P, n = 11), the pitch was spatially visualized with round circles as in the experimental group in the first experiment (see Figure 3). Instead of a diagonal line, a blank screen was presented, on which the circles appeared every time a tone was played for the participants. Unlike in Experiment 1, the positions of the circles were only shown on a vertical dimension in the middle of the screen. The higher the pitch of the tone was, the higher the corresponding circle was placed on the screen. The distances between the circles (corresponding to the whole note scale) were equal, and each tone had a specifically designated place on the screen. Thus, EG_P was a type of replication of the experimental group from the first experiment. The circles were shown only on a vertical dimension to allow additional visualization of time in the second experimental group.
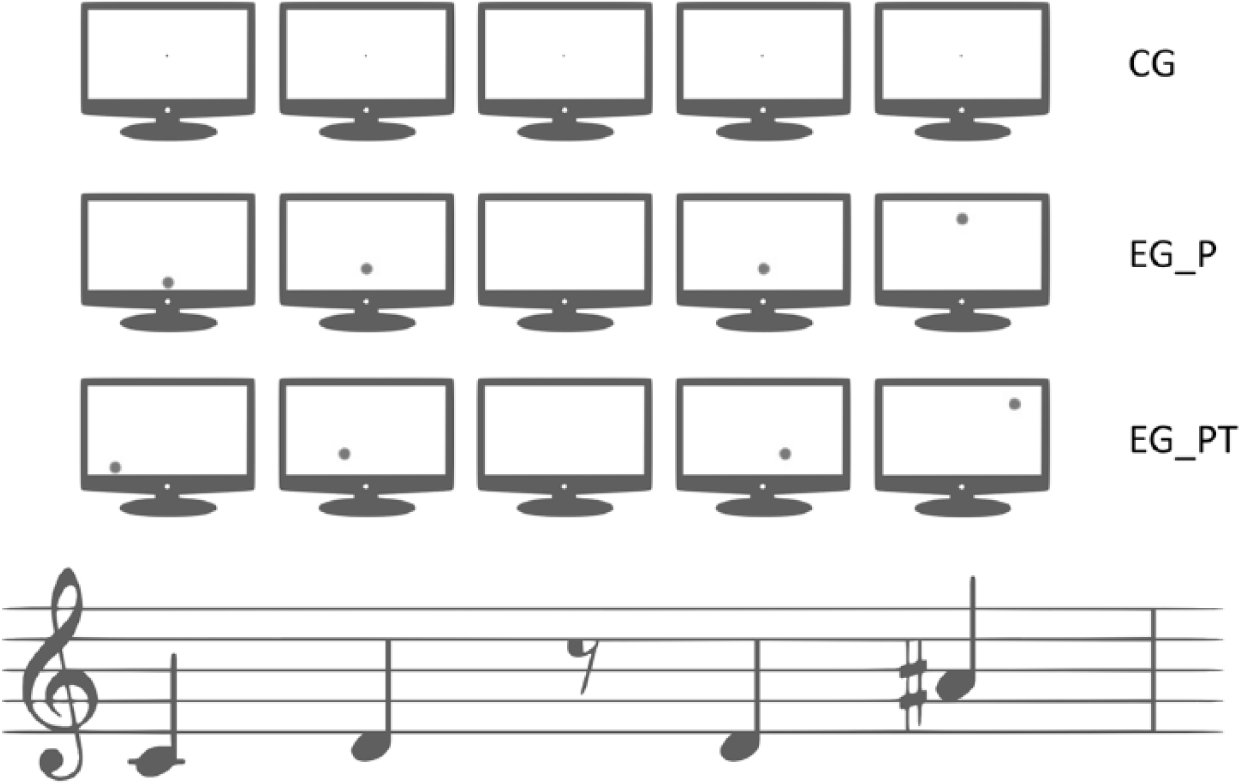
Example of the spatial visualization of pitch in Experiment 2. The example shows an item for the two experimental conditions in the training phase (EG_P with the spatial visualization of pitch and EG_PT with spatial visualization of pitch and time). For the control group, a fixed cross was presented during training.
In the experimental group using spatial visualizations of pitch and time (EG_PT, n = 11), the positions of the circles on the vertical dimension were the same as those in EG_P. Additionally, the points in time of the four item tones were spatially visualized on a horizontal dimension (see Figure 3). Thus, the visualization for the first tone of an item was presented on the far left. The visualization of the second tone was positioned further to the right but was still on the left side of the screen. The visualizations of the third and fourth tones were shown on the right side of the screen (the fourth tone to the far right), and the distance of the visualizations between second and third tones (between the intervals) was greater than the distances of the visualizations between first and second and the third and fourth tones (the two intervals).
Data analysis
As in Experiment 1, a mixed-design ANOVA was conducted to test whether the participants in general performed better after the training session (an increase from the pre-test to the post-test). To test whether the experimental groups showed a higher increase in comparison to the control group, planned contrasts were calculated based on the increase from the pre-test to the post-test (both experimental groups against the control group) in the event that the ANOVA showed a significant interaction. In contrast to Experiment 1, the spatial abilities were no longer reported because the experimental groups were too small to calculate reasonable correlations. The correlation between the years of formal training in music of all participants and the improvement of the performance was calculated as in Experiment 1. Because the post-hoc analyses in Experiment 1 showed more correctly solved items during training in the experimental group, a mixed-design ANOVA was conducted to test whether the same result would be found in this experiment.
Results
The descriptive data of performance in pre-test and post-test is visualized in Figure 4. A mixed-design ANOVA shows that the participants’ scores in the post-test were higher than in the pre-test, F(1, 31) = 18.59, p < .001, ηp2 = .38. Additionally, a significant interaction could be found, F(2, 31) = 3.67, p < .05, ηp2 = .19. Therefore, planned contrasts for the increase from the pre-test to the post-test (the score of the post-test minus the score of the pre-test) were calculated. The increase of experimental group EG_P (M = 2.55, SD = 1.63) versus CG (M = 0.33, SD = 2.10) is significant, F(1, 21) = 7.82, p < .05, ηp2 = .27, whereas the increase of experimental group EG_PT (M = 1.45, SD = 2.07) versus CG is not significant, F(1, 21) = 1.66, p = .21, ηp2 = .07. That is, experimental group EG_P, which used spatial visualizations of pitch, showed a higher increase from the pre-test to the post-test compared with the CG group. Experimental group EG_PT, which used spatial visualizations of pitch and time, did not show a significantly higher increase in performance. A high correlation for all participants between pre-test and post-test was found, r(33) = .640, p < .001.
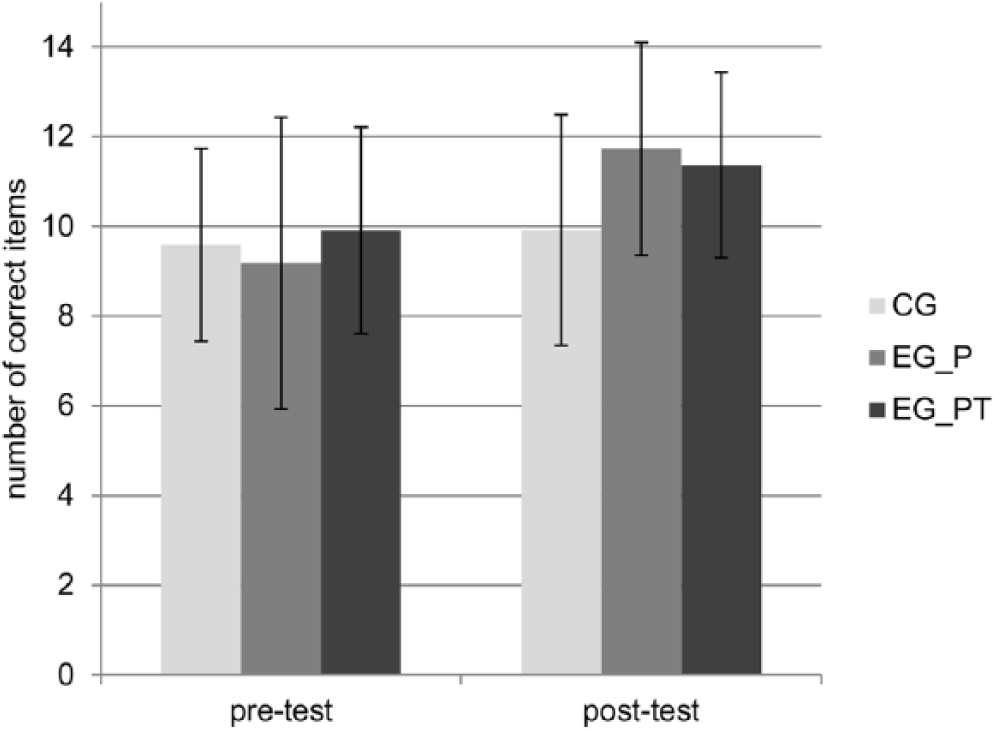
Number of correctly solved items in pre- and post-tests in Experiment 2, in which musical intervals (presented aurally) were to be compared. The pre- and post-tests consisted of the same 15 items presented randomly. The participants of the experimental groups were supported by spatial visualizations during a training phase. For EG_P, only pitch was visualized during training; for EG_PT, pitch and time, the latter of which was irrelevant to the task, was presented spatially during training; CG practiced without spatial visualizations.
When calculating the correlations between the years of formal musical training and improvement for all participants, no significant relationships could be observed, although the p-value is near the level of significance, r(33) = .34, p = .053.
As in Experiment 1, the participants in both experimental groups were able to solve nearly all items in the training phase (see Table 1). Again, a significant main effect of the between-factor showed that the participants had more items correct in the training phase when they were able to use visualizations, F(2, 31) = 30.09, p < .001, ηp2 = .66. The significant within-factor showed that more items in the first training block were solved correctly, F(1, 31) = 12.41, p < .01, ηp2 = .29. The significant interaction, F(2, 31) = 16.01, p < .001, ηp2 = .51, showed that the significant reduction of correct items from block one to block two was due to the decrease of correct items in the control condition.
Number of correctly solved items in the training phase in Experiment 2.
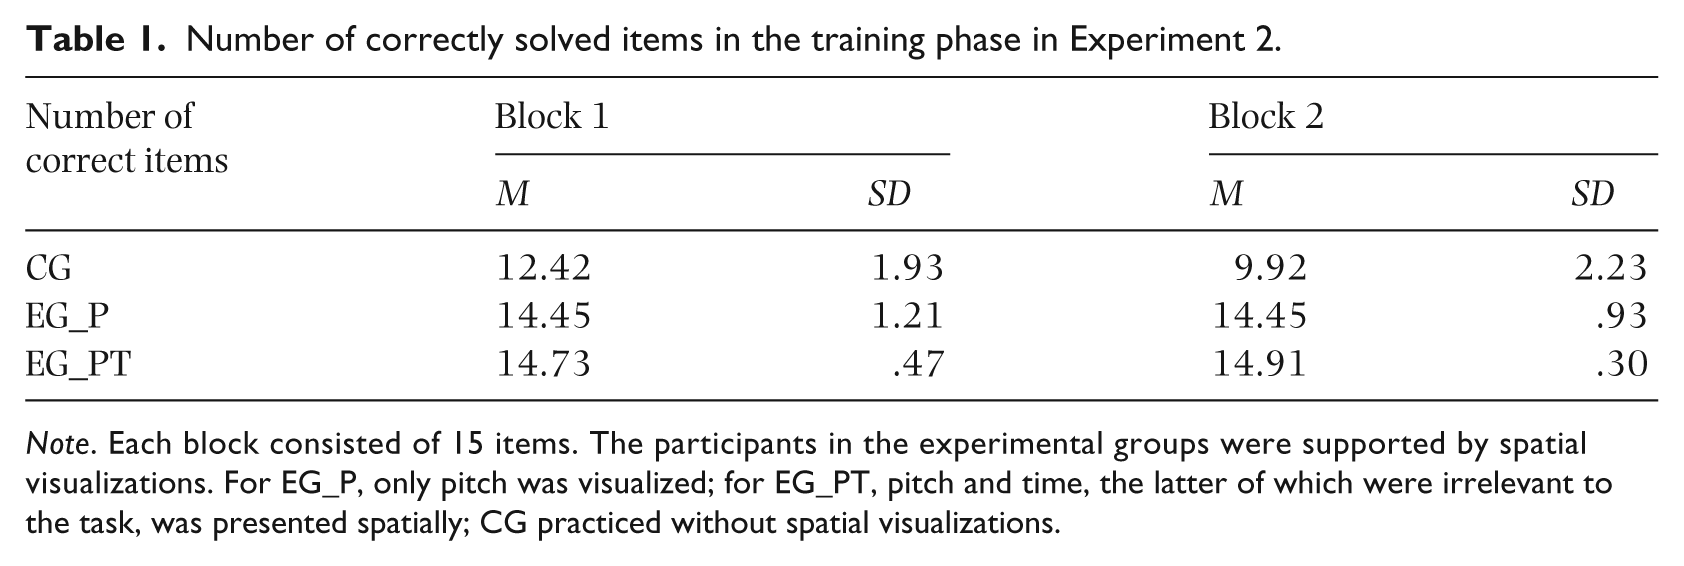
Note. Each block consisted of 15 items. The participants in the experimental groups were supported by spatial visualizations. For EG_P, only pitch was visualized; for EG_PT, pitch and time, the latter of which were irrelevant to the task, was presented spatially; CG practiced without spatial visualizations.
Discussion
As in Experiment 1, participants who use spatial visualizations of pitch during a training phase (EG_P) show greater improvement in the estimation of the size of musical intervals (when only the pitch information is presented spatially) than do participants who practiced without spatial visualizations. Thus, it was possible to replicate the findings of Experiment 1. The size of the effect in Experiment 2 is higher than that in Experiment 1. It is probably easier to enhance the associations between pitch and space when only the vertical dimension of space is used, which is not surprising: using analogies between pitch and the vertical dimension of space is the most intuitive approach for non-musicians, as described above. When both pitch and time were presented spatially in the visualizations during the training phase, (EG_PT) participants’ estimation of the size of musical intervals did not improve significantly compared with the control group, and the effect size was much smaller compared with experimental group EG_P. Nevertheless, the effect size for EG_PT was still at a medium level, and descriptively speaking, an improvement could be found. Thus, it can be speculated that the participants in this experimental group also improved, though not as much as those in the EG_P group.
In both experimental groups, the performance in the training phase was higher (nearly all items were solved correctly in both groups) than in the control group (the performance for block one was higher than for block two, as in Experiment 1). The participants in both experimental groups were able to solve nearly all items with the help of the visualizations during training. Thus, having only pitch presented spatially in the training leads to an improvement in the estimation of the size of musical intervals; when pitch and time are both visualized spatially at the same time, no significant improvement can be found. These results must be due to the fact that associations between space and pitch are created to a greater extent in experimental group EG_P (the items are solved equally well in both experimental groups in the training phase). When pitch is not the only information presented spatially, i.e., when unnecessary information about the point in time at which a note is played is visualized in a spatial dimension, the associations between space and pitch are not as well-formed, which is likely because space in such cases does not exclusively represent pitch.
It is probable this finding is only true when establishing associations between space and pitch. Existing associations between space and different magnitudes (e.g. associations between space and pitch and associations between space and numerical magnitude) do not conflict when the parameter of only one association is task-relevant, for example, when pitch is needed for a task and numbers are presented at the same time but are not task-relevant (M. H. Fischer, Riello, Giordano, & Rusconi, 2013). Once a spatial-mental representation of pitch is established, additional information presented spatially should not disrupt the use of these representations. It is likely that only using musical notes (pitch and time is presented spatially) in aural training is not the very best way of establishing associations between space and pitch. Once an association between space and pitch is established, musical notes are usable because the simultaneous spatial presentation of pitch and time no longer conflict.
In summary, it can be concluded from Experiment 2 that when using spatial visualizations to improve the estimation of the size of musical intervals, only pitch should be presented spatially. When an irrelevant parameter is presented spatially at the same time as pitch, it interferes with the creation of associations between pitch and space. When spatial visualizations of pitch use only the vertical dimension, the participants probably benefit more than when a spatial visualization of pitch uses the horizontal and vertical dimension, as in Experiment 1.
General discussion
In both experiments, the participants who were able to use spatial visualizations of pitch to solve a task in which musical intervals were estimated and compared during a training phase showed improved performance during the training phase and an increase in their abilities to estimate musical intervals when compared to participants who trained without such visualizations. When pitch is visualized on the vertical dimension only (and not on a diagonal using the vertical and horizontal dimension), a higher effect size of the improvement of the participants practicing with these visualizations can be found. The use of spatial visualizations results in a more precise estimation of distances between the pitches of different tones that are only presented aurally. When visualizations contain spatially presented information about pitch and time, the participants do not demonstrate poorer performance during the training phase. However, they are probably not able to create associations between space and pitch as well as participants who practiced using visualizations that only contained relevant spatial information; therefore, they do not improve their abilities in terms of estimating the size of musical intervals.
We showed that the estimation of the size of musical intervals can be improved in a very short time period (only 30 items in approximately 11 minutes) when using space to visualize pitch and only pitch during practice. The question remains as to how long this improvement persists. In the presented experiments, the performance was tested directly after the training phase and was only separated by a short break. Additionally, the task that the participants had to execute was not very complex, and the items used in the tests and training phase were very similar. It can be expected that in establishing associations between space and pitch, a better estimation of distances between the pitches of musical notes can be found in other tasks where this skill is also needed.
Spatial abilities had no substantial influence on the extent to which participants benefited from the spatial visualizations in Experiment 1. We assume that a common capability is sufficient for the development of associations between space and pitch. Additionally, musical experience showed no influence on our results, which is not surprising because all of the participants were non-musicians (or had some formal training back in their school days) and their musical experience was very low in general.
As is already common and demonstrated in mathematics (Siegler & Ramani, 2009), we think that learning to process quantities and magnitudes like numbers or musical pitch with explicit associations with space is very useful. The more clearly the possibility to associate space and a magnitude is, the better the processing of the magnitude is supported in the early stages. When learning an instrument such as the piano, where the link between space and pitch is obvious, an association between space and pitch should be established automatically. When non-musicians learn to play musical notes on a piano and are not able to watch their hands while practicing, their ability to recognize recently learned tones is poorer compared with participants who are able to watch their hands while learning to play the notes (Eldridge, Saltzman, & Lahav, 2010). It is likely that the association between space and pitch is established more easily when the participants can observe the spatial configuration between space on the piano and pitch. When teaching aural training or designing aural training software, this explicit creation of associations between space and pitch should remembered and implemented.
The presented results show that an association between space and pitch may play an important role in the development of musical skills. It is likely that this association is flexible and adaptive and can be established in different ways and can adopt various appearances. The SMARC effect is a way of uncovering this association and may result in experiencing the benefit of a spatial association with pitch (a magnitude) when learning to estimate pitch and to operate with this magnitude. In our study, we found that when explicitly constructing this association between space and pitch, the process is fostered and leads to a better estimation of the size of musical intervals. We conclude that using analogies between space and pitch has great potential, for example, when conducting aural training in music education. The analogies should be as simple as possible and should, at best, contain only pitch and space, preferably on the vertical dimension.
Footnotes
Funding
This research received no specific grant from any funding agency in the public, commercial, or not-for-profit sectors.