




Abstract
Evidence suggests that participating in career and technical education (CTE) in high school, on average, positively affects general education students when transitioning from education to the workforce. Yet, almost no large-scale causal research has explored whether academic benefits also accrue to students with disabilities in CTE. This omission is glaring given that students with disabilities participate in high school CTE programs at high rates. We use multiple years of administrative data from Massachusetts to estimate the effect of participating in CTE on the academic outcomes of students with disabilities. Compared with peers with similar disabilities who do not participate in CTE, students with disabilities in CTE programs perform comparably on standardized measures of student achievement but have higher probabilities of graduating from high school on time or earning industry-recognized certificates. Implications for policy and practice, particularly with regard to scaling access to similar programs, are discussed.
Keywords
Students with disabilities lag their peers without disabilities on a number of indicators of college and career readiness. In fact, the academic and postschool outcomes for students with disabilities are consistently lower than nearly all other student subgroups (Stetser & Stillwell, 2014). For instance, students with disabilities enroll in college (Newman et al., 2011; Wagner, Newman, Cameto, Garza, & Levine, 2005) and participate in the workforce (Bureau of Labor Statistics, 2013) at substantially lower rates than persons who do not have a disability. With more than one in 10 U.S. students identified as having a disability, understanding how to maximize educational and workforce outcomes remains a pressing focus for policy makers and educators alike.
Career and technical education (CTE) programs may provide one educational pathway through which students with disabilities could enjoy greater success in high school as well as when transitioning to life after high school. CTE is the name given to programs that were once called vocational education (e.g., building trades), but have now expanded to include growing fields such as information technology (IT), health services, and advanced manufacturing. In many cases, students take CTE coursework as electives in high school that are integrated into their school day. In other settings, CTE instruction occurs in specialized schools that students attend for part, or all, of a school day.
Students with disabilities participate in CTE programs at higher rates than do their peers without disabilities. In 2005, among high school graduates nationwide, approximately 26% of students with disabilities completed a CTE program compared with 21% of students without disabilities (Levesque et al., 2008). In addition, federal law governing CTE funding, the Carl D. Perkins Act, contains specific provisions for the inclusion of special populations that include students with disabilities. The popularity of CTE programs among students with disabilities may be attributable to the more inclusive nature of instruction in CTE environments, or the pedagogical accessibility to students with a range of learning styles. For example, CTE instruction is often designed to provide all students with customized academic interventions regardless of disability status (Vaughn & Linan-Thompson, 2003). Thus, in CTE settings, the provision of accommodations, often required by students with disabilities, may appear no different from those afforded to students without disabilities in the same classrooms, thereby lessening the potential stigmatizing effects of a disability designation.
Prior Work on CTE and Students With Disabilities
Prior work has identified CTE programs as a potentially important and cost-effective means of promoting the college and career readiness of students with disabilities (Eisenman, 2000; Fraser, 2008; Rabren, Carpenter, Dunn, & Carney, 2014). Work of Benz, Lindstrom, and Yovanoff (2000) suggests that students with disabilities who had career-related instruction were more likely to graduate from high school. Similarly, Wonacott (2000) as well as Shandra and Hogan (2008) found that participation in CTE and other career-oriented classes was associated with higher rates of graduation and increased employment in full-time competitive jobs after high school. Longitudinal data on a nationally representative sample of students with disabilities indicate that, on average, students with disabilities who attended vocational education programs had higher employment rates and salaries 5 years after high school graduation (Harvey, 2002). A recent review of the literature also drew similar conclusions regarding the benefits of CTE for students with disabilities (Lindstrom, Kahn, & Lindsey, 2013).
Other recent work indicates that the positive effects of CTE for students with disabilities may vary by program and student characteristics. Using the National Longitudinal Transition Study–2 (NLTS-2), Wagner and Newman (2015) found that students with learning disabilities (LDs) enrolled in occupationally specific CTE experienced better post–high school employment outcomes, but did not appear to benefit from enrolling in general CTE programs. Other work using the NLTS-2 data found that enrollment in CTE courses was not associated with higher rates of employment for students who are deaf or hard of hearing (Cawthon, Wendel, Bond, & Garberoglio, 2016).
The findings reported in this article build on previous investigations of this issue in three ways. First, the availability of student-level longitudinal data on the secondary school student population within a state allows the use of several analytic approaches (including a quasi-experimental matching approach) to identify otherwise similar groups of students who did and did not enroll in different CTE programs. Second, the data allow for the consideration of a range of experiences provided by CTE programs as well as the examination of the impact of enrolling in different types of CTE programs. These data also allow for a detailed examination of students with different disability designations. Therefore, it is possible to make distinctions among the range of potential effects of CTE on students across different disability diagnoses (e.g., specific LD, communication disability, or other health impairment). Finally, the extant literature has not evaluated the potential effects of CTE participation on students with disabilities in the era of high-stakes testing, which is known to have affected how schools serve students (Johnson, Stodden, Emanuel, Luecking, & Mack, 2002). Only one other study (Wagner et al., 2016) used experimental or rigorous quasi-experimental approaches to investigate whether enrolling in CTE programs is beneficial for students. The presence of a high-stakes exit exam required to earn a diploma in Massachusetts makes the contribution of this article particularly salient, as this study is the first to examine the impacts of CTE on educational outcomes for students with disabilities in this era of accountability.
This article investigates the following specific research questions:
Types of CTE Programs
In the United States, public schools provide a number of ways for high school students to participate in CTE programs. Most often, CTE students spend a portion of their school day in their residentially assigned comprehensive high school and the balance of the day in a regional technical education center. In such models, most CTE students are transported to their home school in the morning and then transported again from their home school to the technical center. In other models, students receive both their academic and technical education in one setting. This latter category includes programs such as career academies (which are themed high schools that focus on training students for particular industries) and regional vocational or technical centers that offer training in both core academic and technical training in one integrated environment. Over the last 30 years, the offering of CTE programs for more CTE-specialized schools has been increasing (Bloom & Unterman, 2014; Kemple & Willner, 2008; Stern, Wu, Dayton, & Maul, 2005; Stone, Alfeld, & Pearson, 2008).
Despite substantial growth in program offerings, nationally representative data on CTE participation have not kept pace with innovations and changes in education policy. Specifically, there are less data available at the national level that would allow researchers to understand the potential influence of the current policy context on CTE participation and its relationship with student outcomes. By focusing on high-quality state-level data, rich case studies can provide important and policy-relevant insights.
In Massachusetts, CTE is delivered through three distinct program types. The most common type is offered within a traditional comprehensive high school setting where students take core academic courses and CTE courses as electives in the same school. These programs, which serve approximately 50% of Massachusetts CTE students, must meet the federal Perkins Act requirements, and result in students taking CTE coursework as electives alongside their academic coursework, where classes are comprised of students who do, and do not, elect to take CTE courses. The remaining 50% of CTE participants in Massachusetts attend a regional vocational and technical school (RVTS). These schools operate as semiautonomous school districts and enroll students from multiple sending districts. Students who attend an RVTS are in an environment where the entire student body participates in some form of CTE and where students are drawn from several surrounding communities or through county or statewide agricultural programs. Therefore, all RVTS students take CTE courses as electives, but have clearer integration of CTE and academic course instruction. In addition, there are more CTE programs offered and more courses per program, on average, in the RVTS compared with the comprehensive high schools. The third type of CTE program is city vocational and technical schools (CVTS), which are a particular case of the RVTS. These programs are similar in structure to the RVTS, in that all attendees take electives almost exclusively in CTE coursework, but the CVTS serve only those students in the five largest cites (about 15% of Massachusetts CTE students). In this article, we do not examine results for students in the five cities served by the CVTS. Although this limits our ability to generalize, differences in how CVTS are funded and how they admit the students who enroll suggest they should be the source of their own separate inquiry.
Method
The Massachusetts Department of Elementary and Secondary Education maintains a longitudinal data system that can track students across K–12 and into college. In addition to the traditional demographic variables, they also track disability status, disability type, and time spent in inclusive educational settings. Massachusetts is also recognized as a leader in educational outcomes and the provision of high-quality educational programs (Crotty, 2014). These factors, as well as the presence of a variety of settings in which CTE is offered, make Massachusetts a compelling case study from which to learn about the potential impact of CTE on participation and outcomes among students with disabilities.
Data and Sample
This study uses data from the Massachusetts Student Information Management System (SIMS) for five cohorts of students who were ninth graders for the first time during the 2004–2005 through 2008–2009 school years. Through the SIMS data, students could be followed longitudinally for as long as they remained in the Massachusetts public schools. These data contain rich sets of covariates in addition to detailed information about students’ identified disabilities and the share of their instructional time spent in settings with their peers without disabilities. The following analyses do not include students who are in out-of-district placements as their individualized education programs (IEPs) likely differ in more substantively important and unobserved ways from students who otherwise have the same disability classification (Hehir et al., 2013). SIMS data were matched to data from the Massachusetts Comprehensive Assessment System (MCAS) and provided sufficient power to detect even small effects (minimum detectable effect size of 0.05 or smaller).
The state administrative data have a very low level of missingness. When data were missing, covariates were imputed to the sample median and flags were included to indicate missingness and were also included in the model (Wooldridge, 2010). Using the longitudinal database, in many cases, missing values from 1 year could be generated by identifying nonmissing values for the same individual in another year (e.g., a missing flag for free lunch status could be coded as “ever free lunch eligible” and imputed from other years). Individuals who were missing indications of disability status were not included in the analytic sample (less than half of 1% of whole sample). Missing test score outcomes were not imputed, though sensitivity analyses showed test scores were not differentially missing among students who did, and did not participate in CTE. Graduation was coded as equal to 0 if we did not observe a graduation code, thus making it harder to detect any effect on this outcome.
In Table 1, we summarize statistics for students in our sample. Although students with disabilities make up approximately 16% of the student population in non-CTE high school settings, they participate in any CTE programs at a rate of about 25%, split between roughly 22% in programs in comprehensive high schools and nearly 27% in regional technical schools. To further describe the participation of students with disabilities in CTE, we present in Table 2 the total number and share of students participating in CTE and non-CTE contexts including the regional vocational and technical high schools, by identified disability. Most noteworthy is that the share of students who participate in an RVTS differs substantially by disability type. Although students with disabilities, in general, are represented in any CTE setting at rates that exceed their general prevalence in the population, students with communication impairments, specific LDs, health impairments, and intellectual disabilities are most disproportionately represented, whereas students with emotional impairments, autism spectrum disorder, or multiple disabilities are much less likely to participate.
Summary Statistics for Students in the Analytic Sample.
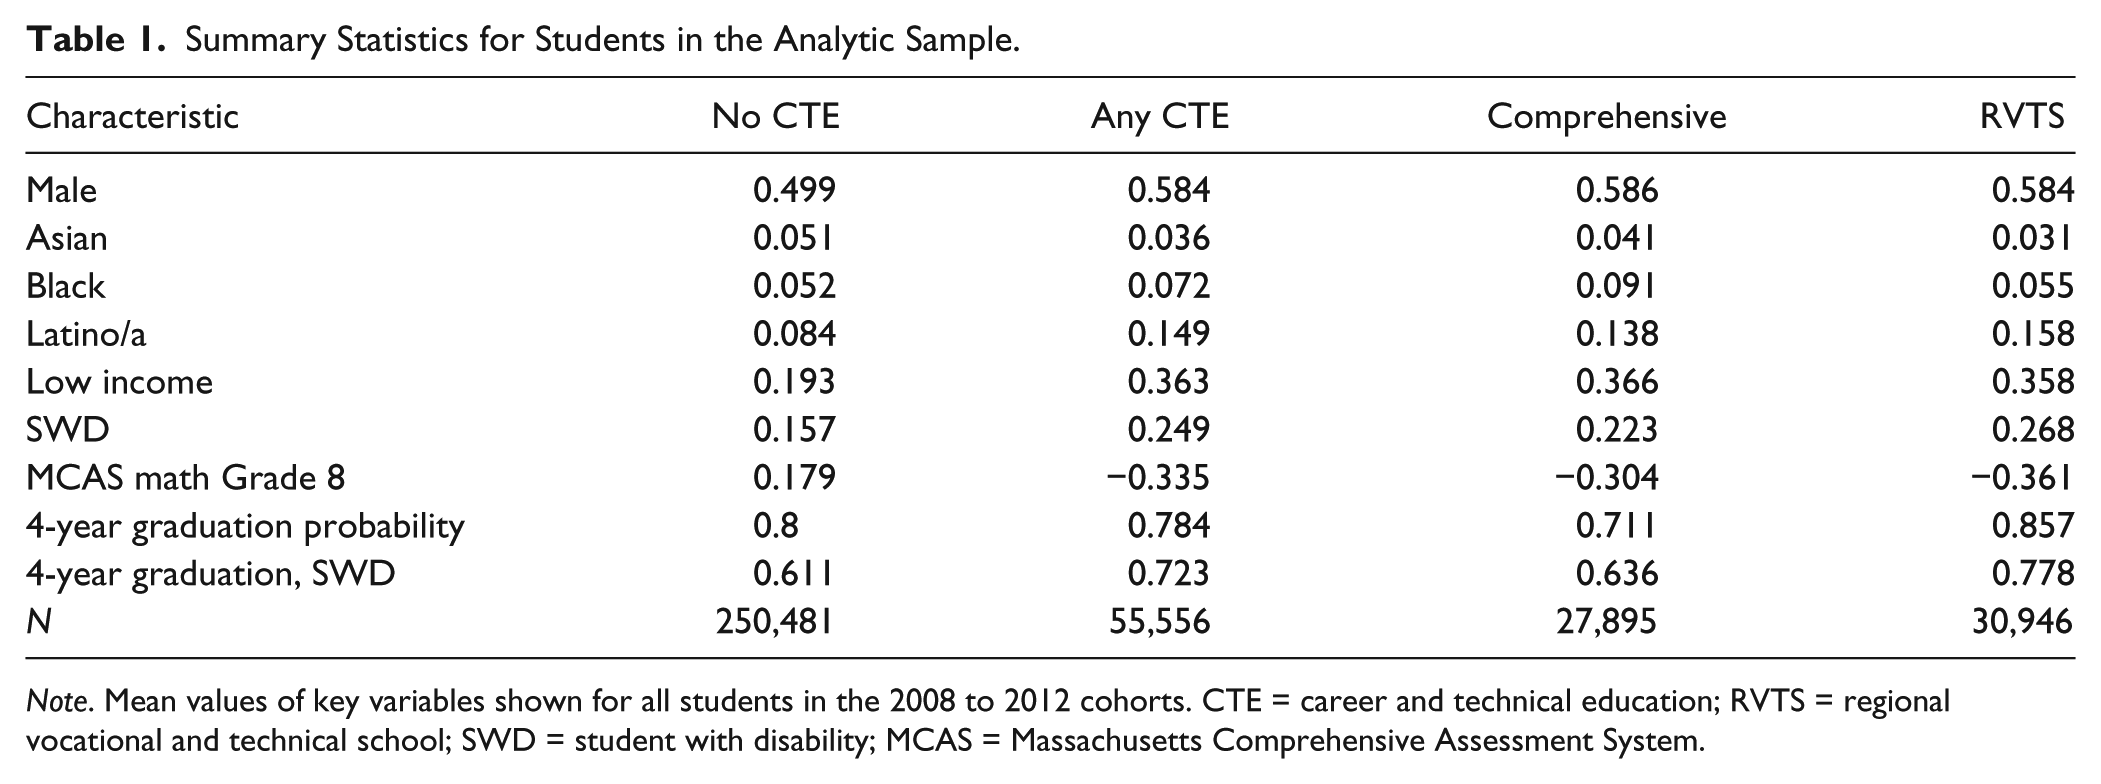
Note. Mean values of key variables shown for all students in the 2008 to 2012 cohorts. CTE = career and technical education; RVTS = regional vocational and technical school; SWD = student with disability; MCAS = Massachusetts Comprehensive Assessment System.
Distribution of Participation in CTE by Setting Type and Disability Category.
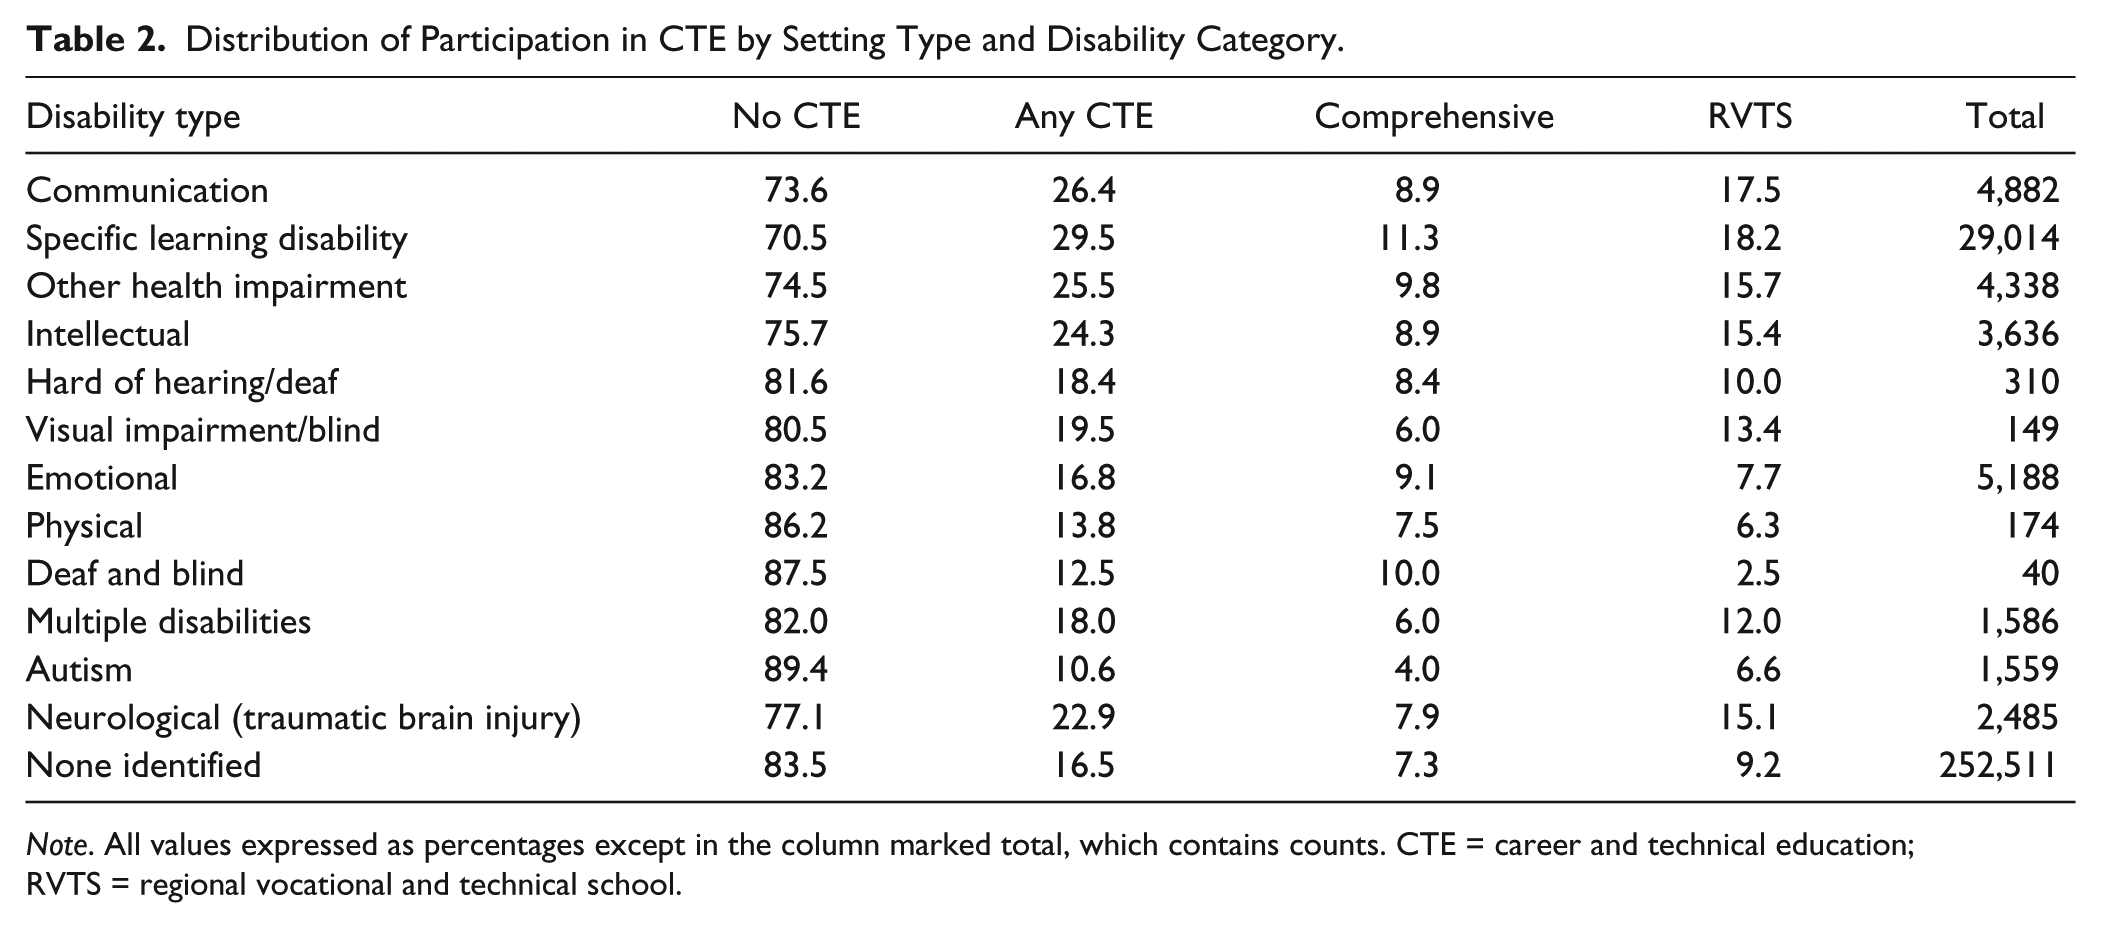
Note. All values expressed as percentages except in the column marked total, which contains counts. CTE = career and technical education; RVTS = regional vocational and technical school.
Measures
The primary outcome of interest is on-time graduation from high school, which is defined in our regression analyses as equal to 1 if a student graduates from high school 4 years after beginning ninth grade for the first time, and to 0 otherwise. Scores on the 10th-grade state mathematics and English exams are used and standardized (M = 0, variance = 1) within the year, as an indicator of overall academic performance. The final outcome is an indicator of whether a student earns an industry-recognized certificate (IRC). These certificates span a wide range of programs but each serves as a potential positive signal to employers regarding specific skills that students possess. They include, for example, Serve-Safe credentials earned in culinary arts, Microsoft Office certificates, and Cisco Systems certificates.
Key question predictors are (a) indicators of participation in CTE and (b) being identified as a student with a disability. CTE participation is defined in several ways. Enrollment in an RVTS is tracked as a binary indicator equal to 1 for students enrolled in those schools and 0 otherwise. The overall indicator of disability status is a binary measure equal to 1 if a student had been identified as a student with a disability when they started high school, and 0 otherwise. In addition to the binary measure of disability identification status, there is also a categorical indicator of disability type. The 13 disability categories used to classify students in Massachusetts differ slightly from those used by federal education officials. Specifically, Massachusetts uses “neurological impairment” rather than “traumatic brain injury,” “health impairment” rather than “other health impairment,” and “physical impairment” rather than “orthopedic impairment.” The percentage of students identified as a student with a disability was higher in Massachusetts than for the rest of the country throughout the study period. It is unclear to what extent these higher rates of special education identification among Massachusetts students are attributable to a higher incidence of disability or the practices of Massachusetts educators.
As in other work using administrative data to examine students with disabilities, our indicator of disability type reflects how the student was classified rather than a definitive diagnosis of the student’s condition. Within academic discourse and communities of practice, there have been disagreements about how best to identify disability (Fuchs, Fuchs, & Speece, 2002; Vaughn & Fuchs, 2003) as well as how identification methods can influence the meaning of related study findings (Francis et al., 2005). Screening and identification procedures for identifying disabilities, although subject to federal and state regulations, may be influenced by regional or local interpretation as well as by an individual family’s preferences (Hehir, Grindal, & Eidelman, 2012; Mercer, Jordan, Allsopp, & Mercer, 1996). With this in mind, we include demographic characteristics and community indicators to try to reduce variation in who is, and is not, identified as eligible for special education as well as the processes through which they were identified.
Ideally, policy makers and educators would like to know whether effects of CTE differ by all 13 federally defined disability categories. Although modeling these more specific effects reduces statistical power, we do fit models separately by disability type. Given limited power, we place less emphasis on interpreting point estimates from these disability-specific models. Nevertheless, they provide useful insights regarding variability in the effects of CTE participation across students with different disabilities.
To control for potential differences in the effects of CTE participation that related to program quality, binary indicators of whether a student participated in CTE at all in a comprehensive school setting as well as whether the program they participated in met state-defined quality targets that exceed federal Perkins’ requirements are also included as control variables. The potential influence of a student’s focus on a program in a particular industry is addressed by including fixed effects of the primary technical cluster that a student participated in after ninth grade. The analytic models that include these fixed effects restrict comparisons to be among students studying the same technical program but in different settings, thereby eliminating the potential bias for some programs to be more related to graduation outcomes.
We use a broad set of covariates to produce more appropriate student-to-student comparisons and improve the precision of estimates. The absence of a true source of random variation in student exposure to CTE led us to control for a host of student demographic and school-related data measures from eighth grade, to reduce selection bias. Models also include indicators of gender, race, and ethnicity as well as eighth-grade measures of attendance, number of suspensions, MCAS mathematics scores, town of residence, free or reduced-price lunch status, and limited English proficient identification as statistical controls and matching variables. We used covariates measured in eighth grade to reduce the possibility that we might otherwise miss students who were reclassified in terms of disability (Wagner, Newman, & Cameto, 2004) or free or reduced-price lunch status.
Analytic Approach
To answer our research questions, we take two complimentary approaches. First, to estimate the association between CTE participation and student outcomes, we used ordinary least squares (OLS) regression with controls for student characteristics and fixed effects for town of residence, technical career cluster, and graduation cohort to account for differences that could be driven by these factors. Fixed effects for disability category were added to restrict comparisons with students with the same type of disability. In this way, we were able to compare students with similar sociodemographic and geographic characteristics and reduce omitted variable bias.
In a second strategy, we used coarsened-exact matching (CEM; Iacus, King, & Porro, 2011) to improve the internal validity of our estimates. The CEM approach is favored because it uses the fewest parametric assumptions in creating matched treatment and control groups, thereby reducing concerns about the dependence of estimates on functional form. We operationalize the CEM approach using Stata’s “cem” command, which was created by the methodologist who pioneered this analytic approach. Although not reported in this article, estimates were generated using multiple matching estimators and were robust to differing approaches. The qualitative conclusions drawn from these two analyses do not differ, suggesting that neither research design is better at reducing selection bias. Using CEM cannot completely expunge the possibility that omitted variables could bias our estimates. However, it is generally accepted that when factors known to be a part of the selection process are observed, the internal validity of matching estimators is improved (Heckman, Ichimura, & Todd, 1997; Stuart, 2010). Access to strong proxies for the variables used to make admissions decisions for the RVTS schools improve our confidence in the internal validity of our estimates. Our statistical model was specified as follows:

where Y is a generic placeholder for the three outcomes, and the subscripts denote student i in school s, and on-time graduation cohort c. In the case of the binary indicator of graduation as the key outcome of interest, we chose to fit a linear probability model so that effects could be interpreted in percentage point terms. Our estimates are not sensitive to applying a logit model as an alternative, and the results of such a specification are available upon request. We employ Huber–White adjusted standard errors, clustered at the school level to account for potential violations of homoscedasticity or independence.
The vector
Results
In Panel A of Table 3, we present our OLS estimates of the effect of CTE participation on all three of our outcomes of interest: graduation, MCAS scores, and IRC attainment. For each outcome, we present two columns of point estimates, in each instance, the odd column is the estimate of being exposed to any CTE in Grade 9 and the even column is the estimate of exposure to RVTS in Grade 9. The first row presents the estimated effects for students without identified disabilities, included only as a point of reference, whereas the second row presents estimates for students with identified disabilities.
Estimates of the Effect of Attending an RVTS.
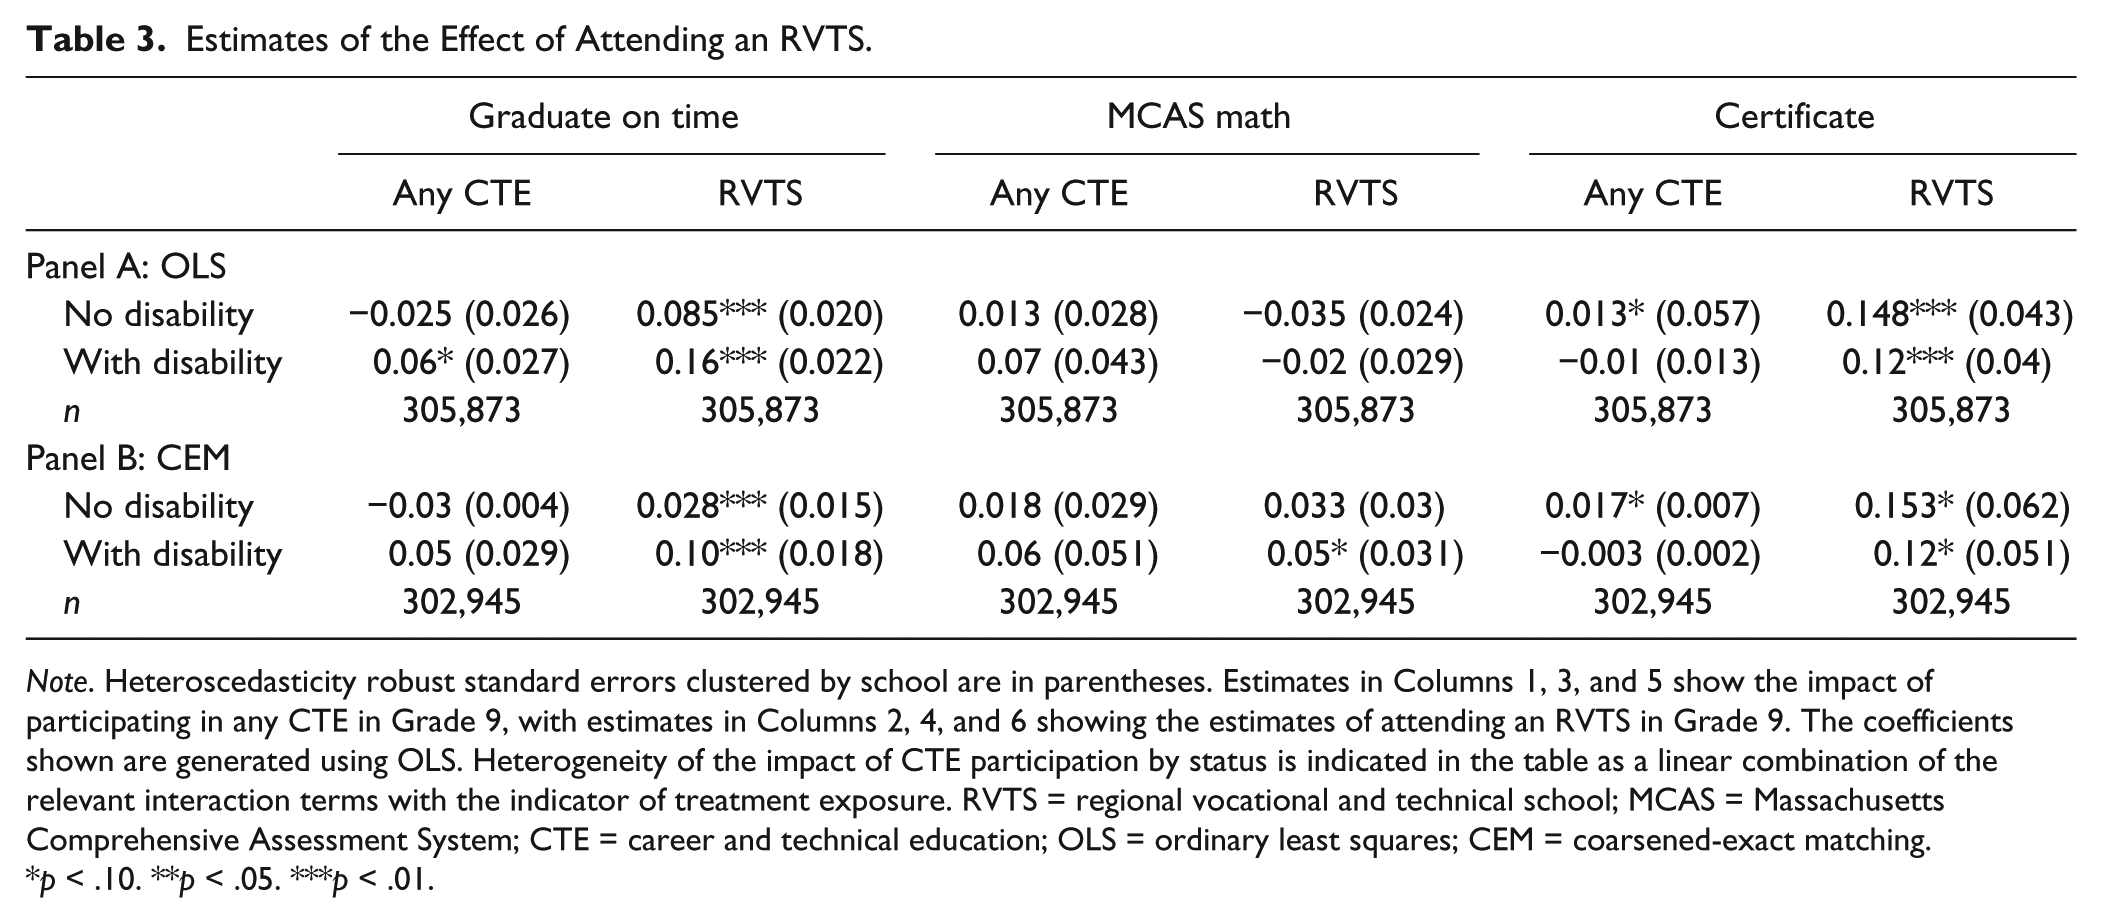
Note. Heteroscedasticity robust standard errors clustered by school are in parentheses. Estimates in Columns 1, 3, and 5 show the impact of participating in any CTE in Grade 9, with estimates in Columns 2, 4, and 6 showing the estimates of attending an RVTS in Grade 9. The coefficients shown are generated using OLS. Heterogeneity of the impact of CTE participation by status is indicated in the table as a linear combination of the relevant interaction terms with the indicator of treatment exposure. RVTS = regional vocational and technical school; MCAS = Massachusetts Comprehensive Assessment System; CTE = career and technical education; OLS = ordinary least squares; CEM = coarsened-exact matching.
p < .10. **p < .05. ***p < .01.
These estimates indicate that CTE participation, taken most broadly as “any CTE,” has no discernible impact on graduation for students without disabilities, but that RVTS participation may offer a benefit. In contrast, the analysis provides clear evidence that CTE participation, in general, and RVTS participation, in particular, have large positive impacts on the graduation probabilities of students with disabilities. There is no clear or significant effect of CTE participation for any students on MCAS scores (as measured using math, a result that also holds for English language arts [ELA]). In addition, there are large and clear positive effects of RVTS participation on earning IRCs, though these effects are absent for students who took CTE in any setting. The largest point estimates are for students without disabilities, but these cannot be distinguished, statistically, from the also large and significant effects for students with disabilities. There is no evidence that participation in any CTE environments has an impact on earning an IRC.
In Panel B of Table 3, we present estimates generated by using the CEM approach to further reduce the threat that differences in outcomes are driven by factors not related to CTE participation. The estimates from this specification are consistent with those in Panel A. Point estimates are slightly smaller in some cases, more precise in most instances, and still of a similar magnitude. In all cases, sample sizes are slightly smaller because the method removes observations for which there is no suitable comparison. In contrast to our OLS approach, CEM estimates suggest that participating in any CTE may positively affect MCAS scores for all students in general, but that they may not extend to all students in the RVTS setting. This difference in estimates may be a function of statistical chance or potential differences in the matching sample. Thus, though we report the CEM estimates, we are not confident that this one difference, which arises from using a second analytic method, actually represents a difference in effects.
Finally, in Table 4, we present estimates of the effects of attending an RVTS on each of the three outcomes, by disability type. As noted in Table 1, some of the disability-specific samples are quite small and, thus, the results are less precise, but the general pattern of results suggests that the effects identified in aggregate hold across disability types. The instances where there is a break in the aggregate pattern are limited to disability categories where fewer than 400 students are observed in the data: sensory impairments (deaf/hard of hearing, blind/visually impaired, deaf and blind) and physical disabilities. Otherwise, the aggregate pattern holds that, on average, the positive effects on high school graduation were about twice as large for students with disabilities compared with students without disabilities (shown in Row 1). In addition, there are no effects on test scores, and the probability of earning an IRC is higher in an RVTS and about the same for students with and without disabilities.
Estimates of the Impact of Attending an RVTS by Disability Type on the Three Main Outcomes of Interest.
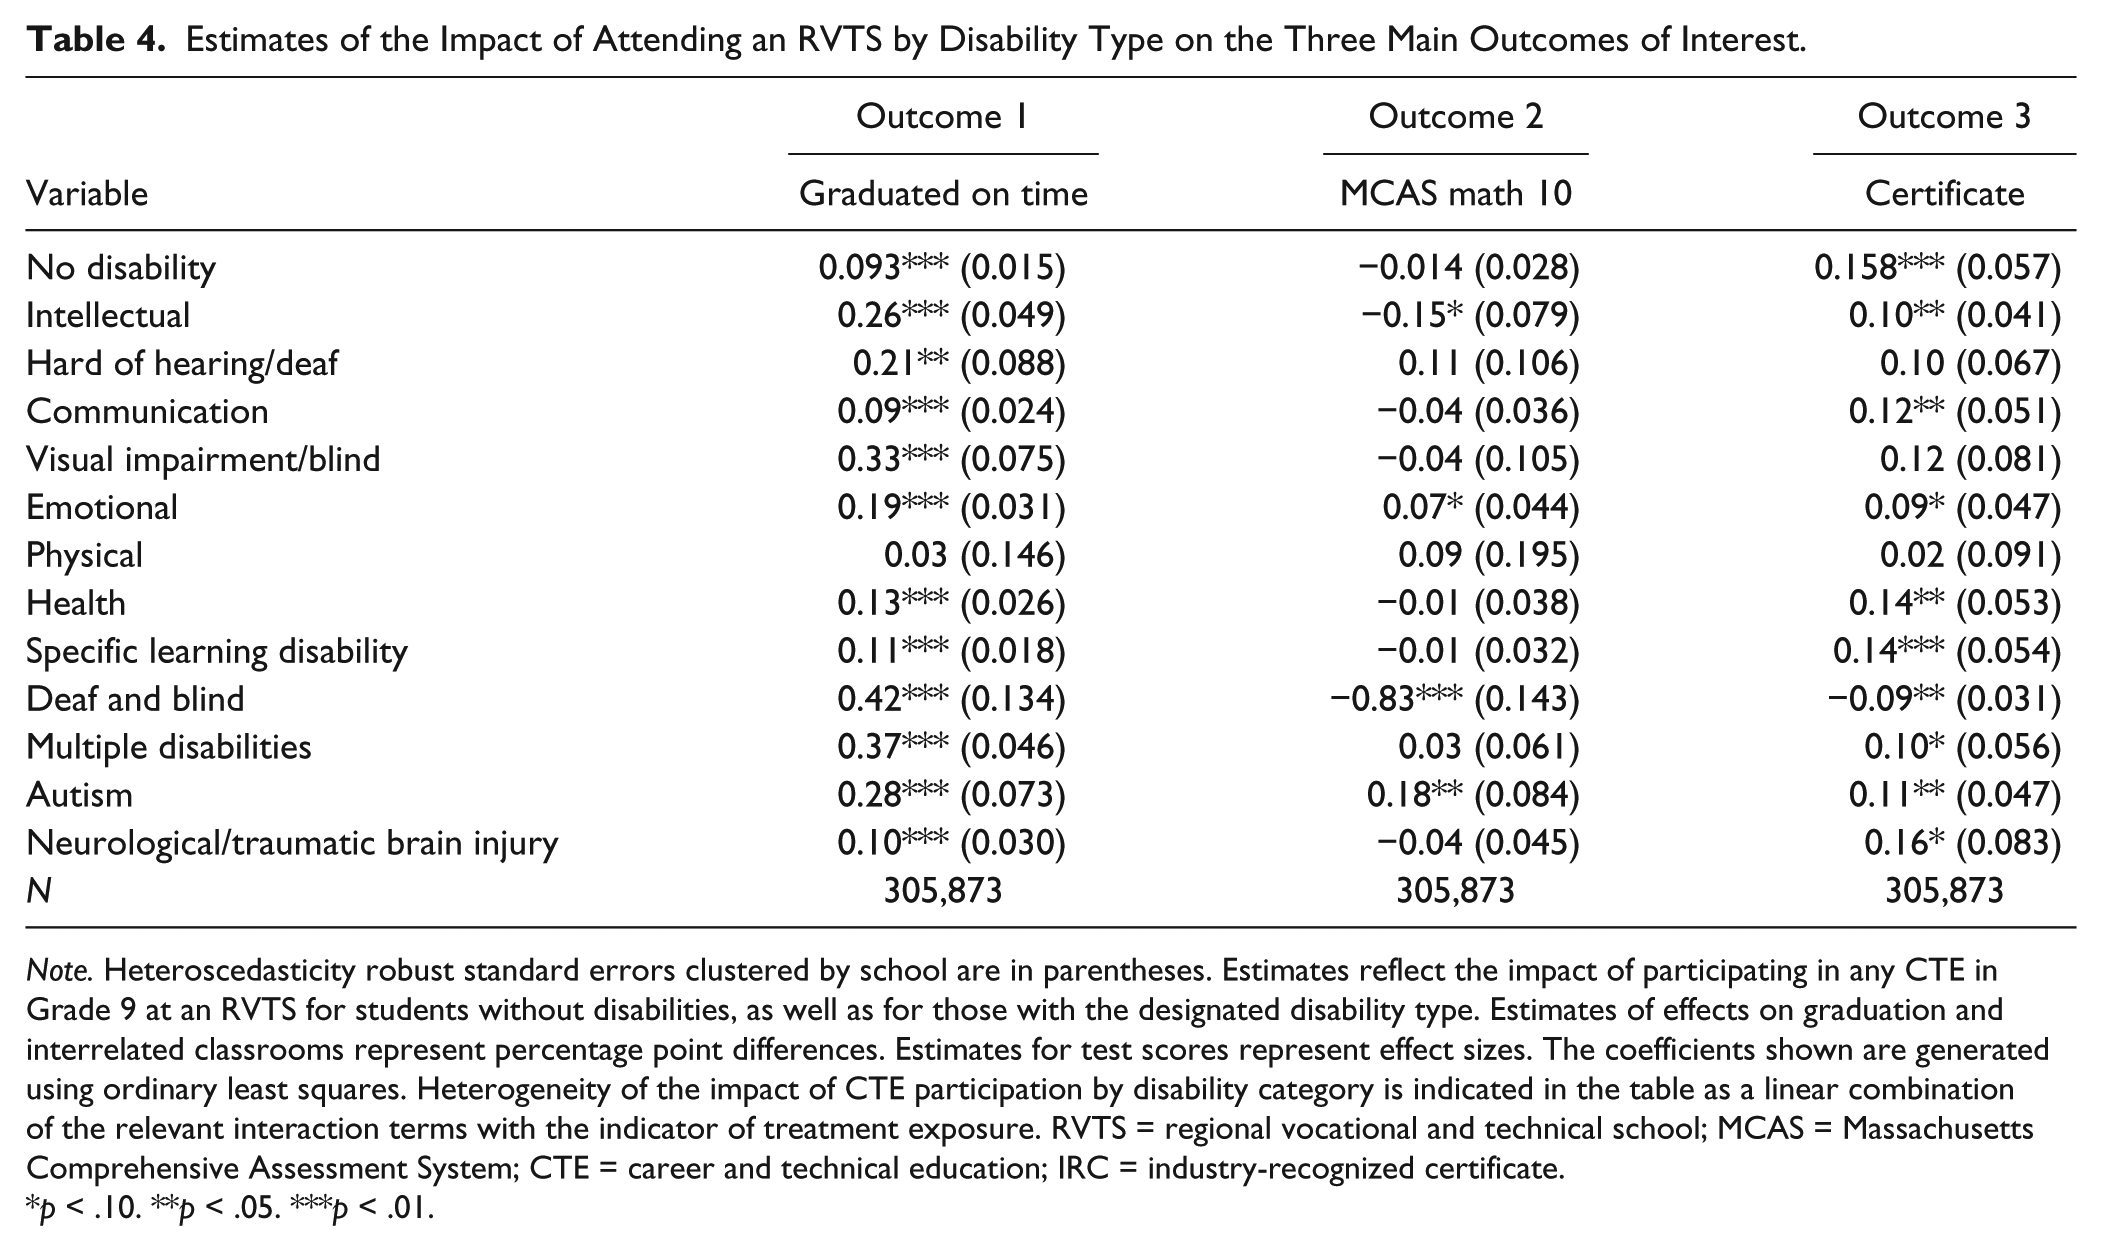
Note. Heteroscedasticity robust standard errors clustered by school are in parentheses. Estimates reflect the impact of participating in any CTE in Grade 9 at an RVTS for students without disabilities, as well as for those with the designated disability type. Estimates of effects on graduation and interrelated classrooms represent percentage point differences. Estimates for test scores represent effect sizes. The coefficients shown are generated using ordinary least squares. Heterogeneity of the impact of CTE participation by disability category is indicated in the table as a linear combination of the relevant interaction terms with the indicator of treatment exposure. RVTS = regional vocational and technical school; MCAS = Massachusetts Comprehensive Assessment System; CTE = career and technical education; IRC = industry-recognized certificate.
p < .10. **p < .05. ***p < .01.
Discussion
The results of this study provide three key takeaways: Students with disabilities who participate in RVTS are more likely to graduate from high school in 4 years than otherwise similar peers in other educational settings; though passing the MCAS exams is required to earn a high-school diploma, participating in CTE is not conclusively associated with higher MCAS scores for any students regardless of disability status; and participating in an RVTS increases the probability that students with disabilities will earn an IRC. This analysis helps illustrate the academic benefits to students participating in CTE programs. That the impacts of CTE on students with disabilities were different by educational setting and disability should prove useful to policy makers and practitioners working to support transitions from high school to college or employment (Rusch, Hughes, Agran, Martin, & Johnson, 2009).
RVTS in Massachusetts appear to be producing better outcomes for students with disabilities as compared with CTE programs in comprehensive high schools, suggesting that access to or experiences in such settings are conducive to completing traditional diploma requirements in this state. Each year, approximately 86% of these students graduate on time with MCAS diplomas compared with only 71% of similar students in non-CTE settings and 65% of those in CTE programs in comprehensive high schools. Indeed, students with disabilities who enroll in RVTS have a significantly higher probability of graduating on time than their counterparts who enroll in traditional high schools. Importantly, these superior outcomes are achieved despite the fact that students in RVTS spend approximately half the amount of time in academic coursework as compared with their peers enrolled in traditional high schools. Nonetheless, they perform at comparable levels on state tests of academic achievement. Furthermore, despite not scoring higher than their peers in other settings, the high graduation rates indicate that students with disabilities in RVTS are still scoring high enough to earn a passing score on the MCAS, which is required to earn an MCAS diploma, and there is not even suggestive evidence that they score any lower on these exams. In contrast, students enrolled in CTE programs embedded in a traditional high school do not get as large a boost in their probability of graduating.
It is not possible with these data to determine, conclusively, why students with disabilities in RVTS have higher probabilities of graduating in 4 years and of earning IRCs than comparable students in traditional public high schools. One potential explanation could be that students who choose to attend an RVTS are simply different from those who choose to remain in their local comprehensive high school. However, the fine-grained data on student background prior to enrolling in high school as well as our multiple analytic approaches suggest that this explanation is not likely.
Success in these RVTS settings, which are outside the residentially assigned schools, does relate to a larger policy discussion of whether and when a more separate placement may better serve the needs of a student with disabilities. Although prior research strongly suggests that, on average, students with disabilities benefit from being educated alongside their peers without disabilities (Blackorby et al., 2007), the case of specialized technical high schools where large numbers of students with disabilities are served, but which are otherwise fully integrated settings, serves as a unique case. Specifically, the RVTS examined in this study educate a larger proportion of students with disabilities than the comprehensive schools that students would otherwise attend. However, in all the school types examined in this study, there are still far more students without disabilities than those with disabilities, and educational environments tend to be fully integrated. That is, both academic and vocational coursework occur as fully included settings, on average. As a result, although the RVTS might be considered a more separate setting for students with disabilities, it would seem that the overall ratio of students without disabilities to those with disabilities, as well as the structure of instructional practice, would tend to limit concerns about RVTS participation, leading to more segregated settings.
In fact, previous work has indicated that school engagement is a key predictor of the likelihood that students with disabilities will graduate from high school (Reschly & Christenson, 2006). Differences in the curriculum and design of instructional delivery in RVTS may enhance student engagement, which is known to be a factor in retaining students and graduating them on time (Finn & Rock, 1997). With regard to students with disabilities specifically, prior research posits that engagement is a central feature of successful learning environments for many diverse learners (Rose & Meyer, 2002). Consistent with this theory, the diversity of learning modalities made available to students in RVTS programs coupled with the complementarity between their academic and technical coursework (not available in comprehensive settings) supports students’ overall engagement in learning. For instance, whereas in RTVS, students take academic and technical classes in alternating weeks with deliberate alignment between the lessons occurring in each setting, at traditional high schools, a student’s CTE courses are embedded in the school day. In these settings, lessons are not coordinated among academic and technical instructors, and only some of the students who elect to take CTE may be in the same academic courses. As a result, traditional comprehensive settings, as a function of structure and mission, may be more prone to creating a disconnect between traditional academic and technical learning.
The RVTS structure also ensures that all students in a given academic course are also CTE participants, which may reduce the potential stigma effects associated with CTE participation (Vlaardingerbroek & El-Masri, 2008). Such stigma has historically been attached to vocational education and may be more pronounced in traditional high schools where only some of the students in a given class participate in CTE. Although this stigma applies to all students, it may be amplified in comprehensive school settings, where students with disabilities who participate in CTE may face stigmatization on the basis of both their disability and their participation in CTE. Students in RVTS may not suffer the effects of within-school stigmatization, and we suggest that the larger share of students with disabilities in these settings may also lessen the stigma sometimes associated with disability. Further exploration of the practices used to engage and educate students with disabilities in RVTS may elucidate curricular and policy changes that could improve the graduation outcomes of CTE participants in traditional schools.
Previous research suggests that students with some disabilities, such as dyslexia, may also excel in areas that rely on “big picture” and creative thinking (Shaywitz, 2003). CTE programs may foster this “big picture” thinking in general, perhaps explaining some of the effects. However, it may also be that the additional time RTVS students spend on their vocational courses, may enhance “big picture” and creative thinking relative to traditional high schools.
Taken together, the elements of the RVTS that differentiate them from traditional high schools with CTE programs embedded as elective courses suggest that the experience of being in a regional technical school is substantially different from being in a traditional comprehensive high school, and may make them attractive to families of students with disabilities. To summarize, in the RVTS, academic and technical courses meet in alternating weeks, lessons are integrated to enhance relevance of sometimes otherwise abstract lessons, the potential for stigma is reduced, mentoring relationships can be established by having the same technical instructors across 3 or 4 years, there is greater choice in the number of CTE programs offered, and class sizes are smaller, on average, making these schools substantially different from comprehensive high schools. In addition, though RVTS are schools of choice, many comprehensive high schools in Massachusetts are regionalized and serve students from multiple towns. As a result, in many cases, taking a bus to an RVTS may not take any longer than taking one to the residentially assigned high school.
Finally, although CTE has taken on increasing prominence in the U.S. education policy context, technical education is often considered as a more central component of education in other nations. Despite this general difference in salience, findings from the U.S. context for students with disabilities in CTE are generally more favorable than what has been found abroad. In general, most international work has been more focused on workforce outcomes, than academic outcomes in secondary school. For instance, a study on inclusion for students with intellectual disabilities in Canada suggested mixed results for students transitioning from secondary education to the workforce (Bennett & Gallagher, 2013). Other evidence from Canadian efforts to promote transition of youth with disabilities into employment in health care revealed similar challenges for students with a broader range of disabilities (Taylor & Servage, 2012). Work from Australia has also focused on transition to the workforce for individuals with disabilities and highlighted more challenges than successes (Winn & Hay, 2009).
Study Limitations
Despite efforts to address potential threats to the validity of the inferences from these results, there are several limitations of the research that must be acknowledged when considering the potential impact or generalizability of the findings. First, relying on administrative data from one state raises concerns that the findings may not generalize to all states, particularly states with substantially different educational structures. Differences regarding systems for identifying students with disabilities and making placement decisions may be especially important. A second limitation stems from the exclusion of the city technical schools. Policy makers and practitioners want to understand how CTE functions in urban settings. Such an investigation is warranted but beyond the scope of the current study.
There are also limitations related to the methods used to identify the effects of CTE participation in high school. To address concerns about potential nonrandom sorting of students into CTE settings, we provided both OLS and matching estimators, where the matching approach reduced modeling assumptions and utilized the criteria known to be used when making decisions about whether to admit students to RVTS schools in Massachusetts. Using the 13 federally defined disability categories as part of this matching approach further improved our ability to rule out differences in who chose to attend RVTS that could be related to their specific disability. Although we are generally confident in our estimation approaches and the inferences we make from our analyses, without microdata on students’ IEPs, it is difficult to know whether and how potential differences in IEPs could mask important differences among students who do, and do not, attend RVTS schools.
Conclusion
Across the United States, students with disabilities have a much higher likelihood of dropping out of school than their peers without disabilities. Furthermore, students with disabilities who drop out are less likely to return to education, and they experience worse adult outcomes such as higher unemployment, more problems with law enforcement, and greater reliance on public assistance (Wagner, 1993; Wagner et al., 2005). The role of RVTS in providing greater numbers of these students with a more effective secondary school education likely has positive implications for both individuals and society.
Although models of CTE delivery in high schools differ substantially across the United States, the increasing efforts of the National Governors Association, the National Association of Career and Technical Education, and a renewed federal focus on college and career readiness are propelling changes to the role and structure of CTE in secondary public education in the United States. These changes provide an opportunity to shape the educational context to maximize the potential benefits for the learning and long-term needs of students with disabilities.
The findings from this study provide two clear implications for research, policy, and educational practice. First, not all CTE settings may provide the same benefits to students. To serve as models for other schools, school districts and state departments of education should explore their own data or form research partnerships to identify whether and where there is evidence of high-performing vocational and technical schools that have been successful in educating diverse populations of students with disabilities. Much can likely be learned from these high-performing schools that could inform efforts at other high schools to improve outcomes for students with disabilities, including changing access to and offering of high demand CTE programs. In particular, professional practices and organizational structures identified as successful could be proliferated via state and district policies and processional development. Future research should also attempt to elucidate the specific pedagogical practices employed in these schools to evaluate how and why they are supportive of the education of students with disabilities.
Second, state departments of education should consider expanding CTE program offerings targeted toward students with disabilities, both to increase capacity, and to continue to shape offerings to high-demand career opportunities. Furthermore, we do not suggest that existing CTE programs be scrapped, but that they may be enhanced by incorporating elements of what appears to work in the Massachusetts regional technical schools (e.g., better integrating academic and technical coursework and enhancing mentorship). Across the country, the number of students in CTE courses has declined substantially over the last three decades (Levesque et al., 2008). What is more, the demographics and employment needs of the country have undoubtedly changed in the decades since their vocational education systems were developed. States should ensure that quality CTE programing is available to all students, particularly students with disabilities.
Footnotes
Declaration of Conflicting Interests
The author(s) declared no potential conflicts of interest with respect to the research, authorship, and/or publication of this article.
Funding
The author(s) received no financial support for the research, authorship, and/or publication of this article.