
Abstract
Web surveys enable efficient data collection, but their usefulness is potentially limited when studying people with disabilities, who often lack Internet access. We test the feasibility of collecting web survey data from a sample of state vocational rehabilitation (VR) applicants, inviting nonrespondents to complete a telephone interview instead. People who lacked Internet access were provided with a mobile device and wireless access and were as likely to complete the web surveys as people who already had Internet access. Respondents who elected to complete the survey online versus by telephone differed in level of education and VR experience. These findings suggest that for disability studies, web surveys are an important supplement to, but not a replacement for, traditional data collection efforts.
Survey research is evolving rapidly in response to the widespread penetration of Internet technology, falling costs of conducting web surveys, and declining response rates from other modes of data collection (Czajka & Beyler, 2016). Although there is a clear trend toward conducting surveys online, the use of web surveys is less common among disability researchers (De Cesarei & Baldaro, 2015), and little is known about the feasibility of collecting online data from people with disabilities. Because federal agencies, policy makers, and researchers rely on cost-effective and high-quality survey data to inform decisions that affect the well-being and productivity of people with disabilities, it is crucial to understand the potential of web-based research for this group. The present study aims to assess the feasibility of collecting web survey data from a particular population of people with disabilities—applicants for state vocational rehabilitation (VR) programs—with an emphasis on response rates and examining differences in participant characteristics of those who complete a web survey or subsequent telephone survey.
Benefits of Web Surveys
Web surveys offer a number of advantages over more traditional modes of survey data collection (i.e., telephone or mail surveys) that make them worth careful consideration as a tool for measuring policy impact and program outcomes. From a logistical perspective, web surveys are fast, offering meaningful feedback within days of fielding (Yun & Trumbo, 2000). For large-scale or frequent data collections, web surveys are also more cost-effective than phone or mail surveys (Greenlaw & Brown-Welty, 2009). The anonymity of web surveys may also lead respondents to respond more truthfully about sensitive topics (Kreuter, Presser, & Tourangeau, 2008). Web surveys have also enabled new methods of measuring thoughts and feelings of survey respondents through unobtrusively recording user response times and eye movement (Simcox & Fiez, 2014; Zhang & Conrad, 2014).
In many cases, web surveys also offer an improved user experience. Web-only surveys can dynamically adjust survey content, skipping over irrelevant questions. They can also display multimedia content, such as pictures and videos to make surveys more engaging, communicate ideas more effectively, or increase accessibility (e.g., by asking questions using American Sign Language; Maiorana-Basas & Pagliaro, 2014). Web surveys can improve data quality by automatically checking the validity of responses to discourage participants from skipping or providing perfunctory answers to questions (de Rada & Domínguez-Álvarez, 2014; Shin, Johnson, & Rao, 2012).
A major disadvantage of web surveys is that they produce lower response rates than traditional modes of data collection (Cook, Heath & Thompson, 2000; Kaplowitz, Hadlock, & Levine, 2004; Lanier, Tanner, Totaro, & Gradnigo, 2013; Shih & Fan, 2008), which can potentially bias survey responses (for a discussion, see Groves, 2006). However, web surveys have a role even for projects that demand high response rates. Web surveys tend to reach a different group of individuals than phone or mail surveys (Olson, Smyth, & Wood, 2012). Thus, surveys that include both web and traditional modes of data collection (referred to as “mixed-mode surveys”; Dillman, Smyth, & Christian, 2014) tend to have higher response rates than traditional data collection methods alone (Converse, Wolfe, Huang, & Oswald, 2008; Dillman et al., 2009; Greenlaw & Brown-Welty, 2009; Israel, 2012).
Internet Access and the Digital Divide
Despite the potential benefits of web-based surveys, they are used relatively infrequently in disability policy research (for exceptions see Gross & Francis, 2015; Hwang, 2005; Moon & Baker, 2012; Roessler, Gitchel, & Bishop, 2013). The slower pace of adoption of web surveys of people with disabilities parallels (and may be caused by) the relatively slower adoption of the Internet by people with disabilities. Although recent years have seen a substantial increase in Internet access in the United States, reaching 87% of homes in 2016 (Rainie, 2016), access among people with disabilities has continued to lag behind that of the population as a whole by around 30% (Dobransky & Hargittai, 2006; Fox, 2011; Rainie, 2016; U.S. Department of Commerce, 2013). Those without Internet at home may have access through public libraries, disability resource centers, or other sources, but reliance on third parties makes access limited, tenuous, and dependent on available transportation.
The lack of Internet access experienced by people with disabilities is often referred to in shorthand as the “digital divide.” The causes of this divide are complex and include both indirect and direct processes. People with disabilities are less likely to have Internet access for reasons that are correlated with, but independent of, disability status. Older people and people with lower levels of education are more likely to be disabled, and these variables independently predict lack of Internet access (Dobransky & Hargittai, 2006; Houtenville, Brucker, & Lauer, 2016). People with disabilities are also likely to have lower incomes (Brucker, Mitra, Chaitoo, & Mauro, 2015; Houtenville et al., 2016) creating financial barriers to Internet access. People with disabilities may also require adaptive equipment, adding to the financial burden (Lenhart et al., 2003). In fact, economic constraints are among the strongest predictors of lack of Internet access for people with disabilities (Dobransky & Hargittai, 2006; Vicente & López, 2010) and a substantial minority of people with disabilities have the capacity to use the Internet, but lack the financial resources to do so (Choi & DiNitto, 2013).
Disability can directly influence whether people go online, a substantial proportion of people with disabilities report that their disability makes Internet use difficult (Lenhart et al., 2003), and evidence of a digital divide persists even when controlling for the previously discussed factors that limit Internet access (Scholz, Yalcin, & Priestley, 2017). This figure includes substantial variation in the type and severity of barriers associated with specific disabilities (Chadwick, Wesson, & Fullwood, 2013; Ennis, Rose, Denis, Pandit, & Wykes, 2012; Johansson, Gulliksen, & Lantz, 2015), and their varying impact on use patterns (Barak & Sadovsky, 2008; Dobransky & Hargittai, 2006; Kelly & Smith, 2008; Thorén, Öberg, Wänström, Andersson, & Lunner, 2013).
Despite these challenges, there are reasons for optimism about the potential of web surveys to collect high-quality data from people with disabilities. The barriers identified above are tractable and can potentially be solved either directly (e.g., by providing training or equipment to people with disabilities) or as a by-product of larger social and consumer forces. Internet access may continue to increase organically as the population is increasingly comprised of digital natives. Newer computers cost less and are more user-friendly, lowering financial barriers and presenting a shallower learning curve for people with intellectual disabilities or limited experience with computers (Wehmeyer, Smith, Palmer, & Davies, 2004). Accessibility features such as voice recognition promise to replace expensive, customized accessibility programs such as JAWS screen reader software (Inan, Namin, Pogrund, & Jones, 2016). For these reasons, there is every reason to anticipate that conducting web surveys of people with disabilities will become easier than it has been in the past.
Online Follow-Up Surveys of VR Applicants
This study examines the feasibility of collecting web survey data from a specific subpopulation of working-age adults with disabilities: applicants for state VR services. State VR programs are the primary providers of rehabilitation and employment services in the United States. All people with work limitations who could potentially attain employment with the support of VR services are eligible to apply, but people with the most significant disabilities are prioritized. State VR counselors assess the approximately 600,000 people who apply each year and deem about 80% of applicants eligible for VR services. Counselors develop an individualized plan of employment with each eligible applicant before they receive services. About one quarter of applicants exit the program before receiving services and about one third exit with employment (for a detailed overview see Mann, Honeycutt, Stegman-Bailey, & O’Neill, 2017).
High program attrition rates suggest that it is important to understand the experiences of both applicants who successfully and unsuccessfully exit VR programs. Some agencies, such as the Pennsylvania Vocational Rehabilitation Agency already collect satisfaction surveys from applicants. Data collected from online surveys could also supplement or support performance measures required under the 2014 Work Innovation and Opportunity Act. For example, while administrative data can often be used to measure wages and the employment industry of jobs attained by VR applicants, they are usually silent on whether attained employment was related to VR-related training or whether a particular job qualifies (or continues to qualify) as competitive integrated employment.
Research Study Overview and Objectives
This study addresses several questions that are of great relevance when considering whether to include a web response option when surveying VR applicants, and more generally, other people with disabilities with similar demographic characteristics. To do so, the study collected two waves of data from VR applicants, each comprised of an online survey and a subsequent phone survey of nonrespondents. A two-wave design was selected to test the feasibility of web-based methods for longitudinal data collection. Longitudinal studies provide a particularly rich source of data about VR experiences, offering high statistical power and the ability to make stronger inferences about change over time than traditional cross-sectional studies.
This study investigates four questions. First, are people with limited Internet access more difficult to contact by telephone? If so, it would suggest that providing them with Internet access might help maintain contact that would otherwise be lost in traditional surveys. This is important because when contact with survey respondents is lost, researchers must reestablish contact through time-consuming and expensive locating or field interviewing efforts. Second, what response and retention rates can be attained through web-based surveys? This is important because programming a web survey may not be worth the effort if response rates are low. Third, and relatedly, does providing Internet access to people who lack it lead them to complete web surveys at a comparable rate than people who already have access? This is important because people who do not have Internet access may not complete a web survey even if access was provided to them if the barrier to access is the severity of their disability, lack of knowledge about how to use computers, or a lack of interest in computers. Finally, do people who complete surveys via the web differ from the sample frame as a whole, or those who complete surveys by telephone in demographic characteristics or in their VR experience? This is important because it is important to understand the potential for using web surveys to introduce bias into survey data.
Method
Participants
We invited VR applicants who previously completed a telephone survey (the Survey on Disability and Employment [SDE]—for details, see Jaszczak, Sevak, & Wright, 2017) to participate in this study. The SDE recruited applicants from Missouri, New Jersey, and Ohio between the ages of 25 years and 60 years. Only those who completed the SDE telephone interview without the assistance of a proxy respondent and indicated their willingness to be recontacted were eligible to participate in the present study.
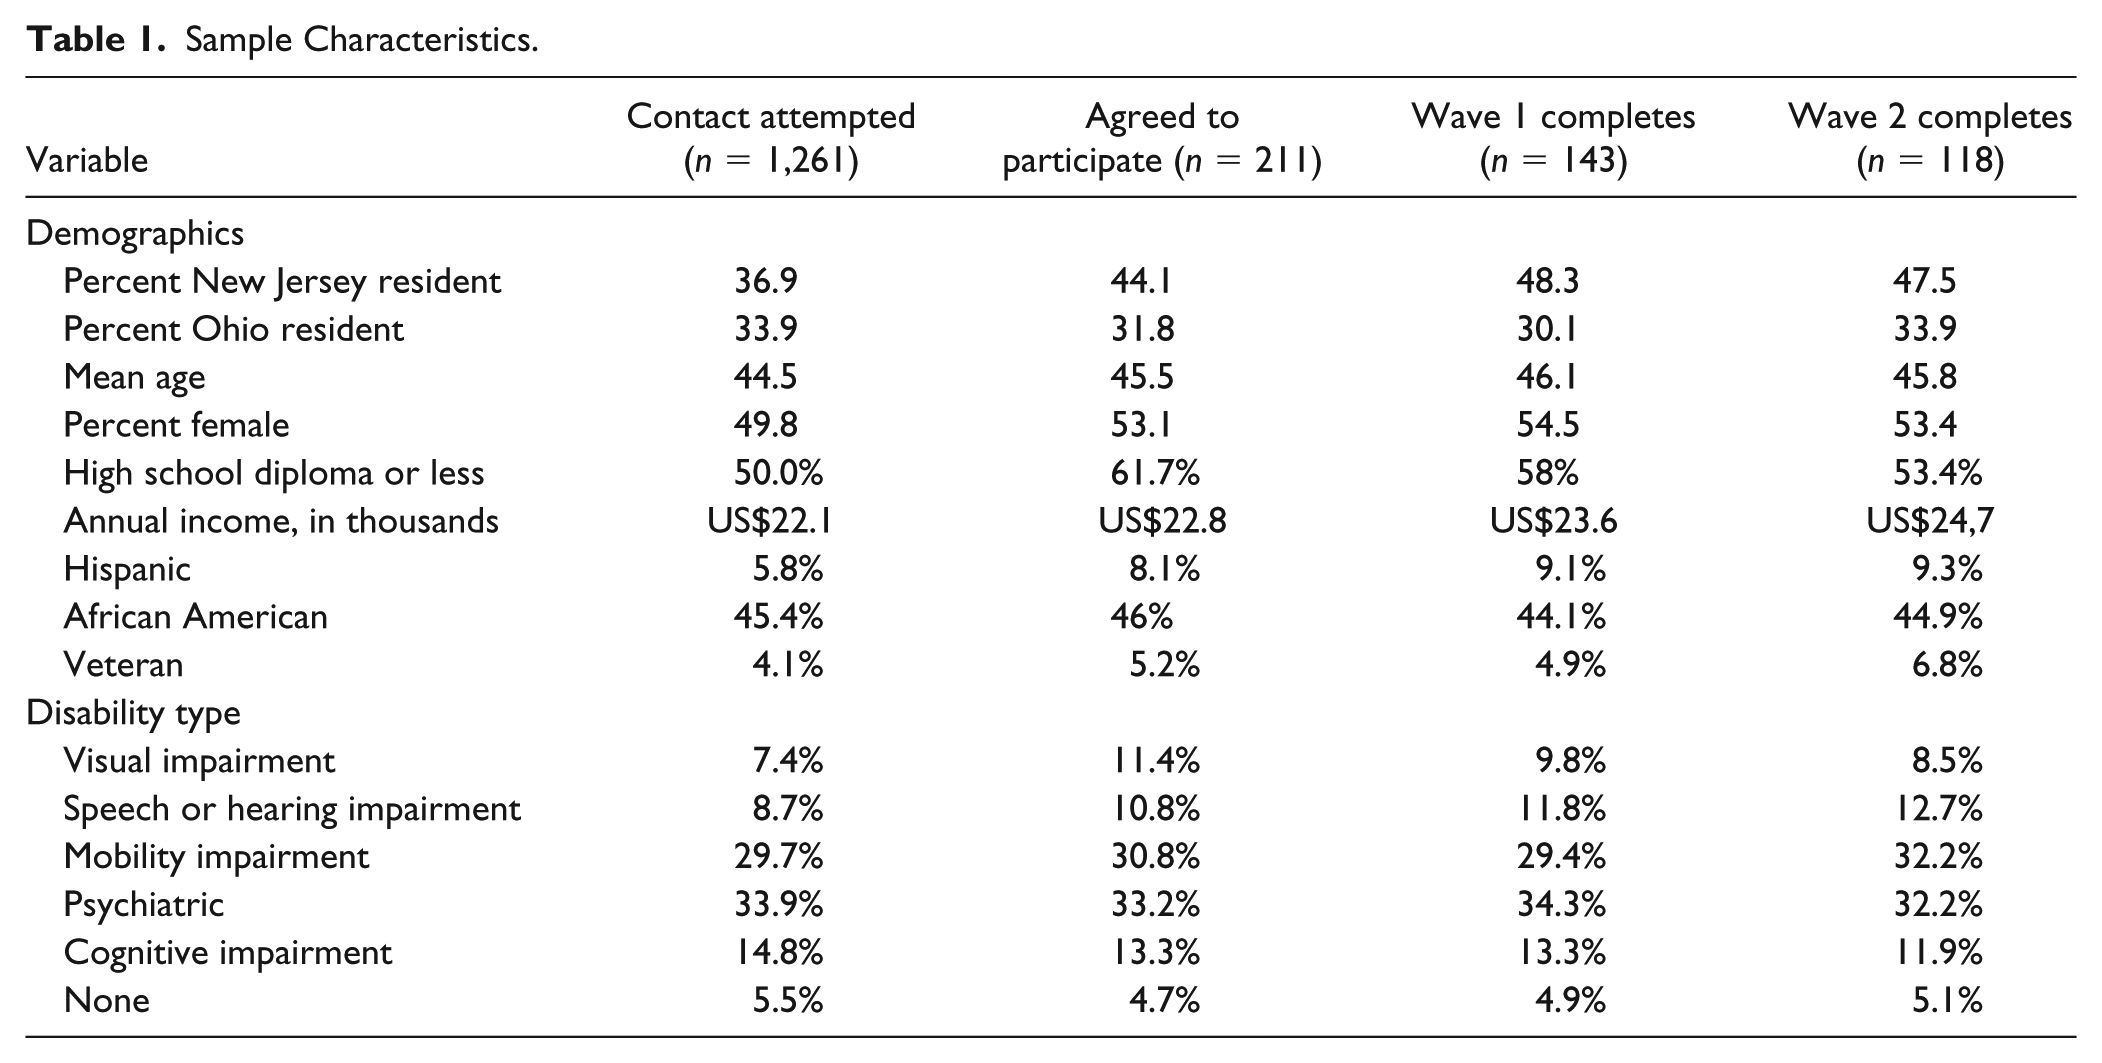
We stratified participants by level of Internet access, assigning them to one of the three groups: those with access at home (the “Access at Home” group; 64.5% of the original sample), those without access at home, but with another way to go online (the “Limited Access” group; 28.4% of the original sample), and those without access (the “No Access” group; 7.1% of the original sample). SDE sample members were recruited until 210 participants agreed to complete the survey, including at least 30 participants in the no access group and approximately equal numbers in the access at home and limited access groups. The demographic characteristics of the contacted and recruited samples are reported in Table 1. In general, those who lacked Internet access were more likely to be men who earned less and were more likely to report visual impairments and less likely to report hearing impairments (for details see the online supplemental materials).
Sample Characteristics.
Procedure
We recruited participants by phone. We attempted to contact potential participants in the access at home and limited access groups once and recontacted them only if they specifically asked us to call back. During the call, interviewers assessed the level of Internet access that participants reported in the SDE and recategorized them based on their response when necessary. 1 Due to the small proportion of participants who truly lacked Internet access, it took more effort to recruit the no access subsample. We called participants in this group up to twice a week and left voice mail messages when possible until we identified 30 people willing to participate. The final sample also included 85 in the limited access group and 95 people in the access at home group.
Providing Internet access
Potential participants in the no access group who agreed to participate in the study are referred to as the Tablet group following recruitment. We provided each participant in the Tablet group with an LG 10.1 Android tablet and an unlimited data plan. The tablet had a 10-in. screen and used the Android 4.2.2 Jelly Bean operating system. Jelly Bean includes several stock accessibility features for individuals who have impaired vision, hearing, or reduced dexterity. Tablets with similar specifications can be obtained for under US$100 retail. Costs can be as much as 50% lower for device purchased through a corporate plan, purchased in bulk, or when built with 8-in. screens and still lower when purchased directly from original equipment manufacturers through a platform such as Alibaba.com. Bulk unlimited data plans cost approximately US$50 per month through major carriers, but may be lower for some types of customers or through smaller wireless providers.
Participants who were provided with tablets were allowed to use them to access the Internet for personal use, but the ability to do so was not contingent on their completing the survey. We provided tablet recipients with a written step-by-step guide for creating an email address and accessing the Internet. We also provided them with a number (800) they could call for technical support in setting up their device and email account.
Survey instrument
The study consisted of two waves of data collection administered 5 months apart. Survey invitations were sent to respondents by email and included a link to a commercial survey platform along with a username and password. The email described the study as a survey of disability and employment and told participants it would take about 20 min to complete. The survey consisted of questions about participants’ VR experiences, current employment status (if employed), and efforts to find employment (if unemployed). Of particular relevance to this study, the surveys asked participants whether they had been contacted about their VR application and, if so, whether it was accepted, whether they had an individualized plan for employment, and whether they were receiving VR services. The surveys then asked participants how satisfied they were with their experience with the agency (1 = very dissatisfied to 5 = very satisfied), the nature of their employment (if currently employed), and barriers to employment (if currently unemployed; see Note 1).
Web survey release and reminder calls
We fielded the first survey 1 month after recruitment; it remained available for about a month. We sent participants three emails announcing the survey. We called participants twice per week through the fielding period to remind them to complete the survey, as is common practice for list-based web surveys. Participant requests to complete the survey by phone were declined by call-center staff during the web-fielding period and participants were not told that they could complete the survey by phone later (see Note 1).
To identify participants willing and able to complete a phone survey, or unwilling or unable to complete a web survey, we attempted to interview participants by telephone if they had not completed the web survey by the end of the web-fielding period. We attempted to contact each respondent by phone up to 6 times. The survey procedures were identical for Wave 2. In between the two waves of data collection, we emailed 3 times and asked participants to update their contact information if it had changed.
Results
Are People With Limited Internet Access More Difficult to Contact by Telephone?
Recruiters had to call potential members of the Tablet group more often than other respondents because the population size was smaller. Enrollment rates after one contact attempt (see Table 2) provide a fair comparison of potential differences in the ease of getting in touch with members of different groups. Whether respondents had a working phone number was regressed on level of Internet access using categorical regression (which assumes that level of Internet access is ordinal; Van der Kooij & Meulman, 2004). Less reliable Internet access predicted unstable telephone access: The proportion of respondents with disconnected or suspended telephone numbers increased from 14.5% in the access at home condition to 18.9% in the limited access condition and to 24.3% in the no access group; B = .065, SE = .028, F(2, 1258) = 5.36, p = .005.
Recruitment Outcomes by Level of Internet Access.
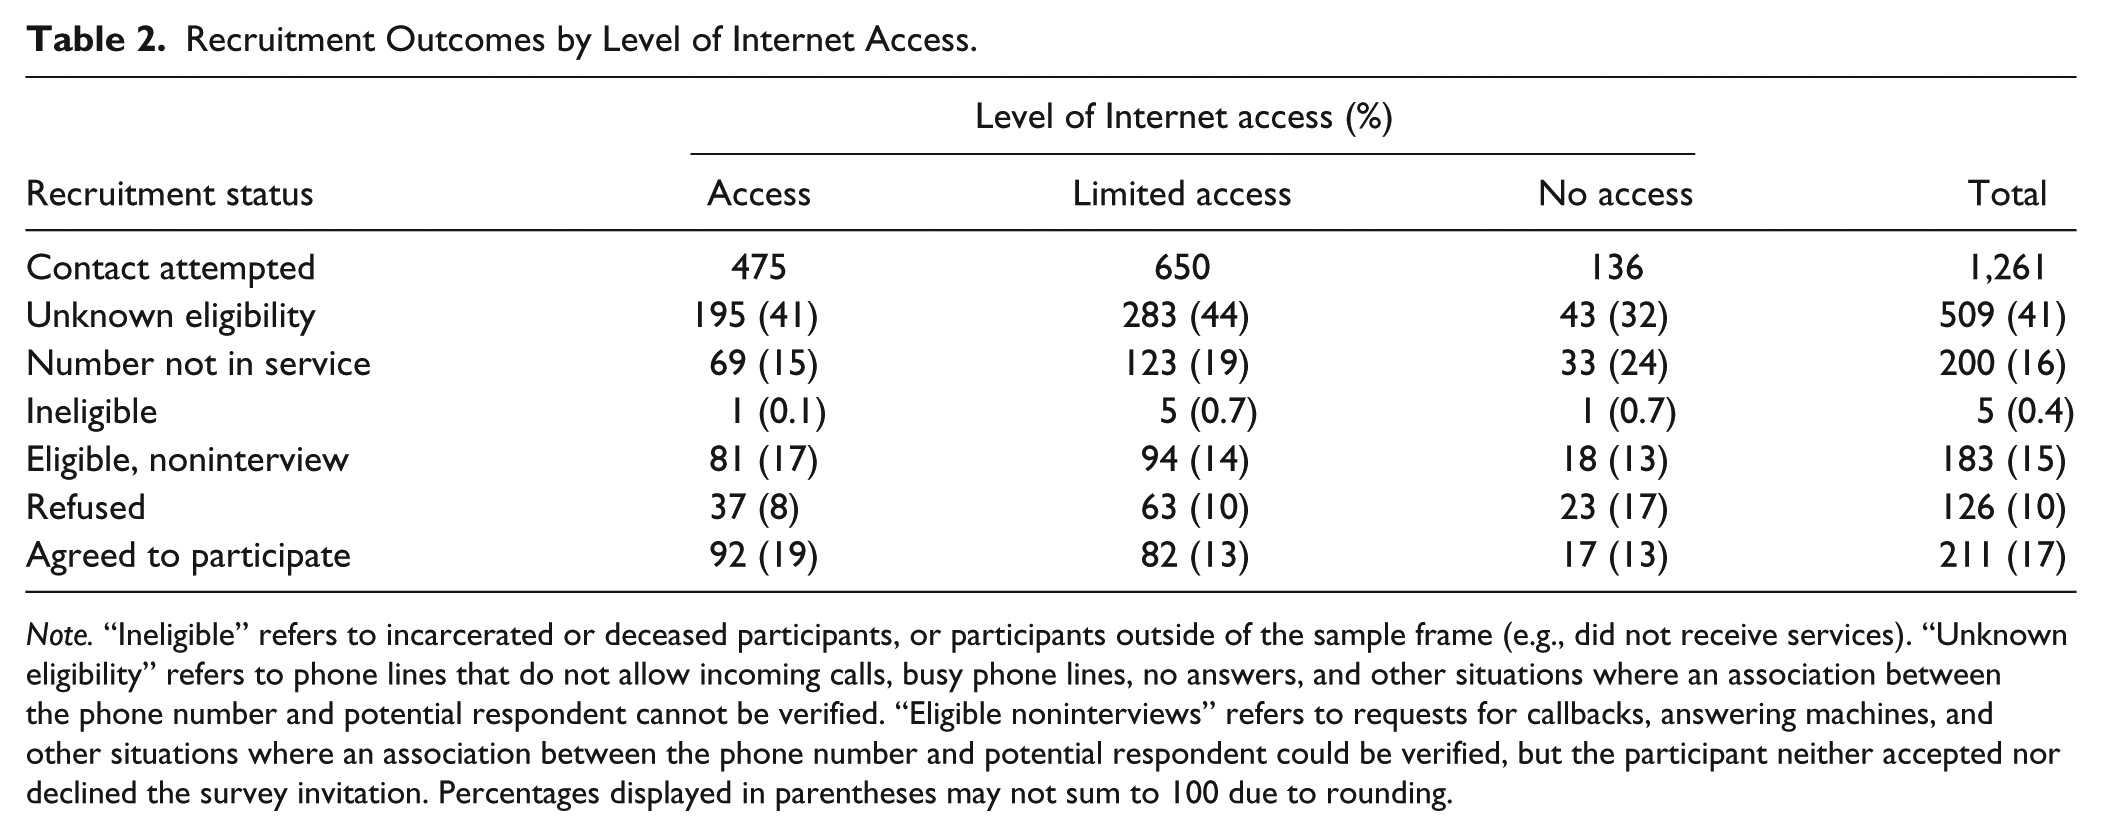
Note. “Ineligible” refers to incarcerated or deceased participants, or participants outside of the sample frame (e.g., did not receive services). “Unknown eligibility” refers to phone lines that do not allow incoming calls, busy phone lines, no answers, and other situations where an association between the phone number and potential respondent cannot be verified. “Eligible noninterviews” refers to requests for callbacks, answering machines, and other situations where an association between the phone number and potential respondent could be verified, but the participant neither accepted nor declined the survey invitation. Percentages displayed in parentheses may not sum to 100 due to rounding.
A similar pattern of disconnected numbers emerged during data collection. For this analysis, generalized estimating equations were used. Generalized estimating equations are an extension of the generalized linear model that can examine categorical outcome variables in nonindependent data (Hardin & Hilbe, 2002). This allows disconnected numbers across both waves of data collection to be analyzed simultaneously. Generalized estimating equations do not require the researcher to assign ordinal values to categories. This is important because it is unclear how to rank the ease with which the Tablet group could be contacted relative to the limited access group. The proportion of respondents who completed the web survey was examined, with group (access at home, limited access condition, or Tablet), survey wave, and their interaction as predictor variables. During the Wave 1 and Wave 2 data collections, people with limited Internet access were more likely to have disconnected telephones than the access at home group, OR = 3.54, 95% confidence interval (CI) = [1.22, 10.32], Wald χ2 = 5.41, p = .02. The Tablet group fell in between and did not differ from the limited access group or the access at home group, Wald χ2s < 1. None of the other effects in this model were significant.
What response and retention rates are attainable through web-based surveys?
In Wave 1, 43% completed the survey online and 25% by phone, for a total completion rate of 68%. In Wave 2, 32% of participants completed the survey by web and 24% by phone, for a total completion rate of 56% (see Table 3).
Outcomes by Level of Internet Access.

Note. “Has access” refers to participants with Internet at home, “Limited access” refers to participants who can use the Internet at another location, “Tablet” refers to participants who were provided tablets for this study. “Ineligible” refers to incarcerated or deceased participants, or participants outside of the sample frame (e.g., did not receive services). “Eligible noninterviews” refers to requests for callbacks and answering machines that confirmed participant identity.
Does providing Internet access to people who lack it lead them to complete web surveys?
Generalized estimating equations were also used to estimate survey completion rates. Participants with limited Internet access were less likely to complete the survey online (21.8%) than those who had access at home (50%), OR = 0.28, 95% CI = [0.14, 0.56], Wald χ2(1) = 12.92, p < .001, or those who were provided with tablets (40.3%), OR = 0.39, 95% CI = [0.16,0.98], Wald χ2(1) = 4.01, p = .046, respectively. Response rates among people provided with tablets did not differ significantly from those who already had Internet at home, Wald χ2(1) < 1. There was also a main effect of wave, as overall response rates declined from 43% at Wave 1 to 32% at Wave 2, OR = 0.62, 95% CI = [0.43, 0.87], Wald χ2(1) = 7.48, p = .006. There was no interaction between group and wave, Wald χ2(1) < 1.
The proportion of telephoned individuals who were successfully contacted was similar across all groups and in both waves of data collection (see Table 3). Consequently, participants with limited Internet remained less likely to complete the survey online (51%) than those who had access at home (71%), OR = 0.43, 95% CI = [0.24, 0.79], Wald χ2(1) = 7.56, p = .006. The response rate for participants in the Tablet group was in between, and did not significantly differ from, the group with limited Internet access, OR = 0.58, 95% CI = [0.25, 1.34], Wald χ2(1) = 1.61, p = .21, or the group with Internet access at home, OR = 1.36, 95% CI = [0.59, 3.11], Wald χ2 < 1. Again there was a main effect of wave, as overall response rates declined from 69% at Wave 1 to 56% at Wave 2, OR = 0.62, 95% CI = [0.39, 0.99], Wald χ2(1) = 3.95, p = .047 and no interaction between group and wave, Wald χ2 < 1.
In sum, across both waves of data collection, participants who already had access to the Internet in their home, or who initially lacked Internet access, but had tablets provided to them for the duration of the study had higher online response rates than those who had limited Internet access. Adding a phone response option reduced these differences somewhat, and the difference between the tablet group and the limited access group was no longer statistically significant. More generally, people with limited Internet access were more difficult to find, as they were also more likely to have disconnected telephones.
Do VR Applicants Whom Complete Surveys via the Web Differ in Demographic Characteristics or in Their VR Experience?
It is important to evaluate whether respondent characteristics vary as a function of either agreeing to participate in the survey or by the mode in which they completed the survey. The answer to this question informs the potential for bias in a web-only survey as opposed to a mixed-mode survey that retained a telephone option.
Demographic differences
Demographic characteristics of those who agreed to participate in the study were broadly similar to the population as a whole (see Table 1), except that participants who agreed to complete the survey were older (M = 45.39) than those who did not (M = 43.54), t(2799) = 2.57, p = .01.
Participants who completed the survey online and by phone were similar in demographic characteristics (see Table 4) except that participants who completed online were more likely to have completed at least some college, χ2(1) = 5.61, p = .018. More Hispanic participants appeared to complete by web than by telephone, but the difference was not statistically significant. People with mobility, speech, or hearing impairment appeared to be more likely to complete the web survey, whereas people with vision impairment appeared to be more likely to complete the telephone survey, but these differences were also not statistically significant.
Sample Characteristics of Participants by Wave and Mode of Completion.
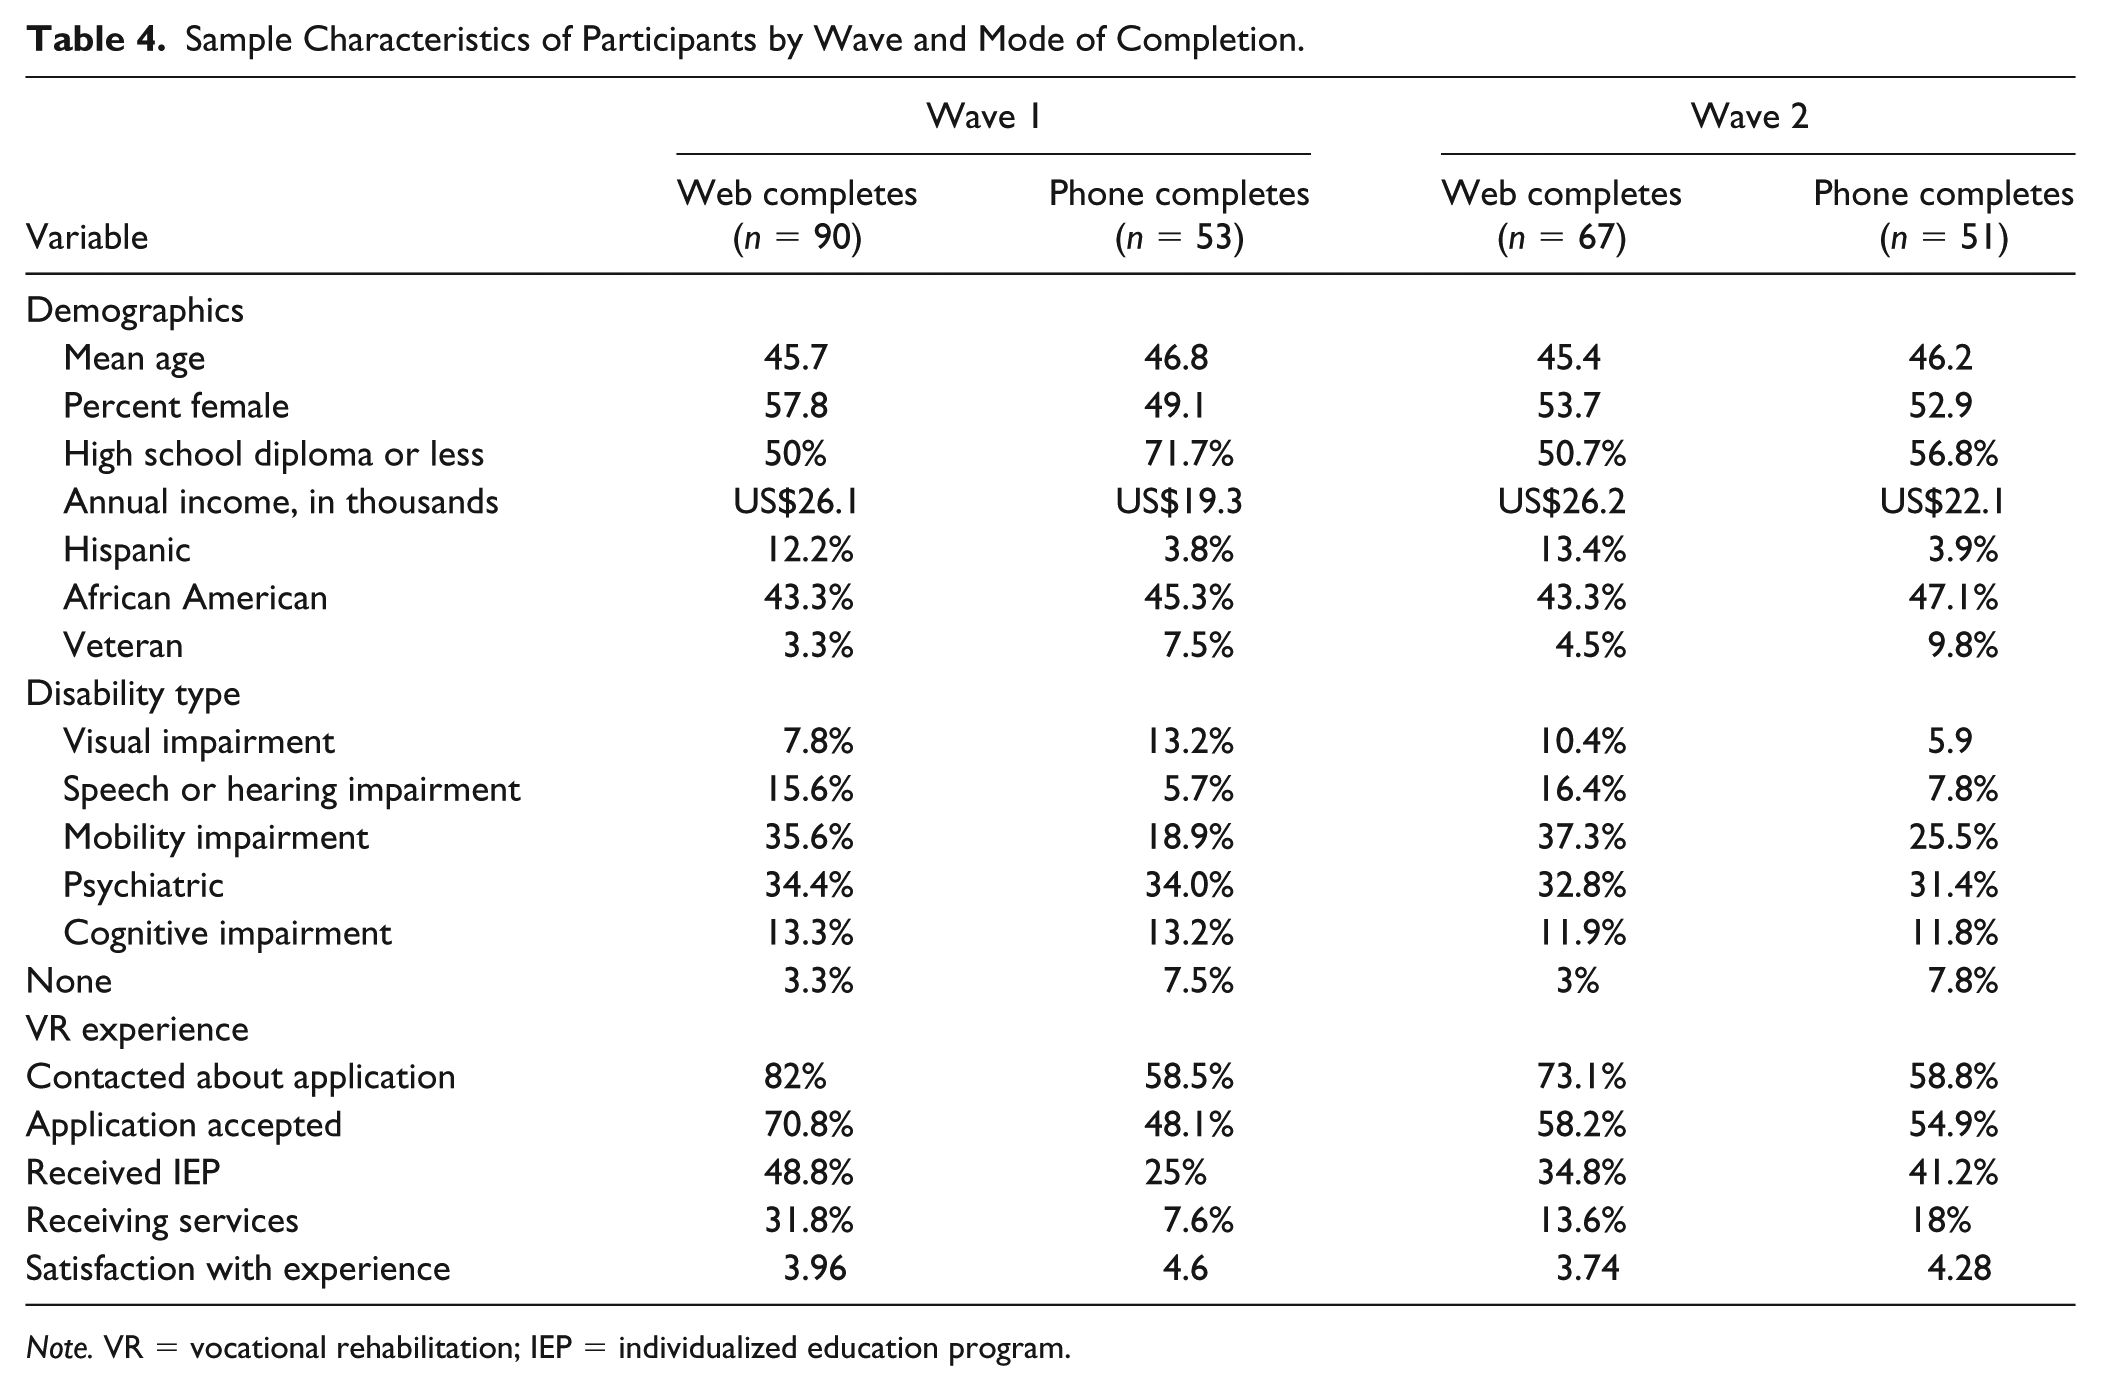
Note. VR = vocational rehabilitation; IEP = individualized education program.
Differences in VR application experience
Participants who completed the survey online reported a different VR application experience than those who completed the survey by telephone (see Table 4). Participants who completed the survey online were more likely to report having been contacted about their VR application, OR = 3.12, 95% CI = [1.47, 6.45], Wald χ2(1) = 9.64, p = .002. Of those who were contacted about their application, those who completed the survey online also reported that they were less satisfied with their experience with VR (M = 3.95, SD = 1.27) than those who completed via telephone (M = 4.60, SD = 0.93), B = −.55, 95% CI = [–0.94, –0.17], Wald χ2(1) = 5.82, p = .016.
Discussion
The present study investigated the feasibility of using the Internet to collect data from applicants for state VR services, either alone or in conjunction with telephone follow-up of nonrespondents. The observed completion rates are comparable with the 35% to 40% response rate typically observed in list-recruited web studies (Cook et al., 2000; Kaplowitz et al., 2004; Lanier et al., 2013; Shih & Fan, 2008) and would almost certainly be higher if the study did not deliberately over sample people with limited Internet access. The study demonstrates that it is more difficult to maintain contact by telephone with study participants who also have limited Internet access, suggesting that—whether through providing Internet equipment or through some other means—getting these individuals to complete surveys requires additional effort on the part of researchers.
The study also demonstrates that providing Internet access to VR applicants who lack it raised the survey response rate above that of the limited Internet access group and to a level that was not different from those who had their own Internet access. These differences persisted through telephone fielding. This finding is consistent with existing research that demonstrates that multimode surveys typically produce recruitment rates that exceed single mode surveys (Converse et al., 2008; Dillman et al., 2009; Greenlaw & Brown-Welty, 2009; Israel, 2012).
Finally, this study does not find evidence that adding a web component to a traditional telephone survey harms data quality. The overall sample obtained from this kind of data collection closely resembled the demographic characteristics of the baseline sample of VR applicants who agreed to participate in the SDE—a traditional, high-quality phone survey, suggesting that adding a web component to a traditional survey will not hurt. At the same time, this study also provides a valuable reminder that the findings of web-only surveys may not generalize to the population as a whole (see also Blom et al., 2017), particularly if no steps are taken to ensure access to all potential participants. Web respondents differed from telephone respondents in important ways, particularly surrounding their VR experience.
Policy Implications
Accurately identifying the needs and experiences of VR applicants and participants is important to monitoring and improving program effectiveness. Resources available for data collection are limited and survey design choices often require trade-offs between response rates, sample representativeness, and cost. These choices are not neutral in terms of data quality or the resulting truth of conclusions drawn from data.
Web surveys promise to lower data collection costs by replacing or reducing the need for interviewers in telephone studies or data entry clerks in mail studies. However, any survey fielded on the web requires a strategy to include those without Internet access to ensure that findings reflect the experience of the population served. Providing equipment to access the Internet is one way of ensuring people with limited or no Internet access can participate in a study. This study does not report a detailed cost–benefit analysis because the costs of fielding telephone surveys and providing Internet equipment are likely to vary widely across organizations, regions, and time. However, it is critical to note that respondents with limited Internet access are also more difficult to contact via telephone, suggesting that such an analysis is more complex than comparing the cost per telephone complete to the cost of providing equipment.
Although there seems to be little cost to using web surveys to supplement traditional surveys of VR applicants, using web surveys by themselves may be problematic. Web respondents were more likely to be more educated than phone respondents, suggesting that web-only surveys may exclude individuals with the greatest VR needs. Of more direct relevance to VR research, in Wave 1, web respondents not only were more likely to have been contacted about their VR application and to be receiving services, but also reported that they were less satisfied with their VR experience. One clear implication of this is that a web-only survey may paint a very different picture of the success of a VR agency than a mixed-mode survey.
The findings of this study also bear on the more general question of how to reduce disparities in levels of Internet access among people with and without disabilities. Providing Internet access to people who lacked it increased Internet completions from presumably 0% to a level that did not differ from those who already had Internet access at home. Without downplaying the challenges to gaining Internet access that disabilities directly cause, this finding underscores the importance of financial barriers faced by people with disabilities and suggests that increasing the availability of Internet equipment alone would go a long way toward closing the digital divide.
Limitations and Future Directions
The present study has several limitations worth noting. First, this sample focused on applicants to VR programs. This group differs from the population of people with disabilities in notable ways. In particular, VR applicants are people seeking employment, meaning that they exclude those who choose not to participate in the labor force (particularly the old, the young, and those who believe that they cannot work) as well as people with disabilities who do not require VR to secure employment. Other samples may vary in their willingness to complete online surveys. The success of fielding web surveys is also likely to depend on the quality of Internet connections available to respondents: all else being equal, it is reasonable to assume that web surveys may be less successful among respondents in remote rural areas.
This study also examines a relatively small sample of respondents. Small samples can produce false-positive findings and can fail to detect true positive relationships between variables. There are several suggestive patterns in responses that would benefit from reexamination in a larger sample. In particular, it seems to be important to estimate more precisely how type of disability influences completion rates for web and phone surveys. Mode preferences for visually impaired, speech impaired, or deaf and hard of hearing respondents, though expected, and substantial in Wave 1, were not statistically significant overall. At the same time, people with limited mobility exhibited a surprisingly large preference for the web survey, and people with cognitive impairments exhibited almost none. Future research with a larger sample could replicate and more precisely estimate these differences, while perhaps also considering how level of impairment affected response tendencies.
A final limitation—or more accurately a caveat—of this study is that web and phone interviews were fielded concurrently. This is generally regarded as a best practice in mixed-mode data collection (Dillman et al., 2014), but it also confounds survey interview mode with response order. The findings of the present study bear on the characteristics of respondents who might be expected to complete each stage of data collection, but is only suggestive of differences between web-only and telephone-only surveys. In particular, the finding that web respondents reported qualitatively different VR services merits further research. It is possible that web respondents reported less satisfaction with their VR experience because less satisfied applicants are more motivated to complete surveys about their experience and that more satisfied applicants require either the additional pressure to respond that is inherent in telephone requests. Alternatively, applicants who are unsatisfied with their VR experience may respond to survey request sooner, leading early survey completers to be less happy than late completers, regardless of mode. Finally, it is possible that applicants will censor their responses when speaking with an interviewer, artificially inflating satisfaction scores. Future research could directly test these explanations against each other by collecting phone-only and web-only data concurrently from different groups of respondents.
Supplemental Material
Disability_Questionnaire – Supplemental material for Surveying Vocational Rehabilitation Applicants Online: A Feasibility Study
Supplemental material, Disability_Questionnaire for Surveying Vocational Rehabilitation Applicants Online: A Feasibility Study by Jesse J. Chandler in Journal of Disability Policy Studies
Supplemental Material
Phone_recruitment_script – Supplemental material for Surveying Vocational Rehabilitation Applicants Online: A Feasibility Study
Supplemental material, Phone_recruitment_script for Surveying Vocational Rehabilitation Applicants Online: A Feasibility Study by Jesse J. Chandler in Journal of Disability Policy Studies
Supplemental Material
Reminder_call_script – Supplemental material for Surveying Vocational Rehabilitation Applicants Online: A Feasibility Study
Supplemental material, Reminder_call_script for Surveying Vocational Rehabilitation Applicants Online: A Feasibility Study by Jesse J. Chandler in Journal of Disability Policy Studies
Supplemental Material
Reminder_email – Supplemental material for Surveying Vocational Rehabilitation Applicants Online: A Feasibility Study
Supplemental material, Reminder_email for Surveying Vocational Rehabilitation Applicants Online: A Feasibility Study by Jesse J. Chandler in Journal of Disability Policy Studies
Supplemental Material
Table_S1 – Supplemental material for Surveying Vocational Rehabilitation Applicants Online: A Feasibility Study
Supplemental material, Table_S1 for Surveying Vocational Rehabilitation Applicants Online: A Feasibility Study by Jesse J. Chandler in Journal of Disability Policy Studies
Footnotes
Acknowledgements
The author appreciates the assistance of David Stapleton and Debra Wright in designing the study; Charles Bush, Alica Gao, and Anna Situ in implementing this research study; and David Mann and David Stapleton for providing helpful comments on an earlier draft of this article.
Declaration of Conflicting Interests
The author(s) declared no potential conflicts of interest with respect to the research, authorship, and/or publication of this article.
Funding
The author(s) disclosed receipt of the following financial support for the research, authorship, and/or publication of this article: Funding for this study was provided by the Research and Training Center on Disability Statistics and Demographics at the University of New Hampshire, which is funded by the National Institute for Disability, Independent Living, and Rehabilitation Research (NIDILRR) in the Administration for Community Living at the U.S. Department of Health and Human Services (DHHS Grant Number: 90RT5022-02-00). The contents do not necessarily represent the policy of DHHS, and do not assume endorsement by the federal government (Edgar, 75.620 [b]).
Notes
Supplemental Material
Supplemental material for this article is available online.
References
Supplementary Material
Please find the following supplemental material available below.
For Open Access articles published under a Creative Commons License, all supplemental material carries the same license as the article it is associated with.
For non-Open Access articles published, all supplemental material carries a non-exclusive license, and permission requests for re-use of supplemental material or any part of supplemental material shall be sent directly to the copyright owner as specified in the copyright notice associated with the article.