
Abstract
Objective:
This study examined the factor structure and psychometric properties of the Urban Hassles Index (UHI).
Method:
Exploratory factor analyses (EFAs) were conducted via principal axis factoring extraction method. Confirmatory factor analyses were conducted to evaluate the fit of the EFA-derived model using the weighted least squares estimator with mean and variance adjustments. Composite/scale scores were created for the extracted factors, with a total score derived by summing the scale scores. Criterion-related validity was examined using hierarchical regressions.
Results:
The UHI had four first-order factors (environmental nuisance, safety concerns, drug, and coercion) accounting for 43% of the total variance. Covariance among the first-order factors was explained by a higher second-order factor. Moderate factor correlations and evidence for the criterion-related validity of the subscales and total score indicated multidimensionality of the UHI.
Conclusions:
The shortened 16-item UHI is a brief assessment tool evaluating stressors unique to urban adolescents, providing specific intervention targets.
Urban adolescents encounter an array of social and environmental stressors and challenges that are chronic in nature such as having vandalized and run-down buildings in their neighborhood, substandard housing and quality education, public drunkenness, the presence of homeless people, community violence, drug trafficking, and other activities that may generate a sense of insecurity and fear (Allison et al., 1999; Chandra & Batada, 2006; Deardorff, Gonzales, & Sandler, 2003; Marco, Gracia, Tomás, & López-Quílez, 2015). A small qualitative study of urban, African American adolescents in ninth grade (Chandra & Batada, 2006) reported litter on the streets, unsolicited interactions with drug users or dealers, and harassment from peers and older teens to engage in drug or alcohol use or sexual behavior as stressors related to their neighborhoods. Another qualitative study found that safety was the most pronounced concern in early adolescents in New York City (Schaefer-McDaniel, 2007). Given the importance of context in understanding the psychosocial development of children and adolescents (Allison et al., 1999; Bronfenbrenner, 1979; McBride Murry, Berkel, Gaylord-Harden, Copeland-Linder, & Nation, 2011) and increased mobility and autonomy in adolescence, it is critical to assess and understand chronic stressors originating from the community context and how such stressors may affect adolescents.
The Urban Hassles Index (UHI; Bennett & Miller, 2006; Miller & Townsend, 2005) is a 31-item measure of social and environmental stressors specific to adolescents living in urban environments. The UHI was initially developed as a 12-item unidimensional measure (Miller, Webster, & MacIntosh, 2002) and subsequently expanded to 32-items based on a literature review of the stressors germane to the urban, inner-city environment and discussions with professionals working with adolescents in urban settings (Bennett & Miller, 2006; Miller & Townsend, 2005). The response format of the expanded UHI was increased from three (none, a little, and a lot) to four (never, sometimes, often, and very often), and the reference period of exposure to urban hassles was specified to over the past 12 weeks/3 months. Recently, the UHI dropped 1 item, resulting in 31 items (Miller & Bennett, 2015).
The UHI aimed to address two primary limitations of previous measures of adolescent stress (Miller et al., 2002). The UHI taps into stressors unique to urban youth to counter the bias present in the majority of instruments developed based on the experience of nonurban, predominantly White, middle-class youth (Miller & Townsend, 2005). Also, those instruments primarily focused on episodic life events (e.g., death of close family member/friends, parents’ divorce, and change of school) rather than daily hassles that occur repeatedly and constitute chronic strains of everyday life, neglecting the cumulative impact of daily hassles. Substantial studies demonstrated that assessing major life events is not in and of itself sufficient for characterizing the relationship between stress and adjustment (Kanner, Coyne, Schaefer, & Lazarus, 1981; Lu, 1991); assessment of daily hassles in adolescents’ lives is also critical for a comprehensive understanding (Lazarus, 1984; Rowlison & Felner, 1988).
Although the UHI addresses these critical limitations, its underlying factor structure has not been clearly established, and examination of its construct validity has been limited. To date, two studies (Bennett & Miller, 2006; Miller & Townsend, 2005) have examined its factor structure, reporting inconsistent findings. Miller and Townsend (2005), in a study of 254 urban adolescents recruited from two public schools (a middle school and a high school), conducted principal component analysis with orthogonal varimax rotation, yielding a four-factor solution from a final model comprising 21 items that accounted for 51% of the total variance: external conditions (number of items [k] = 7, α = .77), interpersonal interactions/surveillance (k = 6, α = .75), safety concerns (k = 5, α = .75), and anticipatory victimization (k = 3, α = .69). However, complete information was not provided regarding which items were loaded on which factor, hindering the replication of the findings. In the second study, using the same sample of the 2005 study, Bennett and Miller (2006) conducted an exploratory factor analyses (EFAs) via maximum likelihood (ML) extraction with promax oblique rotation, yielding a final model comprising 16 items loading on four factors. However, neither the criteria used to determine the number of factors nor the amount of the variance explained by the extracted factors was provided, leading to limited assessment of the adequacy of the solution. Further, the confirmatory factor analyses (CFAs) model built from the EFA-derived solution did not yield a satisfactory model fit, resulting in the deletion of 2 items each from the first and third factors, yielding a final set of 12 items: harassment (k = 3, α = .76), anxiety (k = 3, α = .79), social disorganization (k = 3, α = .67), and coercion (k = 3, α = .62). While the final CFA model supported the four first-order correlated factor structure of the UHI, a second-order factor structure could not be confirmed due to inadequate fit to the data. Thus, although both studies extracted the same number of factors, each study identified somewhat unique combinations of underlying factors, with each factor comprised of a different set of items in each study.
The 2005 study (Miller & Townsend, 2005) examined criterion-related validity of the UHI using Pearson’s correlations, demonstrating significant correlations of the EFA-derived factors/subscales and total scale scores (calculated from the 21 items; α = .85) with indicators of anxiety, depression, antisocial behavior, and post-traumatic stress disorder. However, the subscales tended to show similar patterns of associations across different criterion variables, failing to provide differential predictive utility of each of the extracted factors. Further, despite the previous findings suggesting either a 21- (Miller & Townsend, 2005) or 12-item (Bennett & Miller, 2006) UHI measure, a recent study (Miller & Bennett, 2015) utilized a summary score calculated from totaling the entire 31 items, indicating incomplete understanding about the factor structure of the UHI.
The purpose of the current study is to examine the factor structure of the UHI. EFAs were conducted to explore factor structure inductively followed by CFA to evaluate the model fit of the factor structure derived from the EFA. Since previous studies indicated multidimensionality of the UHI as well as a possibility of there being a single higher-order factor, a second-order factor model was also assessed, hypothesizing that the second-order factor would account for the covariance among the first-order factors. We also evaluated its psychometric properties, including internal consistency and criterion-related validity of the EFA-derived/CFA-supported urban hassle factors. A series of separate hierarchical multiple regression analyses were conducted, controlling for biological and sociodemographic risk factors, to determine whether the UHI factors would explain significant variance in adolescent behavioral adjustments, given the well-known effects of chronic stressors on health (Matheson et al., 2006; Schneiderman, Ironson, & Siegel, 2005; Ystgaard, Tambs, & Dalgard, 1999). We hypothesized that greater urban hassles would be related to more behavioral problems, mental health symptoms, and substance use problems. Findings from the present study may inform scoring instructions of the UHI.
Method
Participants and Procedure
This study included 341 (158 boys, 183 girls) 15-year-old adolescents recruited at birth (September 1994 to June 1996) from a large, urban, teaching hospital for a longitudinal prospective study of the developmental effects of prenatal cocaine exposure (Min et al., 2014; Minnes et al., 2010; Singer et al., 2004, 2008). Women at high risk for drug use because of a lack of prenatal care, behavior suggesting intoxication, a history of involvement with the Department of Human Services, or self-admitted substance use had drug toxicology screenings performed at delivery. Women with a psychiatric history, low intellectual functioning, HIV-positive status, or chronic medical illness were excluded as were infants with Down syndrome, fetal alcohol syndrome, or congenital heart defects. A total of 415 infants were enrolled at birth, of which 218 infants were identified as cocaine exposed based on positive screens of infant meconium or urine, maternal urine, or maternal self-report to hospital or research staff. Comparison (i.e., 197 noncocaine exposed) infants were negative on all indicators. Women who used alcohol, marijuana, or tobacco during pregnancy were included in both groups. Groups did not differ in race, socioeconomic status, or infant gender. Since birth, there were 12 deaths in this sample. At 15 years, 341 adolescents provided complete data on the UHI, representing 85% retention of the 403 living participants in the original study. The 62 nonparticipating adolescents were more likely to be White and exposed to higher prenatal tobacco than the 341 participants. No other sociodemographic and drug exposure differences were found.
Mothers/caregivers and their child were seen at the developmental research laboratory for approximately 5 hr at each follow-up visit. Data in the present study were taken from assessments conducted at ages 15 and 17. All study participants were given a monetary stipend for participation, along with lunch and transportation costs if needed. Parental written informed consent and child assent were obtained. A Certificate of Confidentiality was obtained from the U.S. Department of Health and Human Services to further protect the sensitive nature of the data acquired from study participants during each phase of the study. The institutional review board of the participating hospital approved the study.
Participating adolescents were primarily African American (n = 283, 82%) and recipients of free lunch (n = 283, 84%) and Medicaid (n = 273, 80%), with a mean age of 15.66 years (SD = 0.24). Thirty-nine percent of their mothers (n = 134) had not finished high school, with a mean of 11.78 years of education (SD = 1.52). A majority of the adolescents (n = 301, 88%) were prenatally exposed to at least one substance and two thirds (n = 225) to ≥2 substances. Half of the children (n = 172) were prenatally exposed to cocaine, 63% (n = 209) to tobacco, 76% (n = 250) to alcohol, and 31% (n = 103) to marijuana.
Measures
The UHI
The UHI (Miller & Bennett, 2015) consists of 31 items that represent a range of social and environmental stressors germane to adolescents living in urban environments. Items were rated on a 4-point response option (0 = never to 3 = very often) to indicate how often a particular hassle had occurred to adolescents during the past 3 months. Higher scores indicate greater hassles.
Perceived safety of neighborhood
Perception of neighborhood safety was assessed at age 15 using an item (“I have a safe neighborhood”) from the Developmental Assets Profile (DAP; Scales & Leffert, 2004). The item was rated on a 4-point scale (0 = not at all/rarely to 3 = extremely or almost always); higher scores indicate greater levels of neighborhood safety.
Youth Self-Report (YSR)
Internalizing (anxious or depressed, withdrawn, and somatic complaints; α = .88), externalizing (aggression and rule-breaking behavior; α = .90), and attention problems (α = .76) were assessed at age 15 using the YSR (Achenbach, Dumenci, & Rescorla, 2001), a 105-item self-rating of emotional, behavioral, and social problems in the last 6 months. Items were written at the fifth-grade reading level and rated on a 3-point scale (0 = not true to 2 = very often or often true). T-scores were standardized for gender and age, with higher scores indicating more problem behaviors.
Problem-Oriented Screening Instrument for Teenagers (POSIT)
The POSIT, administered at age 17, is a self-report, multiproblem screening instrument composed of 139 yes or no questions designed to identify substance abuse and related problems in adolescents at ages 12–19 years (Rahdert, 1991). Three subscales were used as predictive criterion variables in this study: Substance Use/Abuse, Mental Health, and Aggressive/Delinquent Behavior. The Substance Use/Abuse subscale has 17 items (e.g., feeling addicted, constant desire for alcohol/drugs, and family/friends telling to cut down on drinking/drug use). Due to skewed distribution, respondents reporting ≥1 problem(s) associated with substance use/abuse (n = 71, 21%) were coded 1 (yes). The Mental Health subscale (α = .87) consists of 22 items (e.g., feeling alone/nervous/sad most of the time, frustrated easily). The Aggressive/Delinquent Behavior subscale (α = .74) consists of 16 items (e.g., threatening to hurt people, stealing, and fighting a lot).
Analysis
Univariate descriptive statistics were examined for distributional characteristics; the interitem correlation matrix was evaluated for factorability using Bartlett’s test of sphericity, the Kaiser–Meyer–Olkin (KMO) measure of sampling adequacy (MSA), and the individual MSAs prior to performing EFA. Significant Bartlett’s test (p < .05), KMO > .70, and MSA > .60 indicate acceptable factorability (Pett, Lackey, & Sullivan, 2003). EFAs were conducted using SPSS to identify the underlying factor structure of the UHI via principal axis factoring (PAF) extraction method. PAF extracts factors from the common/shared variance between variables and makes no distributional assumptions (Fabrigar, Wegener, MacCallum, & Strahan, 1999). A number of factors were determined based on parallel analysis (Hayton, Allen, & Scarpello, 2004; O’connor, 2000), a scree plot, magnitude of factor loadings (≥ |.40|), and factor interpretability (Fabrigar et al., 1999; Floyd & Widaman, 1995). Both orthogonal (varimax) and oblique (oblimin) rotations were performed to compare factor loadings.
CFAs were conducted using Mplus Version 7.11 to evaluate the model fit of the factor structure derived from PAF. Due to the polytomous nature of the data (i.e., four response categories) and nonnormality (skewness > |2.0| and kurtosis > |7.0|; Curran, West, & Finch, 1996) in some variables (e.g., Items 1, 3, 6, 12, 14, and 15; see Appendix Table A1 for the item), the weighted least squares estimator with mean and variance adjustments (WLSMV) was used (Rhemtulla, Brosseau-Liard, & Savalei, 2012), which utilizes a polychoric correlation matrix and computes probit parameter estimates for categorical variables. A number of goodness-of-fit indices were used to evaluate model fit including the robust WLSMV χ2, comparative fit index (CFI), Tucker–Lewis index (TLI), root mean square error of approximation (RMSEA), and the weighted root mean square residual (WRMR). Values ≥.95 for CFI and TLI, ≤.06 for RMSEA (Hu & Bentler, 1999), and ≤.90 for WRMR (Yu & Muthén, 2002) indicate a good fit.
Composite/scale scores were created for each of the extracted factors based on the mean of the items that had their primary loadings on each factor; a total score was computed by summing the scale scores. Cronbach’s α coefficients and average interitem correlations were estimated to evaluate internal consistency for scores on both subscales and the total score; α ≥ .70 (Netemeyer, Bearden, & Sharma, 2003; Nunnally & Bernstein, 1994) and average interitem correlations of .15–.50 (Clark & Watson, 1995) are considered adequate. Criterion-related validity was examined via hierarchical linear or logistic regressions using the perceived safety variable from the DAP and variables from the YSR and the POSIT. Since preliminary analyses indicated that some biological and sociodemographic variables (maternal drug use during pregnancy, maternal education, and adolescent age, sex, and race) were correlated (p < .10) with the PAF-derived/CFA-supported urban hassle factors, the biological and sociodemographic risk factors were entered first in a block on Step 1, and then the urban hassles factors or the UHI total score were entered in a block on Step 2.
Results
EFAs
The UHI indicated acceptable factorability with significant Bartlett’s test of sphericity, χ2(465) = 2,661.1, p < .001; the KMO = .80; and the individual MSAs ranging from .64 on Item 16 (been followed in department stores by salespeople) to .87 on Item 28 (seen people hanging around on street corners in front of stores). Since parallel analysis indicated four factors and the scree plot also leveled off at about the fourth factor, PAF was run with the 31 UHI items constrained to extract four factors. Both orthogonal and oblique rotations yielded similar solutions, with factors composed of the same items and similar magnitudes of factor loadings on each factor. PFAs were run repeatedly, each time dropping an item with factor loadings < .40. Table 1 summarized the final solution using PAFs with varimax rotation, comprising 16 items loading on four factors accounting for 43% of the total variance. Factor loadings based on varimax rotation were presented because extracted factors were correlated modestly (r = .15 – .35), and orthogonal rotation tends to yield more replicable/generalizable solutions (Costello & Osborne, 2005). The first factor (k = 5; α = .81) was named environmental nuisance (e.g., abandoned buildings and lots), contributing 15% of the total variance. The second (k = 6; α = .68) and third factors (k = 3; α = .71) were named safety concerns (e.g., worried about the safety of friends) and drug (e.g., asked to sell drugs), respectively, each explaining 11% of the variance. The fourth factor (k = 2; α = .54) was named coercion (e.g., pressured for sex by boyfriend/girlfriend) and contributed 6% of the variance. All factors were clearly differentiated without substantial secondary loadings. The item communalities (h 2), the amount of item variance explained by the extracted four factors, ranged from .20 on Item 12 (not told your friends that you worry about being safe) to .75 on Item 14 (asked to sell drugs).
Results of Principal Axis Factoring Factor Analyses With Varimax Rotation of the Urban Hassles Index.
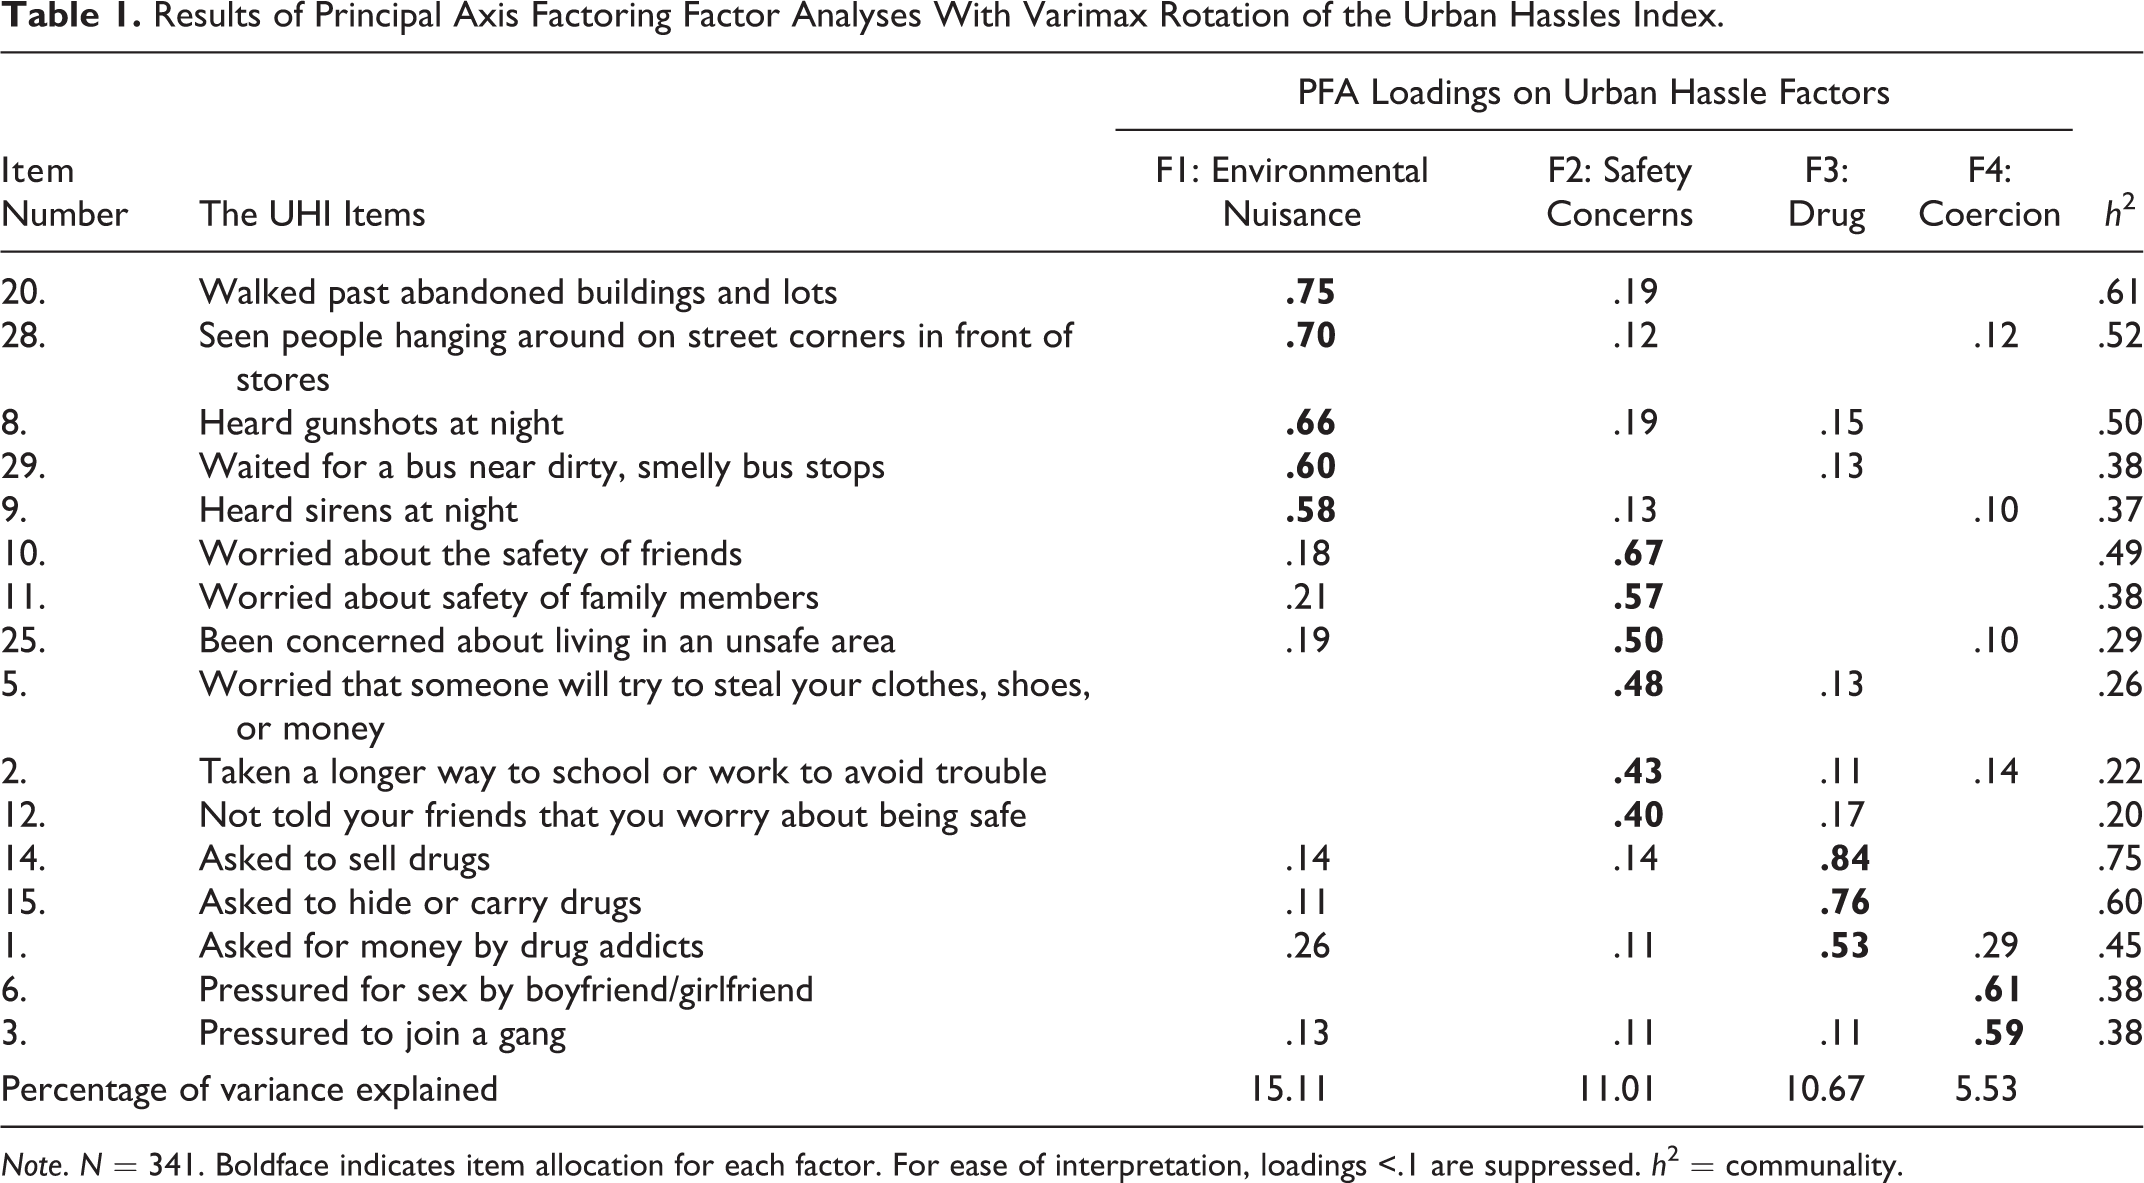
Note. N = 341. Boldface indicates item allocation for each factor. For ease of interpretation, loadings <.1 are suppressed. h 2 = communality.
CFAs
CFA with WLSMV assessed how well the data fit the PFA-derived model. Each factor represented a latent variable, and each item was specified as an indicator of a latent variable that the item had primary loading on. Covariance between latent variables/factors was included to estimate relationships among them, and error variance of the 2 items (Q14 and Q15) was correlated due to a high correlation between them. The CFA yielded excellent model fit, χ2 = 120.10 (97), p = .06, CFI = .987, TLI = .984, RMSEA = .026 (90% CI [.000, .041]), and WRMR = .724, supporting the four-factor structure of the UHI (Figure 1). All factor loadings (standardized) were strong, ranging from .52 to .97 (all ps < .01), and all latent factors were correlated with r = .35 between safety concerns and coercion to .59 between drug and coercion (all ps < .01).
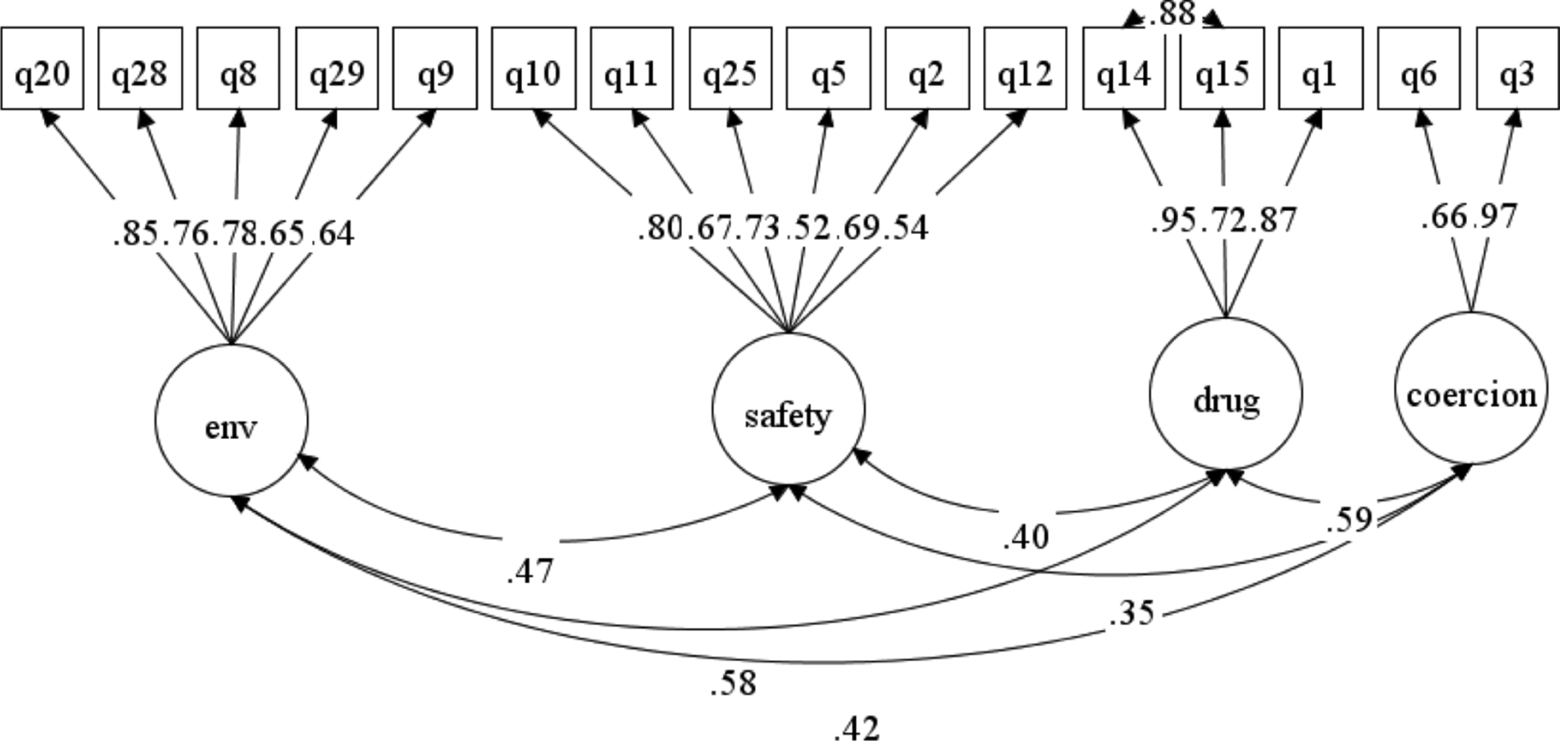
Confirmatory factor analysis for the four-factor model of the Urban Hassles Index (N = 341). Rectangles indicate observed variables (item) and ovals represent factors. All factor loadings (standardized) and correlations between factors are statistically significant (p < .01). Error terms were not presented for a simpler presentation. Env = environmental nuisance. χ2 = 120.10 (97), p = .06, CFI = .987, TLI = .984, RMSEA = .026 (90% CI [.000, .041]), and WRMR = .724.
Figure 2 represent a second-order factor model in which the four first-order factors loaded on a second-order factor of urban hassles, replacing interfactor correlations from Figure 1. Since coercion had only two indicators, the two indicators’ loadings were set equal to each other (Little, Lindenberger, & Nesselroade, 1999). A second-order model is statistically equivalent with a first-order correlated model (Barbaranelli, Lee, Vellone, & Riegel, 2014), although a second-order model hardly produces a better model fit than a first-order correlated factors (Koufteros, Babbar, & Kaighobadi, 2009). The second-order factor model produced good model fit, χ2 = 126.68 (100), p = .04, CFI = .985, TLI = .982, RMSEA = .028 (90% CI [.007,.042]), and WRMR = .768, only inconsequently divergent in performance (Cheung & Rensvold, 2002) from the first-order four-factor correlated model, indicating that the extracted four factors could be explained by a higher-order factor.
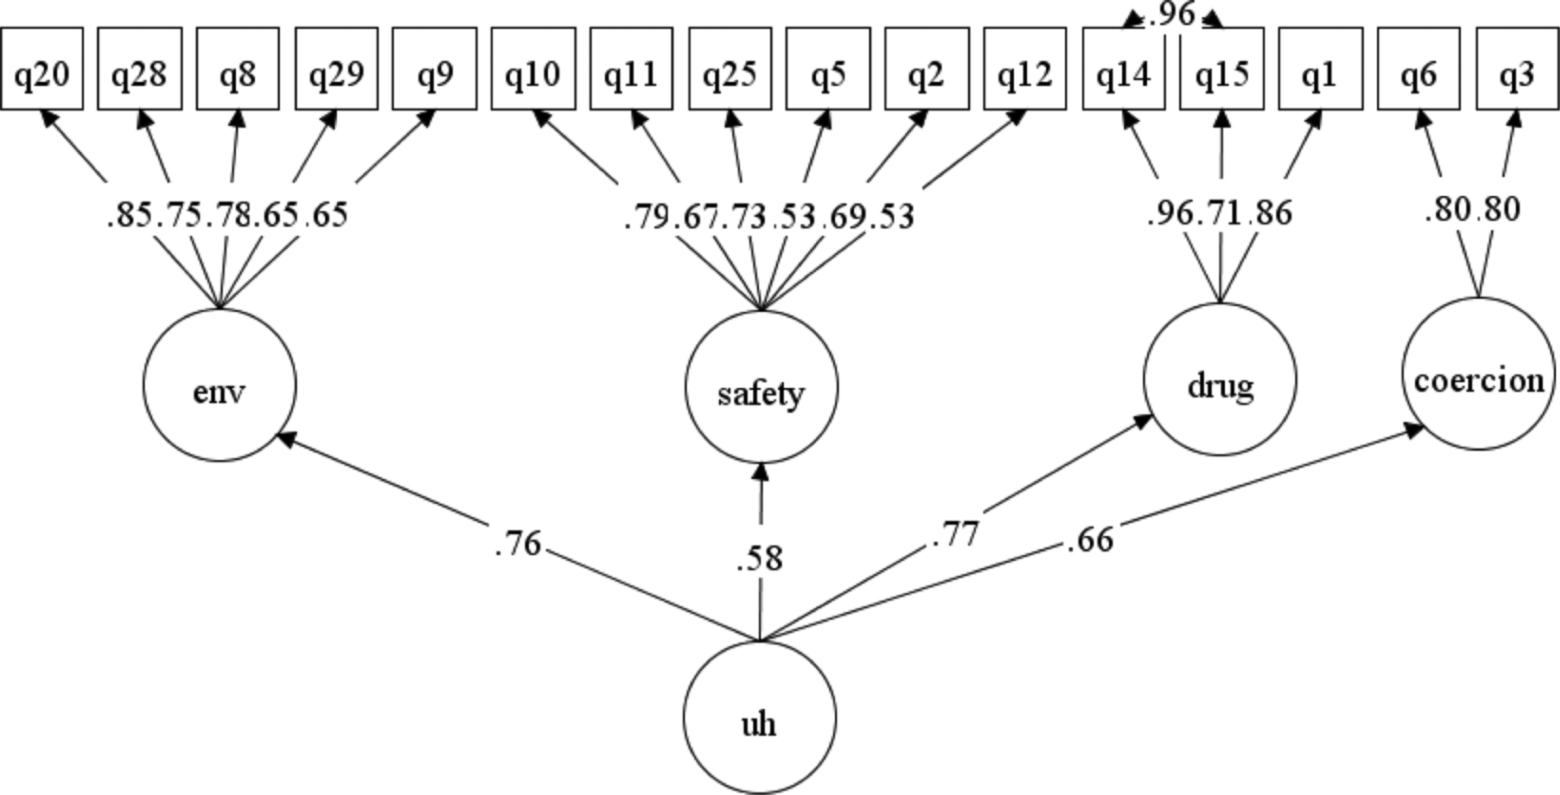
Confirmatory factor analysis for the second-order model of the Urban Hassles Index (N = 341). Rectangles indicate observed variables (item) and ovals represent factors. All factor loadings (standardized) are statistically significant (p < .01). Error terms were not presented for a simpler presentation. UH = urban hassles; Env = environmental nuisance. χ2 = 126.68 (100), p = .04, CFI = .985, TLI = .982, RMSEA = .028 (90% CI [.007. .042]), and WRMR = .768.
Reliability and Validity
Descriptive statistics, along with Cronbach’s α and average interitem correlations, for the four factors and the higher-order scale are presented in Table 2. Drug and coercion subscales indicated skewed distributions, probably because the items measure relatively rare, yet serious transactions (e.g., asked to sell drugs). Cronbach’s α coefficients were acceptable except for coercion, as only 2 items composed the factor. Average interitem correlations ranged from .27 on safety concerns to .54 on drug. The average interitem correlation of the total UHI score was .20, substantially less than the average within-subscale correlations, supporting the multidimensionality of the UHI (Clark & Watson, 1995).
Urban Hassles Factors: Mean (SD), Skewness, Kurtosis, Internal Consistency Reliability (α), and Average Interitem Correlations.
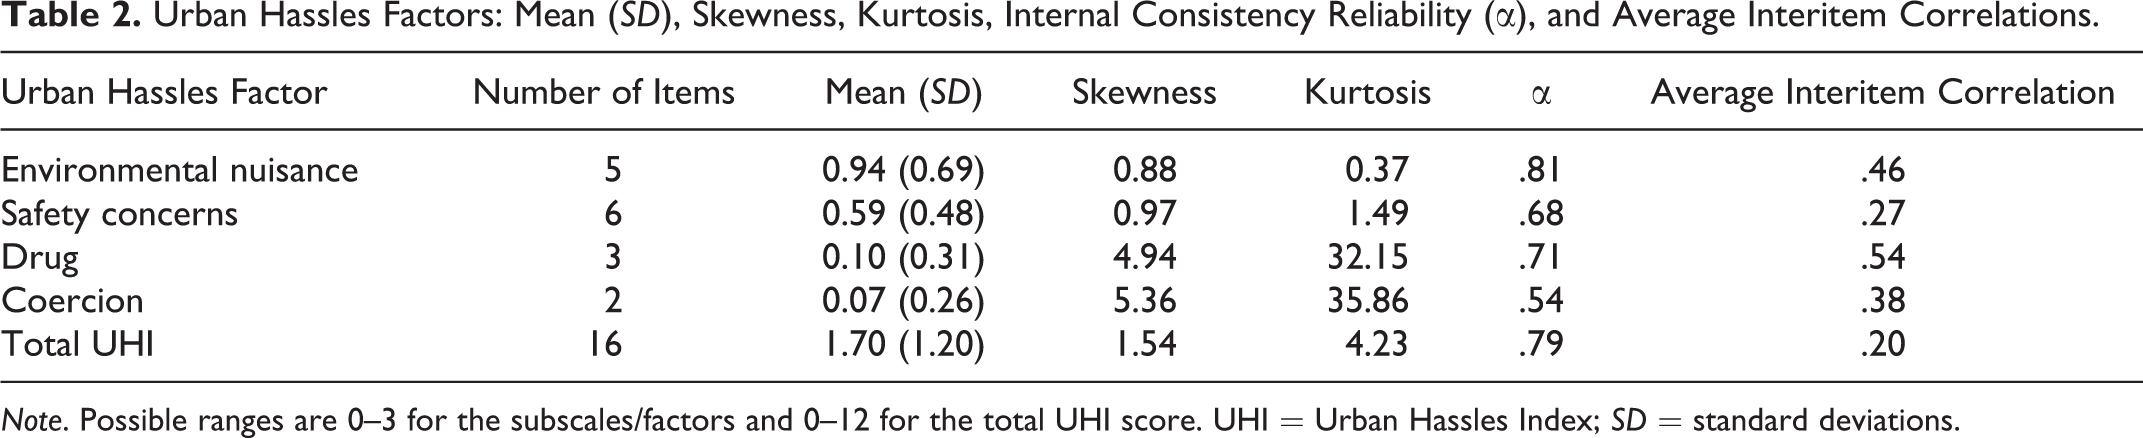
Note. Possible ranges are 0–3 for the subscales/factors and 0–12 for the total UHI score. UHI = Urban Hassles Index; SD = standard deviations.
Table 3 indicates that the UHI factors conjointly contributed significant variance to all seven criterion variables, over and above that contributed by biological and sociodemographic characteristics (maternal cocaine use during pregnancy, maternal education, and adolescent age, sex, and race). Higher levels of environmental nuisance were related to poor neighborhood safety and more externalizing behavior problems at age 15 and mental health symptoms and aggressive/delinquent behaviors at age 17; higher levels of safety concerns were related to attention problems, internalizing and externalizing behaviors, and mental health symptoms; higher levels of drug were only related to substance use/abuse at age 17; and higher levels of coercion were related to all criterion variables except neighborhood safety and substance use/abuse, resulting in 5–22% increases in R 2 in each criterion. Each of the four urban hassles factors accounted for significant unique variance in the seven criterion variables, even after controlling for the other urban hassles factors in addition to the biological and sociodemographic variables. The UHI total score was related to all criterion variables, with 4–18% increases in R 2.
Hierarchical Regression: Associations of Four First-Order Factors and Urban Hassles Total Score.
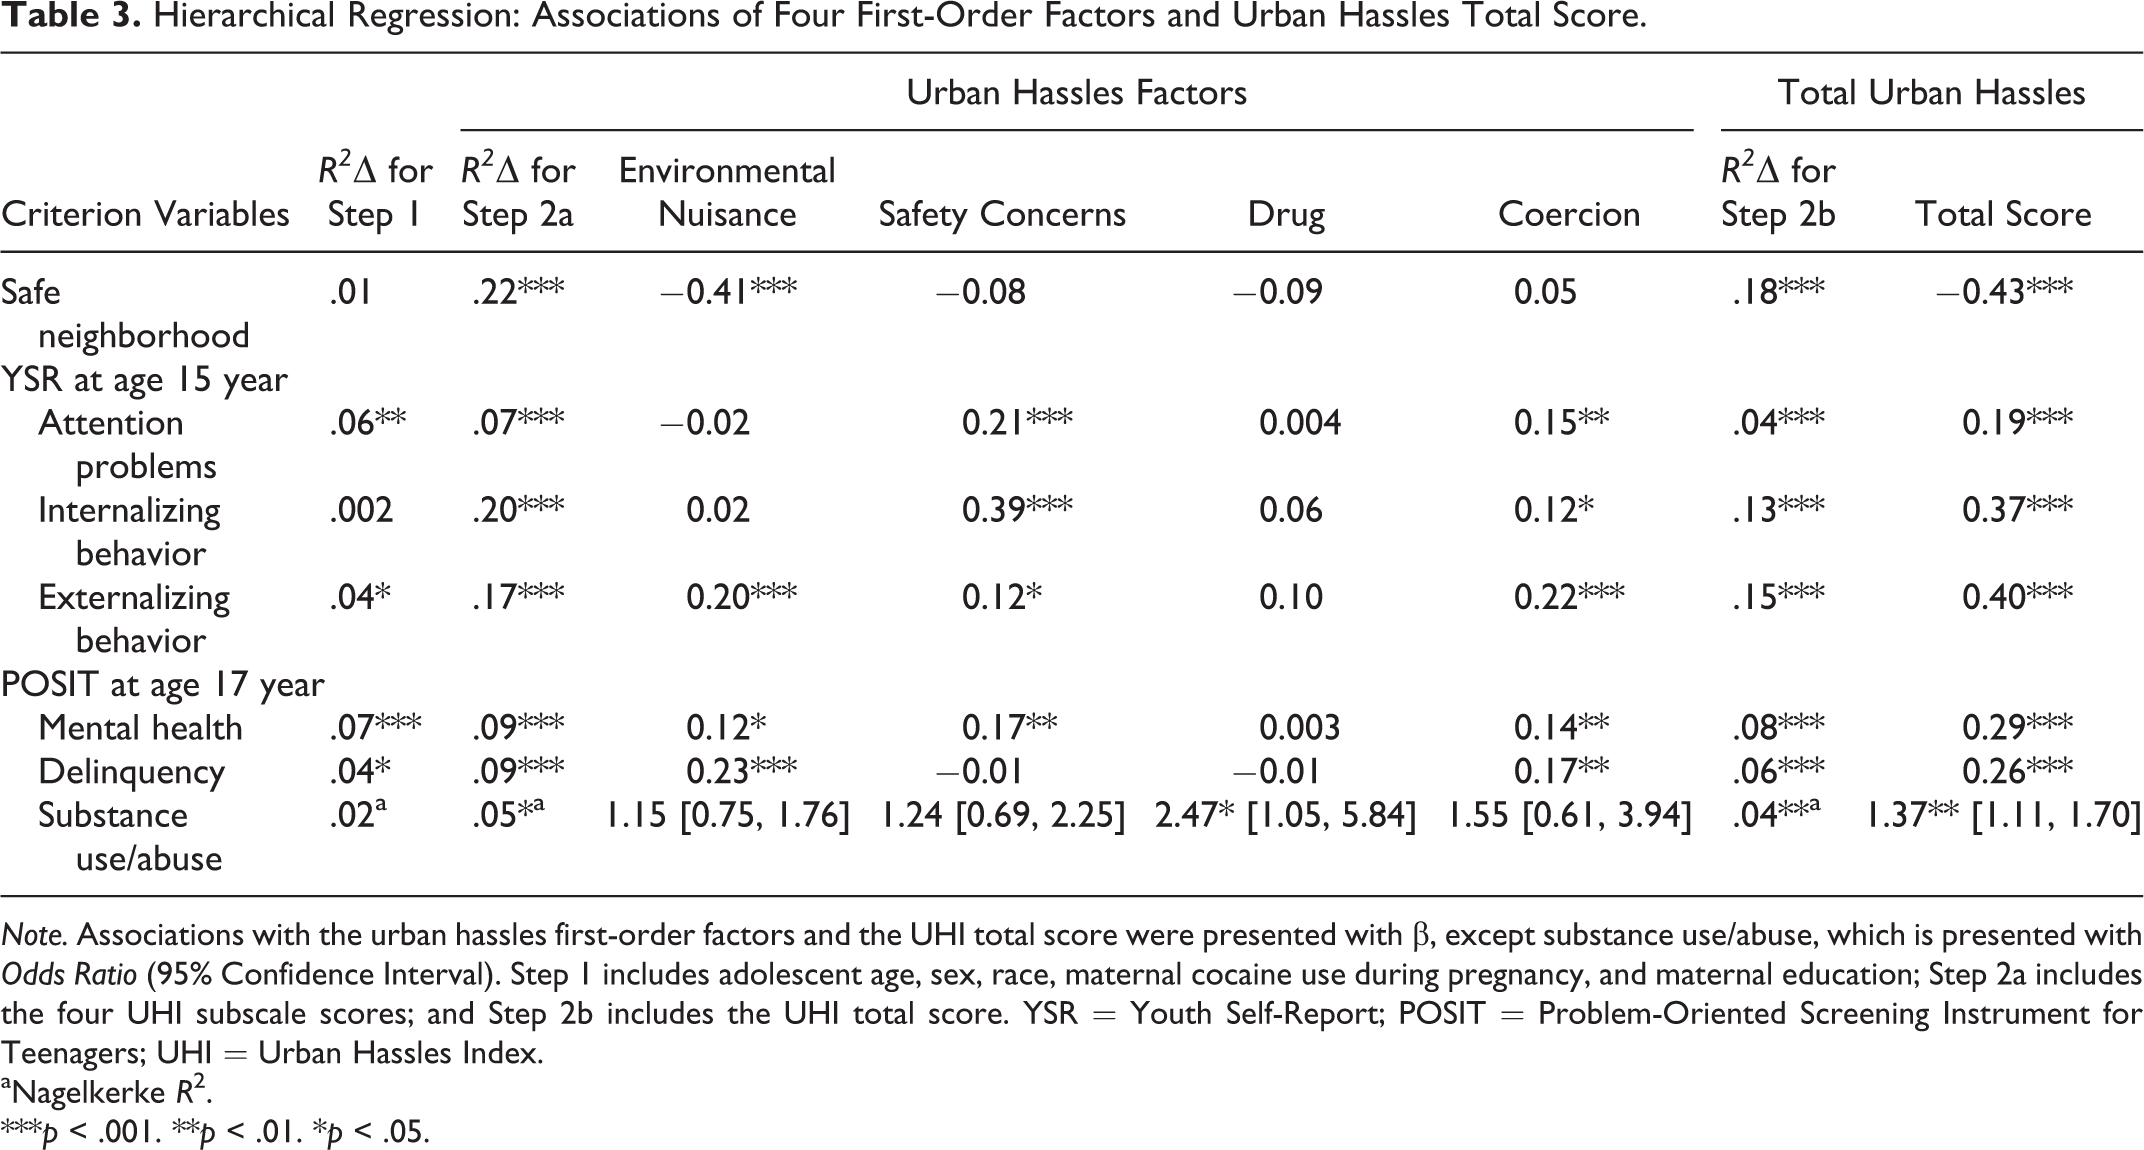
Note. Associations with the urban hassles first-order factors and the UHI total score were presented with β, except substance use/abuse, which is presented with Odds Ratio (95% Confidence Interval). Step 1 includes adolescent age, sex, race, maternal cocaine use during pregnancy, and maternal education; Step 2a includes the four UHI subscale scores; and Step 2b includes the UHI total score. YSR = Youth Self-Report; POSIT = Problem-Oriented Screening Instrument for Teenagers; UHI = Urban Hassles Index.
aNagelkerke R 2.
***p < .001. **p < .01. *p < .05.
Discussion and Applications to Practice
The present study determined that the UHI has four first-order factors (environmental nuisance, safety concerns, drug, and coercion), accounting for 43% of the total variance and that covariance among the first-order factors can be explained by a higher second-order factor. Moderate factor correlations and evidence for the criterion-related validity of the four first-order factors, as well as the higher second-order factor, indicated the multidimensional nature of urban hassles.
Our four first-order factor solution is in partial agreement with Bennett and Miller’s (2006) CFA model. Three of the four factors in our solution retained items identical to those on their three factors. Two items from safety concerns (Q10 and Q11), 2 items from drug (Q14 and Q15), and all 2 items from coercion (Q6 and Q3) were shared with their subscales of anxiety, harassment, and coercion, respectively, indicating good stability for these factors across different samples. Although no items from environmental nuisance were shared with their solution, this factor is conceptually congruent with their social disorganization factor. Our CFA confirmed a second-order factor structure, which Bennett and Miller’s study could not. This difference may be due to differences in parameter estimators used in CFA (WLSMV in the present study vs. ML in Bennett and Miller’s study), range/distribution on the items/variables across studies, and/or sample size (341 vs. 254).
Given the multidimensionality of the UHI, social workers can utilize the UHI to determine specific intervention targets. That is, social workers can identify hassles that are more troublesome to an individual youth based on subscales, establishing individualized intervention targets. For example, practitioners could offer interventions focused on drug resistance skill building to a youth with elevated scores on the Drug subscale. Also, practitioners could alert a community authority to prioritize drug trafficking as an area requiring urgent attention with appropriate interventions (e.g., increasing policing) when a large number of youth in the same community endorse items on the Drug subscale. In addition, the UHI provides a gentle opening to discussions about how urban adolescents respond to and cope with daily hassles that occur repeatedly, leading to a better understanding of chronic stressors originating from the community context and of the psychosocial development of children and adolescents in such settings.
Our study also provides research suggestions for the further refinement of the UHI. First, the coercion factor has only 2 items; an additional 1 or 2 items capturing the construct would improve the reliability of the factor. Second, the high correlation between the 2 items in the drug factor (Q14 and Q15) should be reexamined in different samples to determine whether the high correlation indicates significant item redundancy or is unique to this study sample. Third, one of the items in safety concerns (Q12: Not told your friends that you worry about being safe) seems double-barreled as the item includes keeping a secret in addition to worrying about one’s own safety, which may contribute to the item’s lowest communality. Further, our study indicated that risk posed by the physical environment (environment nuisance) could be teased out empirically from the risk evident in the social environment (safety concerns, coercion, and drug), although additional study should be conducted to understand the nature of the interrelationships between the two risks (e.g., the impact of physical environment may be partially mediated by social environment that can be affected by physical environment).
Limitations in our study should be noted. Due to the limited sample size, the same sample was used for CFA to validate the EFA-derived factor solution. Similarly, the relatively small sample size for WLSMV also precluded us from addressing possible gender variations in the factor structure of the UHI using multiple-group CFA. One of the measures used for criterion-related validity, perceived safety of neighborhood, was assessed with a single-item question, which may have compromised reliability and validity. The correlational nature of the data reduce confidence in the causal direction between urban hassles and behavioral adjustment outcomes. Lastly, the sample composition may limit generalizability of the findings to predominantly African American adolescents, calling for a replication study with a more racially and ethnically diverse group of adolescents. However, it should be noted that the final 16-item solution did not retain items related to racial profiling (e.g., been stopped and questioned by police and been followed in department stores by salespeople), allowing the shortened UHI to be less confounded with racial characteristics.
The present study has multiple methodological strengths, including the use of parallel analysis to determine the number of factors extracted, use of CFA with WLSMV to validate the fit of the EFA-derived model, and providing initial evidence of criterion-related validity of the extracted factors via multivariate analyses. Our study also provides scoring instruction of the UHI, increasing the utility of the measure. Further, the reduced length (from 31- to 16-items) minimizes respondent burden.
In conclusion, the UHI captures contextual stressors and challenges germane to urban, inner-city adolescents. Although additional items for coercion may improve reliability and validity of the UHI, the shortened 16-item UHI is a sound, brief assessment tool examining stressors unique to urban adolescents.
Footnotes
Appendix
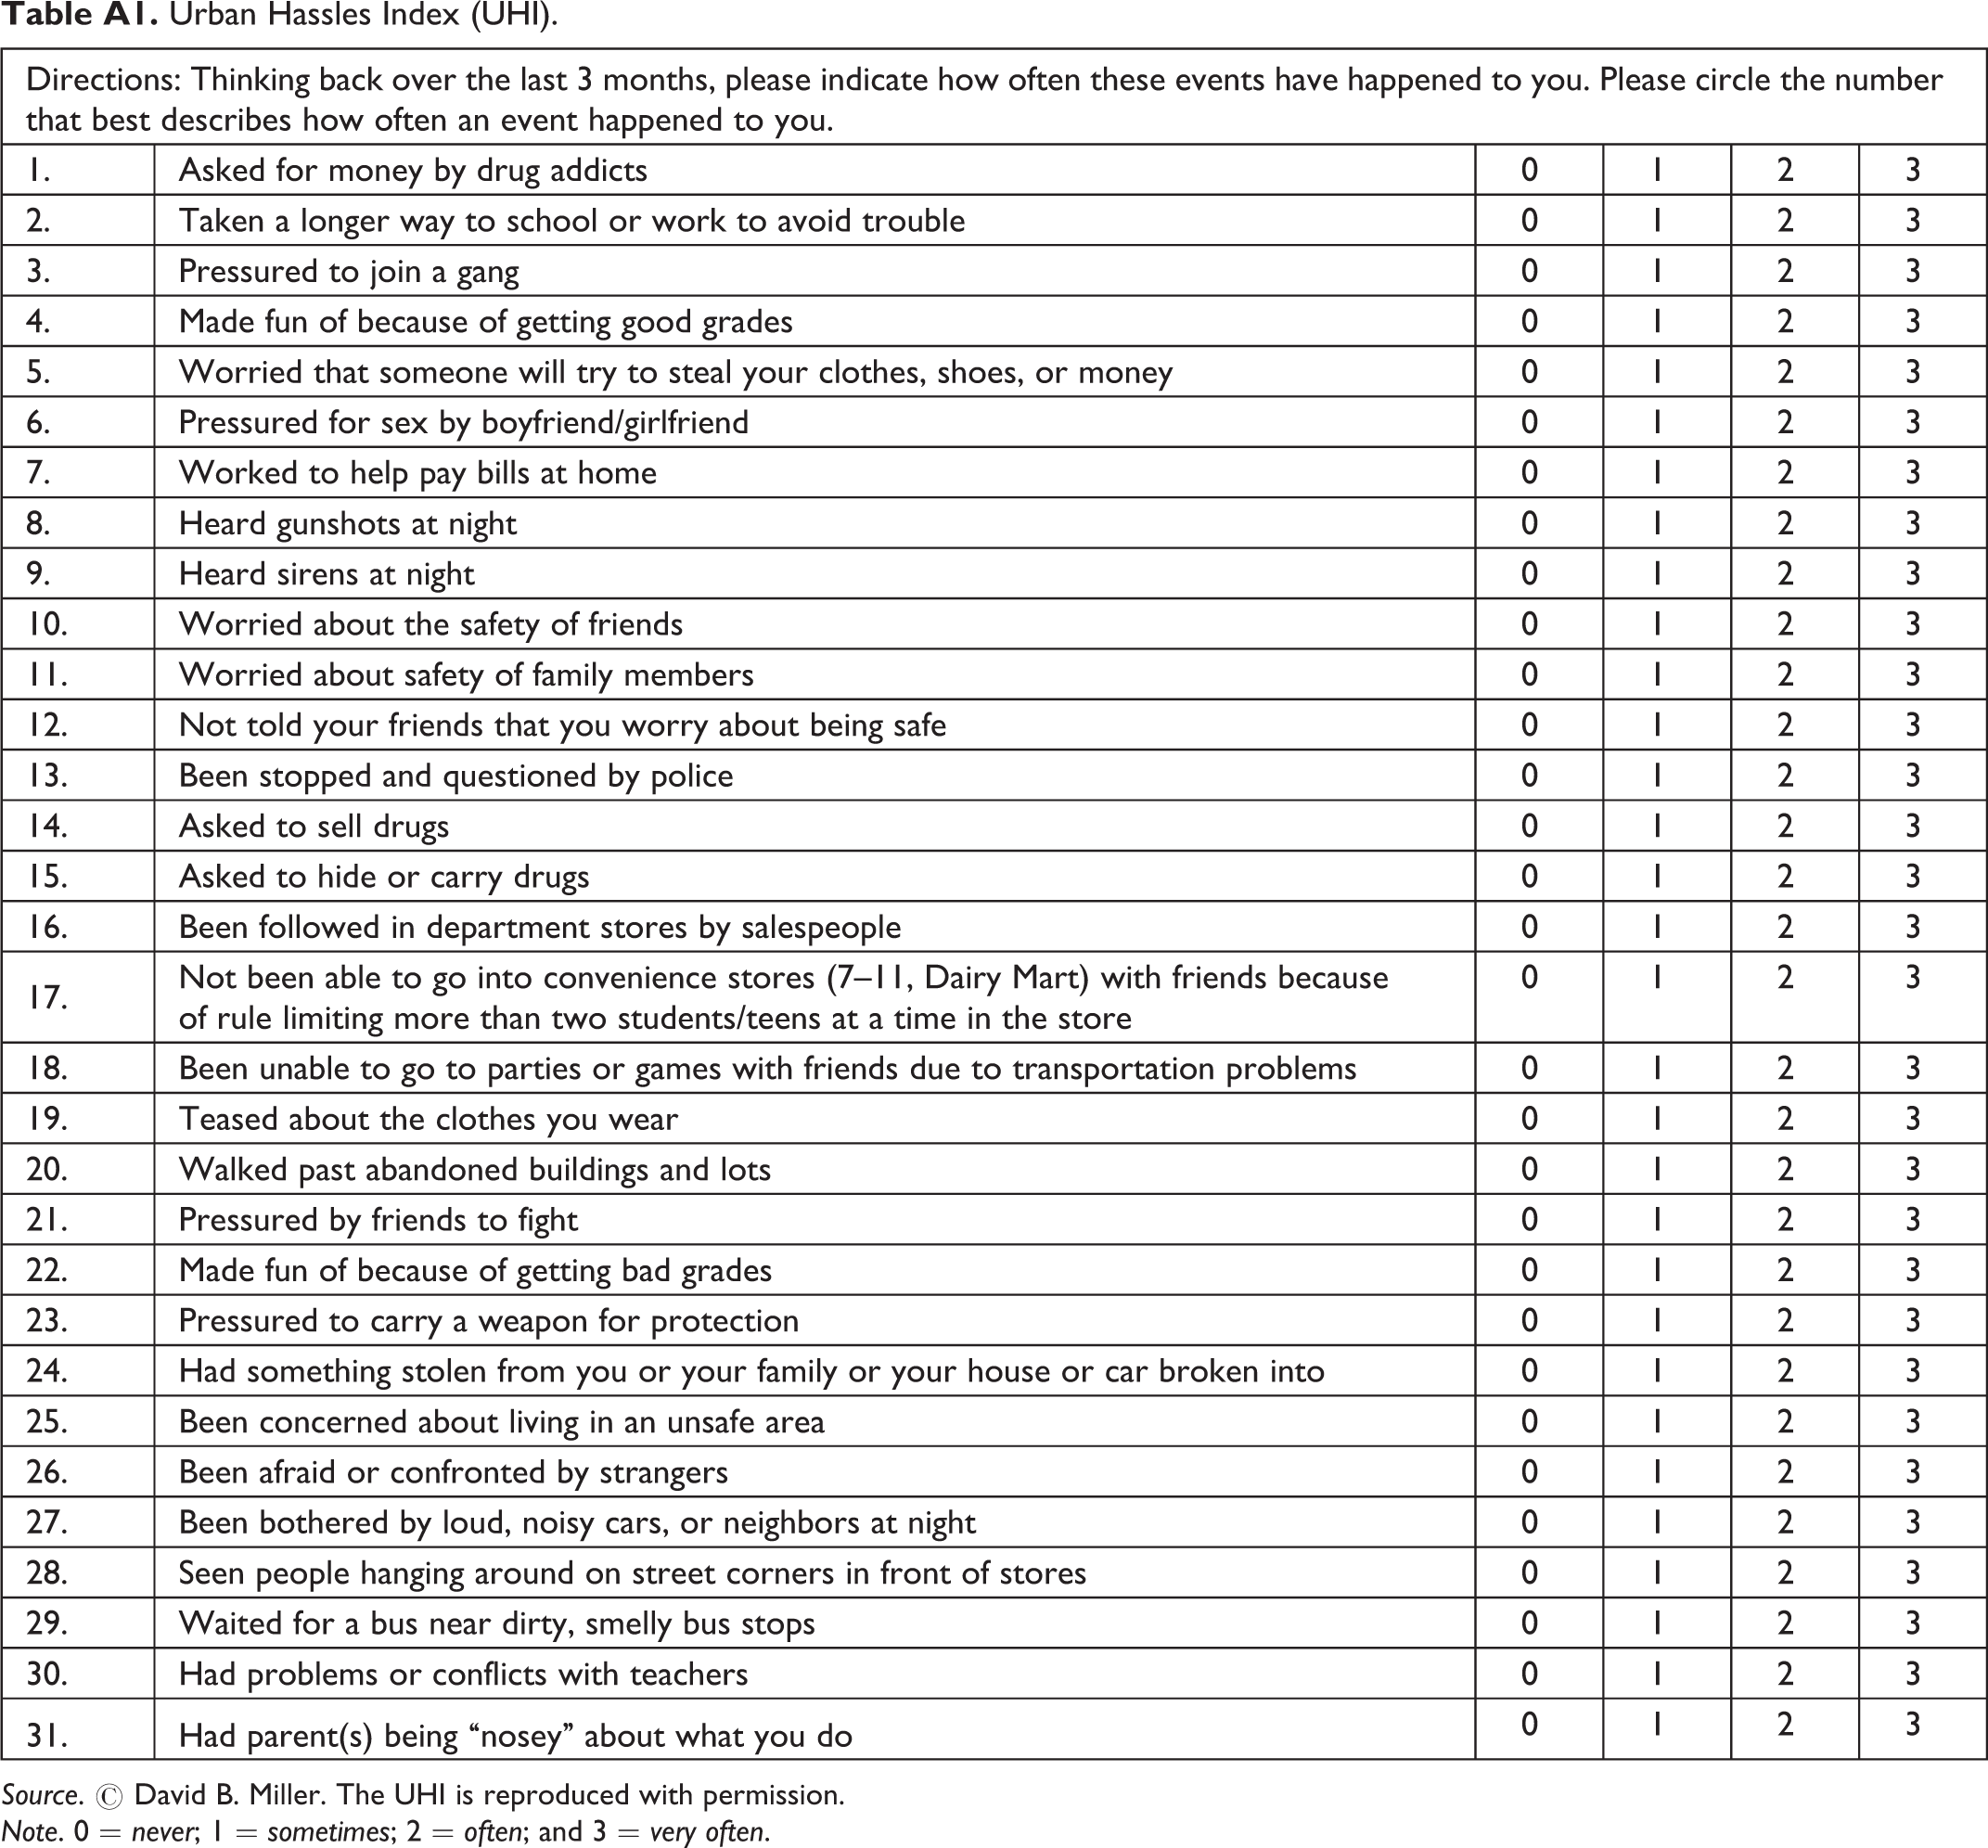
Urban Hassles Index (UHI).
| Directions: Thinking back over the last 3 months, please indicate how often these events have happened to you. Please circle the number that best describes how often an event happened to you. | |||||
| 1. | Asked for money by drug addicts | 0 | 1 | 2 | 3 |
| 2. | Taken a longer way to school or work to avoid trouble | 0 | 1 | 2 | 3 |
| 3. | Pressured to join a gang | 0 | 1 | 2 | 3 |
| 4. | Made fun of because of getting good grades | 0 | 1 | 2 | 3 |
| 5. | Worried that someone will try to steal your clothes, shoes, or money | 0 | 1 | 2 | 3 |
| 6. | Pressured for sex by boyfriend/girlfriend | 0 | 1 | 2 | 3 |
| 7. | Worked to help pay bills at home | 0 | 1 | 2 | 3 |
| 8. | Heard gunshots at night | 0 | 1 | 2 | 3 |
| 9. | Heard sirens at night | 0 | 1 | 2 | 3 |
| 10. | Worried about the safety of friends | 0 | 1 | 2 | 3 |
| 11. | Worried about safety of family members | 0 | 1 | 2 | 3 |
| 12. | Not told your friends that you worry about being safe | 0 | 1 | 2 | 3 |
| 13. | Been stopped and questioned by police | 0 | 1 | 2 | 3 |
| 14. | Asked to sell drugs | 0 | 1 | 2 | 3 |
| 15. | Asked to hide or carry drugs | 0 | 1 | 2 | 3 |
| 16. | Been followed in department stores by salespeople | 0 | 1 | 2 | 3 |
| 17. | Not been able to go into convenience stores (7–11, Dairy Mart) with friends because of rule limiting more than two students/teens at a time in the store | 0 | 1 | 2 | 3 |
| 18. | Been unable to go to parties or games with friends due to transportation problems | 0 | 1 | 2 | 3 |
| 19. | Teased about the clothes you wear | 0 | 1 | 2 | 3 |
| 20. | Walked past abandoned buildings and lots | 0 | 1 | 2 | 3 |
| 21. | Pressured by friends to fight | 0 | 1 | 2 | 3 |
| 22. | Made fun of because of getting bad grades | 0 | 1 | 2 | 3 |
| 23. | Pressured to carry a weapon for protection | 0 | 1 | 2 | 3 |
| 24. | Had something stolen from you or your family or your house or car broken into | 0 | 1 | 2 | 3 |
| 25. | Been concerned about living in an unsafe area | 0 | 1 | 2 | 3 |
| 26. | Been afraid or confronted by strangers | 0 | 1 | 2 | 3 |
| 27. | Been bothered by loud, noisy cars, or neighbors at night | 0 | 1 | 2 | 3 |
| 28. | Seen people hanging around on street corners in front of stores | 0 | 1 | 2 | 3 |
| 29. | Waited for a bus near dirty, smelly bus stops | 0 | 1 | 2 | 3 |
| 30. | Had problems or conflicts with teachers | 0 | 1 | 2 | 3 |
| 31. | Had parent(s) being “nosey” about what you do | 0 | 1 | 2 | 3 |
Source. © David B. Miller. The UHI is reproduced with permission.
Note. 0 = never; 1 = sometimes; 2 = often; and 3 = very often.
Declaration of Conflicting Interests
The authors declared no potential conflicts of interest with respect to the research, authorship, and/or publication of this article.
Funding
The authors disclosed receipt of the following financial support for the research, authorship, and/or publication of this article: This research was supported by the National Institute on Drug Abuse (NIDA) Grant number R01 07957.