



Abstract
Previous research on the readability of annual reports is based mainly on English narratives and has found them difficult to read. Although the results of such research cannot be generalized to different contexts, accounting narratives written in non-English languages have seldom been analyzed in this respect. More important, few studies have longitudinally examined the evolution in readability of such narratives. This study focuses on the readability evolution of annual report narratives written in Spanish, applying an adapted version of the Flesch readability formula to two sets of documents from different companies over most of the years of the 20th century. The results confirm that the reports are indeed difficult to read but show an improvement in readability over the years. The study tested several variables that might influence readability, including profitability.
Keywords
The annual report is considered the main channel that companies use to communicate with stakeholders (Bowman, 1984; Courtis, 1987). Consisting of both quantitative and qualitative, or narrative, information, annual reports are supposed to be useful to readers for making decisions (International Accounting Standards Board, 2010). Given this objective, companies should “use plain language, only well-defined terms, consistent terminology and an easy-to-follow structure” (Financial Reporting Council, 2009, p. 48); therefore, it is reasonable to think that managers would limit textual complexity to a level that is accessible to most users (Bayerlein & Davidson, 2012). Readability—whether a text can be read quickly and easily (N. Schroeder & Gibson, 1990)—has been studied using different procedures (Jones & Shoemaker, 1994). Although studies agree that annual report information is difficult to read and understand (Clatworthy & Jones, 2001; Smith & Taffler, 1992), few studies have longitudinally examined the readability evolution of annual reports (Jones, 1988).
Readability studies have focused on documents written in English and in anglophone countries, including the United States (Subramanian, Insley, & Blackwell, 1993), the United Kingdom (Jones, 1988), Australia (Parker, 1982), and Canada (Courtis, 1986). Because of the different legal and economic conditions between countries, the results of these studies cannot be generalized to different contexts (Jones, 1988; Merkl-Davies & Brennan, 2007). Although Subramanian, Insley, and Blackwell (1994); Merkl-Davies (2007); and Li (2010) have called for researchers to study in detail the differences arising from different cultural contexts, annual reports written in non-English languages, particularly, in Spanish, have seldom been analyzed in this respect (Fialho, Fuertes, & Pascual, 2002). Even the few studies based on nonanglophone countries, such as Hong Kong (Courtis, 1995) or Malaysia (Abu Bakar & Ameer, 2011), have analyzed the English versions of the original annual reports, despite differences in length, themes, and linguistic style between the different language versions of bilingual reports (Ngai & Singh, 2014).
With the increasing use of textual analysis and the Securities and Exchange Commission’s (SEC) plain English initiative (Loughran & McDonald, 2014), measuring readability in financial disclosures has become important. Research shows that such disclosure varies depending on the culture and the legal system, among other factors (Doupnik & Riccio, 2006; Guillamon-Saorin & Sousa, 2010). Using Hofstede’s (1980) premises, Gray (1988) developed four dimensions for predicting the relationship between cultures and accounting systems, including disclosure. Figure 1 illustrates these four dimensions—optimism, conservatism, secrecy, and transparency—on a plane that is divided into four quadrants by the horizontal axis of optimism versus conservatism and the vertical axis of secrecy versus transparency. Especially relevant is the secrecy–transparency axis, reflecting the “preference for confidentiality and the restriction [or obfuscation] of disclosure…as opposed to a more transparent, open, and publicly accountable approach” (p. 8). Anglophone countries are located in the lower left quadrant, indicating high expected transparency. In contrast, the countries located in the upper right quadrant are associated with higher secrecy.

Accounting systems: measurement and disclosure. Adapted from Gray (1988, p. 13). This figure is a copyrighted material. Permission for reproduction has been obtained from Abacus, Wiley.
In regard to the relationship between a country’s financial disclosure and its legal system, La Porta, Lopez-de-Silanes, Shleifer, and Vishny (1997) argued that common-law countries, including anglophone countries, have stronger investor protections and broader capital markets than do civil-law countries, and Doupnik and Salter (1995) showed that common-law countries have higher financial disclosure than do civil-law countries. Therefore, previous research should be complemented with studies based on countries with greater expected secrecy (i.e., less financial disclosure) and civil-law systems. As a Latin country, Spain, which is considered a French civil-law country (La Porta, Lopez-de-Silanes, Shleifer, & Vishny, 1997), would be located in Gray’s (1988) upper right quadrant. Because Spanish has the world’s second largest number of native speakers (over 500 million people) and is the second language of international communication (Instituto Cervantes, 2014), the analysis of readability in Spanish company reports will significantly extend previous research.
The article studies the readability evolution of accounting narratives written in Spanish. Specifically, we analyze whether readability has changed over the years and whether other variables have a significant impact on readability. The variable most tested in the literature has been profitability, on the assumption that company managers use disclosure and presentation policies, consciously or not, to present annual corporate achievements as favorably as possible—that is, they engage in impression management (Brennan, Guillamon-Saorin, & Pierce, 2009). Abu Bakar and Ameer (2011) have suggested longer periods of observation in order to produce more solid explanatory links between readability and various factors; our study, then, not only covers the longest period ever studied in accounting research on readability but also uses longitudinal series of documents from two companies in order to strengthen the reliability of the results: CEPSA’s president’s letters from 1930 to 2012 and El Alcázar’s management reports from 1928 to 1992. Compañía Española de Petróleos, S.A. (CEPSA) (1959) is a multinational oil company. El Alcázar is a medium-sized brewery company (Moreno, 2011). Both the letters and the reports present nonstandardized narrative information, are produced periodically, and are the most read sections of their respective annual reports.
Bartlett and Chandler (1997) argued that narrative sections attract wider readership than pure financial data because shareholders are mainly interested in obtaining an overview of the company and its performance. Although some concerns have been raised about readability formulas, this study uses an adapted version of the Flesch readability formula for comparability because it is the measure most widely applied by the accounting literature in general and studies of readability evolution in particular.
A Review of the Accounting Literature on Readability and Development of Hypotheses
Scholars have analyzed the readability of various accounting documents: whole annual reports (Pashalian & Crissy, 1952), notes to financial statements (Healy, 1977), president’s letters (we use this term in general to include the U.K. category chairman’s address; Clatworthy & Jones, 2001), management discussion and analysis (N. Schroeder & Gibson, 1990), compensation discussion and analysis (Laksmana, Tietz, & Yang, 2012), accounting reports (Lehavy, Li, & Merkley, 2011), and even accounting textbooks (Bargate, 2012). Their studies have focused mainly on assessing the readability of annual report narratives (Courtis, 1986; Lewis, Parker, Pound, & Sutcliffe, 1986; Parker, 1982) and studying the relationship between annual report readability and company characteristics, most commonly firm performance (Courtis, 1986; Jones, 1988; Subramanian et al., 1993).
In general, previous studies have indicated that annual report narratives are difficult or very difficult to read (Clatworthy & Jones, 2001; Smith & Taffler, 1992). In fact, the SEC and the press have criticized companies for the complexity of the language in these documents (M. Schroeder, 2002). But few studies have studied readability evolution over time. Two studies (Dolphin & Wagley, 1977; Soper & Dolphin, 1964) analyzed 1974 and 1961 data, respectively, replicating, to the extent possible, Pashalian and Crissy’s (1952) study based on 26 U.S. annual reports from 1948, and found a clear decrease in readability. Lewis, Parker, Pound, and Sutcliffe (1986), analyzing readability evolution in information addressed to the workers of nine Australian companies over just 4 years (1977–1980), also found a slight overall decrease. We have found only one study investigating a long period of time: Jones (1988) analyzed president’s letters for a single U.K. company from 1952 to 1985, finding that readability decreased significantly over those years. Later, Courtis (1995) studied the evolution of annual report sections written in English from 32 Hong Kong companies in 1986 and 1991, also finding a readability decrease.
1
These studies, which are summarized in Table 1, suggest two hypotheses:
Several studies have tested the relationship of readability with firm size, usually determined by sales turnover or total assets. Courtis (1995, 2004), Rutherford (2003), and Smith, Jamil, Johari, and Ahmad (2006) found no apparent relationship between readability and size, but Jones (1988) found a negative relationship. And Merkl-Davies (2007) found different results according to the different measures used to gauge readability. We base our third hypothesis on the findings of Courtis (1995, 2004), Rutherford (2003), and Smith et al. (2006):
The readability relationship most tested and debated has been that with performance measured primarily as profitability. Most previous studies have tested the idea that firms with negative outcomes will produce annual reports that are harder to read (Brennan et al., 2009), a practice that has been described as impression management (Neu, Warsame, & Pedwell, 1998), obfuscation (Courtis, 1995), or incomplete revelation (Bloomfield, 2002). Results supporting this association are provided by Subramanian, Insley, and Blackwell (1993), Li (2008), and Dempsey, Harrison, Luchtenberg, and Seiler (2012), who found a positive relationship between profitability and annual report readability. In contrast, Courtis (1986, 1995), Jones (1988), Rutherford (2003), and Smith et al. (2006) found no relationship between readability and profitability. This apparent contradiction in findings may be at least partially explained by the use of different profitability proxies. Subramanian et al. (1993) used net profit (significant relationship), Li (2008) used earnings scaled by book value of assets (statistically but not economically significant relationship), Courtis (1986) used earnings variability and return on total assets (neither had a significant relationship), and Jones (1988) used ratio of net profit to sales and return on capital employed (neither had a significant relationship at 5%). Trying to explain the mixed findings, Subramanian et al. (1994) drew attention to the different cultural contexts of the previous investigations. Rutherford (2003) suggested that most studies had employed a limited number of variables and used only simple statistical tests whereas Li (2008) blamed low sample sizes. To clarify this contradiction, we test our fourth hypothesis:
Another frequently tested variable related to performance has been risk, defined as the possibility that a business will not be able to pay creditors. The impression management hypothesis suggests an inverse relationship between risk and readability, but most evidence does not support this assumption. Courtis (1986) and Rutherford (2003), measuring risk as leverage and current ratio, did not find a strong relationship between risk and readability, but Smith et al. (2006), using similar measures, did find a direct relationship. In accord with the preponderance of the evidence, then, we examine our fifth hypothesis:
Among nonquantitative variables, Li (2010) called for examining changes in disclosures at times of management turnover. Jones (1988) tested the relationship between readability and qualitative variables, such as change of president, change of document title (chairman’s review vs. chairman’s report), and change of company-listing status (unlisted vs. listed). He was unable to form a conclusion about the influence of change of president, but he found that readability was influenced by document title and stock-market listing status. Considering these qualitative variables, then, we propose our final three hypotheses:
Readability Evolution in the Accounting Literature.

Readability Analysis
According to Jones and Shoemaker (1994), there are two types of content analysis: thematic analysis (i.e., content analysis), which examines the topics in a text, and syntactic analysis (i.e., readability analysis), which focuses on the difficulty of reading a text. Within this second type, two concepts can be distinguished: readability and comprehensibility (Smith & Taffler, 1992; Soper & Dolphin, 1964). Readability relates to the text’s inherent capability of being read quickly and easily (N. Schroeder & Gibson, 1990) whereas comprehensibility relates to the reader’s ability to understand a text and thus depends on characteristics of the individual reader. The former concept is text centered whereas the latter is reader centered (Jones, 1997). The tools most usually applied to measure both concepts are shown in Table 2.
Main Tools to Measure Readability and Comprehensibility.

Note. The Flesch formula (Flesch, 1948) is based on sentence length and number of syllables, the Dale–Chall formula (Dale & Chall, 1948) is based on sentence length and presence of “unfamiliar” words (as specified in a previously established list of words), the Fog formula (Gunning, 1952) is based on sentence length and presence of words with three or more syllables, the Fry graph (Fry, 1968) is based on plot of the average number of sentences and syllables, and the Lix formula (Björnsson, 1968) is based on sentence length and presence of words with more than six letters.
Readability formulas have been applied in a variety of technical reports in areas such as education, medicine, communication, politics, and law. Their implementation is not only simple, quick, and inexpensive (Courtis, 1987) but passive, so reader participation is not required (Jones, 1997). Most formulas are based on two variables—a word (semantic variable) and a sentence (syntactic variable)—that predict how readable a text will be (Courtis, 1986). The resulting scores can be interpreted against a scale of difficulty (Jones, 1997), and some formulas provide information about the amount of education that the reader should have for easy reading (N. Schroeder & Gibson, 1990). But several concerns have been raised about readability formulas. They do not take into account graphic design, how new concepts are incorporated and presented, the experience of an untrained reader, the differing difficulties of fragments within the same text (Courtis, 1987), the complexity of sentences (as opposed to the mere length of sentences), and the order of the words and their complexity (as opposed to mere length of words; McConnell, 1983). Selzer (1981) argued that these formulas cannot determine word difficulty or the causes of difficulty beyond the sentence level.
The cloze procedure for measuring comprehensibility consists of removing words from a text and later having readers complete these words (Taylor, 1953). This interaction between reader and text is the main advantage of the method. Among its disadvantages are the low frequency of its application as compared to that of readability formulas in accounting texts (Jones, 1997), the variation in its results depending on the reader, its inability to accommodate synonyms, the lack of consensus in its interpretation of results (Adelberg, 1979), the higher difficulty of applying it as compared to readability formulas (Jones, 1997), and the higher cost and longer time required for preparation (Flory, Phillips, & Tassin, 1992).
For objectivity and greater comparability with previous accounting research, this study focuses on readability (as equivalent to syntactical complexity). Table 3 shows the frequency of the readability formulas most commonly used in accounting literature. Clatworthy and Jones (2001) stated that the Flesch formula was the one most used in accounting studies. This prevalence still holds today, as Table 3 shows. In addition, the Flesch formula was the index used by previous studies analyzing readability evolution (see Table 1). The Flesch formula is both reliable and practical (Klare, 1974); therefore, mainly for comparability reasons, we use it in this study to measure readability. In multiple fields other than accounting, many researchers have relied on the Flesch formula as one of the simplest and most accurate measures of language difficulty (DuBay, 2007).
Frequency of the Readability Formulas Most Commonly Used on Accounting Texts.

Note. The full table listing the authors of these studies is available upon request.
aSome studies use more than one formula.
Method
Abu Bakar and Ameer (2011) called for longer periods of observation in order to link readability more firmly with various measures. For such longitudinal studies, the crucial problem is data availability. The two companies we analyzed had historical archives that preserved both narrative and financial information and were founded less than a year apart. In addition, their differences in size and activities will enhance the reliability of the results. Specifically, we analyzed the president’s letters of CEPSA from 1930 through 2012 and the management reports of El Alcázar from 1928 through 1992. CEPSA is a multinational oil company founded in 1929 (CEPSA, 1959) and currently active. It was a publicly traded company from 1929 to 2011, when International Petroleum Investment Company took over 100% of CEPSA. In 2011, FORBES 2000 ranked it 12th among Spanish companies and 535th in the world, with almost $30 billion in sales and nearly 12,000 employees. El Alcázar was a privately held, medium-sized brewery company located in Jaén (southern Spain); founded in 1928, it ceased to exist in 1993 after being merged into Cruzcampo (larger brewery). In 1990, with around 500 direct employees and $60 million in sales, it became the seventh largest Spanish brewery by production volume (Moreno & Cámara, 2014).
The president’s letter (analyzed here in the case of CEPSA) is the most read section of the annual report (Jones, 1988; Subramanian et al., 1993). It is part of the voluntary information included in the annual report of big companies and is often signed by the president of the company. The letter functions as an annual report summary (Balata & Breton, 2005) and explains where the company operates, what its strategies and values are, and what its current situation is. We have analyzed 81 president’s letters, dating from 1930 (the first year that the company prepared an annual report) to 2012, obtained from CEPSA Documentation Service (1930–2004) and CEPSA’s Web site (2005–2012). From 1936 to 1938, during the Spanish Civil War, only one letter was produced.
In contrast, smaller Spanish companies generally do not include a president’s letter in their annual reports, but quite similarly, they usually present a management report describing the most important events of the company during the period. The El Alcázar’s annual report included, along with quantitative statements, a document entitled Memoria, which came to be a management report containing nonstandardized, qualitative information related to the company’s main events each year. According to the Articles of Association, the Memoria was to be prepared by management at the company, provisionally approved by the board of directors, and finally approved by the shareholder general meeting. Spanish law did not refer to the management report until the Companies Act of 1951, which required an explanatory report, or Memoria, but did not regulate any minimum content. Not until 1989, with the reform of the Companies Act of 1951, was a minimum content specified for the management report, which replaced the previous Memoria. We have analyzed 59 management reports obtained through personal visits to the former Archive of El Alcázar (today Archive of Heineken España, SA in Jaén, 1957–1992) and to the Provincial Historical Archive of Jaén (1928–1956), where the oldest management reports were available. The management reports corresponding to the years 1934, 1950, and 1983 are missing, and no reports were produced from 1936 to 1938 because of the Spanish Civil War. Thus, we analyzed all the available management reports throughout the life of this company. Figure 2 contains an extract from a CEPSA president’s letter and from an El Alcázar’s management report.
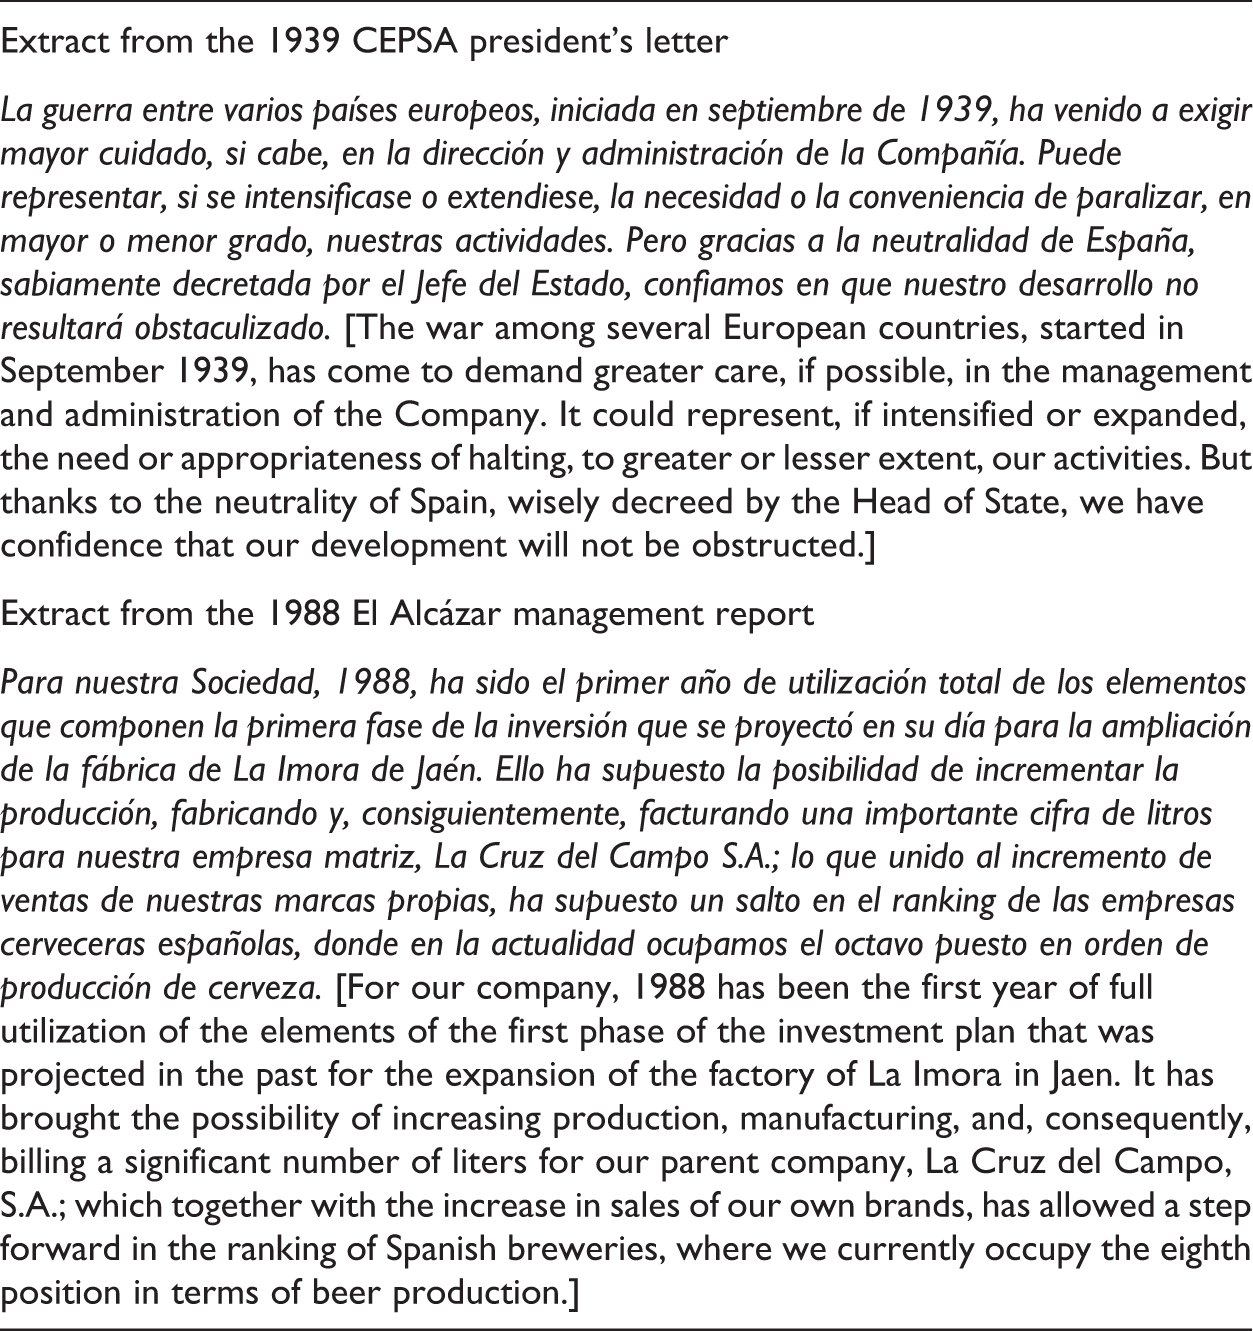
An extract from a CEPSA president’s letter and an El Alcázar management report.
Readability Measure
The Flesch reading ease formula (FREF) takes into consideration word length (number of syllables) and sentence length (number of words). The word factor measures semantic difficulty and recognition speed whereas the sentence factor measures the burden on short-term memory (Adelberg, 1979; Smith & Taffler, 1992). Here is Flesch’s (1948) formula: FREF = 206.835 − 0.846wl − 1.015sl, where wl (word length) = number of syllables per 100 words and sl (average sentence length) = average number of words per sentence. (p. 229)
To save time and effort, in the precomputer era, the formula was initially designed to be applied to samples of 100 words. But now it seems more reasonable to apply it to full texts (Smith, Jamil, Johari, & Ahmad, 2006). Thus, wl should be computed as the total number of syllables divided by the total number of words multiplied by 100. The score obtained, which varies between 0 and 100, ranks the text on a scale of reading difficulty. The shorter the words and sentences, the more readable the text is considered. Table 4 shows how Flesch scores correlate with levels of reading ease.
Flesch Formula Scores and Their Correlation With Levels of Reading Ease and Typical Magazines.

Note. The content is in the public domain. Adapted from Flesch (1948, p. 230).
The Flesch formula was designed for English texts, so a direct application to Spanish texts is not appropriate (Fernández Huerta, 1959; Rabin, 1988). First, anglophone words are shorter and therefore considered easier to read than are those derived from Latin (Jones, 1994). Second, because Spanish uses a higher number of words per sentence (Fialho et al., 2002), directly applying the original Flesch formula would result in lower scores, so negative values could be obtained for specialized texts (Ávila de Tomás & Veiga Paulet, 2002). Therefore, the original Flesch formula has been adjusted in order to apply it to texts in Spanish. There are two general adaptations: Fernández Huerta’s (1959), 206.84 – 0.6wl – 1.02sl, and Szigriszt Pazos’s (1992), 207 – 0.623wl – 1sl. The adaptation by Fernández Huerta (1959) is the one that is most often applied to texts in Spanish, especially texts related to health (Blanco Pérez & Gutiérrez Couto, 2002). But the coefficients of both adaptations are highly correlated. In this study, we have used Fernández Huerta’s (1959) adaptation because it is most like Flesch’s 1948 formula and has been more widely used in previous studies.
First, we transcribed the documents (president’s letters and management reports) into text files, one per year for each of the companies analyzed. Second, we cleaned the data in order to ensure a correct implementation even though the software used for the analysis, INFLESZ, is specially intended to apply the Flesch formula to texts in Spanish, offers adaptations by both Fernández Huerta (1959) and Szigriszt Pazos (1992), and is designed according to Flesch’s (1948) recommendations. In this cleaning, we removed amounts expressed in numbers and percentages, including dates expressed in numbers. We retained abbreviations that can be read syllabically (e.g., CAMPSA, CEPSA, PEMEX, ASESA) but removed acronyms that must be spelled in order to be read (e.g., BP, INH, PTA, SA, or PLC) and abbreviations such as Spanish equivalents for Mr., Mrs., and other terms (e.g., D., Vd., Ud., Sres., etc. art., or admón). We also removed symbols referring to measurement units (km, kg), chemical elements (Ag, C, Fe), mathematical operators (+, %), and currencies ($, €, £).
Third, we chose a sample and compared the results of a manual count with those provided by the INFLESZ software. For manual counting, we defined sentences as fragments of the text that are separated by a period or by a semicolon or colon, if the following fragment contained a verb or started with a capital letter. The results of the manual and software counts are highly correlated (over 94%), the differences being due to constructions containing a semicolon or colon, which INFLESZ always counts as two sentences. For both the manual and the software counts, hyphenated compounds were treated as single words. Finally, we applied the software to both sets of documents, manually checking for instances of semicolon and colon use in order to impose the manual criterion.
Testing Design
The readability scores will show whether these narratives are difficult to read (Hypothesis 1). To demonstrate readability evolution (Hypothesis 2), we graph the readability scores over time and perform a simple linear regression between time and readability. To test whether specific variables (size, profitability, risk, changes in president or general manager, changes in document titles, and change in company-listing status) influence readability (Hypotheses 3–8), we construct a multiple regression model in order to control for simultaneous influences of variables. For that purpose, following Rutherford (2003), we initially examined different potential proxy measures of the organizational variables analyzed, especially size and profitability, for which previous studies have used different proxies. Table 5 shows the variables and proxy measures that we examined and transformed, when necessary, to get a distribution nearer to normal.
Variables and Proxy Measures Examined.

Note. P = president; GM = general manager.
aConsumer Price Index based on Maluquer de Motes (2013). bSome cases are excluded because the original value of the measure is negative.
Size is measured by two variables, sales turnover (TURN) and total assets (TASS). Profitability is measured with six variables, return on assets (ROA), return on equity (ROE), net profit (NPRO), net profit to sales (NPTS), positive or negative net profit (PLNP), and increase or decrease in net profit from the previous year (IDNP). Risk is assessed with the leverage ratio (LEVE). Particular presidents (Ps, for CEPSA’s president’s letter) or general managers (GMs, for El Alcázar’s management report) are identified by dummy variables (P/GMi), one for every P or GM of the company. Difference in document title is also measured with dummy variables (TITLi), one for every different title used in the document series. Similarly, company status (STAT) is measured with a qualitative variable that distinguishes whether the company is listed or unlisted. This variable is used only for CEPSA because El Alcázar was never a listed company.
Table 6 shows the correlations between the measures that we finally selected and the other measures that we dropped in order to avoid multicollinearity in the model. Table 7 shows the summary distribution statistics for the measures selected for the model.
Selection of Proxy Measures and Exclusions Motivated by Correlations.

Note. TURN = sales turnover; TASS = total assets; ROA = return on assets; ROE = return on equity; NPTS = net profit to sales; NPRO = net profit.
***p < .001.
Summary Distribution Statistics for Selected Measures Before Transformation for the Measures Selected for the Model.

Note. FREF = Flesch reading ease formula; TURN = sales turnover; ROA = return on assets; PLNP = positive or negative net profit; IDNP = increase or decrease in net profit from the previous year; LEVE = leverage ratio; P = president; GM = general manager; TITL = title; STAT = company status.
aThis variable does not exist in this model.
Results
Figure 3 shows the readability evolution of the CEPSA (1930–2012) and El Alcázar (1928–1992) narratives. Of the CEPSA president’s letters, 76% are difficult to read, 15% are very difficult, and 9% are fairly difficult. The average score is 39 (difficult). Of El Alcázar’s management reports, 80% are difficult to read, 14% are fairly difficult, 3% are very difficult, and 3% have standard difficulty. The average score is 44 (difficult). Therefore, Hypothesis 1 is supported.
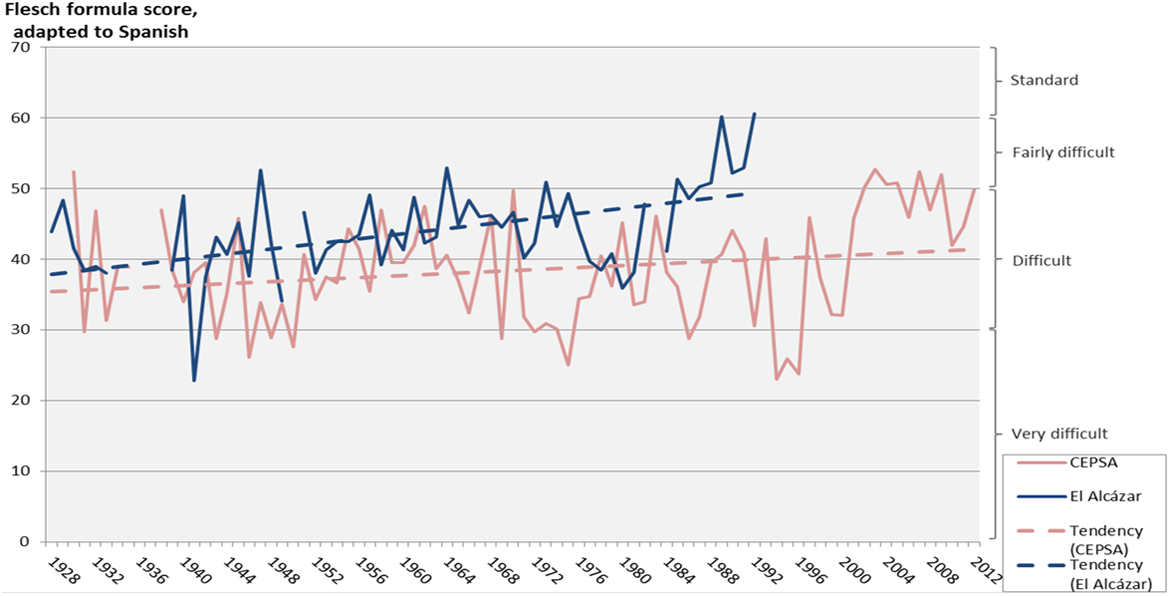
Readability evolution in CEPSA (1930–2012) and El Alcázar (1928–1992) narratives.
As Table 1 shows, the few previous studies of readability evolution showed a decrease in readability over time. In contrast, our results show an improvement in readability in both companies, which is a bit more noticeable in the case of El Alcázar (see Figure 3). 3 Our results, then, failed to support Hypothesis 2. In addition, as Figure 3 shows, the two companies’ documents are not equally readable. 4 Although the reports of El Alcázar (the smaller company) are easier to read than those of CEPSA (the bigger company), the differences in sectors and activities do not allow an inference connecting size with readability.
To formally test the relationship between readability and several organizational characteristics, including size, we used the multiple linear regression described in the previous section. Table 8 shows these correlation coefficients for the CEPSA president’s letters. The values of the significant correlations are not high. ROA (.400) has the strongest correlation with readability, in the expected direction, but we found no correlation between readability and the rest of the profitability measures. The correlation with TURN (.306) is contrary to our hypothesis suggesting there is no relationship between readability and size. We found no significant readability correlation with LEVE (risk), as expected. There are significant readability correlations with three of the presidents although only one (P6) is significant at the 1% level. We found two significant correlations with report titles, one of which (TITL3) is significant at 1‰. There is a correlation with listing status of the company, but it is significant only at 5% (the same correlation as for P8 but in the opposite direction; when that president occupied the post, the company became unlisted).
Correlation Coefficients Between Readability and Organizational Characteristics for the CEPSA President’s Letters.

Note. n = 79. TURN = sales turnover; ROA = return on assets; PLNP = positive or negative net profit; IDNP = increase or decrease in net profit from the previous year; LEVE = leverage ratio; P = president; GM = general manager; TITL = title; STAT = company status.
*p < .05. **p < .01. ***p < .001.
In the case of CEPSA, some variables were not entered into the multiple regression model. PLNP is a constant because CEPSA made profits during the whole period. P/GM1 is also considered a constant in respect to IDNP because P/GM1 is a dummy variable with value only in the first year, and IDNP has no value in this year. Because only k − 1 dummy variables for a qualitative variable with k categories can enter the model (and P/GM1 is not considered), P/GM2 and TITL1 were dropped. STAT was also removed because it correlates perfectly with P/GM8. Any significant relationship involving P/GM8 in the multiple regression model should be interpreted cautiously because it could also be attributed to STAT.
Table 9 presents the results for two versions of the multiple regression model for CEPSA readability: the full and the reduced model. The reduced model is a specification in which only the variables found significant via stepwise regression are retained, reducing the possibility of interactions between independent variables. The full model confirms the significance and the direction of TURN and ROA revealed previously by the correlation coefficients as well as the nonsignificance of LEVE. Of the presidents, only the third is significant. Changes in the report title do not show significant relationships with readability. Listing status is also not significant because the eighth president does not make a significant difference. The stepwise regression involves three reduced models. The first includes ROA, which was then leading the ability to explain readability. The second adds TURN and the third regression adds the second report title. Specific presidents/general managers are not included in the model. We therefore can conclude that size, measured by TURN, is positively related to readability, an unexpected finding. Among the profitability variables, ROA is positively related to readability, as expected, but IDNP is not related, which is unexpected. None of the rest of the variables (although one president and one report title show weak relationships) show strong enough relationships to link them with readability. This finding was expected for risk but unexpected for the rest of the variables.
Multiple Regression Model for CEPSA Readability.

Note. TURN = sales turnover; ROA = return on assets; IDNP = increase or decrease in net profit from the previous year; LEVE = leverage ratio; P = president; GM = general manager; TITL = title.
aStepwise regression. Probability of F to enter ≤ .05; probability of F to remove ≥ .10.
*p < .05. **p < .01. ***p < .001.
Table 10 shows the correlation coefficients between readability and organizational characteristics for the El Alcázar’s management reports. The values of the significant correlations are moderate. The highest correlation is with TURN (.531) and, as was the case with our finding for the CEPSA letters, this finding is contrary to our hypothesis suggesting that there is no relationship between readability and size. The next strongest correlation is with LEVE (.472). Here again this finding contradicts our hypothesis based on previous studies that found no correlation between risk and readability and also the obfuscation hypothesis, which associates higher debts with poor readability. Also contrary to our expectations, we found no correlation with any of the proxies for profitability. There are significant correlations with most of the general managers, as there are for the CEPSA presidents. The title is also significant, as we expected.
Correlation Coefficients Between Readability and Organizational Characteristics for the El Alcázar’s Management Reports.

Note. n = 57. TURN = sales turnover; ROA = return on assets; PLNP = positive or negative net profit; IDNP = increase or decrease in net profit from the previous year; LEVE = leverage ratio; P = president; GM = general manager; TITL = title.
*p < .05. **p < .01. ***p < .001.
As in the CEPSA model, some variables were not entered into the multiple regression model for El Alcázar. In this case, five different people occupied the post of general manager, and P/GM1 was removed from the model. Two different titles are identified, and TITL1 was dropped. STAT was also not considered because El Alcázar experienced no change in status during the period analyzed.
Table 11 presents the results for two versions (full and reduced) of the multiple regression model for El Alcázar. The full model shows no significant relationship with any of the independent variables. But in the stepwise regression, TURN, first and significant at 1‰, and P/GM5, significant only at 5%, enter the model. The differences between the full model and the reduced model might indicate that when we increase the number of nonsignificant measures in the model, the importance of TURN (and to a lesser degree P/GM5) is distorted, which explains the differences in adjusted R2. If with only one measure (TURN), we get an adjusted R2 of .269 and with two (TURN and P/GM5), we get an adjusted R2 of .336, the progressive inclusion of additional variables will increase the explanation of readability by only negligible increments because the full model has an adjusted R2 of .346. Thus, of the company characteristics tested, size is the only variable significantly related to readability, which is an unexpected finding. Another unexpected finding is that profitability is not related to readability. As expected, risk is not related to readability. And contrary to our expectations, we found no relationship with report titles and little relationship with general managers (because only one general manager is found significant at only 5%).
Multiple Regression Model for El Alcázar Readability.

Note. TURN = sales turnover; ROA = return on assets; PLNP = positive or negative net profit; IDNP = increase or decrease in net profit from the previous year; LEVE = leverage ratio; P = president; GM = general manager; TITL = title.
aStepwise regression. Probability of F to enter ≤ .05; probability of F to remove ≥ .10.
*p < .05. **p < .01. ***p < .001.
In sum, the results of the multiple regression model for both companies show a solid positive relation between size and readability; thus, Hypothesis 3 is not supported. Our results do not point to a consensus regarding profitability. For El Alcázar, none of the profitability measures has a significant relationship with readability, but for CEPSA the results are mixed. Although in the case of CEPSA, the one relationship between any profitability measure (ROA) and readability is strong, prudence suggests that this single relationship is not solid enough to support Hypothesis 4. Both regression models, however, agree that there is not a significant relationship between risk and readability; therefore, Hypothesis 5 is supported.
Regarding the influence of management turnover, in the period analyzed, eight different people occupied the presidency of CEPSA and five different people occupied the general manager post at El Alcázar. Apart from a couple slightly significant cases, no overall pattern of significant relationships between readability and a change in the company’s president or general manager appears, so Hypothesis 6 is not supported. The results were similar regarding different report titles. In the case of CEPSA, we identified three different titles for the president’s letter: 1930–1971, “no title”; 1972–1987, “Presentation”; and 1988–2004, “President’s Letter.” In the case of El Alcázar, we identified only two different titles: 1928–1989, “Report” (Memoria), and 1990–1992, “Management Report” (the test of this variable in the case of El Alcázar is perhaps not very significant because the period of the second title comprises only three documents). Although we found a weak relationship in one case for CEPSA, in general, the regressions do not show relationships between titles and readability, so Hypothesis 7 is not supported. Finally, we could account for listed or unlisted status only for CEPSA, and even though STAT was dropped from the model because it was perfectly correlated with P/GM8, the nonsignificance of P/GM8 indicates that Hypothesis 8 is not supported.
Discussion
In accord with previous research in anglophone contexts (Clatworthy & Jones, 2001; Smith & Taffler, 1992), our results show that the annual reports analyzed are difficult to read. Thus, if readability proxies the level of secrecy–transparency, the different cultures or legal systems do not seem to have a significant effect. But in contrast to the few previous studies on readability evolution (Courtis, 1995; Dolphin & Wagley, 1977; Jones, 1988), we have found an improvement in readability in both companies. According to Gray (1988) and Doupnik and Salter (1995), one possible explanation for this opposite finding could be the different language and cultural contexts (Li, 2008; Subramanian, Insley, & Blackwell, 1994). But we can further this explanation. The previous studies analyzed much shorter periods of time. The only one that covers a long period is Jones’s (1988) study. In fact, if we narrow our observation period to that analyzed by Jones, 1952–1985, our findings change substantially, showing a decrease in readability for CEPSA and a stable trend for El Alcázar—results that are more similar to previous results. That is, the observation period seems more relevant than the different cultures or legal systems to readability evolution. If we consider the full period, we might reasonably assume that the level of public exposition was higher at the end of the 20th century than at the beginning; the increasing number of stakeholders over the years (David, 2001) and the increasing role of annual reports in promoting public relations (Ditlevsen, 2012), then, are likely factors that made the authors of these narratives favor clearer language.
We found a positive relationship between company size and readability. This finding contradicts previous research: Courtis (1995, 2004) and Rutherford (2003) found no relationship, and Li (2008) suggested that big companies have more complex operations to report and thus produce more complex narratives. In contrast, our results are more in line with research arguing that the quality of disclosure (albeit not directly related to readability) is higher in big or public companies than in small or private companies 5 (Ball & Shivakumar, 2005; Singhvi & Desai, 1971).
Some previous researchers found a positive relationship between readability and profitability, supporting impression-management premises (Dempsey et al., 2012; Li, 2008), but others found no relationship (Courtis, 1986, 1995; Smith et al., 2006). Our literature review section has offered some possible explanations for these mixed results. Although we found a partial relationship for one of our two companies, our results generally are not strong enough to support a solid relationship between profitability and readability. Further, to reach conclusive results on this question, homogeneous research is needed that uses the same profitability proxies in a multivariate analysis with a reasonable number of control variables and that takes into account the cultural context. Regarding risk, our results agree with most of the previous evidence: There is no relationship with readability, contrary to the obfuscation hypothesis (Courtis, 1995).
None of the qualitative variables (identity of president or general manager, report title, or listing status) were significant. This finding contrasts with those of Jones (1988), who found both title and status significant and could not reach a solid conclusion about the significance of the president. As for the change in company heads, especially at CEPSA, the presidents remained for a long time on the board of directors in different posts, such as vice president or honorary president, so the changes were not substantial. Regarding the report title, Jones (1988) initially anticipated no relationship between readability and a change in report title because the material was substantially the same throughout the analysis period. Listing status varied in only one company and, for that company, in only 2 years (2011–2012), so more research is needed to confirm this finding.
The only factor that we found significant was size, measured as TURN, and for both companies, it explains only a small part of readability. Then what accounts for the rest of the variability? Rutherford (2003) suggested that it may be attributable to differences in corporate culture or company activities although, in relation to the former, our results show a substantial variability inside single companies, and in relation to the latter, Courtis (1995) had limited success in finding differences based on industrial classification. Rutherford (2003) also pointed out that obfuscation may consist more in omitting a topic or making false statements than in textual complexity; similarly, what Gray (1988) called secrecy–transparency might be unrelated to readability.
We are aware of the face validity problems of readability formulas (Jones & Shoemaker, 1994). Stone and Parker (2013) raised some concerns about the Flesch index although most of them also apply to other readability formulas. But our use of the Flesch index is justified because it (a) provides comparability with previous analyses of readability evolution (Courtis, 1995; Dolphin & Wagley, 1977; Jones, 1988; Lewis et al., 1986), (b) is the index most used for accounting studies in general, and (c) is one of the few formulas that have been adapted for and previously tested on Spanish texts (Fernández Huerta, 1959). In any case, because our main objective is related to readability evolution, we are more interested in the relative values of readability than in the absolute value of the index although we do state that the narratives are difficult to read. We also recognize that over such a long period of study, a number of contextual variables may affect the evolution of annual reports, such as different political regimes, a rise in the cultural level of the population or even the evolution of the language itself. But all of such factors are impossible to control for in any longitudinal study.
Footnotes
Acknowledgments
This article has benefited from comments given on earlier drafts at the 9th International Research Seminar on Accounting History held in Seville, Spain, in 2014; the 18th Financial Reporting and Business Communication Annual Conference held in Bristol, UK, in 2014; and the 20th Workshop on Accounting and Management Control “Memorial Raymond Konopka” held in Segovia, Spain, in 2015. We would especially like to thank Mike Jones, University of Bristol, and Manolo Cano, Universidad de Jaén, for their many constructive comments. We are also grateful to Charles Kostelnick and the three anonymous reviewers for their help in improving this article.
Declaration of Conflicting Interests
The authors declared no potential conflicts of interest with respect to the research, authorship, and/or publication of this article.
Funding
The authors disclosed receipt of the following financial support for the research, authorship, and/or publication of this article: This research was partially funded by the SEJ 6828 project from the Junta de Andalucía, Spain.