



Abstract
Background:
Poorly differentiated thyroid carcinoma (PDTC) and anaplastic thyroid carcinoma (ATC) are aggressive thyroid cancers with limited treatment options and poor prognosis. While the tumor microenvironment (TME), especially cancer-associated fibroblasts (CAFs), is known to support tumor growth, its metabolic role is not well understood. This study aimed to investigate the role of type 2 deiodinase (D2)—an enzyme converting thyroxine to active triiodothyronine (T3)—in sustaining a pro-tumorigenic TME in PDTC and ATC.
Methods:
We analyzed D2 expression in both thyroid cancer epithelial cells and CAFs, including inflammatory CAFs (iCAFs), using murine and human PDTC/ATC models. Functional relevance was assessed through pharmacological inhibition of D2 in mouse xenograft models and coculture three-dimensional (3D) spheroids. The effects on tumor growth, CAF composition, and epithelial–stromal signaling were evaluated. In addition, human PDTC-derived organoids were used to test responsiveness to thyroid hormone (TH) modulation.
Results:
D2 was found to be highly expressed in CAFs, particularly iCAFs, exceeding levels observed in cancer epithelial cells. In vivo inhibition of D2 led to reduced tumor growth and changes in CAF profiles and activation. In 3D coculture spheroids, D2 activity was essential for tumor cell proliferation via a paracrine loop that enhanced local TH signaling. Human PDTC organoids expressing D2 also responded to TH modulation, confirming a positive effect of T3 on tumoral growth in this context.
Conclusions:
We identified D2 as a key mediator of stromal–epithelial cross talk in PDTC and ATC and highlight local TH metabolism as a potential therapeutic target in these lethal cancers.
Keywords
Introduction
Well-differentiated thyroid cancers (Papillary Thyroid Carcinoma [PTC] and Follicular Thyroid Carcinoma [FTC]) may evolve into the aggressive poorly differentiated thyroid carcinoma (PDTC) and anaplastic thyroid carcinoma (ATC).1,2 The tumor microenvironment (TME) plays a key role in PDTC/ATC progression.3–5 Among stromal components, cancer-associated fibroblasts (CAFs) promote tumor growth, angiogenesis, and extracellular matrix (ECM) remodeling. CAF subsets include myofibroblastic CAFs (myCAFs; ECM-remodeling), inflammatory CAFs (iCAFs) (cytokine-secreting), and antigen-presenting CAFs (MHC II–CD4+ T cell modulating, Major Histocompatibility Complex II and CD4-positive T lymphocytes respectively).6,7 In ATC, CAFs are abundant and predominantly exhibit an activated iCAF phenotype, 8 although their interactions with tumor cells remain poorly understood.
An emerging and underexplored aspect of the TME is the regulation of local thyroid hormone (TH) metabolism and signaling. THs—thyroxine (T4) and its biologically active form triiodothyronine (T3)—are critical regulators of metabolism, proliferation, and differentiation. 9 The local conversion of T4 to T3 is catalyzed by type 2 deiodinase (D2) enzyme, which is expressed in specific cells—including fibroadipogenic progenitors (FAPs)—in selected tissues and several cancers.10,11 In contrast, type 3 deiodinase (D3) inactivates T4 and T3, reducing local TH availability.12,13 The balance between D2 and D3 expression governs the intracellular T3 concentration, and this is their only known function. 14
We and others have shown that early-stage epithelial tumors, such as basal cell carcinoma 15 and colon cancer, 16 display high D3 and low D2 expression, leading to localized intracellular hypothyroidism. As these tumors progress, D3 typically declines and D2 expression increases, suggesting a dynamic metabolic reprogramming that favors T3-driven tumor growth at advanced stages. 16
Similarly, in PTC—particularly BRAF-mutant tumors—D3 is upregulated, 17 while D2 is suppressed versus healthy thyroid tissue, likely contributing to an intracellular hypothyroid microenvironment. Conversely, immortalized ATC cells express high D2, which we previously showed to support their survival. 18 Notably, TP53 inactivation—a hallmark of many PDTC/ATC—enhances D2 expression in advanced thyroid and skin cancers.18–20
Here, we investigated the role of D2 in PDTC/ATC, focusing on its expression and function in both tumor cells and CAFs. Using mouse models and patient-derived organoids, we show that D2 is expressed in epithelial cells and—more prominently—in CAFs. We propose that D2-driven local TH signaling sustains the phenotype of aggressive thyroid tumors, representing a novel metabolic axis within the TME that could be therapeutically exploited.
Materials and Methods
Animals
Animals were housed in the animal facility at CEINGE Biotecnologie Avanzate, Naples, Italy. Tg: B6N.Cg (Pdgfrα-cre/ERT)467Dbe/J, Pdgfrαtm11(EGFP)Sor/J and nude mice (NU/NU-CD1) were purchased from Charles River Stock No. 18280 and 086, respectively. LSL-BrafV600E/TPO-Cre/eYFP/TP53lox-lox (ATC) mice were a generous gift from Dr. Fagin at the Memorial Sloan Kettering Cancer Center in New York. These mice express endogenous levels of the mutated BRAF oncoprotein in thyroid follicular cells at E14.5. Dio2lox-lox were generated in our laboratory 21 and crossed with the Pdgfrα-cre/ERT as described. 22 Both sexes were used for experiments as indicated. Animals were genotyped by PCR using tail DNA.
Animal study approval
All animal studies were conducted in accordance with the guidelines of the Ministero della Salute and were approved by the Institutional Animal Care and Use Committee (IACUC: 167/2015-PR and 354/2019-PR).
Animal procedures
Tamoxifen (Tmx) (Sigma Aldrich, T5648) was dissolved in corn oil (Sigma Aldrich, C8267)/10% ethanol (Carlo Erba, #4146052) at a concentration of 10 mg/mL. Pdgfrα-cre/ERT/Dio2lox-lox mice were injected intraperitoneally with Tmx for five consecutive days (80 mg/Kg of body weight) for experiments involving inducible CreERT2 and preCAFs isolation.
Statistical analysis and data graphing
Significant differences were calculated using ANOVA, and t-tests with p < 0.05 were considered as statistically significant. All statistics and graphics were performed using GraphPad Prism 9. In all figures, error bars represent the SEM. A value of p < 0.05 was considered significant (*p < 0.05; **p < 0.01; ***p < 0.001).
Results
D2 expression dynamics and cellular distribution during thyroid cancer progression
To investigate the expression of deiodinases during thyroid cancer progression, we used a mouse model of ATC (TPO-Cre/LSL-BrafV600E/p53lox-lox/eYFP)23,24 (Fig. 1A). At early stages (6–8 weeks), when thyroids reached approximately 50 mg and histology resembled PTC, D3 was the dominant deiodinase (Fig. 1B–E). However, by 18–20 weeks, when thyroids exceeded 100 mg and displayed PDTC/ATC features, D2 expression increased substantially, while D3 levels decreased (Fig. 1B–E and Supplementary Fig. S1A, B), indicating an inverse regulation of D2 and D3 during tumor dedifferentiation and progression.

D2 is expressed in distinct cell populations within thyroid tumors. (
To determine the cellular source of D2, epithelial (YFP+) and nonepithelial (YFP−) cells from 20-week tumors were separated via fluorescence-activated cell sorting (FACS) (Fig. 1F). YFP+ cells made up approximately 15% and YFP− cells approximately 60% of viable cells (Fig. 1G). Dio2 mRNA was found in both populations but was about three times higher in YFP− cells (Fig. 1H), suggesting predominant D2 expression in nonepithelial cells in these advanced tumors.
Analysis of publicly available single-cell RNA-sequencing data from human ATC confirmed that D2 is highly expressed in CAFs, particularly iCAFs, with minimal expression in myCAFs (Fig. 1I). 25 This is consistent with Dio2 expressed in FAPs from healthy mouse muscle, 26 a stromal cell population capable of generating CAFs, hereafter termed preCAFs.7,27
To better define the nonepithelial population expressing D2, we isolated, by FACS analyses, Sca1+ cells (Stem Cell Antigen-1, a CAF marker) and YFP+ epithelial cells from 20-week tumors (Fig. 1J). At this stage, Sca1+ cells constituted approximately 60% of viable cells (Fig. 1K) compared with approximately 30% at 6–8 weeks (PTC phase) (Supplementary Fig. S1C, D), indicating a marked TME remodeling. Dio2 was enriched in the Sca1+ CAFs, at levels about thrice higher than in epithelial cells (Fig. 1L). These cells were identified as iCAFs due to strong expression of markers like Col1a1 and IL6 (Fig. 1I, M, N) and absence of the myCAF marker ACTA2 (Alpha Smooth Muscle Actin, αSMA) (Fig. 1I and Supplementary Fig. S1E). Notably, iCAF markers were almost undetectable at early tumor stages and in healthy thyroids (Fig. 1L–N), reinforcing the dynamic change in CAF subpopulations and deiodinase expression during tumor progression.
To test whether other nonepithelial/non-CAF cells (e.g., tumor-associated macrophages [TAMs] and CD45+ leukocytes) contribute to D2 expression, Dio2 levels were analyzed in the YFP−/Sca1− population at 20 weeks. Dio2 was present at levels approximately 2.5 times higher than in epithelial cells (Fig. 1L), suggesting that additional nonepithelial cell types also contribute to intratumoral D2 expression.
D2 inhibition alters the composition of CAFs in ATC xenograft tumors
To investigate the role of D2 in both epithelial and mesenchymal components of ATC in vivo, we performed xenograft experiments using human ATC 8505 cells, which express D2. 18 Cells were subcutaneously injected into nude mice, and tumors were monitored and harvested 8 weeks postinoculation (Fig. 2A). To distinguish human DIO2 expression (originating from the human 8505 cells) from potential host-derived murine Dio2 expression, we designed species-specific oligonucleotides (Supplementary Fig. S2A, B).
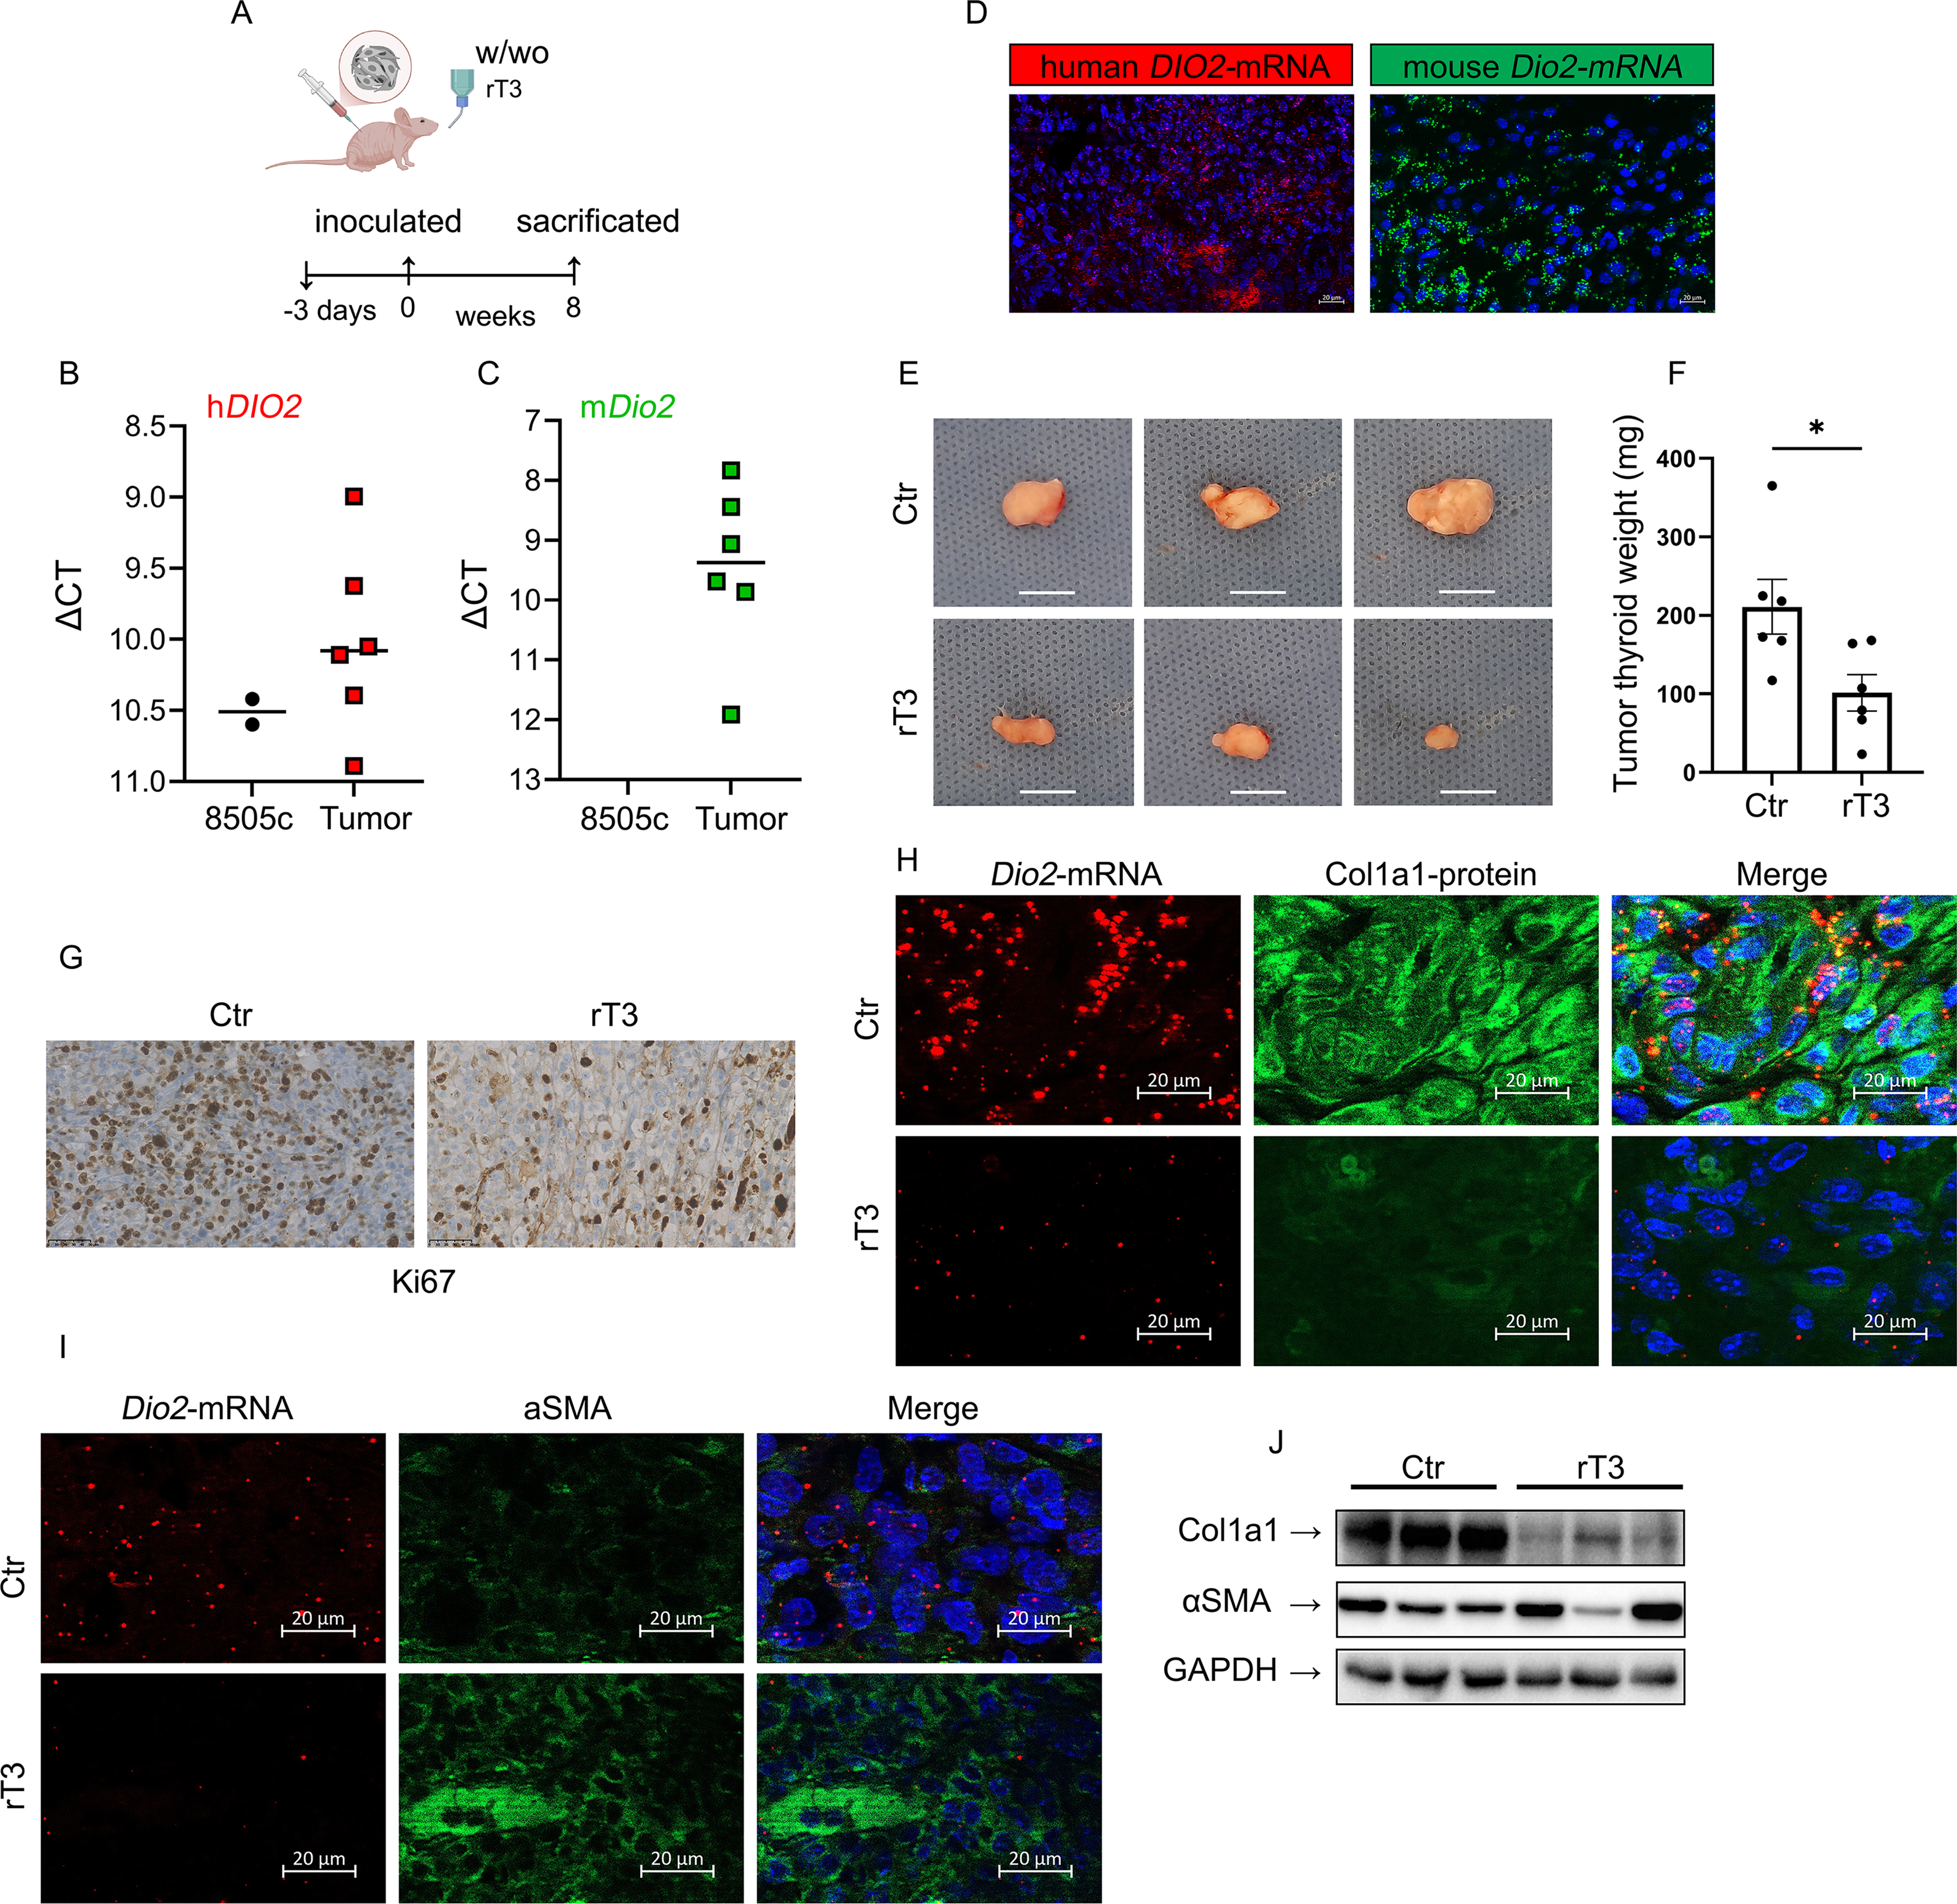
Effects of D2 inhibition on thyroid tumor xenografts. (
First, we observed that human DIO2 expression is maintained in ATC tumors in vivo compared with the in vitro levels in 8505 cells, but with a much higher variability in vivo (Fig. 2B). Notably, mouse Dio2 mRNA was also abundantly expressed in the xenograft tumors (Fig. 2C), suggesting recruitment of host-derived stromal cells expressing Dio2. By RNAscope analysis, we found that human and murine D2 mRNA showed different localization patterns within the tumors. Human D2 mRNA was enriched in the central tumor region, whereas mouse D2 mRNA was prominent at the tumor periphery (Fig. 2D and Supplementary Fig. S2C).
To explore the functional role of D2 in vivo, we treated mice with orally administered reverse-T3 (rT3), a known enzymatic inhibitor of D2, with no activity at the TH receptor level (Fig. 2A). After 8 weeks, mice were sacrificed and tumors collected. Tumors from rT3-treated mice were significantly smaller than those from vehicle-treated controls (Fig. 2E,F), indicating that D2 promotes ATC growth. Untreated tumors exhibited classical high-grade PDTC/ATC features, including nuclear pleomorphism, high mitotic rate, necrotic areas, and disorganized architecture (Fig. 2G and Supplementary Fig. S2D–H). Tumors from D2-inhibited rT3-treated mice appeared more organized, with reduced nuclear pleomorphism, mitotic rates (Supplementary Fig. S2D, E), and reduced Ki-67 staining (Fig. 2G and Supplementary Fig. S2F), indicating a decreased proliferation rate.
Next, we analyzed the role of D2 in determining the composition of CAFs in ATC xenograft tumors. Using a dual RNAscope/immunofluorescence staining, we found that mouse Dio2 mRNA signal was mostly localized with Col1a1 protein staining (a marker of iCAF) (Fig. 2H). Interestingly, D2-inhibition with rT3 resulted in decreased Col1a1 mRNA and protein expressions, whereas aSMA (which marks the myCAF) was largely unaffected (Fig. 2H–J).
Collectively, these findings indicate that D2 expression marks the iCAF, but not myCAFs, population within the ATC tumor. Blocking D2 impairs tumor growth and selectively alters CAF composition by reducing the iCAFs.
Role of D2 in CAFs in heterotypic spheroids
To get insight into the functional role of D2 in CAFs, we established heterotypic 3D spheroid cultures composed of human ATC 8505 cells and mouse primary FAPs freshly isolated from healthy limb muscle (preCAFs, i.e., CAF precursors) 28 at a 1:3 ratio (see Supplementary Material and Methods and Supplementary Fig. S3A, B). This 3D cell system was mandatory, as D2 expression was completely lost after 7 days in preCAFs kept in two-dimensional (2D) monolayer culture 22 (Supplementary Fig. S3C).
When heterotypic spheroids (8505 cells/preCAFs) were kept in 3D culture, they exhibited a significantly enhanced linear growth compared with mono-type spheroids consisting of ATC 8505 cells (Supplementary Fig. S3D), indicating growth cooperative interactions in the spheroids between epithelial and mesenchymal cells. Moreover, treatment with rT3 significantly reduced the growth of heterotypic 8505/preCAF spheroids compared with the mono-type 8505 spheroids (Fig. 3A–C). Notably, mono-type preCAF spheroids showed a nonsignificant proliferation, which was not affected by rT3 (Fig. 3A).
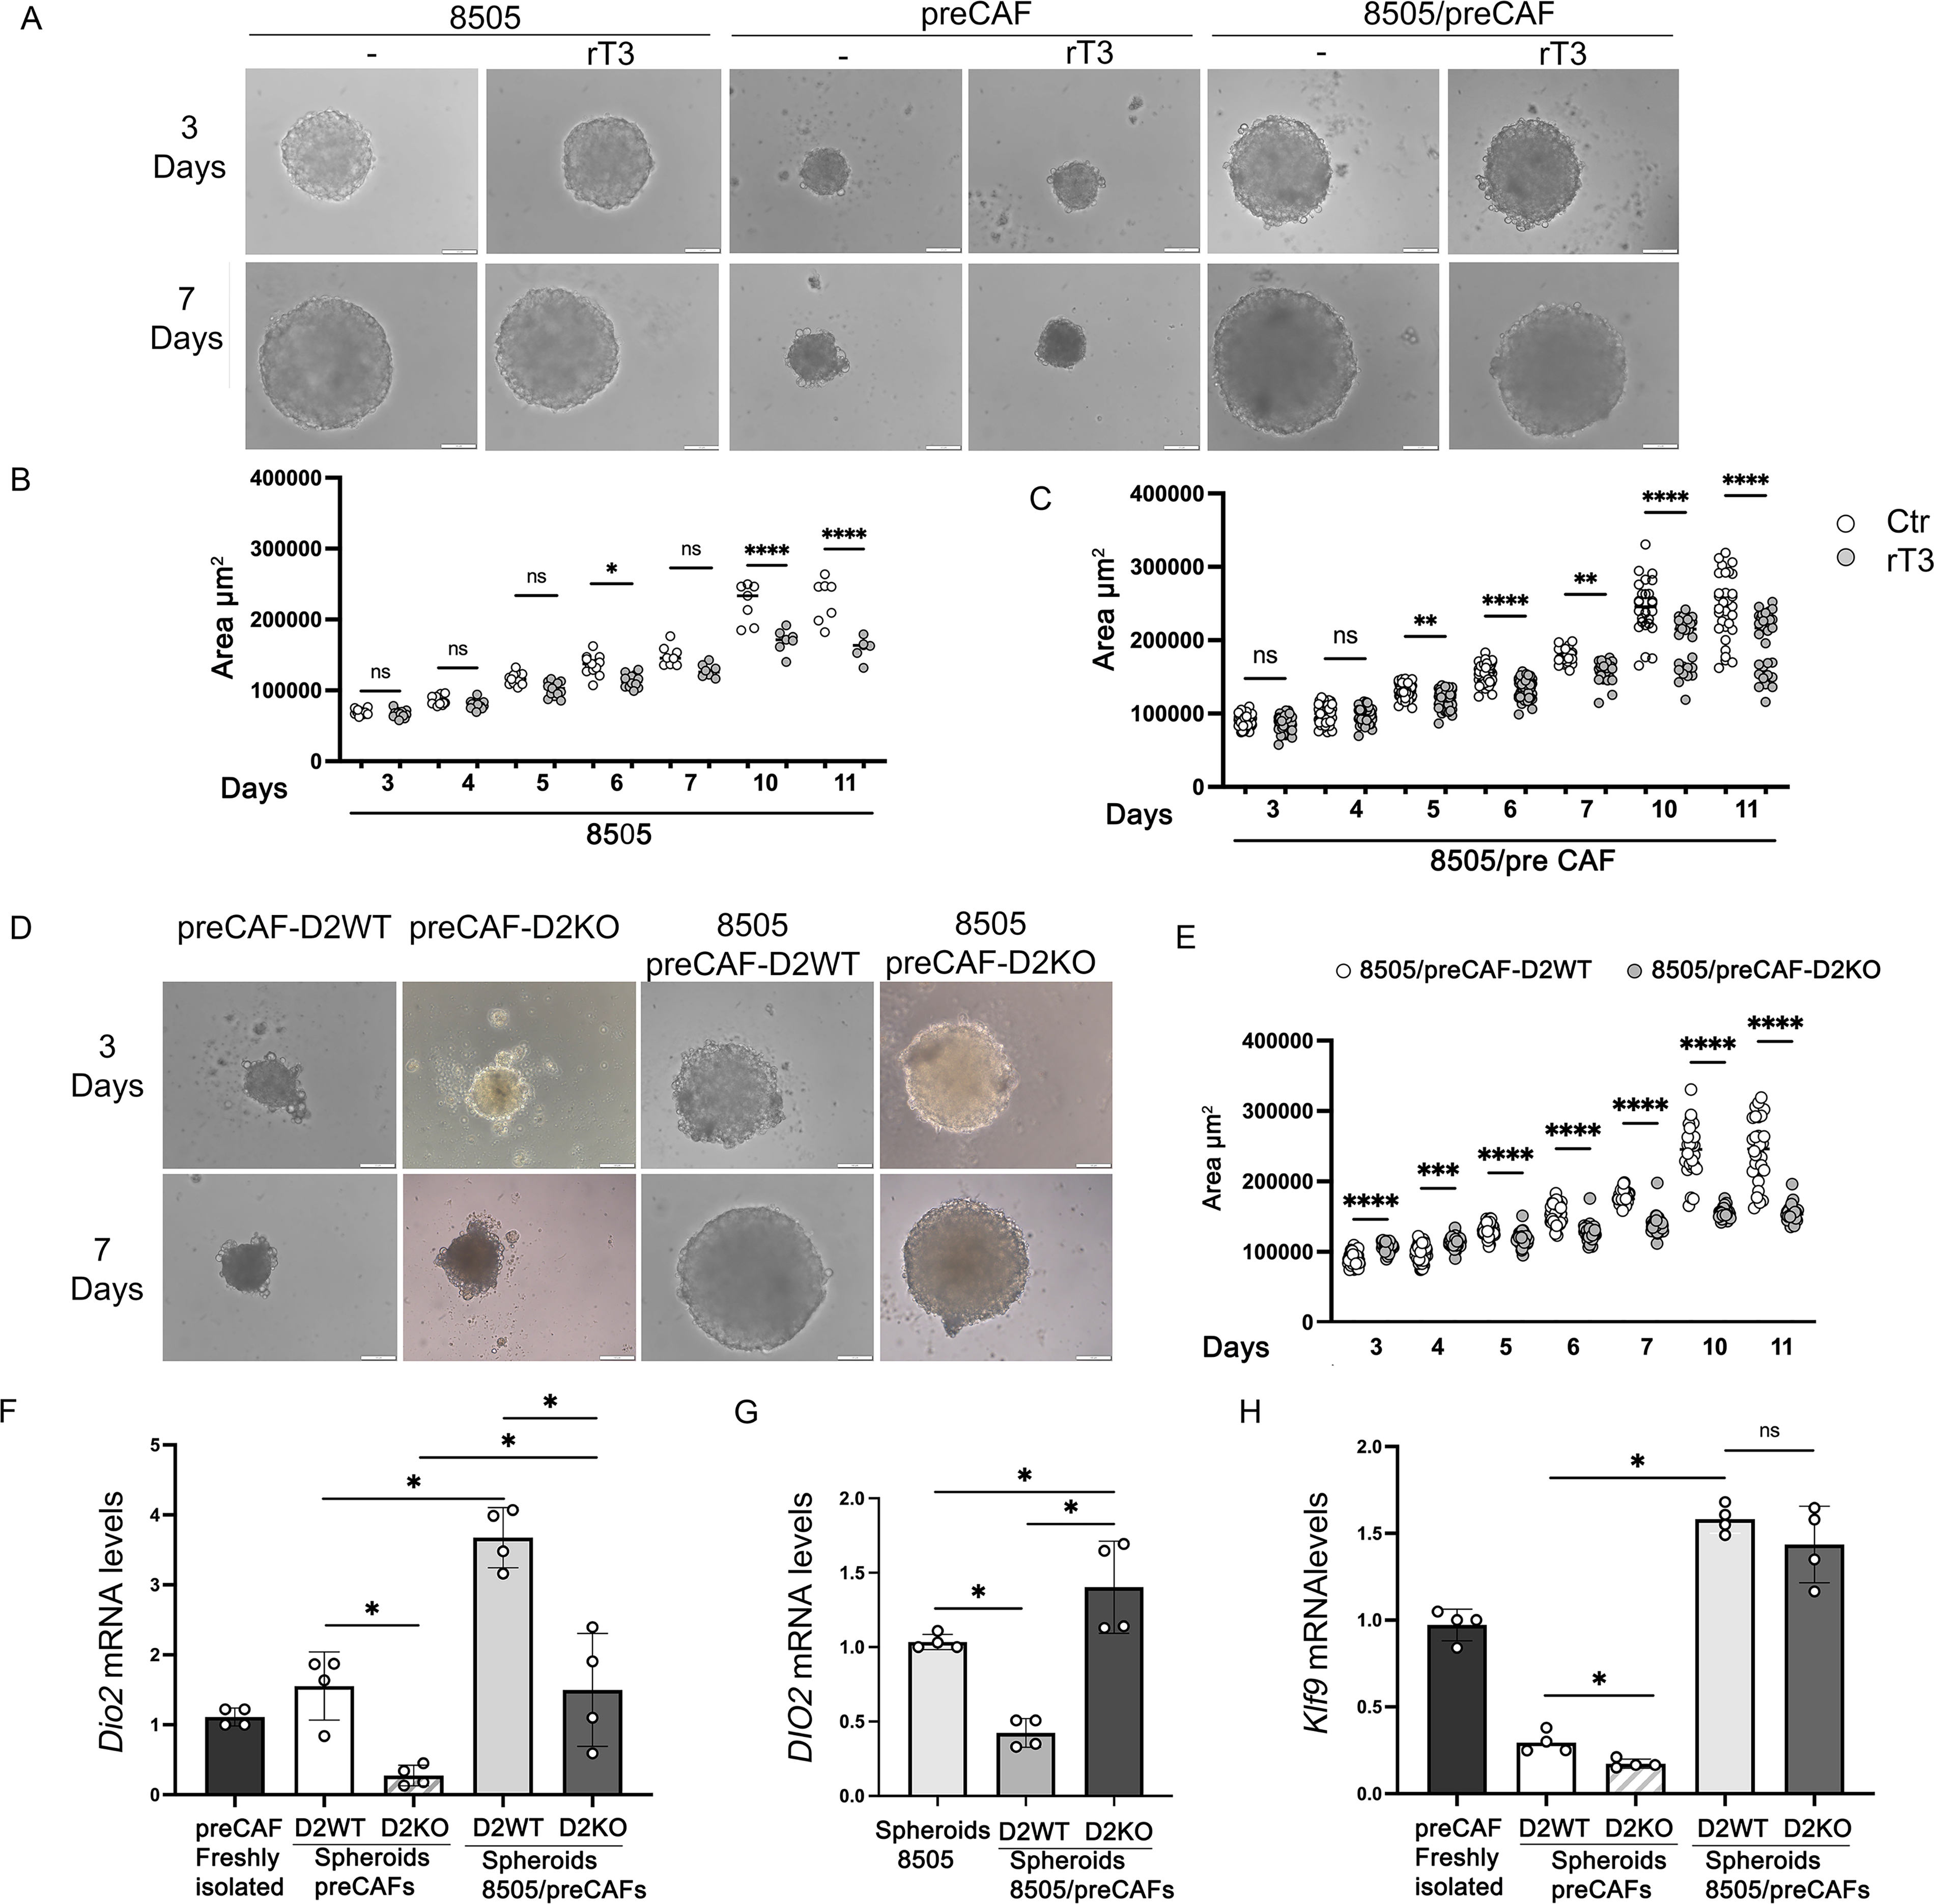
Role of D2 in CAFs within heterotypic spheroids. (
To specifically assess the role of D2 expressed in the preCAFs population in the spheroid’s growth, we generated heterotypic spheroids using ATC 8505 cells and either D2 wild-type (preCAF-D2WT, used in the previous experiments) or D2 knockout preCAFs (preCAF-D2KO), in which Dio2 was genetically deleted ex vivo in freshly isolated preCAFs (see Supplementary Materials and Methods). Consistent with the pharmacological D2 inhibition with rT3 (Fig. 3A), Dio2 genetic deletion in preCAFs did not affect their own growth in mono-type spheroids (Fig. 3D). However, heterotypic spheroids containing ATC 8505/preCAF-D2KO cells grew significantly less than those with preCAF-D2WT, demonstrating that the cell-specific deletion of D2 in CAFs (with normal D2 in ATC 8505 cells) reduces tumor cell proliferation and overall spheroid expansion (Fig. 3D, E).
We next examined the regulation of human and mouse D2 expression in cocultured spheroids (Fig. 3F, G). In ATC 8505/preCAF-D2WT spheroids, mouse Dio2 expression was significantly upregulated in preCAFs upon coculture with ATC 8505 cells, compared with preCAF-D2WT cultured alone (Fig. 3F). This induction was functionally relevant, as shown by the increased expression of mouse Klf9, a well-known TH-responsive gene (Fig. 3H), suggesting that preCAFs acquired enhanced TH signaling upon interaction with ATC tumor cells.
Interestingly, human DIO2 expression in ATC 8505 cells was reduced in the presence of D2-expressing preCAFs (Fig. 3G). This downregulation was not observed in spheroids with preCAF-D2KO cells, supporting the hypothesis of a reciprocal D2 balance in TME (Fig. 3F–H).
Overall, these data suggest that a finely tuned D2 expression between ATC 8505 and preCAF is part of the cross-talk between the epithelial and stromal components, which is necessary for tumor growth.
Effects of D2 inhibition on human PDTC/ATC-derived organoids
Having established a role for D2 in promoting ATC growth through epithelial–mesenchymal interactions in experimental models, we sought to determine whether similar mechanisms operate in human tumors. To this end, we analyzed DIO2 mRNA expression in advanced thyroid cancer from three consecutive patients, including two with poorly differentiated and one with the tall cell variant of PTC, surgically resected at our institution (Fig. 4A, Supplementary Table S1, and Supplementary Fig. S4). All patients were male, aged between 59 and 78 years; two had stage IVB cancer, and one had stage II cancer. Among these tumors, DIO2 was detected in the 2 PDTCs (#1 and #2), with an expression level exceeding that of healthy thyroid tissue used as a reference (Supplementary Fig. S4A), while absent in the tall cell PTC. The expression of the other deiodinases (DIO1 and DIO3) was extremely variable among the tumor samples (Supplementary Fig. S4B, C), while thyroid-differentiation markers TG, TPO, PAX8, NIS, and TTF1 (also known as NKX2.1) were reduced in all tumors compared with healthy thyroid tissue (Supplementary Fig. S4D–H). The presence of DIO2 mRNA was further validated by RNAscope, which showed specific DIO2 mRNA signals in DIO2-positive tumors (Supplementary Fig. S4I). The expression of D2 in PDTC samples agrees with in silico data showing the highest expression of DIO2 mRNA in PDTCs while absent in PTCs (Supplementary Fig S4J).
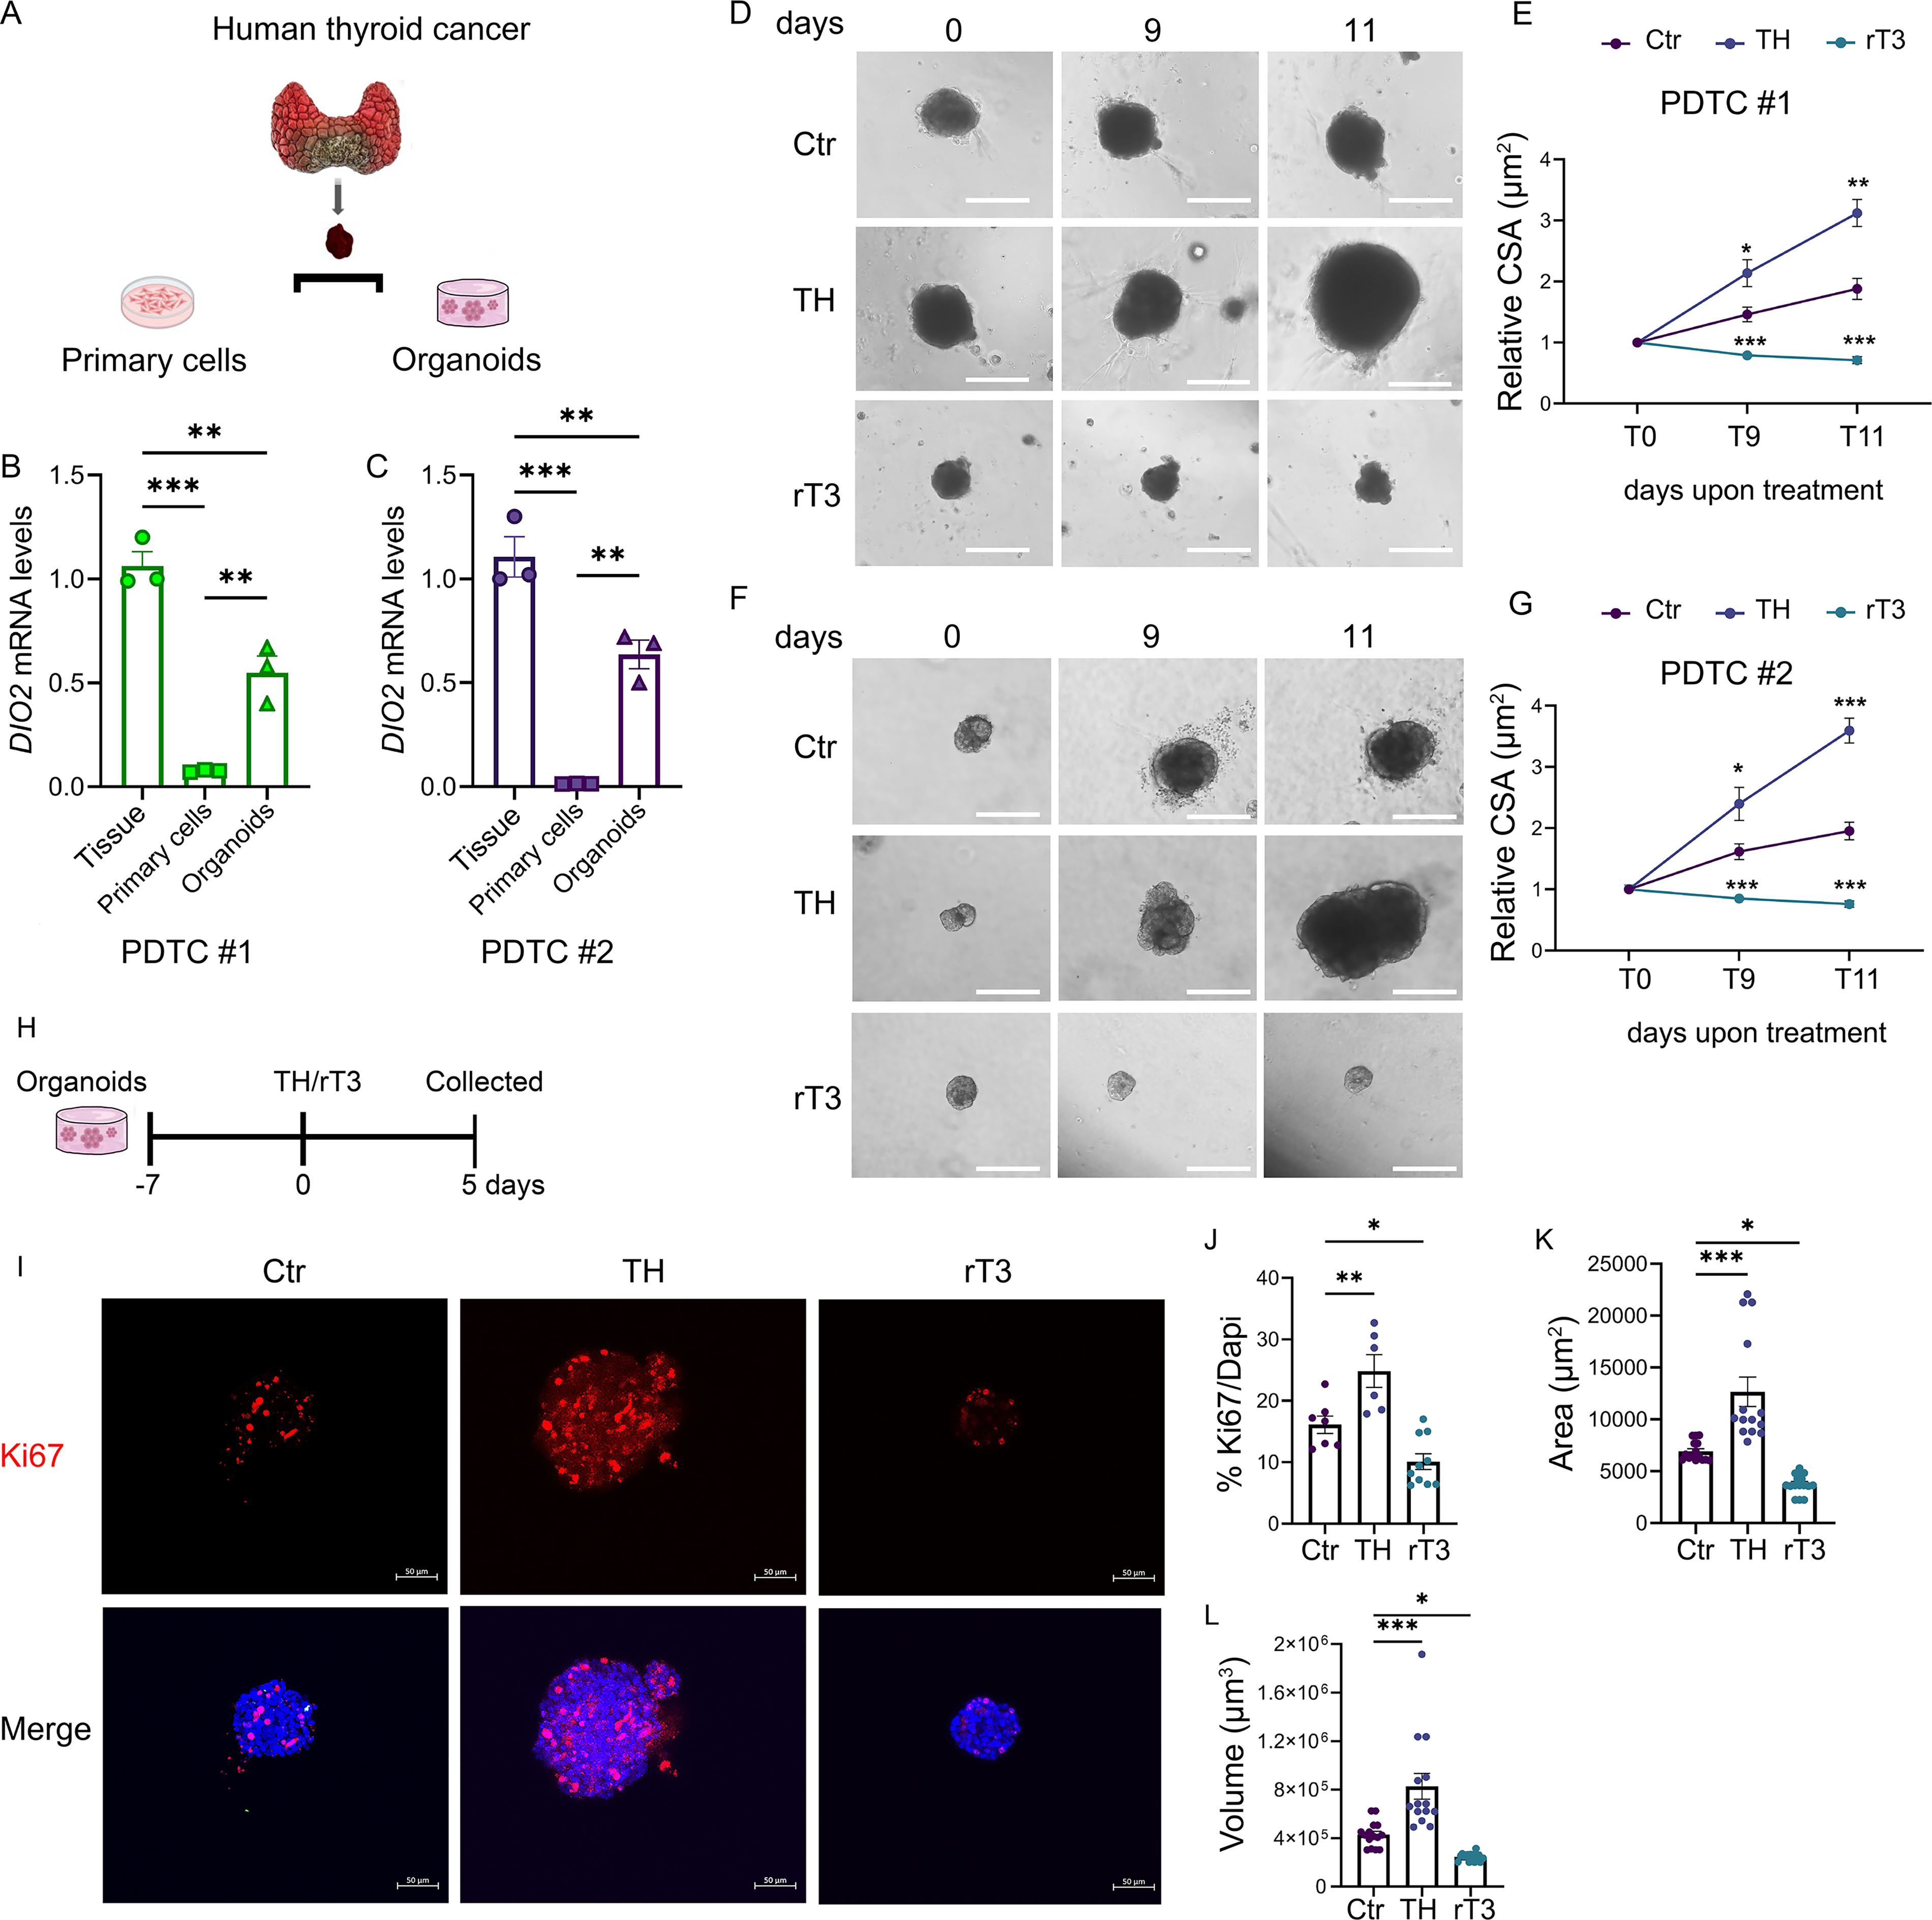
Effects of D2 inhibition in human PDTC-derived organoids. (
To assess D2 levels in organoids and cell cultures compared with primary tumor, each tumor sample was split into two portions: one for conventional 2D primary culture and the other for 3D organoid culture (Fig. 4A). Organoids formed after approximately 1 week and were maintained for 2 to 3 months. In DIO2-positive tumors (PDTC # 1 and PDTC #2), we measured DIO2 mRNA in both 2D and 3D cultures and compared it with the original bulk tissue. After 10 days, DIO2 expression was almost completely lost in 2D cultures but partially retained in 3D organoids (Fig. 4B, C) and remained stable thereafter (Supplementary Fig. S4K).
To test the impact of TH level alterations, organoids from the 2 PDTCs were treated with either exogenous TH (T3 and T4, mimicking a hyperthyroid state) or rT3 (lowering intracellular T3 levels by D2 inhibition) and compared with untreated controls. Organoid growth increased in response to TH, while rT3 treatment significantly reduced their expansion (Fig. 4D–G). Ki67 staining revealed a corresponding increase in proliferative cells in T3-treated organoids and a decrease following rT3 exposure (Fig. 4H, I). Consistent with these findings, organoid area and volume were significantly increased with TH treatment and reduced or unchanged following rT3 treatment (Fig. 4J, K). In contrast, treatment with rT3 had no significant effect on the growth of the organoids derived from the PTC that did not express D2 (Supplementary Fig. S4L, M).
Discussion
This study demonstrates that D2 is expressed in PDTC and ATC in both mice and humans, specifically within both epithelial and stromal cells, including CAFs. In contrast to early-stage thyroid tumors, which express D3, PDTC/ATC tumors show a loss of D3 and upregulation of D2, suggesting that the D3/D2 ratio may serve as a useful biomarker for tumor grading (this study and Ref. 29 ).
The primary function of D2 is to convert T4 into active T3, with its expression indicating increased intracellular T3 levels. Elevated D2 levels correlated with higher expression of Klf9, a known T3-responsive gene. 30 Due to the enzyme’s short half-life and the lack of functional antibody, D2 mRNA levels—used here as a proxy for enzyme activity—provide a reliable measurement. 31
CAFs are key players in TME, supporting cancer progression through dynamic interactions with both cancer and stromal cells. In ATC, iCAFs dominate, replacing the myCAFs seen in more differentiated cancers. 25 iCAFs express pro-inflammatory and ECM genes such as CXCL1, CXCL6, CXCL8, and COL1A1/2/3. PreCAFs, used in this study, possess the machinery to transport and regulate TH locally, via MCT8/10 transporters and deiodinases, 26 reinforcing the broader role of TH in ECM remodeling, immune evasion, and cell signaling. 9
High D2 expression in iCAFs suggests that local T3 activation is crucial for TME modulation. Inflammatory CAFs show the highest Dio2 expression, consistent with a link between D2 and cytokine-driven inflammatory signaling. Pathways such as NF-κB, JAK/STAT, and MAPK, activated by Interleukin-1 beta (IL-1β), Tumor Necrosis Factor alpha (TNF-α), Interferon gamma (IFN-γ), and Interleukin-6 (IL-6), can modulate D2 levels.32–34 Of note, D2 was also present in stromal cells not expressing YFP or SCA1, possibly including macrophages. Stromal infiltration is minimal in papillary and follicular thyroid carcinomas but increases in PDTC/ATC, correlating with poor prognosis. 35 Macrophages, especially the M2 subtype, can make up to 50% of ATC cellularity and express D2.36–39 While macrophages were not directly examined, this raises new questions about the role of D2 in tumor-associated immune cells.
Functionally, D2 was shown to be critical for tumor growth in 3D spheroids and in vivo models (Fig. 3). D2-deficient CAFs could not sustain tumor spheroid expansion, indicating essential role of D2 in promoting a tumor-supportive environment (Supplementary Fig. S5). This function includes supporting epithelial proliferation and guiding iCAF identity, as shown by selective reduction in iCAF markers (e.g., Col1a1, IL6) upon D2 inhibition, while myCAF markers (e.g., αSMA) remained unchanged (Fig. 2).
These findings support a feed-forward loop where advanced thyroid cancer cells repress D3 and activate D2 via mutant p53, enhancing local T3 production. This in turn promotes iCAF maturation, which then helps sustain D2 expression and T3 signaling, maintaining a pro-tumor TME.
Limitations include a small sample size of human tumors and lack of D2 detection in one ATC sample (data not shown). Still, D2 expression was validated in two PDTC samples and through in silico datasets 40 (Supplementary Fig. S4). Of note, we reported similar mechanisms in other cancers—for example, skin and colorectal—where D2 is linked to tumor progression and Epithelial–Mesenchymal Transition (EMT).20,41,42 Our data indicate that effects of rT3 on tumor growth primarily result from D2 inhibition rather than rT3-derived iodide or nongenomic rT3 actions. Although minor iodide contributions cannot be excluded, findings from D2-deficient organoids and genetic inactivation support this view. Future cell type-specific D2 deletions will clarify cell-autonomous roles.
Conclusions
In summary, D2-driven TH signaling promotes tumor progression and CAF activation in PDTC/ATC. Targeting this pathway may offer therapeutic potential and raise questions concerning thyrotropin suppression, considering its uncertain role in these aggressive cancers.
Authors’ Contributions
M.A.D.S.: Methodology (lead), investigation (lead), writing—original draft (lead), and writing—review and editing (equal); C.L.: Methodology (lead) and formal analysis (lead); T.P.: Methodology (equal) and formal analysis (equal); C.C.: Methodology (equal); C.P.: Methodology (equal); S.S.: Methodology (equal); C.M.: Methodology (equal); V.C.: Software (equal) and formal analysis (equal); A.M.C.: Methodology (equal) and formal analysis (equal); G.T.: Methodology (equal) and formal analysis (equal); M.S.: Conceptualization (equal) and writing—review and editing (equal); and D.S.: Supervision (lead), conceptualization (lead), writing—review and editing (lead), and funding acquisition (lead).
Footnotes
Acknowledgments

Author Disclosure Statement
M.A.D.S. has received Fellowship 2023 from IBSA Foundation.
C.L. has received honoraria from Eisai Europe.
T.P. has received honoraria from Eisai Europe.
C.C. declares no conflicts of interest.
C.P. declares no conflicts of interest.
S.S. declares no conflicts of interest.
C.M. declares no conflicts of interest.
V.C. declares no conflicts of interest.
A.M.C. declares no conflicts of interest.
G.T. declares no conflicts of interest.
M.S. declares no conflicts of interest.
D.S. has received honoraria from Eisai Europe and has served in a consulting and advisory role for Eisai Europe.
Funding Information
M.A.D.S. received no funding.
C.L. received no funding.
T.P. received no funding.
C.C. received no funding.
C.P. received no funding.
S.S. received no funding.
C.M. received no funding.
V.C. received no funding.
A.M.C. received no funding.
G.T. received no funding.
M.S. received no funding.
D.S. was funded by AIRC Individual Grant 2022 (Project no. 27729) and PRIN (Prot. 2022H8LXFR), related to this work.
Supplemental Material
References
Supplementary Material
Please find the following supplemental material available below.
For Open Access articles published under a Creative Commons License, all supplemental material carries the same license as the article it is associated with.
For non-Open Access articles published, all supplemental material carries a non-exclusive license, and permission requests for re-use of supplemental material or any part of supplemental material shall be sent directly to the copyright owner as specified in the copyright notice associated with the article.
