
Abstract
Background:
Thyrotropin (TSH) and insulin-like growth factor 1 (IGF-1) signals have been shown to be additive in their action on thyroid cells and fibroblasts, and this coordination emphasizes the role of TSH receptor (TSHR) and IGF-1 receptor (IGF-1R) signaling exerted by stimulating TSHR antibodies in patients with thyroid eye disease (TED). Here, we have reanalyzed the influence of TSHR autoantibodies on TSHR and IGF-1R expression in a fibroblast model.
Methods:
We developed a new method to assess TSHR expression using a hinge-region monoclonal antibody (MC-1) that does not interfere with TSH or TSHR antibodies. Using molecular dynamic simulations, we first assessed access to the binding sites for TSH and TSHR antibodies within the leucine-rich repeat region of the TSHR ectodomain in the presence of MC-1 binding. 3T3-L1 fibroblasts and human orbital fibroblasts were treated with increasing doses of TSH or the stimulating TSHR antibody M22. TSHR and IGF-1R expressions were measured by flow cytometry and real-time quantitative polymerase chain reaction (RT-qPCR), with 3T3-L1 cell differentiation confirmed by Oil Red O staining. To explore mechanisms of TSH- and M22-induced receptor upregulation, we assessed the effects of inhibiting protein synthesis and endocytosis.
Results:
TSH ligand induced a dose-dependent increase in detectable expression of the TSHR as measured using MC-1 binding. Furthermore, parallel assessment of IGF-1R expression showed a similar dose-dependent increase in expression induced by TSH. Studies with stimulating TSHR antibody (M22) also demonstrated a similar increase in TSHR and IGF-1R expression peaking at 48 hours. These data could not be explained by transcriptional changes as measured by RT-qPCR. In addition, analysis of the effect of protein synthesis inhibition failed to reduce TSHR and IGF-1R induction. However, inhibition of endocytosis markedly reduced enhancement of TSHR and IGF-1R expression.
Conclusions:
These data strengthen the role of TSHR antibodies in TED by showing that they enhance TSHR and IGF-1R expression in fibroblasts, helping to explain their additive retroorbital signaling. This enhancement is largely driven by receptor recycling, which can be blocked by inhibiting endocytosis and may be therapeutically targeted. The dual increase in both receptors also supports prior evidence of TSHR/IGF-1R complex formation.
Keywords
Introduction
Thyroid eye disease (TED) is an autoimmune condition characterized by orbital inflammation and the development of excessive retro-orbital tissue and extraocular muscle dysfunction. It stands as the primary extrathyroidal complication of Graves’ disease (GD), affecting approximately 25–50% of GD patients.1,2 TED may lead to visual disturbances and cosmetic disfigurement,3,4 significantly impacting patients’ quality of life.5,6 Despite their prevalence, the initiating pathogenesis of GD and TED remains unclear.
The thyrotropin receptor (TSHR) is the primary antigen of GD. Stimulating TSHR antibodies (TSHR-Ab) are the cause of the excess thyroid hormone production and are also implicated in extrathyroidal manifestations. The primary mechanisms that result in TED are thought to be secondary to an immune response triggered by stimulating TSHR-Abs binding to TSHRs overexpressed by retro-orbital tissues. The insulin-like growth factor 1 receptor (IGF-1R) expressed on fibroblasts also plays a critical role in the development of TED since the IGF-1R forms a functional signaling complex with the TSHR, thus augmenting the retro-orbital inflammation, adipogenesis, and tissue remodeling 7 and helping explain the clinical success of inhibiting the IGF-1R. 8
In the past, the assessment of the influence of TSH or TSHR-Ab on TSHR expression has always involved detecting the receptor while still partly occupied by TSH or TSHR-Ab. We previously found that TSH induced a nontranscriptional increase in TSHR mRNA by reducing mRNA degradation in thyroid cells via an unclear mechanism 9 but generally changes in actual receptor expression have been reported as quite variable. 10 With the recognition of heteroreceptor interactions, we now know that TSH and TSHR antibodies also induce activation of the IGF-1R—an important concept in TED and leading to retro-orbital tissue expansion. 11
In this study, we first developed a new approach to assessing TSHR expression using a monoclonal antibody to the TSHR linker (or hinge region, MC-1), 12 which does not influence the binding of TSH or TSHR antibodies to the TSHR. Using this method, we found that TSH and TSHR-Abs induced enhanced expression of both the TSHR and IGF-1R in fibroblasts. The mechanism involved in such induction of expression was mainly an increase in TSHR recycling, as evidenced after inhibition of endocytosis.
Material and Methods
Generating a model for MC-1
Using the AlphaFold server, 13 we first generated an antibody model of MC-1 with the variable parts of the Fab domain representing the fragment of the MC-1 antibody that is involved in binding to the target. The amino acid sequences for the light and heavy chains are shown in Supplementary Figure S1. We later extended the model to include the constant domains of the Fab domain by superimposing the AlphaFold model of the variable domains on the X-ray structure of the complete Fab domain of the antibody M22 (PDBid 3g04) and replaced the variable part of the M22 Fab domain with the AlphaFold model of the MC-1 variable parts.
Generating models for the MC-1: TSHR complex
We first docked our model of the TSHR 14 to MC-1 using the ClusPro server. 15 An acceptable docking pose is expected to (1) bind the MC-1 to the linker region (LR) of the TSHR, (2) not clash with the membrane, and (3) use the “top” loops of MC-1 as the binding surface. Since none of the models obtained satisfied all three criteria, we manually translated and rotated our MC-1 model using the Simulaid program 16 and placed it near the LR, with the top of MC-1 facing the LR.
Setting up molecular dynamic simulations
The CHARMM-GUI server 17 was used to insert the TSHR complexes into a dipalmitoyl phosphatidylcholine bilayer, add counterions (K+ and Cl-, both to ensure electro-neutrality and produce an ionic strength of 0.3 m/L) using the charmm36m force field, 18 and add the solvating waters (TIP3P model 19 ). Periodic boundary conditions were used with a hexagonal prism cell. The system was equilibrated in six steps, progressively releasing constraints on the protein and lipids. The molecular dynamic (MD) simulations were run in the (N, P, and T) ensemble using the program Nanoscale Molecular Dynamics (NAMD) 20 employing 2 fs time steps. Plots of the history of intermolecular hydrogen bonds show residue pairs considered hydrogen-bonded, that is, at least one atom of each residue formed a hydrogen bond with an atom on the other residue. The program Simulaid 16 was used to perform these analyses. The program Visual Molecular Dynamics (VMD) 21 generated the figures of molecular structures.
Fibroblast cell culture, differentiation, and treatment
For this, 3T3L1 cells were cultured in Dulbecco’s Modified Eagle’s medium (Corning, 10-017-CV; CM) supplemented with 10% fetal bovine serum (FBS) (Biowest, 081H24), penicillin, and streptomycin (Corning, 30-002-CI). Cultures were maintained at 37°C in a 5% CO2 humidified incubator. For cell differentiation, 3T3-L1 cells were seeded in 12-well plates with 5 × 10⁴ cells/well cultured in CM for 1–2 days until 100% confluent, incubated for a further 2 days, and changed media to differentiation media 1 (DM1): CM, insulin 1 ug/mL (Sigma-Aldrich, I9278), dexamethasone 0.25 uM (Sigma-Aldrich, D4902), 3-isobutyl-1-methylxanthine (IBMX) 500 uM (Sigma-Aldrich, I5879), and rosiglitazone 2 uM (Sigma-Aldrich, R2408) and incubated for 3 days. Then, the medium was changed to differentiation media 2 (DM2): CM and insulin 1 ug/mL, incubated for 3 days, and then the medium was changed to just CM and incubated for 2 days. Cells were assessed for lipid accumulation using Oil Red staining as described in the online Supplementary Data section (A). Human orbital fibroblasts (OFs) (OF) were kindly donated by Dr. Marius N. Stan and were cultured at 37°C in medium 199 (Corning, 10-060-CV) with 20% BS with penicillin and streptomycin. Then, 3T3-L1 and OF cells were treated with different doses of bovine TSH (Sigma-Aldrich, T8931), human stimulating monoclonal antibody M22-mAb (Kronus Inc., Star, ID), 22 and/or mouse IGF-1 Recombinant Protein (Cell Signaling Technology, 19912). Chinese hamster ovary (CHO)-cells stably expressing the TSHR (TSHR cells) were cultured at 37°C in F12 Ham medium with 10% FBS and penicillin and streptomycin. The cells were treated with different doses of MC-1-mAb (mouse monoclonal antibody) 12 with or without TSH or M22-mAb. Cells were then subjected to real-time quantitative polymerase chain reaction (RT-qPCR) (see Supplementary Data section B) and/or flow cytometric analyses (see below).
Flow cytometry
Treated OF and 3T3-L1 cells were detached using 1 mM Ethylene glycol-bis(β-aminoethyl ether)-N,N,N′,N′-tetraacetic acid/Ethylenediaminetetraacetic acid (EGTA/EDTA), rinsed with PBS, passed through a filter to remove clumps, and resuspended in 100 μL of staining buffer (PBS containing 0.2% sodium azide and 2% bovine serum albumin) at a concentration of 1 × 10⁵ cells per tube. Cells were incubated with fluorescein isothiocyanate (FITC) -labeled mouse MC-1-mAb for 1 hour, followed by permeabilization with saponin (Sigma-Aldrich, 84510) for 15 minutes. After washing, the cells were incubated with phycoerythrin (PE) -antirabbit IGF-1R antibody (Santa Cruz, sc-461 PE) for 1 hour and negative (only secondary antibody) controls were included. Median fluorescence intensity (MFI) among different groups were compared, and the results were expressed as relative MFI expression, and the MFI of the no-treatment group was standardized as 100%.
Protein inhibition and endocytosis inhibition assays
For protein inhibition: We seeded 3T3-L1 cells in 12-well plates and let them grow to 70%–80% confluence. Cycloheximide (CHX, Sigma-Aldrich, C4859) in CM was diluted to a final concentration of 100 µg/mL. We pretreated the cells with CHX for 30 minutes, then added bovine TSH, IGF-1, or both reagents, without removing CHX, for 6 and 18 hours. Cells were harvested, and detection of the TSHR and IGF-1R was performed by flow cytometry. Control β-actin expression was assessed by Western blot (see Supplementary Data C). For endocytosis inhibition assays, the 3T3-L1 cells were seeded in 12-well plates until ∼70–80% confluent. Cells were pre-treated with 80 µM dynasore (Sigma-Aldrich, 324410) in DMEM medium for 30 minutes at 37°C. We then added bovine TSH, IGF-1, or both reagents in the same dynasore -containing medium, incubated for 2 hours, harvested the cells, and then detected the TSHR and IGF-1R by flow cytometry.
Statistics
At least three independent replicate experiments were performed to confirm the reported data. Statistical data were presented as mean ± standard deviation (SD). Two-tailed t-tests were performed. Differences were considered statistically significant at a p value of <0.05. GraphPad Prism, version 10.0 (GraphPad Software, San Diego, CA), was used for all statistical analyses.
Ethics statement
This study used a well-established cell line and an established human cell line provided by another laboratory. No human participants, identifiable human specimens, or animal experiments were involved. Therefore, institutional review board and Institutional Animal Care and Use Committee approvals were not required.
Results
MD simulations with the Fab domain of MC-1
We have previously generated MC-1-mAb, 12 specifically targeting amino acids 322–341 (labeled peptide 21) within the TSH receptor extracellular region (Fig. 1A). Using this TSHR model shown, we then generated a model for the MC-1-mAb-TSHR complex as well as for MC-1–TSHR-TSH and MC-1–TSHR-M22 complexes, where M22 is a powerful thyroid-stimulating antibody. MD simulations generated biologically acceptable complexes. The conformations of the systems at 1000 ns intervals are shown in Figure 1B and C for the TSHR-TSH-MC-1 and TSHR-M22-MC-1 systems, respectively. The simulations of MC-1-TSHR-TSH and MC-1-TSHR-M22 both formed hydrogen bonds with the known epitope at residues 322–341. The hydrogen bond that MC-1 made with the TSHR in the absence of another ligand closest to the epitope was with residue 350 (see Supplementary Fig. S2). In accordance with the experiment, the results showed clear access to the TSH and antibody binding sites in the leucine-rich repeat region of the TSHR ectodomain in the presence of MC-1 binding. These results confirmed a way for the first time to measure TSHR expression in the presence of TSH ligand or stimulating TSHR antibody binding.
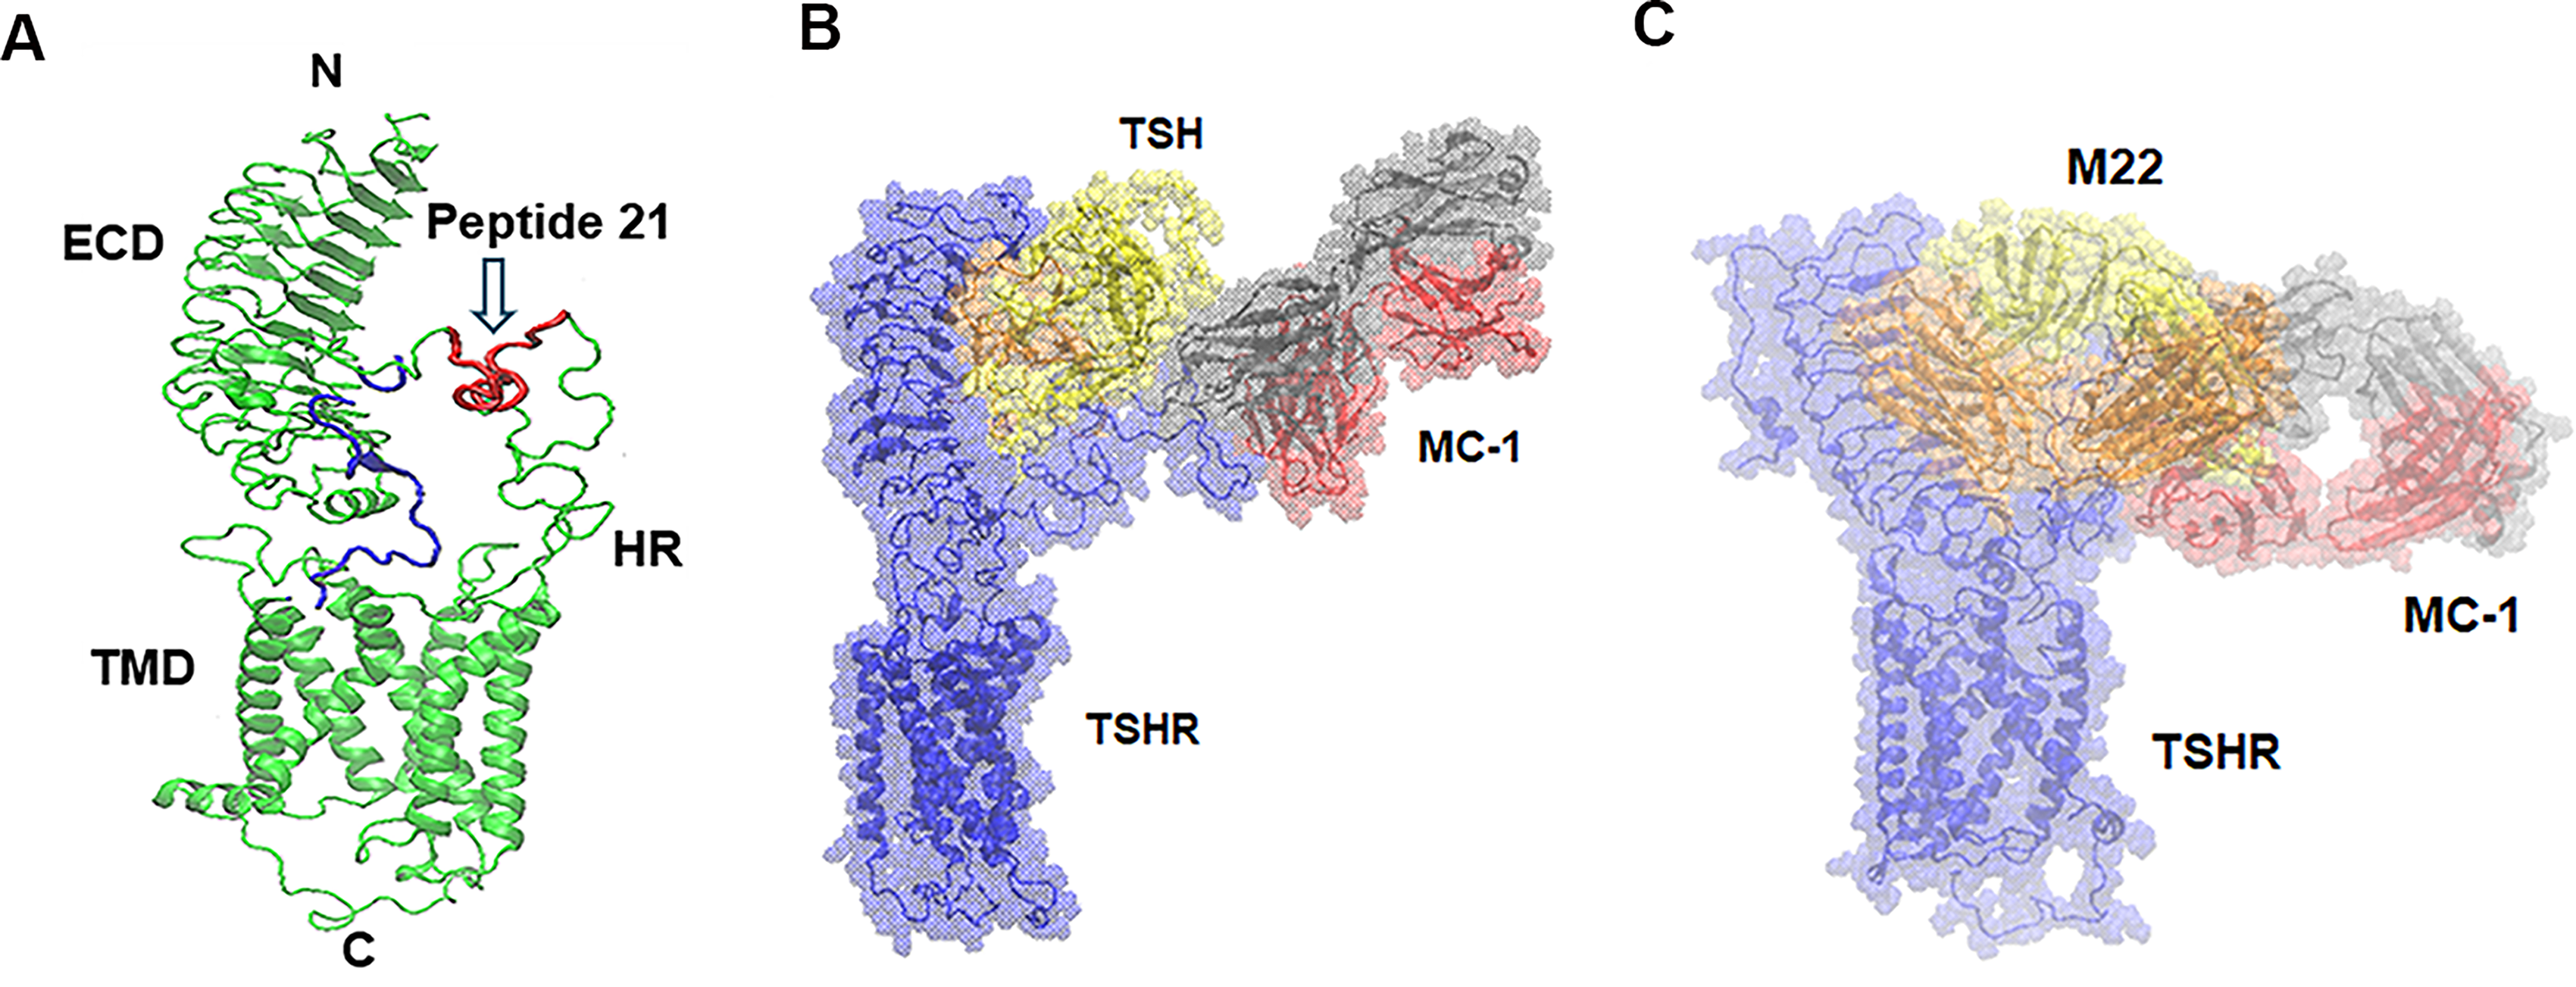
Human full-length TSH receptor and molecular dynamic (MD) simulations.
A new assay for TSHR expression
We generated a mouse monoclonal antibody MC-1, with a purity of 99% by Fast Protein Liquid Chromatography (FPLC). The antibody showed strong binding to the biotinylated peptide (amino acids 322–341) in the Bio-Layer Interferometry assay (GenScript USA Inc., Piscataway, NJ, USA). Global 1:1 fitting yielded an apparent equilibrium dissociation constant (KD) of 10.41 nM, with a koff of 0.0001942 seconds.−1 The low-nanomolar KD and slow dissociation rate indicated a relatively high-affinity interaction between the antibody and the peptide. Utilizing the MC-1-mAb, we were able to assess TSHR expression levels by flow cytometry. We first evaluated whether the straightforward binding of TSH or stimulating antibodies (M22) affected the detection of TSHR by MC-1-mAb. CHO-TSHR cells 23 were treated with varying concentrations of MC-1, either alone or in combination with TSH or M22. Flow cytometric analysis revealed no significant differences in TSHR expression across the different treatment groups. (Fig. 2A and B). These results demonstrated that MC-1-mAb reliably measured TSHR expression independently of competitive binding by TSH or stimulating TSHR antibodies, thus validating our modeling of this novel approach for TSHR detection.
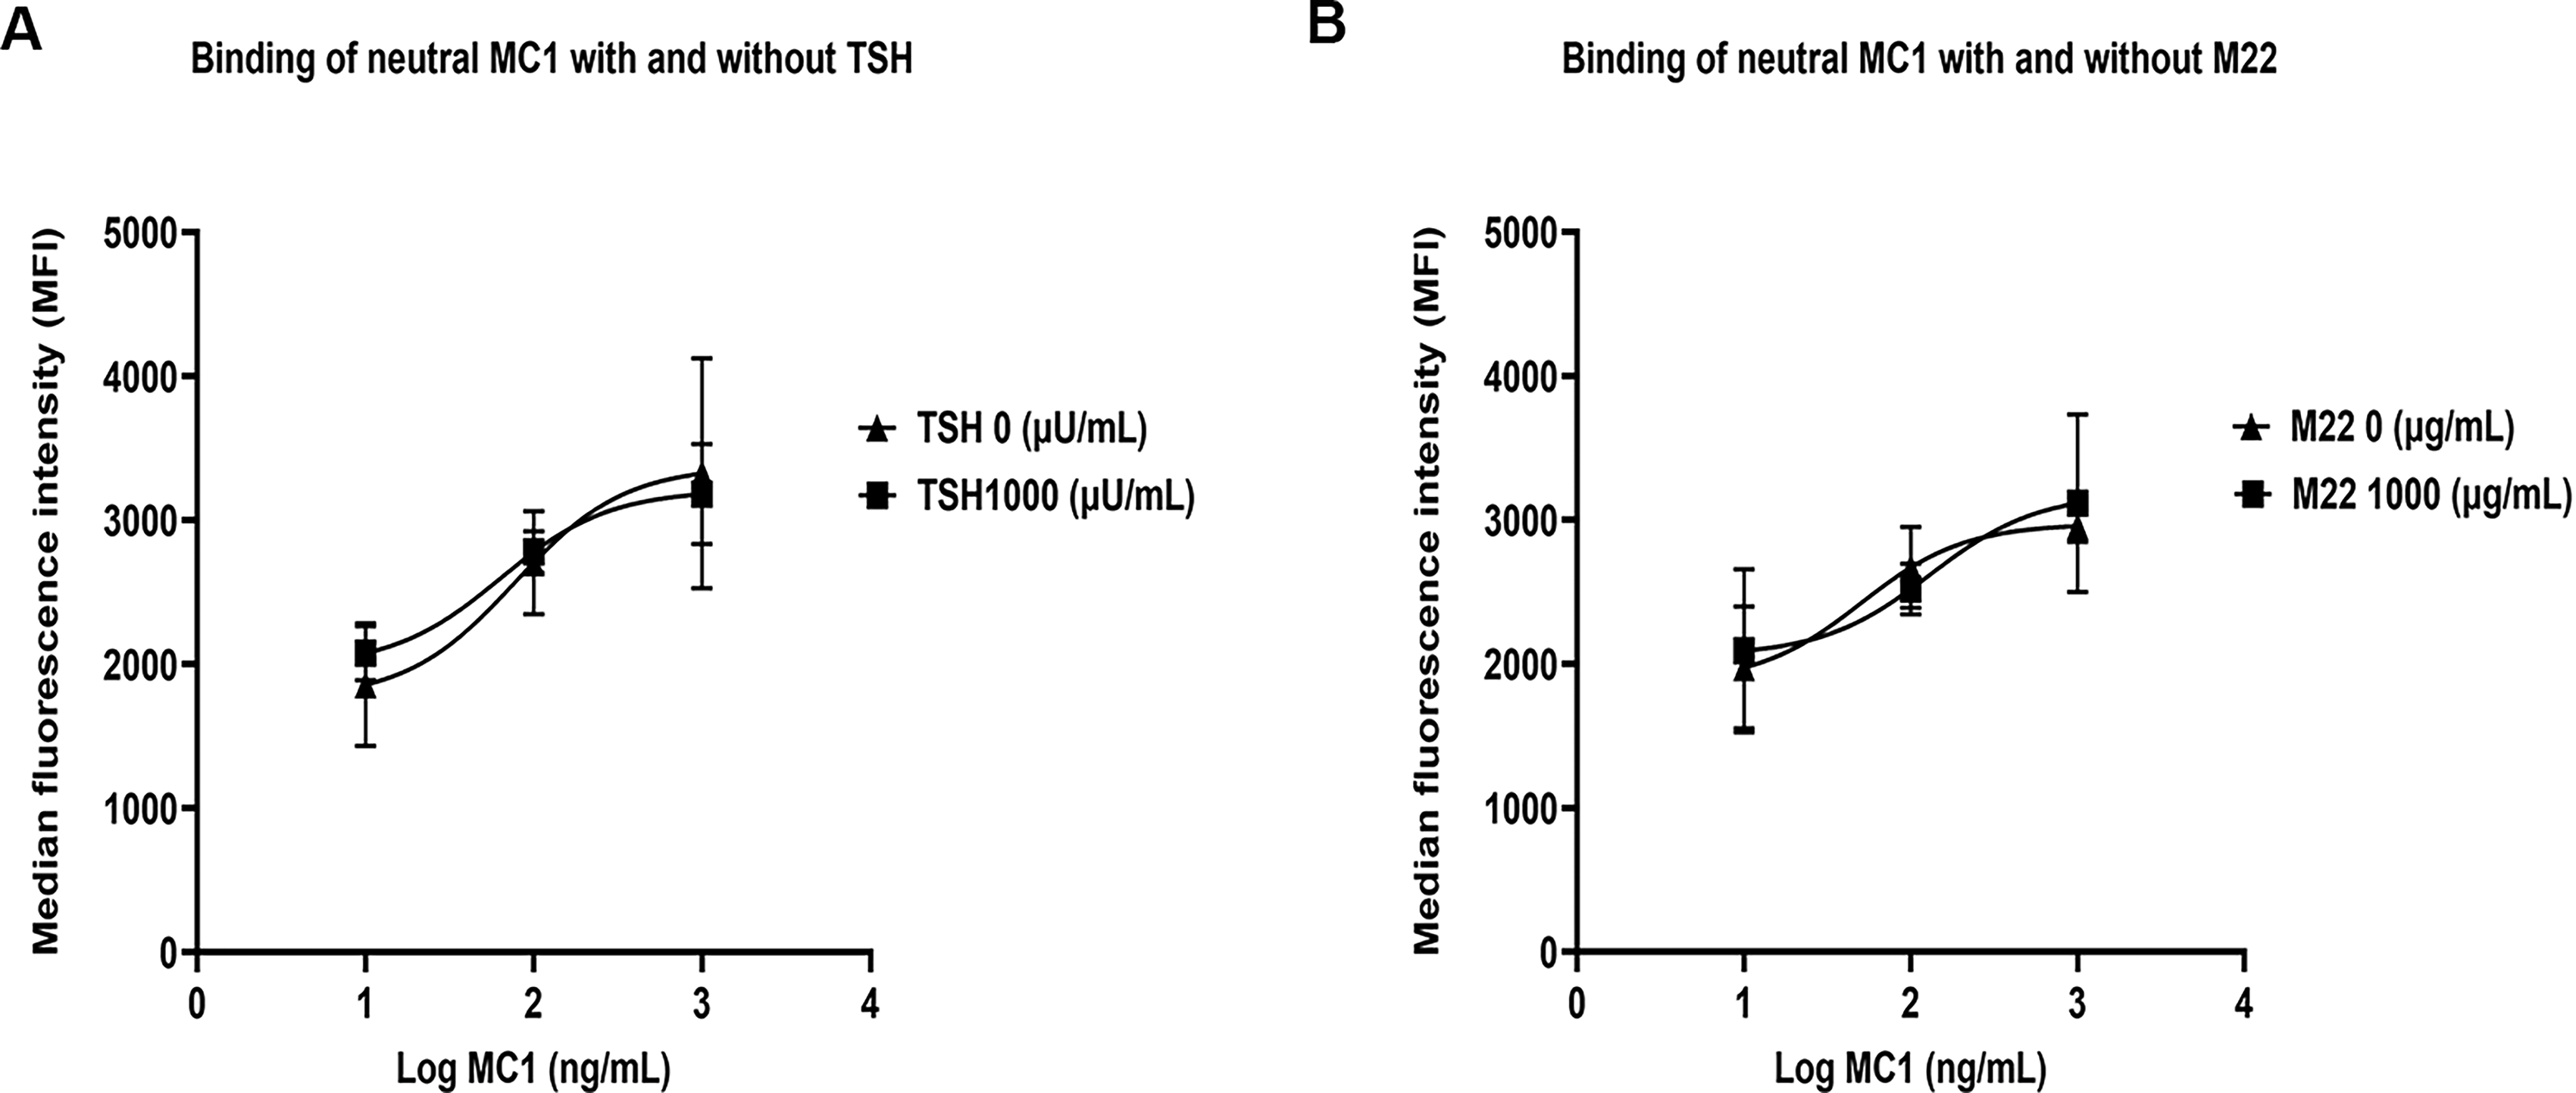
MC-1 does not influence the binding of TSH or TSHR antibodies to the TSHR.
TSHR expression by fibroblasts
Our initial analysis demonstrated that undifferentiated 3T3-L1 fibroblast cells exhibited low TSHR expression (<3%; Fig. 3). Subsequently, we induced differentiation of these cells for 10 days, and oil red O staining confirmed the presence of multiple lipid droplets, indicative of successful adipogenic differentiation (Supplementary Fig. S3). Correspondingly, TSHR expression significantly increased compared with undifferentiated cells (Fig. 3).
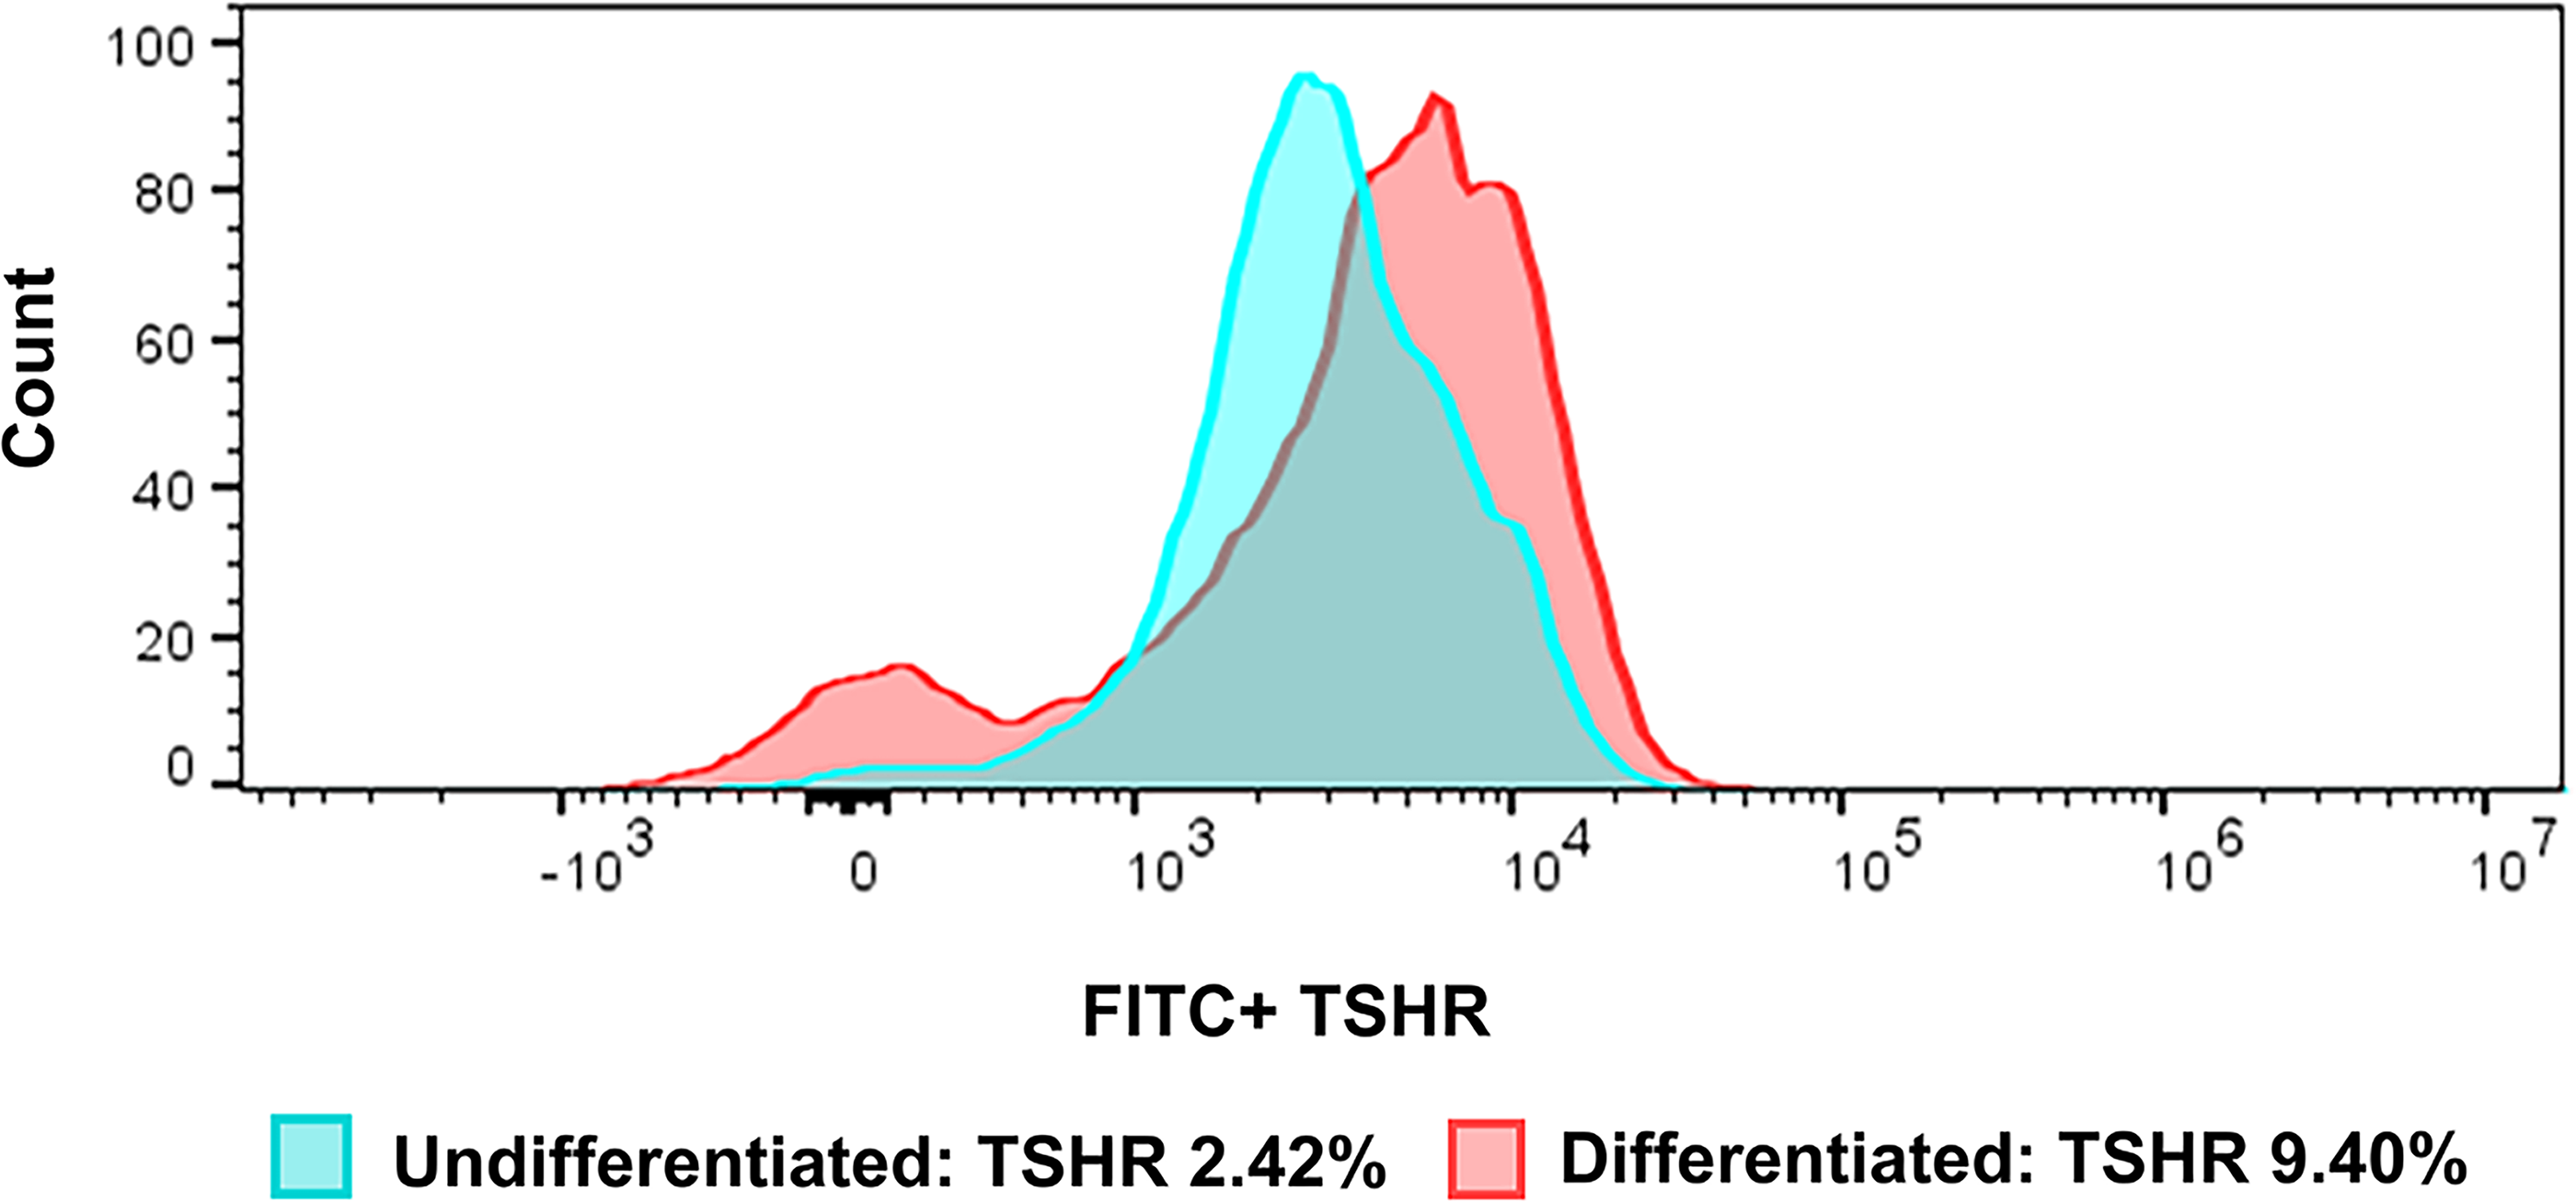
Representative Flow cytometry tracing showing total TSHR expression. The green box indicates undifferentiated 3T3-L1 cells with 2.42% TSHR expression, and the red box represents differentiated 3T3-L1 cells with 9.40% TSHR expression; for both groups, TSHR expression values were calculated after subtracting the negative control.
TSH and stimulating TSHR antibody enhance TSHR and IGF-1R expression in OFs and differentiated 3T3-L1 fibroblasts
We initially examined both the time- and dose-dependent effects of the monoclonal human stimulating antibody M22 on fibroblasts TSHR expression. Results indicated an increase in TSHR expression with the more pronounced effect observed at 48 hours (Supplementary Fig. S4). Therefore, in subsequent experiments we treated the fibroblasts for 48 hours. Under these conditions, TSH also induced a dose-dependent increase in TSHR expression in OF (Fig. 4A), as well as in 3T3-L1 fibroblasts (Fig. 4B), achieving a twofold enhancement at a concentration of 1000 µU/mL. We also detected similar enhancement of TSHR expression with TSHR-mAb M22 in OF (Fig. 4D) and 3T3-L1 fibroblasts (Fig. 4E). The representative flow cytometry histograms are shown in (Fig. 4C and F). These data could not be explained by cell transcriptional changes as measured by RT-qPCR (Supplementary Fig. S5).
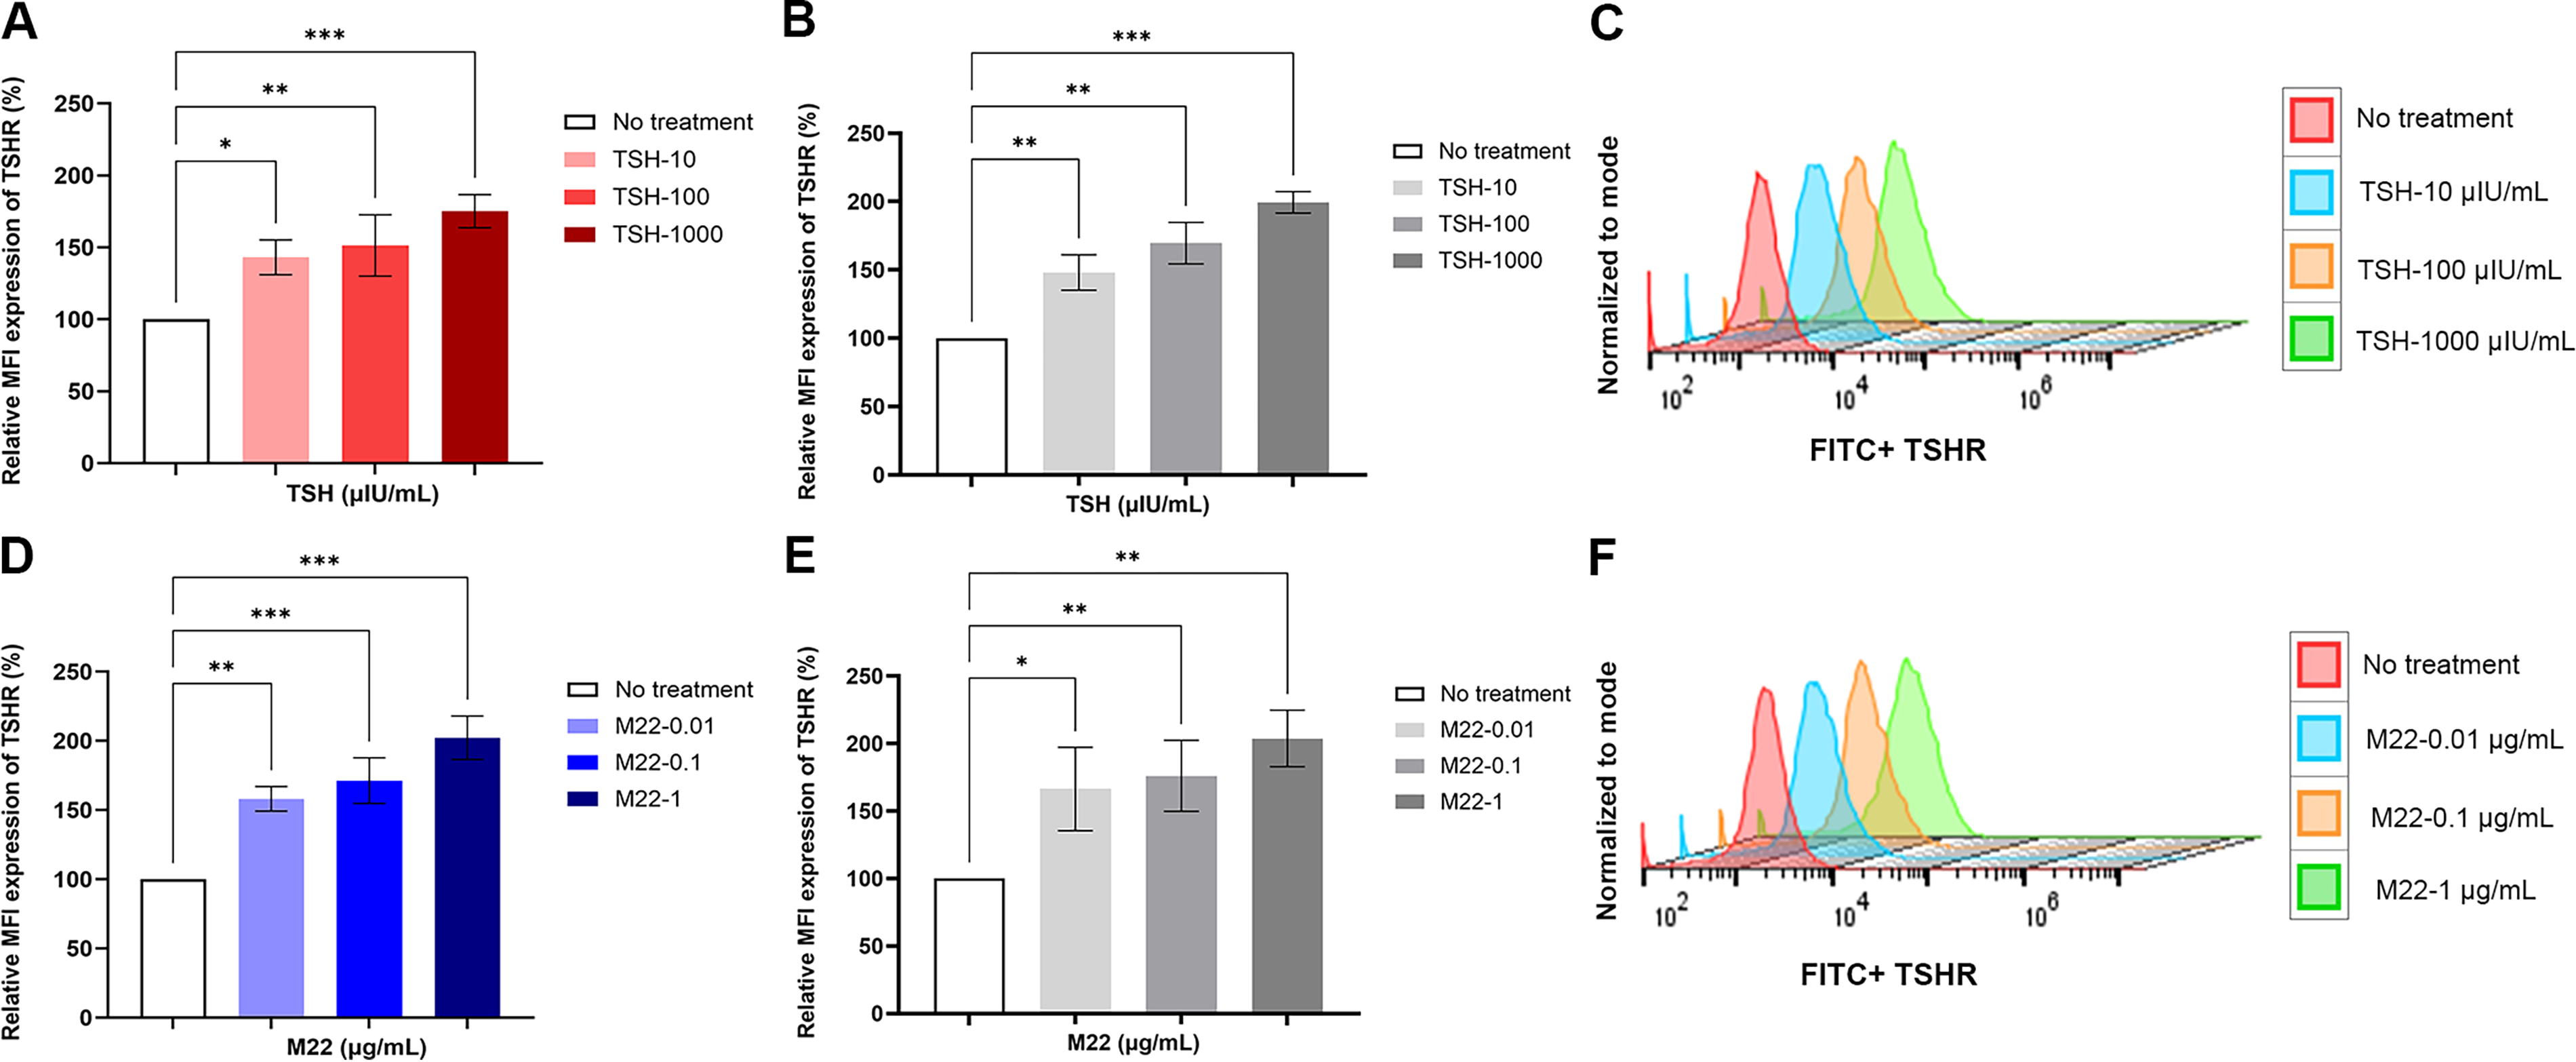
TSH and stimulating TSHR antibody (M22) induce TSHR expression. Human orbital fibroblasts and 3T3-L1 cells were treated with different doses of TSH and M22 at 48 hours.
Similar time- and dose-dependent increases were observed for the IGF-1R with TSH (Fig. 5A and B) and M22 treatment, reaching peaks of ∼2–2.5-fold at 48 hours (Fig. 5D and E, Supplementary Fig. S4B). The representative flow cytometry histograms are shown in (Fig. 5C and F) This was not unexpected given the known additive interaction between the TSHR and IGF-1R on thyroid cells and fibroblasts and their capacity to form a tight receptor complex. 24
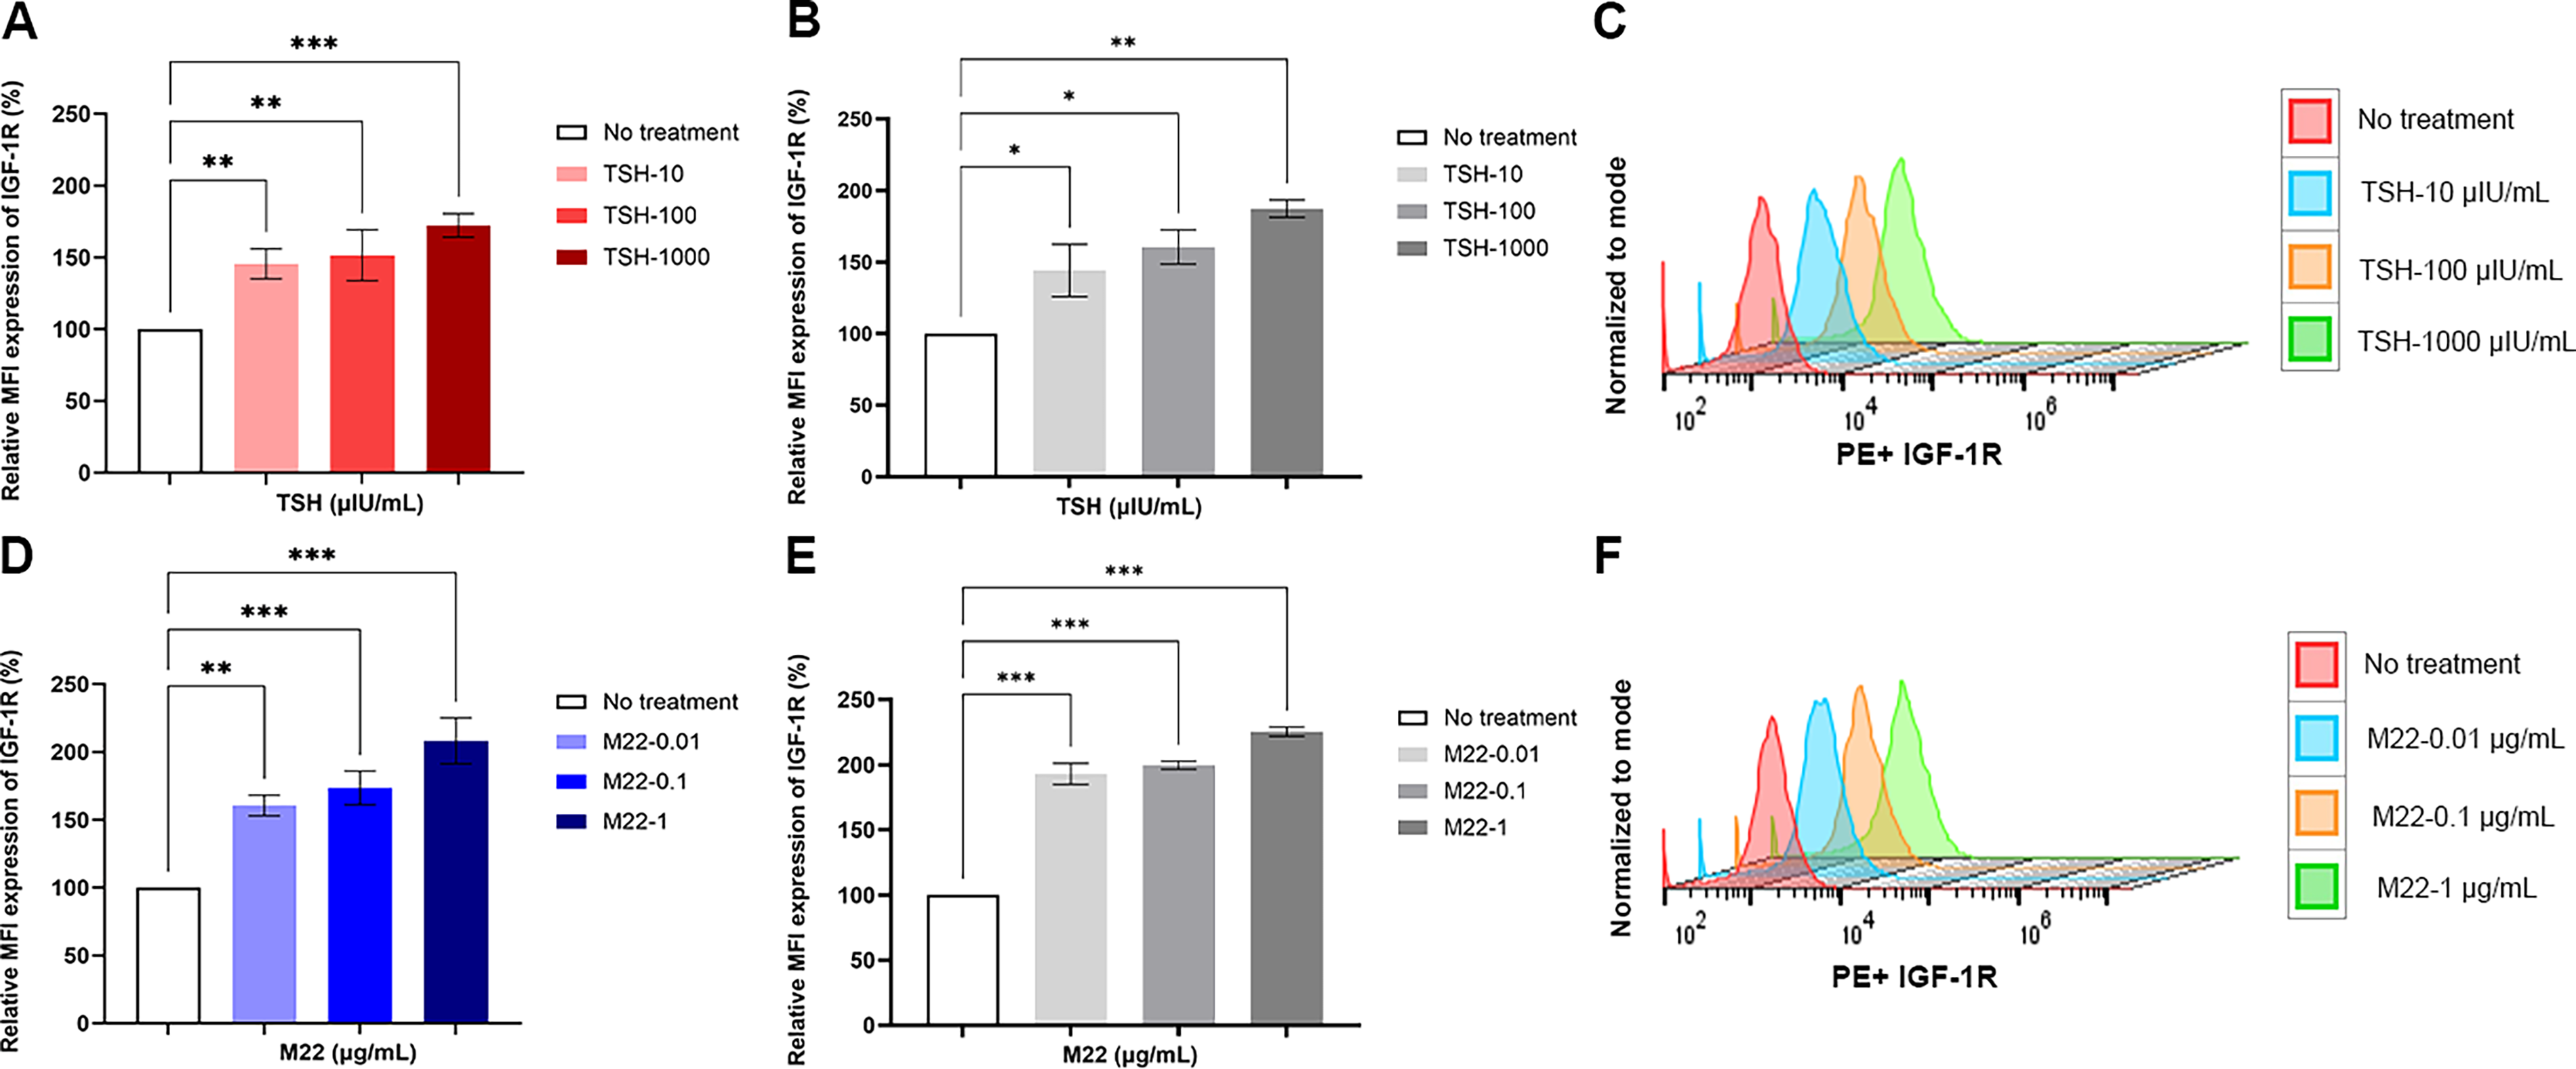
TSH and stimulating TSHR antibody (M22) induce IGF-1R expression. Human orbital fibroblasts and 3T3-L1 cells were treated with different doses of TSH and M22 at 48 hours.
Protein synthesis inhibition fails to reduce TSHR and IGF-1R induction
To investigate the mechanisms underlying TSH-induced expression of TSHR and IGF-1R in differentiated 3T3-L1 fibroblasts, the cells were pretreated with cycloheximide (CHX), a protein synthesis inhibitor. CHX effectively inhibited protein synthesis following 6-hour and 18-hour treatments (Supplementary Fig. S6). However, pretreatment with CHX did not suppress TSH-induced expression of the TSHR or the IGF-1R (Fig. 6A and B).
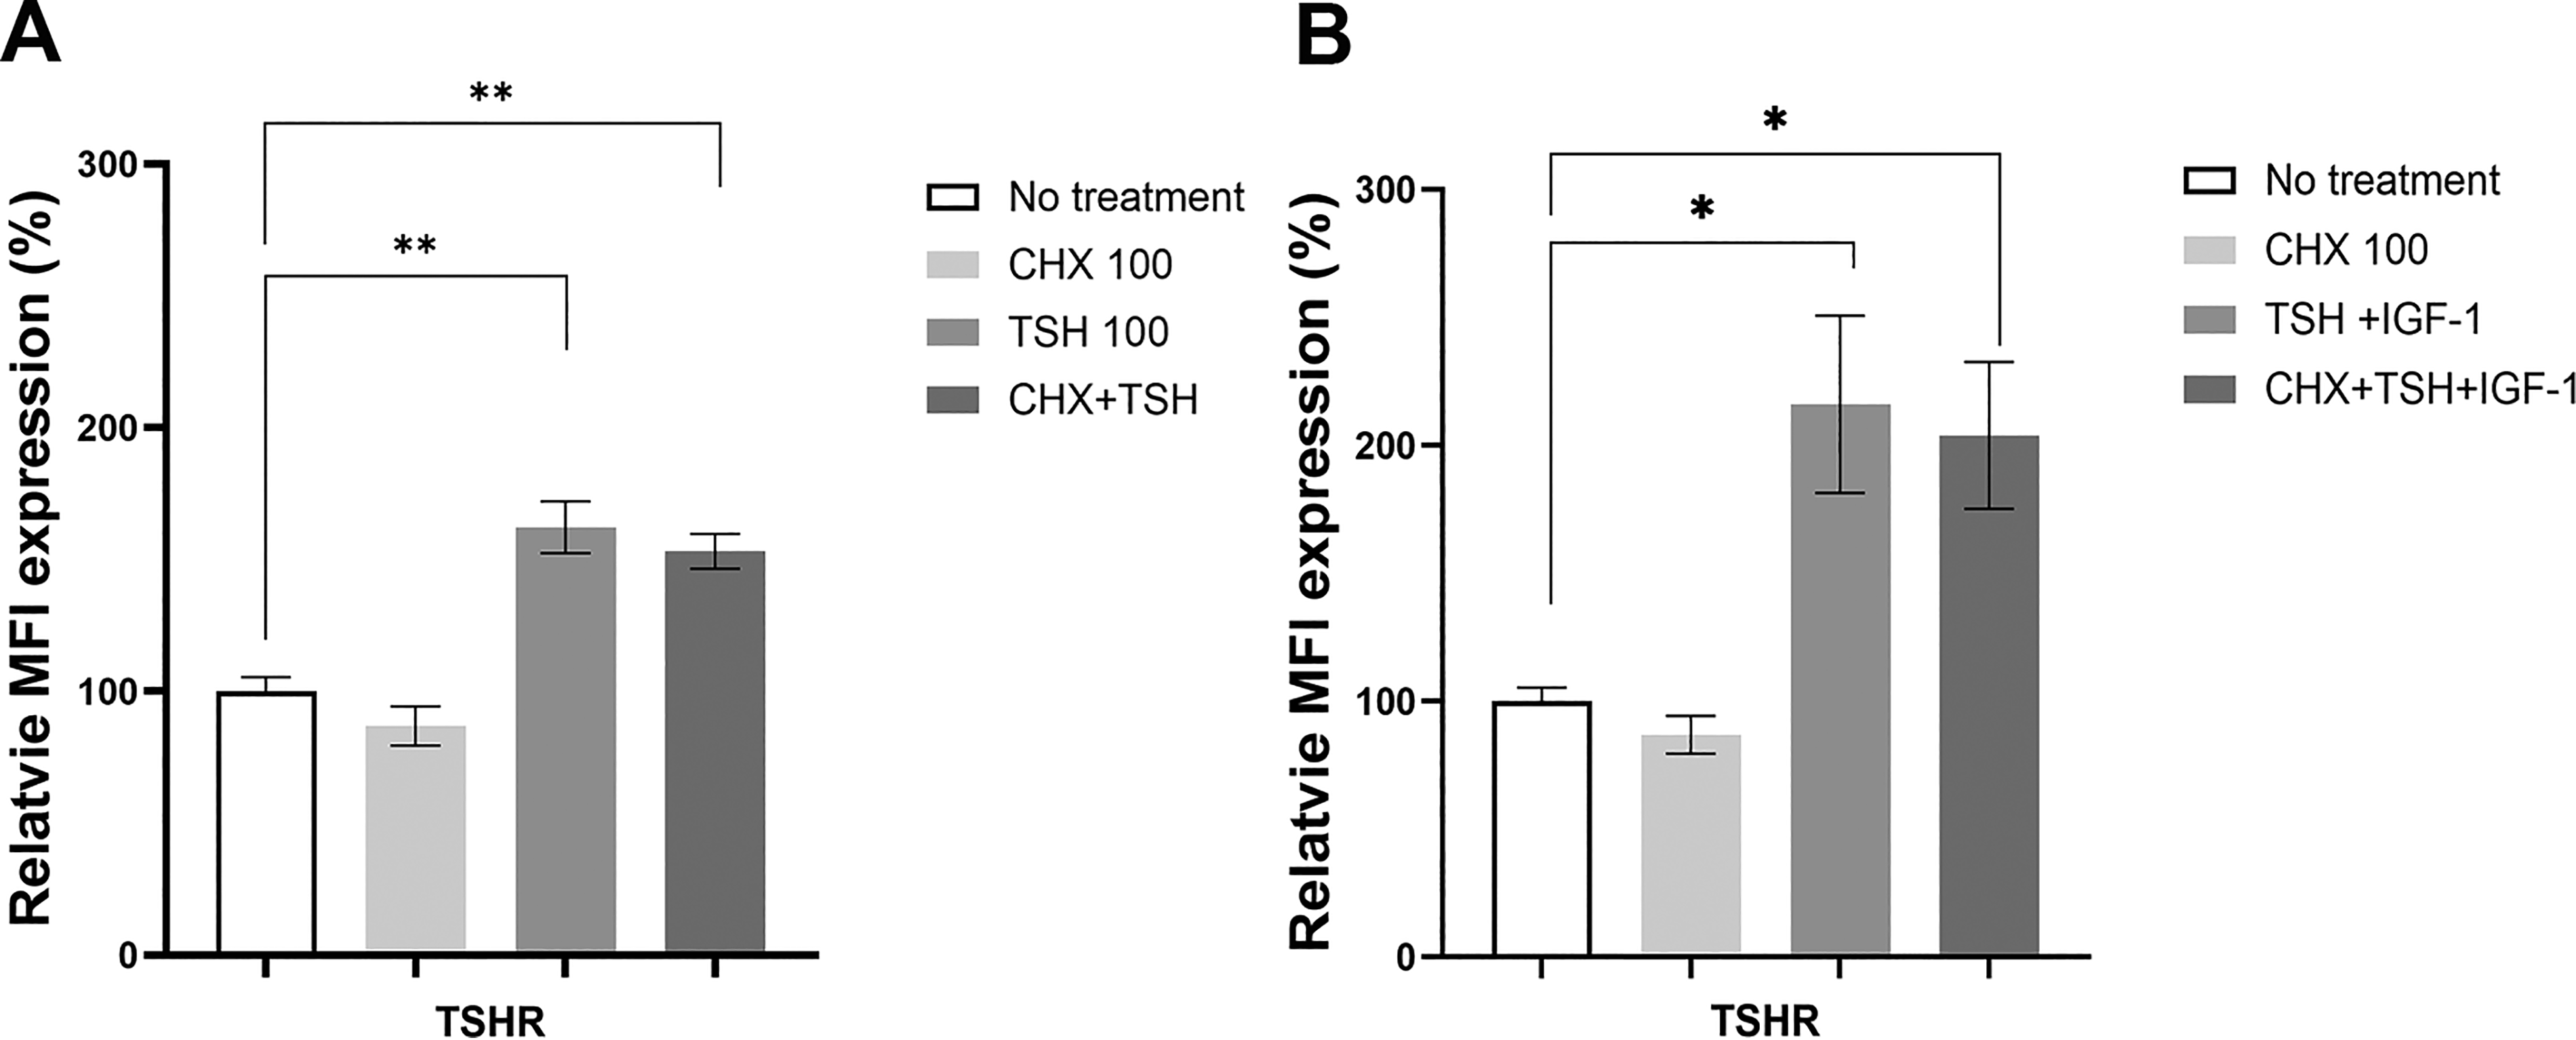
Protein inhibition fails to reduce TSHR induction. 3T3-L1 cells were pretreated with cycloheximide (CHX).
Endocytosis inhibition blocks TSH induction of receptor expression
Next, we explored whether induction of TSHR or IGF-1R proceeded independently of receptor recycling. Cells were pretreated with dynasore, an inhibitor known to block dynamin-dependent endocytosis. The results demonstrated that dynasore pretreatment effectively inhibited endocytosis and hence receptor recycling and that this resulted in decreased TSHR and IGF-1R induction (Fig. 7A and B). Additionally, live-cell imaging of thyrocytes had confirmed that in the presence of dynamin inhibitors, the endocytosis of labeled TSHR-mAb (M22) and TSH was notably absent 25 (see Fig. 7C adapted from reference 12 ).
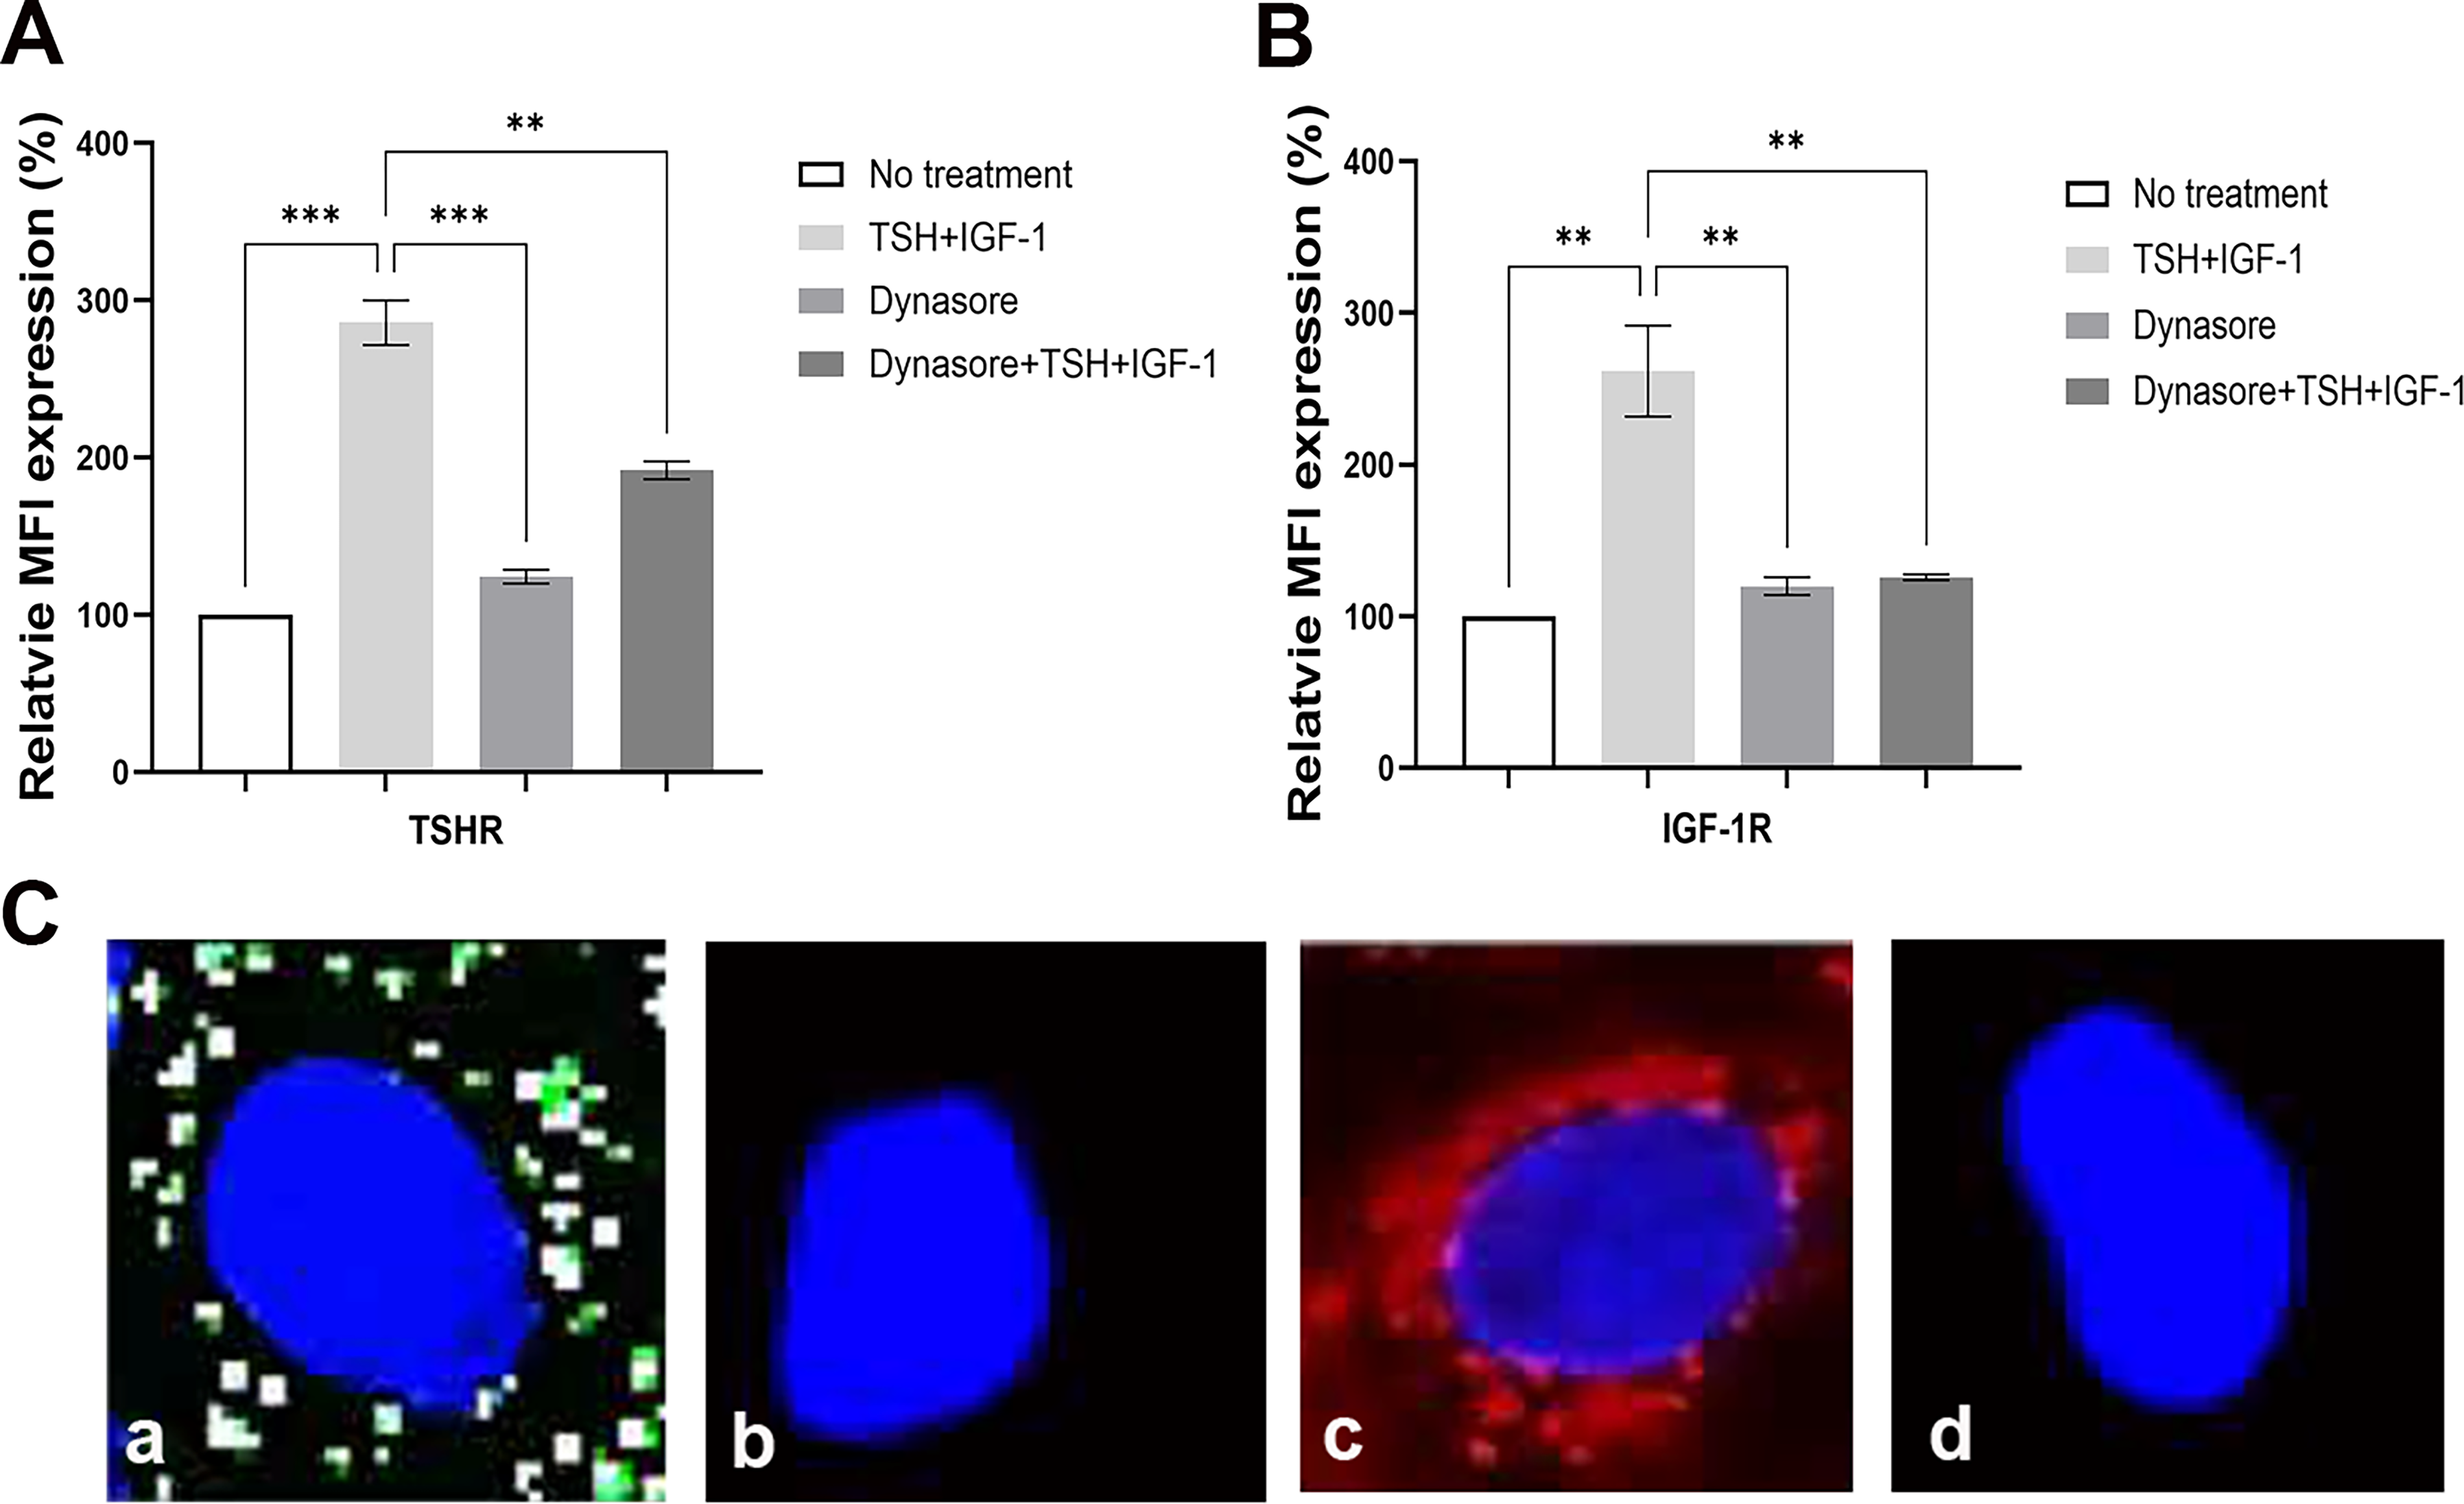
Endocytosis inhibition blocks TSH/IGF-1 induction of receptor expression. 3T3-L1 cells were pretreated with dynasore.
Discussion
The eye complications of Graves’ disease, referred to as TED, are a refractory autoimmune disorder with a pathogenesis that remains incompletely understood. Central to Graves’ disease is the loss of immune tolerance to the primary autoantigen, the TSHR. The involvement of the IGF-1R as an additional factor also plays a critical role in disease development. 26 Recognizing the close interaction between the TSHR and IGF-1R is essential for a deeper understanding of TED pathogenesis.
Assessing the influence of TSH or stimulating TSHR-Ab on the expression level of the thyrotropin receptor (TSHR) has presented a significant challenge in the past, primarily due to the technical difficulty of detecting the receptor while it remains, at least in part, bound to its ligand. Ligand binding can mask critical epitopes on the receptor, interfere with antibody recognition, or alter receptor conformation, thereby complicating accurate quantification of cell surface or total receptor levels.27,28 In this study, we developed a new approach for measuring TSHR expression by using our MC-1-mAb. The resulting data supported our MD simulations and demonstrated that MC-1-mAb binds to the TSHR without interfering with TSH or M22 binding. This indicated that the MC-1-mAb could reliably detect TSHR expression without interference from TSH or other TSHR antibodies, validating it as a novel and specific method for TSHR detection. By utilizing this assay, we could detect changes in the expression of TSHR in fibroblasts.
Although undifferentiated fibroblasts, particularly OFs, express very low levels of TSHR, typically below 2%, multiple recent studies, including our own, have shown that TSHR expression increases significantly following differentiation into pre-adipocytes.29,30 The present study demonstrated that TSH and stimulating TSHR mAb—M22 could induce a dose-dependent increase in TSHR expression in OFs and 3T3-L1 fibroblasts. Previous research has demonstrated that TSH positively regulates TSHR levels in normal cells by prolonging mRNA half-life and enhancing mRNA stability.9,31 M22, which mimics the effects of TSH, exhibits similar regulatory functions. Kumar et al. 32 reported that treatment with TSH or M22 significantly increased TSHR expression in cultured OFs from patients with Graves’ orbitopathy (GO), compared with untreated cells. Their findings further indicated that TSH and M22 not only upregulated TSHR expression but also enhanced adipogenesis, in part through increased activation of the PI3K signaling pathway.
While there is strong evidence supporting the role of TSHR in TED, the IGF-1R is also likely to play a key role in disease progress. So, we also assessed the responses of the IGF-1R to TSH and TSHR-Abs. We found that TSH and stimulating TSHR Ab-M22 not only induced TSHR expression but also a dose-dependent increase in IGF-1R expression. Considerable evidence demonstrates robust physical and functional interactions between the TSHR and IGF-1R. 33 These two receptors co-localize on cell membranes and form a stable signaling complex,24,34 likely pre-assembled to facilitate rapid signaling “crosstalk.” This receptor complex formation may be stabilized by β-arrestin 1, even in the absence of ligand binding. 35 Upon simultaneous activation of the TSHR and IGF-1R, there is an additive enhancement of downstream signaling pathways, resulting in phosphorylation and activation of ERK1 and ERK2. Such synergistic ERK activation has been documented in primary cultures of GO-derived OFs (GO-OFs), human thyrocytes, and HEK293 cells engineered to overexpress TSHR. 36 Additionally, co-activation of TSHR and IGF-1R significantly augments hyaluronan secretion by GO-OFs, further highlighting the functional relevance of this crosstalk. 37 Interestingly, IGF-1 itself has also been shown to enhance TSHR expression levels in GO-OFs, 38 underscoring the intricate regulatory interplay between these receptors in TED.
To investigate the mechanisms underlying such a TSHR induction, we performed RT-qPCR but did not observe any transcriptional activation of the TSHR gene. Our previous study showed that human recombinant TSH upregulated TSHR-specific mRNA levels in human thyroid cells, not by increasing gene transcription but by reducing mRNA degradation. 9 We further investigated whether this induction was dependent on protein synthesis. To test this, 3T3-L1 cells were pretreated with cycloheximide, a protein synthesis inhibitor. However, CHX pretreatment did not reduce TSHR induction. CHX typically inhibits the synthesis of new proteins, and thus, stable or recycled pre-existing proteins could still persist, creating the illusion that cycloheximide is ineffective.39,40 Thus, we additionally used dynasore, a small-molecule inhibitor of dynamin guanosine triphosphatase (GTPase) activity that rapidly and reversibly impairs dynamin-dependent endocytosis. 41 Our data showed that pretreatment with dynasore inhibited endocytosis, thereby blocking TSH/IGF-1-induced upregulation of receptor expression, indicating that the observed receptor “upregulation” is endocytosis-dependent. Baratti, et al. 42 reported that TSH stimulation increases approximately 40% of surface TSHR internalized within 40 minutes, and the majority (∼90%) of those receptors were subsequently recycled back to the cell surface. Such a recycling-dominant itinerary is commonly organized through the Rab GTPase-regulated pathways (e.g., Rab4-associated fast recycling and Rab11-associated slow recycling 43 ), which can return receptors to the cell surface and limit lysosomal diversion. 44 Receptor internalization may contribute to signaling from intracellular compartments. Consistent with this, several G protein-coupled receptors, including TSHR, have been reported to generate Stimulatory G protein/cyclic adenosine monophosphate/protein kinase A pathway (Gαs/cAMP/PKA) signals from endosomal and/or trans-Golgi network (TGN)-associated membranes.45,46 Together, our dynasore data are most consistent with an endocytosis-dependent mechanism in which TSHR surface availability is maintained or increased through efficient recycling. Direct quantification of TSHR and IGF-1R internalization rates and recycling efficiency was beyond the scope of the present study. Our data do not define the precise kinetics of receptor trafficking. However, the dynasore sensitivity of the observed response supports the conclusion that the increase in receptor surface expression depends on dynamin-mediated endocytic trafficking. In the context of GD and TED, sustained elevation of TSHR surface expression in retro-orbital tissues may enhance the responsiveness of OFs/preadipocytes to TSH and stimulating TSHR antibodies, thereby contributing to downstream pathogenic signaling. Although the detailed trafficking kinetics remain to be established, the present findings provide mechanistic support for a dynamin-dependent pathway contributing to receptor overexpression in orbital tissues. In addition, enhanced receptor stability may also contribute to this process. In our previous studies we showed that TSH binding stabilizes the hinge region of the TSHR, potentially increasing the binding capacity of MC-1. 47 The fact that IGF-1R levels also increased was consistent with its role in complex formation and receptor crosstalk with the TSHR. 33
In summary, a monoclonal antibody to the TSHR LR (MC-1) reliably measured TSHR expression independently of competitive binding by TSH or stimulating TSHR antibodies and provided a novel approach for TSHR detection. Using this methodology, we found that TSH and especially stimulating TSHR Ab induced the expression of the TSHR and the IGF-1R in fibroblasts, which is a crucial concept in understanding the etiology of TED. The mechanism involved in such induction of expression was mainly an increase in TSHR recycling, as evidenced after inhibition of endocytosis, and offers a new therapeutic avenue.
Authors’ Contributions
P.X.: Conducted experiments, acquired data, analyzed data, and drafted the article. M.M.: Conducted modeling and MD simulations. R.L.: Designed the research and reviewed and edited the article. T.F.D.: Led the project, designed the research, and critically revised the article.
Supplemental Material
sj-docx-1-thy-10.1177_10507256261463222 — Supplemental material for Stimulating Thyrotropin Receptor Antibodies Enhance the Expression of Both Thyrotropin Receptors and Insulin-Like Growth Factor 1 Receptors in Fibroblasts
Supplemental material, sj-docx-1-thy-10.1177_10507256261463222 for Stimulating Thyrotropin Receptor Antibodies Enhance the Expression of Both Thyrotropin Receptors and Insulin-Like Growth Factor 1 Receptors in Fibroblasts by Pingping Xiang, Mihaly Mezei, Rauf Latif, and Terry F. Davies
Footnotes
Acknowledgments
An abstract based on this work was previously presented as an abstract poster at the American Thyroid Association (ATA) Annual Meeting, 2025, Scottsdale, Arizona, United States. The support of computational resources and staff expertise provided by the Department of Scientific Computing at the Icahn School of Medicine at Mount Sinai is greatly acknowledged. The authors also thank Dr. Desiree Malinick for providing the purity of MC-1 Ab by conducting FPLC.
Author Disclosure Statement
P.X., M.M., and R.L.: None. T.F.D. is a member of the Board of Kronus Inc., Starr, ID.
Funding Information
P.X., M.M., and R.L.: None. T.F.D.: VA Merit Award.
References
Supplementary Material
Please find the following supplemental material available below.
For Open Access articles published under a Creative Commons License, all supplemental material carries the same license as the article it is associated with.
For non-Open Access articles published, all supplemental material carries a non-exclusive license, and permission requests for re-use of supplemental material or any part of supplemental material shall be sent directly to the copyright owner as specified in the copyright notice associated with the article.