
Abstract
The purpose of this study was to test the reliability and validity of the Inclusive Classroom Profile (ICP), an observation measure designed to assess the quality of classroom practices in inclusive preschool programs. The measure was field tested in 51 inclusive classrooms. Results confirmed and extended previous research findings, providing further evidence for the measure’s interrater reliability, factor structure, and construct validity. New information from testing the relationship between the ICP and key program characteristics provided support for the measure’s discriminant validity. Reports on the ease of use of the ICP from state assessors involved in collecting data for the study indicate that the ICP holds promise for use in quality assessment. Findings from the present study are discussed with respect to implications for use of the ICP in research, policy, program evaluation, and professional development.
Introduction
Federal legislation has supported the right of young children with disabilities to be cared for and educated with typically developing peers since the passage of PL 99-457 (Individuals With Disabilities Education Act [IDEA]) in 1986. The provisions of the law ensure that children with disabilities from ages 3 through 21 are provided services in the least restrictive environment and states receive federal incentives to develop an early intervention system for infants and toddlers below age 3 with disabilities and their families (Odom, Buysse, & Soukakou, 2011). In 1990, the IDEA legislation was further strengthened, especially within the child care community, by the Americans With Disabilities Act (ADA), which prohibits discrimination because of disability for full and equal enjoyment of the goods, services, facilities, or accommodations associated with places of public accommodations. Public accommodations are defined as hotels, recreation, transportation, education, dining, and care providers among other things. These federal and related state policies have increased the likelihood that early childhood teachers are educating children with documented disabilities in their classrooms. In fact, the report on 2011 data to the U.S. Congress from the U.S. Department of Education, Office of Special Education Programs (OSEP) indicated that 51.18% of preschool children with disabilities were included in early childhood settings as their primary or part-time placement, with 41.67% receiving their special education and related services in those settings (U.S. Department of Education, OSEP, Data Analysis System [DANS], 2011).
The policy initiatives supporting inclusion which have developed over the past 3 decades have been accompanied by research that has advanced the field’s knowledge of early childhood inclusion (Guralnick, 2001; Odom, 2002; Odom et al., 2004) and the research-based practices that support effective implementation of inclusion in early childhood settings (Buysse, 2011; National Professional Development Center on Inclusion, 2011). For example, we know that specialized instructional techniques, such as embedded interventions, environmental and curricular modifications, and use of assistive technology, support the development and learning of young children with disabilities in inclusive settings. We also know that a range of factors such as program standards, professional development, and resources affect the quality of inclusive classrooms.
Given the legislative support for inclusion and the research knowledge available for implementation, it is somewhat surprising that very little is known about the quality of the inclusive practices in early childhood settings, especially given the current context in which improving the quality of early childhood programs serving high needs children has become a national education priority. Through the Race to the Top–Early Learning Challenge Program (RTT-ELC) Results-Driven Accountability (RDA) under the IDEA, and other reform efforts, states are being challenged to develop systems for rating, monitoring, and improving early learning and development programs (IDEA Determinations Fact Sheet, 2014).
A challenge for state administrators working diligently to increase the availability and accessibility of high-quality inclusive preschool classrooms relates to measures of the classroom environment and the extent to which they include items related to instructional and environmental supports for children with disabilities. The tool used most widely (Environment Rating Scales [ERSs]) across states to measure observed classroom quality within current quality initiatives (Schulman, Matthews, Blank, & Ewen, 2012) is not designed to assess comprehensively instructional practices that support the individualized needs of children with disabilities. Likewise, the Classroom Assessment Scoring System (CLASS; Pianta, La Paro, & Hamre, 2008), an observational measure focused on classroom interactions that is being used increasingly by states as part of quality initiatives (Isner et al., 2011), was not designed to assess practices specifically related to including children with disabilities. Related to this point, it is conceivable that young children with disabilities can experience low quality in classes that are rated on measures such as these as being of high quality (Wolery, Pauca, Brashers, & Grant, 2000).
There have been efforts over the last decade to develop a measure to assess the quality of inclusive classrooms. The SpeciaLink Child Care Inclusion Practices Profile and Principles Scale developed in Canada (Irwin, 2005) covers domains of quality, predominately at a programmatic level such as staff training and a program’s commitment to principles of inclusion. Initial evidence for the measure’s psychometric properties has been reported, including information on the reliability, factor structure, and utility of the measure. Construct validity was assessed by correlating scores on the SpeciaLink inclusion scales with program directors’ own ratings of how well they felt their program was doing in providing inclusive care in the community (Lero, 2010). While this measure holds promise for assessing important quality dimensions of inclusion, it does not focus on measuring classroom-level instructional supports and teaching practices.
Another measure, the Quality of Inclusive Experiences Measure (QuIEM; Wolery et al., 2000), was designed to assess the quality of individual children’s experiences in inclusive settings, using target child observation for part of the rating procedures. The administration of the measure requires a period of several days and extensive structured interview and documentation review with program staff, making it somewhat impractical for wide scale use. A unique strength of the QuIEM is that it is designed to assess comprehensively a wide range of instructional supports for children with disabilities. Unfortunately, development work on this measure has not continued and there are no published data on reliability and validity.
The Inclusive Classroom Profile (ICP) was developed in response to the lack of validated observation measures that can assess the quality of inclusive practices at the classroom level through a single, classroom observation. The ICP was pilot tested in the United Kingdom in 45 inclusive programs across three counties with promising results (Soukakou, 2012). The purpose of this study was to pilot the ICP in a U.S. sample and to gather additional information with respect to reliability and validity. This article describes findings from the first pilot study conducted in the United States.
Objectives
The study had two objectives: The first one was to assess the psychometric properties of the ICP, including the measure’s interrater reliability, factor structure, and construct validity. A second objective was to gather information on the social validity of the measure, including the ease of use and acceptability as rated by the ICP assessors. To assess the psychometric properties of the measure, the study addressed the following questions:
What is the evidence for the measure’s interrater reliability?
What is the factor structure of the measure in the present sample?
What is the evidence for the measure’s construct validity measured through correlation analysis with Early Childhood Environment Rating Scale (ECERS-R) scores and additional predictors of quality?
To assess the social validity of the ICP, the following questions were posed:
Did assessors establish adequate reliability proficiency upon training?
To what extent did assessors find the measure useful and easy to administer?
Sample
Recruitment Procedures
The ICP was piloted in 51 preschool inclusive classrooms. Inclusive classes, as defined for the purposes of the study, included at least one child with an identified disability (i.e., a child with an Individualized Education Program [IEP] or an Individualized Family Service Plan [IFSP]). Classrooms that provided only self-contained care or served more than 50% of children with disabilities were excluded. Additional criteria for participation in the study were that classrooms served children between the ages of 2 and 5 years, and that a maximum of two classrooms per program could participate in the study.
Recruitment of programs was conducted by the North Carolina Rated License Assessment Project (NCRLAP). In North Carolina, information about child care licensing, including ECERS-R scores, is publicly available. For North Carolina’s licensure system, which is also the statewide Quality Rating and Improvement Systems (QRIS), a 1-star rating indicates that the program meets the minimum licensure standards and a 5-star rating indicated the highest level. In this system, programs earn points in two components: program standards and staff education. There is an additional quality point option based on enhanced standards in staff education or program quality. The total points earned across areas are combined to determine the star level. The ERS scores are included in the program standards component of the star rated license. The assessments are completed by external assessors used by NCRLAP.
Programs were selected from a list of licensed early childhood settings in North Carolina provided by the Division of Child Development and Early Education (DCDEE). The NCRLAP schedulers used a script to determine whether the classroom qualified for participation (e.g., were inclusive) and whether the director and classroom teachers agreed to participate in the project. After the initial call, an information packet about the study that included consent forms and contact information was sent to the program.
Sampling procedures focused on recruiting a purposive sample of classrooms that varied both in type of program (Head Start, child care, public pre-K, and developmental day) and level of quality. This enabled the testing of the psychometric properties of the ICP in classrooms with different characteristics. In North Carolina, developmental day programs are child care programs that are certified to provide specialized services to children with identified disabilities. Among other requirements, all developmental day programs must maintain a 4- or 5-star rated license, include at a minimum one staff member who holds certification or licensure issued from the Department of Public Instruction, and comply with teacher–child ratio requirements. Programs that on previous NCRLAP ECERS-R assessments received a score for item “Provisions for Children With Disabilities,” which indicates that their program has served children with disabilities, were contacted for participation in the study.
To recruit programs representing a range of global quality, star ratings of programs were examined using the publicly available information from the database of statewide licensed child care programs. At the time of the study, only 15% of programs participating in the rated licensure program had less than 3 stars (Child Care Services Association, 2013). As there were fewer programs at the 1- and 2-star levels, and only a subset of these included children with disabilities, extra effort was made to contact all programs at the 1- and 2-star level; however, only two initially agreed to participate. Over the course of the study one of these two programs dropped out. A single 1-star program and no 2-star programs completed the study. The remainder of the recruiting calls for programs on the 3- to 5-star list were balanced across program type. In all, observations were completed at 47 programs in 46 counties; 4 of the programs had 2 participating classrooms each, providing a total sample of 51 classrooms.
Description of Sample
Classroom and child characteristics
Of the 51 classrooms, 13 (26%) were in Head Start programs, 20 (39%) were in child care programs, 5 (9%) were in public preschools, and 13 (26%) were in developmental day programs. The number of children with a disability in any one classroom ranged from 1 to 8, with each classroom serving, on average, 2.94 children with an IEP. Developmental day programs served the highest number of children with disabilities with an average of 4.69 children per class. Head Start had, on average, 2.62, public pre-K 2.40, and child care 2.15 children.
As illustrated in Table 1, child–teacher ratio varied widely across program types. Child care classes had, on average, the highest ratio (11 children per teacher) and developmental day programs had the lowest average per classroom (5 children per teacher). Global quality, as measured by the ECERS-R on a 1- to 7-point scale, was “good,” ranging from an average score of 5.31 in developmental day programs, to 5.14 in public pre-K programs, 4.95 in Head Start, and 4.58 in child care programs.
Classroom and Child Characteristics (N = 51).
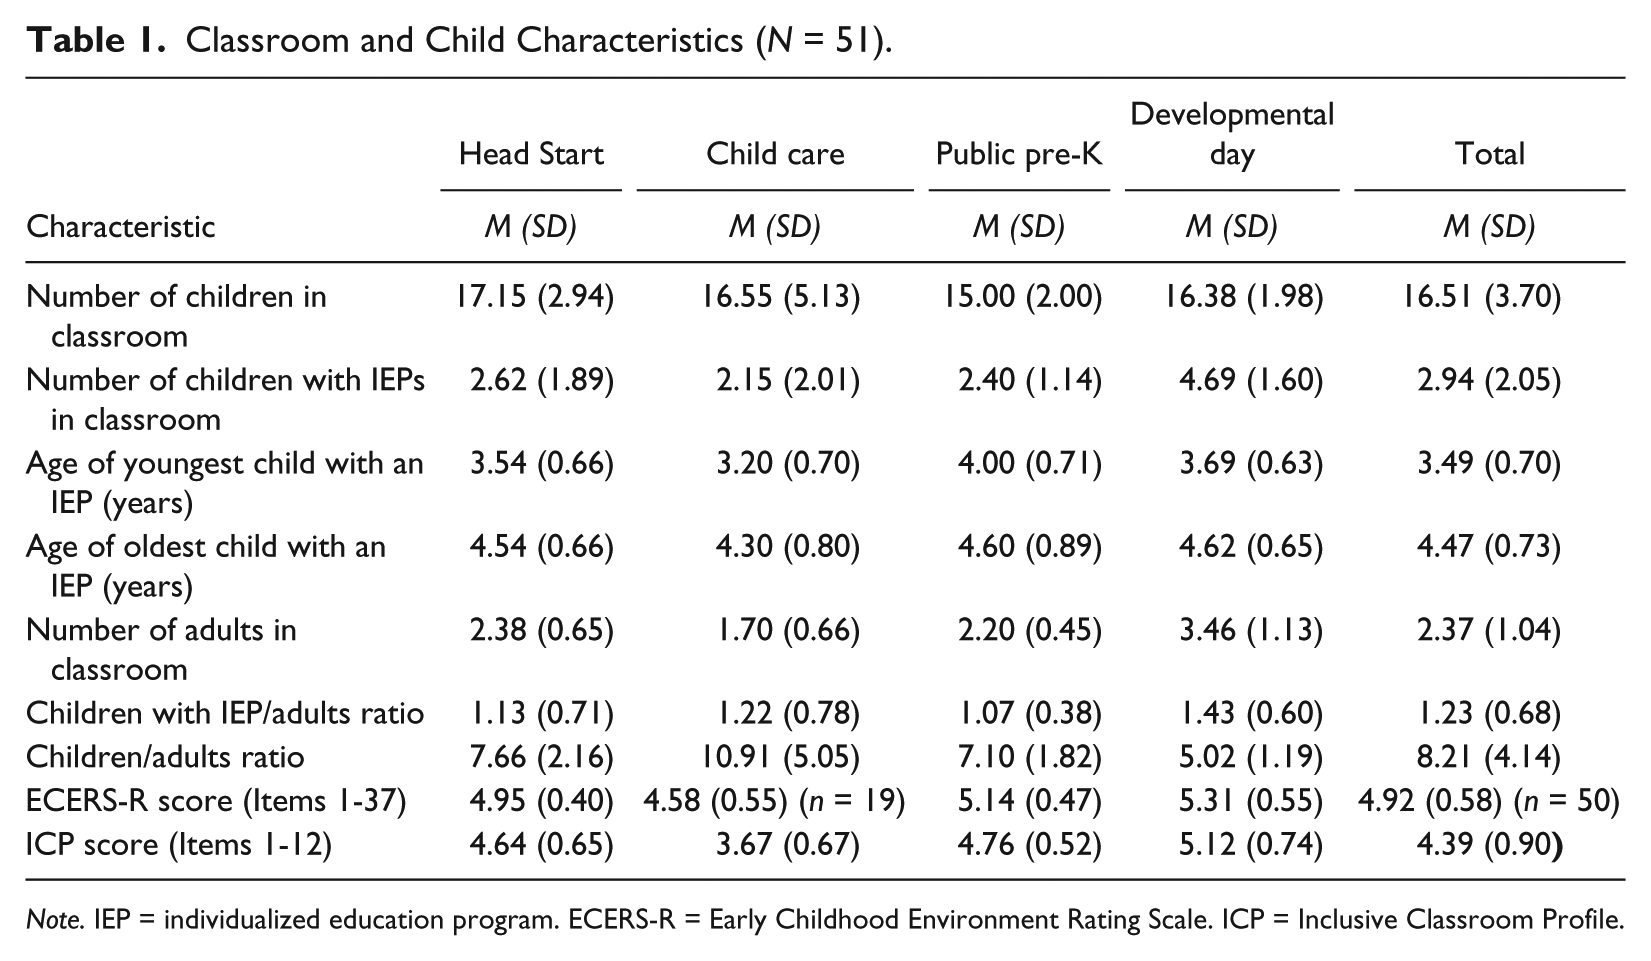
Note. IEP = individualized education program. ECERS-R = Early Childhood Environment Rating Scale. ICP = Inclusive Classroom Profile.
The sample classrooms included a total of 150 children with IEPs or IFSPs. Children’s ages ranged from 3.2 to 4.62 years, with an average age of 4.43 years. Based on teacher report, less than half (42.67%) of children with disabilities received the majority of their specialized services (e.g., therapy) within the classroom. This is a less than the North Carolina percentage (50.97%) but slightly more than the U.S. percentage (41.67%) of children with disabilities receiving special education and related services in their early childhood programs as reported in the 2011 OSEP Report to Congress (U.S. Department of Education, OSEP, DANS, 2011). As illustrated in Table 2, there were program differences in terms of where children received the majority of their services. More than two thirds of the children in developmental day classrooms received services in their regular classroom in contrast to the other settings in which the majority of children with disabilities received their services outside of the classroom.
Frequency and Percent of Children Receiving the Majority of Specialized Services in the Classroom and Frequency of Severity of Disability.

Note. Severity is defined as the child’s highest level of severity across six areas of disability. The percentage is the number of children in that type of program at that level of severity divided by the total number of children with Individualized Education Programs.
Children’s areas of disability and level of severity of disability were identified by teachers who responded to classification categories adapted from the Abilities Index (Simeonsson & Bailey, 1991). As illustrated in Table 3, the children in the sample had special needs in the following areas: intentional communication (90%), behavior/social (67%), fine motor coordination (45%), gross motor (27%), and sensory integration (27%).
Mean and Percentage of Children With IEP’s Areas of Disability.
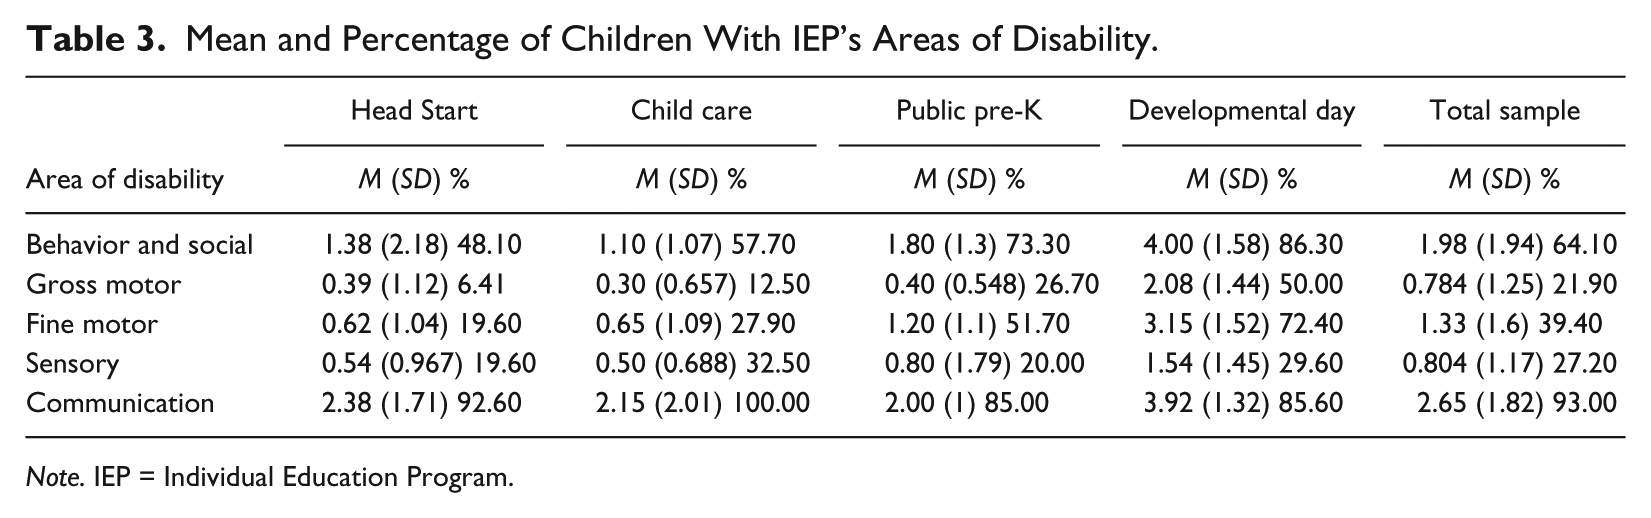
Note. IEP = Individual Education Program.
Overall, 59% of the classrooms had at least one child with a disability at the “severe” level (4 on a scale of 1-4), whereas 88% of classrooms had at least one child with a moderate or severe level of disability in at least one area. Table 2 provides information about the frequency of severity level of disability across program types. The level of severity of the disabilities ranged from mild to severe. Of note is that the majority of children included in each of the four program types had moderate or severe disabilities.
Children’s primary diagnoses, based on IDEA eligibility categories, were provided by teachers based on their knowledge of the child; IEPs were not reviewed by teachers as part of this study. The breakdown of primary diagnoses across categories were speech and language (38%), developmental delay (37%), autism (12%), other health impairment (5%), hearing impairment (2%), multiple disabilities (1%), orthopedic impairment (1%), visual impairment (1%), deaf-blindness (1%), and don’t know (2%).
Teacher characteristics
Teacher education level ranged from a high school diploma through a master’s degree, with 57% of the teachers reporting having received a bachelor’s degree or higher. This percentage is higher than the North Carolina average of 30% of teachers reporting having a bachelor’s degree or higher (Child Care Services Association, 2013), but close to the national average of 53%, reported in “the first nationally representative portrait of early care and education teachers and caregivers working directly with children” (Office of Planning, Research and Evaluation, 2013, p. 4). All public pre-K teachers in the sample had a bachelor’s degree or higher with developmental day program teachers reporting 92%, Head Start 54%, and child care with the lowest percentage at 25%. Additional information about teacher characteristics is provided in Table 4.
Demographic Characteristics of Teachers.
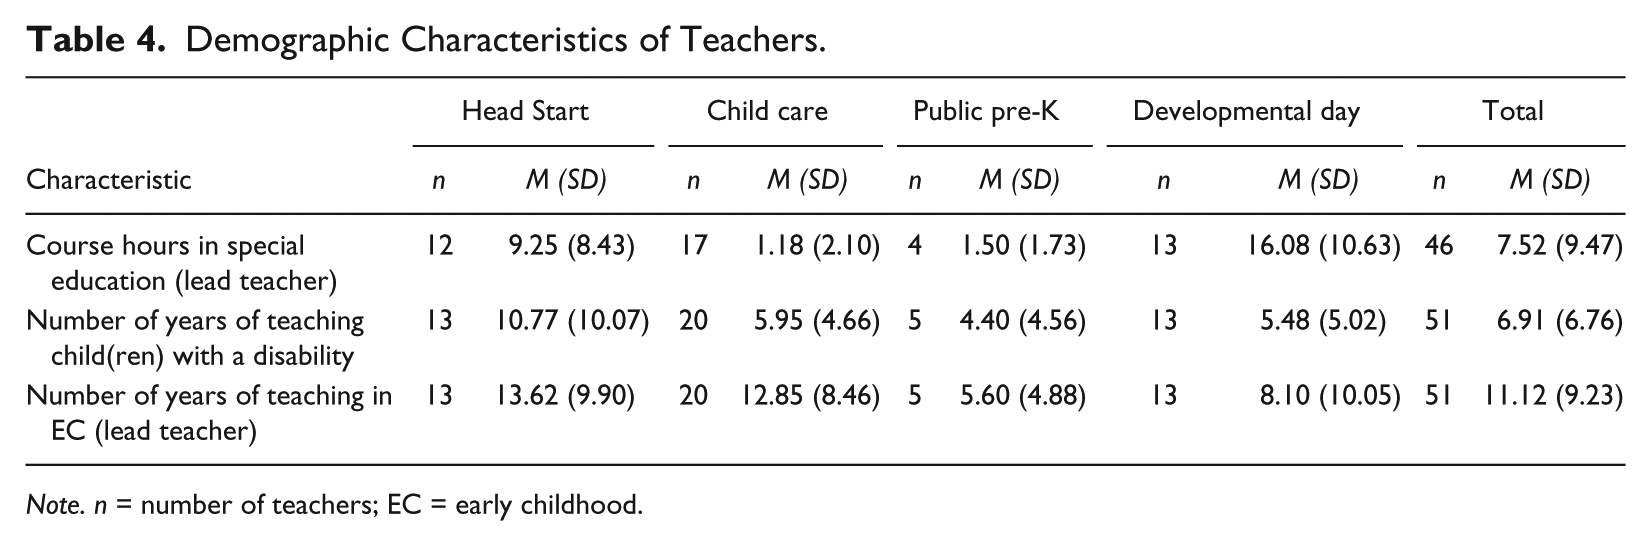
Note. n = number of teachers; EC = early childhood.
Method
Measures
The ICP
The ICP is a structured observation rating scale designed to assess the quality of classroom practices that support the developmental needs of children 2 to 5 years of age with disabilities in early childhood settings. Ratings on the ICP items indicate the extent to which program staff intentionally adapt the classroom’s environment, activities, and instructional support in ways that encourage children’s active participation in the group, through adjustments that might differ from child to child.
The ICP includes 12 items comprised of practices that have the strongest research support for meeting the developmental needs of young children with disabilities in inclusive settings. The ICP uses a 7-point Likert-type scale to rate items, with 1 indicating a low level of quality and 7 indicating a high level of quality. Each item includes a set of quality indicators listed under each level of quality. Quality indicators within each item assess key practices measured by each item. Table 5 presents the 12 ICP items with a short description of key dimensions of quality assessed by each item. A set of specific criteria is provided for each item to enable accurate and reliable ratings. The criteria operationally define the quality indicators by specifying the evidence required for scoring. To score the ICP, a rating ranging from 1 to 7 is given for each item, and the total classroom profile score is generated by computing the average rating of the scored items.
The ICP Items.
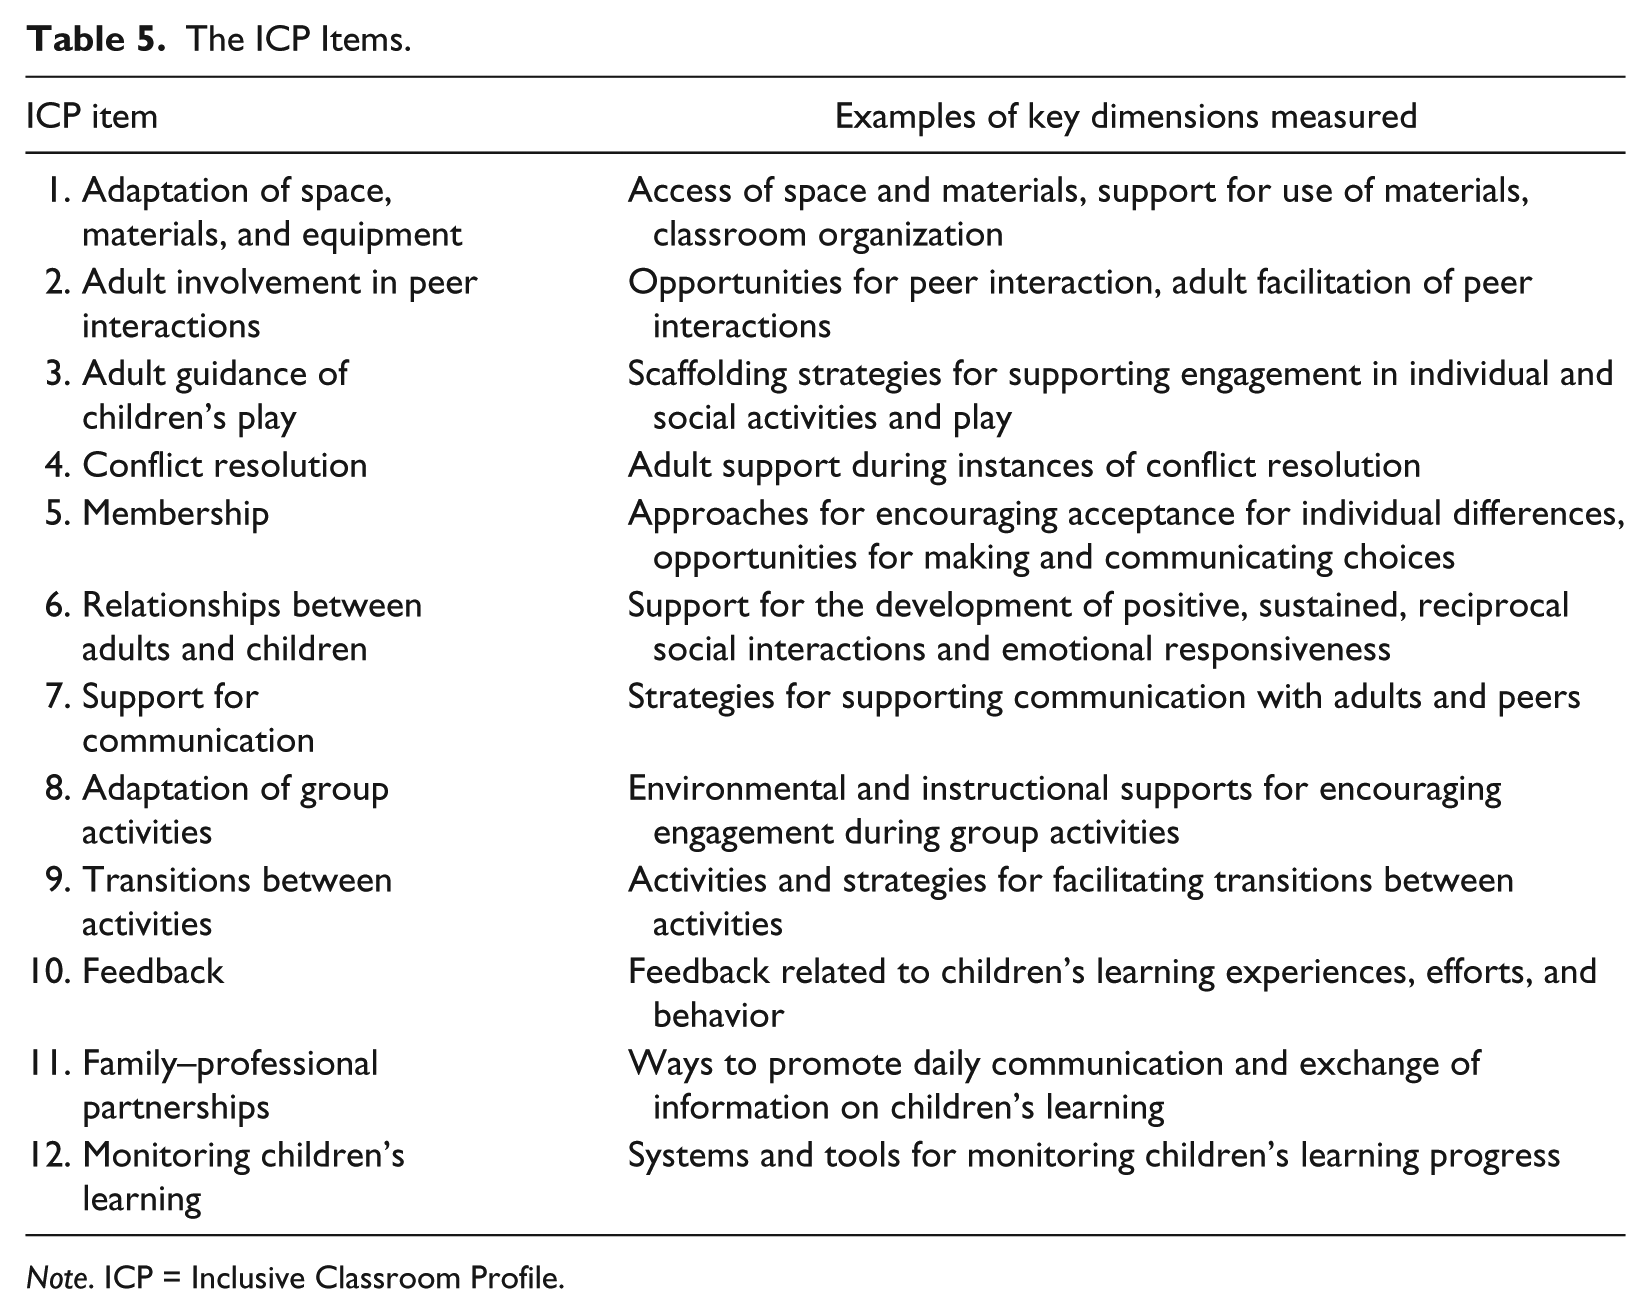
Note. ICP = Inclusive Classroom Profile.
The ICP requires a 2½- to 3-hr administration. The majority of the items are assessed through direct observation of daily classroom routines. A few items are assessed through a short teacher interview and a review of documents such as a program’s inclusion-related policies and tools for monitoring children’s learning and communicating with families.
The ICP development process began with case study field research in early childhood inclusive classrooms and a review of the international literature on preschool inclusion. Development of the ICP items involved a five-phase process, which included (a) exploratory research, (b) construct delineation, (c) item generation, (d) expert review, and (e) prepilot. A sixth phase involved field testing the ICP in 45 classrooms to formally pilot the ICP scale in the United Kingdom (Soukakou, 2012).
In the U.K. validation study (Soukakou, 2012), assessment of interrater reliability suggested that observers were highly consistent in their ratings of individual items. The mean weighted kappa score for the scale’s items was .79. Cronbach’s alpha analysis showed high internal consistency (α = .79). An exploratory factor analysis (EFA) was initially conducted using a maximum-likelihood extraction with a quartimin rotation. Examination of the scree plot and eigenvalues supported a one-factor solution with the first factor accounting for 39.1% (eigenvalue = 3.91) of the variance. Confirmatory factor analysis (CFA) supported a one-factor model that filled the assumptions with an excellent model fit. Model fit indices were χ2 = 35.164, df = 35, p = .460, RMSEA = 0.010, and CFI = 0.998. Construct validity of the ICP was examined through comparisons with three other measures of quality: the ECERS-R (Harms, Clifford, & Cryer, 2005), the Early Childhood Environment Rating Scale–Extension (ECERS-E; Sylva, Siraj-Blatchford, & Taggart, 2003), and the Caregiver Interaction Scale (CIS; Arnett, 1989). The total score of the ICP showed a .626 (p < .001) moderately high correlation with the ECERS-R, suggesting that the two instruments are measuring similar but not identical constructs. Additional patterns of correlations with the other two measures provided initial evidence for the measure’s construct validity. A detailed analysis of the ICP development and validation U.K. study is reported elsewhere (Soucacou & Sylva, 2010; Soukakou, 2012).
Early Childhood Environment Rating Scale–Revised edition (ECERS-R)
The ECERS-R (Harms et al., 2005) measure is a structured observation measure that comprehensively assesses program quality using a 7-point rating scale (1 representing inadequate practice and 7 representing excellent practice). The ECERS-R was selected for comparison with the ICP for the following reasons: (a) it has adequate reliability and validity support, (b) it served as the foundation for developing the ICP, and (c) it was considered the most suitable measure for assessing construct validity for the ICP, given the lack of other validated measures designed to assess the quality of early childhood inclusive practices. Moreover, while the ECERS-R was not designed with a focus on measuring the quality of inclusion, it does include several quality indicators of provisions for children with disabilities. For this reason, correlations between the two measures can provide useful information about the contribution of the ICP items above and beyond those included in the ECERS-R.
Social validity assessment
A short social validity survey, consisting of 22 items, was developed by researchers of the study to gather assessors’ feedback on the ease of use of the ICP, its usefulness as a tool for assessing quality in inclusive environments, and the training procedures that were provided. The survey rated the level of agreement on a 1- to 5-point scale, ranging from not at all to very much across 22 items.
Procedures
Reliability training on the ICP
Four experienced assessors from the NCRLAP conducted the ICP assessments. All four of the assessors had experience (3-12 years) conducting ERS assessments for North Carolina’s Star Rated License. One assessor was a former early interventionist, and all four had previous teaching experience in a range of community child care and public preschool and/or elementary school inclusive settings. The assessors had previously completed an additional NCRLAP certification process related to using the ERS in settings that provide care for children with special needs in inclusive or self-contained environments. In relation to the ICP training, the assessors received a 3-hr training session focused on ICP administration and scoring, followed by four reliability observations in inclusive classrooms to assess reliability proficiency, each followed by an intensive debriefing session. Each assessor met a reliability-proficiency standard of 85% agreement within 1 scale point, maintained for three consecutive reliability observations against the ICP author’s guidelines. Mean interrater agreement across assessors was 98% with a range of 91% to 100%.
Reliability training on the ECERS-R
Since 1999, NCRLAP has conducted the statewide ERS assessments as part of North Carolina’s Star Rated License. Beyond comprehensive initial training, routine checks are completed to provide ongoing training and to ensure that each assessor maintains high standards for using the ERS tools in a consistent manner. During reliability checks, the assessor visits a classroom with a reliability checker, and each person completes the assessment independently. Scores are then compared to determine interrater reliability. NCRLAP’s reliability standard is 85% for assessors and 90% for reliability checkers, both within one point of the item-level consensus scores. The NCRLAP assessors who collected data for this study had completed this rigorous initial and ongoing training.
Procedures for data collection
Four assessors from the NCRLAP collected data over a 4-month period using the ICP and the ECERS-R (Harms et al., 2005). Information on children and classrooms reported earlier in this article was gathered through teacher interview and was recorded on a classroom information form developed by the researchers of the study. Classroom and teacher information included characteristics such as class size, number of adults present in the classroom during ICP assessments, teachers’ level of qualifications, years of teaching experience in an inclusive classroom, and amount of special education coursework. For the children with disabilities, information was also gathered from the teachers on each child’s age and area, type, and severity of disability using classification categories adapted from The Abilities Index (Simeonsson & Bailey, 1991). Teachers were also asked to provide the children’s primary eligibility category on their IEP or their diagnosis based on their knowledge of the child. IEPs were not reviewed by the assessors and teachers were not required to check the child’s IEP.
Two procedures for ICP and ECERS-R data collection were used. In programs that met the criteria for the study and where there was a recent (within 4 months) publicly available ECERS-R score on file at NCRLAP, that ECERS-R score was used. For those classrooms where an already completed ECERS-R was available, only one observation, the ICP, was conducted. In classrooms where a recent ECERS-R score was not available, data were collected on both measures (ECERS-R and ICP). The ECERS-R and the ICP were conducted on two different days by two different data collectors. Four months was the maximum time span allowed between the two data collections, with the majority occurring within a month of each other. The classroom information form was completed during the ICP visit as part of the ICP teacher interview.
After data collection was completed, social validity information for the ICP was gathered to assess the ease of use and functionality of the ICP as a classroom quality assessment tool. The social validity survey was completed online by the assessors. In addition, a half-day focus group was conducted with the assessors to obtain more detailed information on (a) the ease of administration and scoring of the ICP, (b) the application of the ICP for quality assessment and improvement purposes, and (c) the training received prior to data collection. Information gathered through the focus group was synthesized across the above categories and a list of specific recommendations were developed to inform further development and revision of the tool and the training procedures.
Data analysis
Data analysis proceeded in three distinct steps. First, interrater reliability of the measure was assessed in a subset of observations using mix-paired reliability checks (Hallgren, 2012). An intraclass correlation (ICC) using a two-way random effects model, “Case 2” as described by Shrout and Fleiss (1979), was used in this step. Next, the structure of the scale itself was tested. Comparable scales, such as the ECERS-R, have multiple subscales. Although the ICP was designed to focus on classroom-level inclusive practices, the possibility of multiple underlying factors was considered. This possibility was tested as an EFA using a maximum-likelihood extraction, which allowed for an oblique rotation should multiple factors emerge. Finally, construct validity was assessed through tests of the relationship between the ICP and key variables.
Results
ICP Item Distribution and Mean Scores
The rating of ICP items in the 51 classrooms in the study ranged from the lowest to the highest end of the scale. Assessors used the entire range (1-7) of possible ratings for the majority of the items. The notable exception was on Item 1, “Adaptation of Space, Materials, and Equipment,” where all respondents scored 4 or higher. The mean rating for most items fell in the midrange of the rating scale (between 3 and 4). Table 6 presents the descriptive statistics for the ICP items. Item 2, “Adult Involvement in Peer Interactions,” received the lowest rating (m = 3.37) in the present sample. An ICP total score was calculated for each classroom by averaging the ratings of the 12 ICP items. The ICP total score showed a good variability across the classrooms with a mean of 4.39 falling in the midrange of the scale, and it was nearly normal in distribution.
Descriptive Statistics for the ICP Total Score and Items.
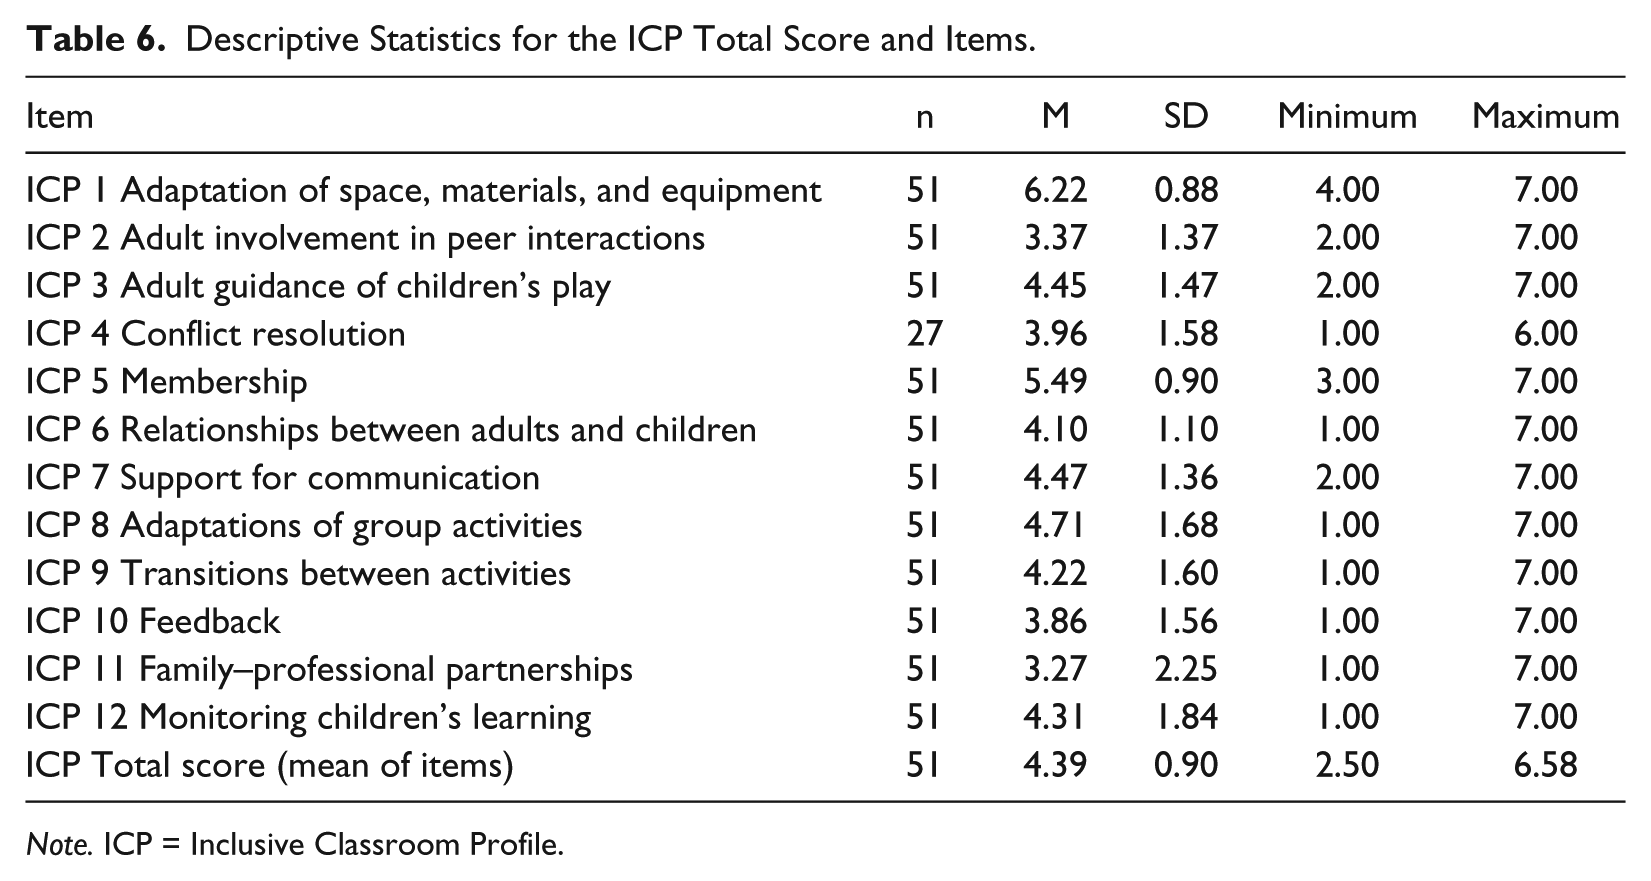
Note. ICP = Inclusive Classroom Profile.
Interrater Agreement
Interrater reliability was assessed in nine reliability paired observations (18% of the sample), distributed over the 4-month data collection period. The mean interrater agreement across reliability observations was 87% (within 1 point difference on the 7-point scale). Reliability at the item level was assessed via an ICC. Interrater reliability is often computed using Cohen’s kappa. This, however, is only appropriate for categorical variables with a relatively few number of variables. The ICC provides a method for comparing raters when the measure is ordinal or interval level (Shrout & Fleiss, 1979). For most items, agreement between raters was in an acceptable range (.51-.99) with a mean of .71. Table 7 presents the mean interrater agreement for each item across classrooms. Raters had low agreement (.11) on one item (Item 3).
Interrater Reliability at the Item Level.
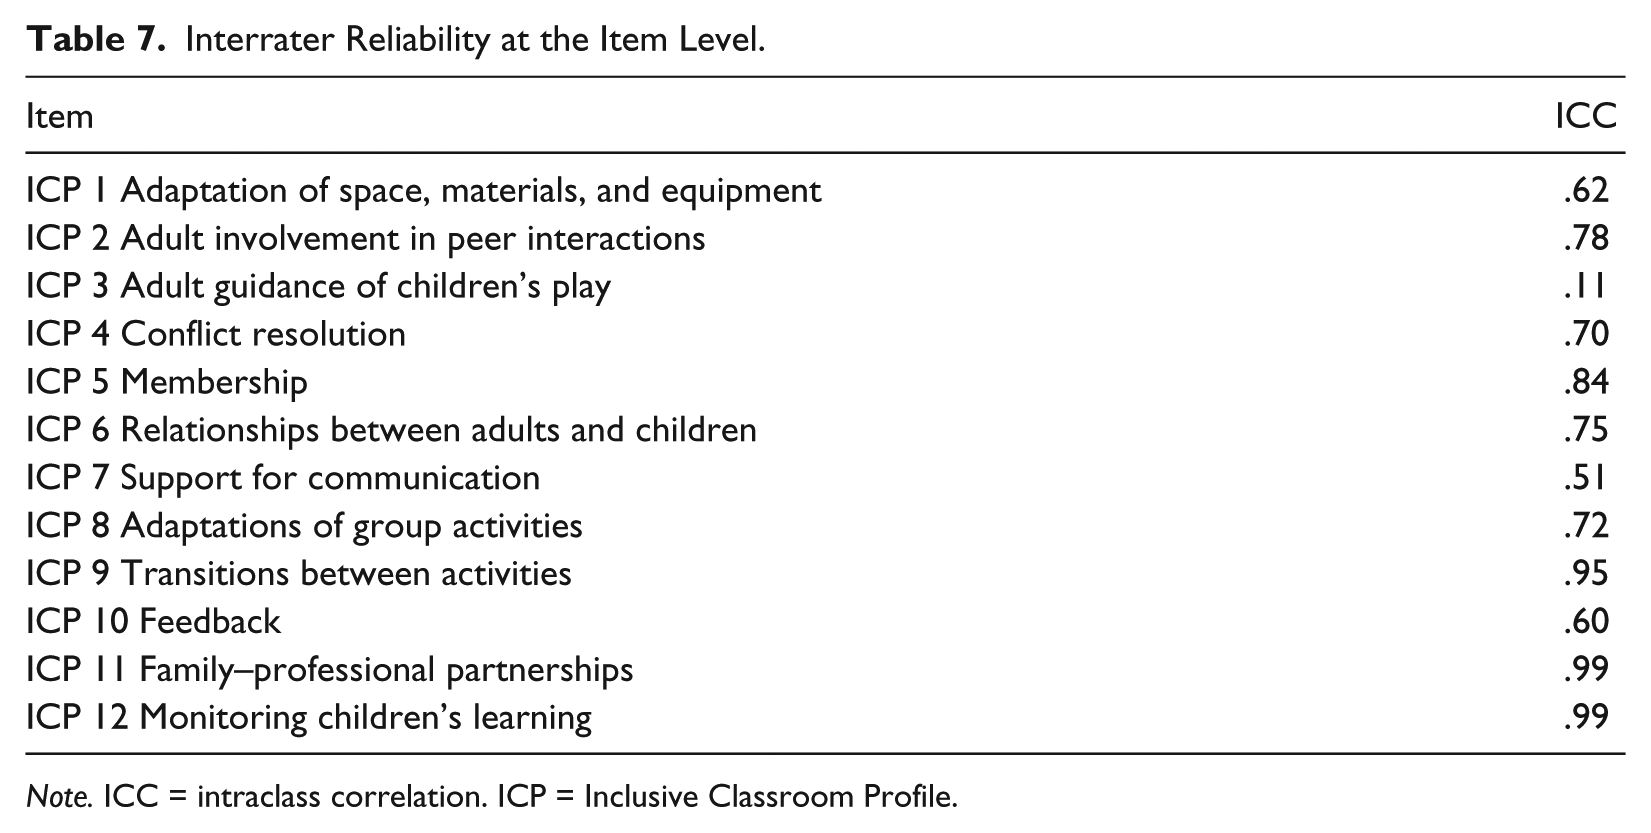
Note. ICC = intraclass correlation. ICP = Inclusive Classroom Profile.
Accuracy of ICP administration by assessors against author standards was assessed in nine classroom observations. The mean agreement between assessors’ scores and ICP author standards (consensus score) was 94% (within one) and 75% (exact agreement), indicating that assessors maintained accurate administration of the ICP throughout the study.
Factor Structure and Internal Consistency
The EFA provided strong evidence that a single-factor solution was the best fit to the data. Examination of the scree plot showed a large drop in the eigenvalue for a single factor to that for two factors, from 4.67 to 1.28 (see Figure 1). We also included a parallel analysis using the parallel analysis engine developed by Patil, Singh, Mishra, and Donavan (2007). Parallel analysis allows one to compare the model eigenvalues with those of a set of random data. The number of factors to retain is determined by the point at which the model explains more variance than the random data. As can also be seen in Figure 1, this analysis supports the single-factor solution. Changes for the addition of factors after the first were all less than 0.31. Factor loadings ranged from 0.34 (transitions between activities) to 0.84 (relationships between adults and children; see Table 8). All items were retained in the final solution.

Scree plot for Inclusive Classroom Profile factor model and parallel analysis.
Item-Total Correlations, Alpha, and Factor Loadings.
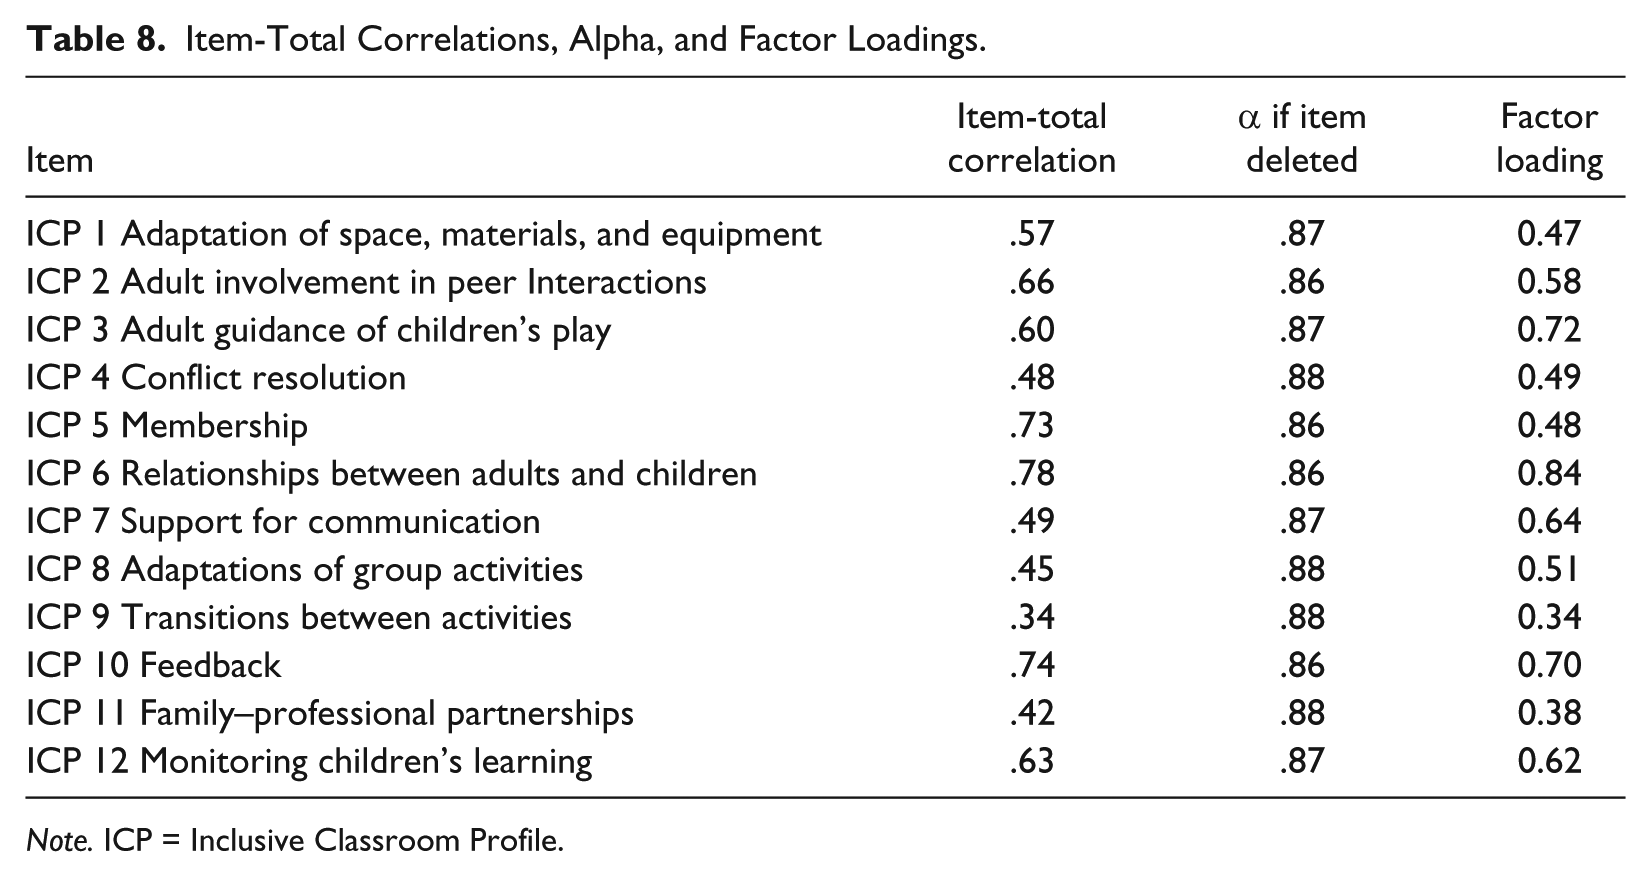
Note. ICP = Inclusive Classroom Profile.
Internal consistency
Cronbach’s alpha analysis for the 12 items suggested that the scale’s items were internally consistent (α = .88). Table 8 presents item-total correlations and changes in alpha by item.
Construct Validity
Construct validity was examined through tests of the relationship of the ICP to the ECERS-R total score and subscales, as well as to the following key variables: teacher education level, teacher special education training (course hours in special education), number of children in the classroom with an IEP, ratio between children and adults, and program type. Correlation analysis with the ECERS-R allowed testing the relationship between the ICP and constructs assessed by a widely used early childhood program quality measure with reliability and validity support. The relationship between the ICP and additional program variables, selected on the basis of research and theoretical support for their relationship to program quality, was tested. We anticipated a moderately high association for all of these variables with the ICP.
Correlation analysis between the ratings on the ICP and those on the ECERS-R (Harms et al., 2005) revealed a moderately high correlation between the total score of the ICP and the ECERS-R (r = .48), suggesting that the two instruments are measuring related, but not identical constructs. A pattern of correlations between the ICP and specific ECERS-R subscales revealed weaker correlations with two ECERS-R subscales: the “Personal Care Routines” (r = .21) and “Program Structure” (r = .29). These two subscales involve practices not measured by the ICP, whereas there were higher correlations with ECERS-R subscales, such as “Interaction” (r = .38) and “Language and Reasoning” (r = .47) that measure constructs more closely related to the ICP. The pattern of weaker correlations with constructs not intended to be measured by the ICP and stronger associations with constructs measured by both measures provide evidence for the construct validity of the ICP. Table 9 presents all correlations between the ICP and ECERS-R total and item/subscale scores.
Rank-Order Correlations Between ICP and ECERS-R.
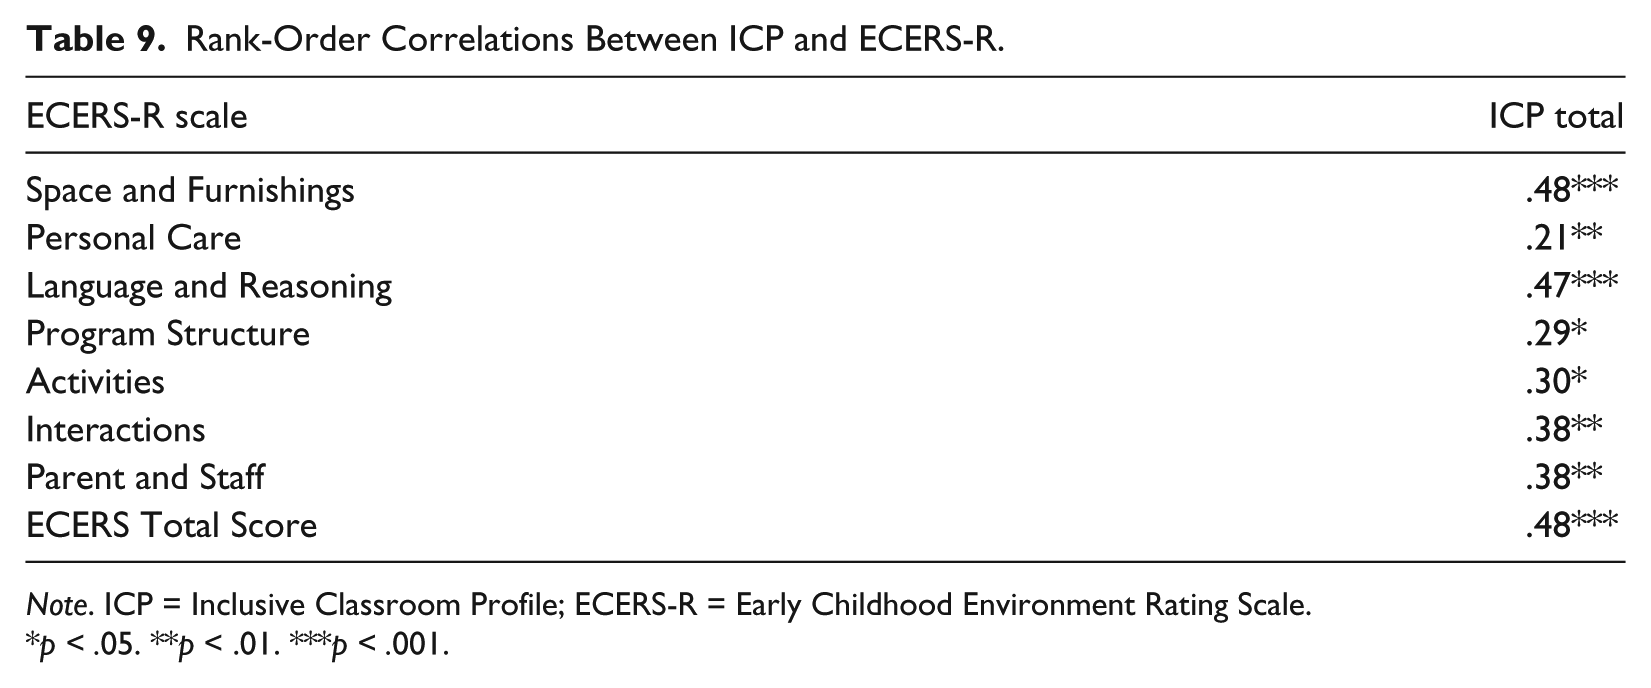
Note. ICP = Inclusive Classroom Profile; ECERS-R = Early Childhood Environment Rating Scale.
p < .05. **p < .01. ***p < .001.
The relationship between the ICP and other key variables also revealed moderate correlations. Teacher education level was correlated at r = .41, p = .003; number of course hours in special education at r = .36, p = .014; number of children with an IEP at r = .37, p = .007; and ratio between children and adults in the classroom was correlated r = −.57, p < .001. Finally, it was expected that developmental day programs and perhaps Head Start programs would have higher ICP scores because of their histories in serving young children with disabilities. Simple mean differences between program types were tested with one-way ANOVA. This model testing was significant, F(3, 47) = 13.77, p < .05 and accounted for a large amount of variance, R2 = .47, indicating that differences in program type account for nearly half of the variance in ICP scores. The model partially confirmed the expected mean differences (see Table 10). Development day programs did indeed score highest and were significantly higher than child care programs but not significantly higher than the other two program types. Head Start and public pre-K were also significantly higher than child care programs.
Inclusive Classroom Profile Mean Scores by Program Type.
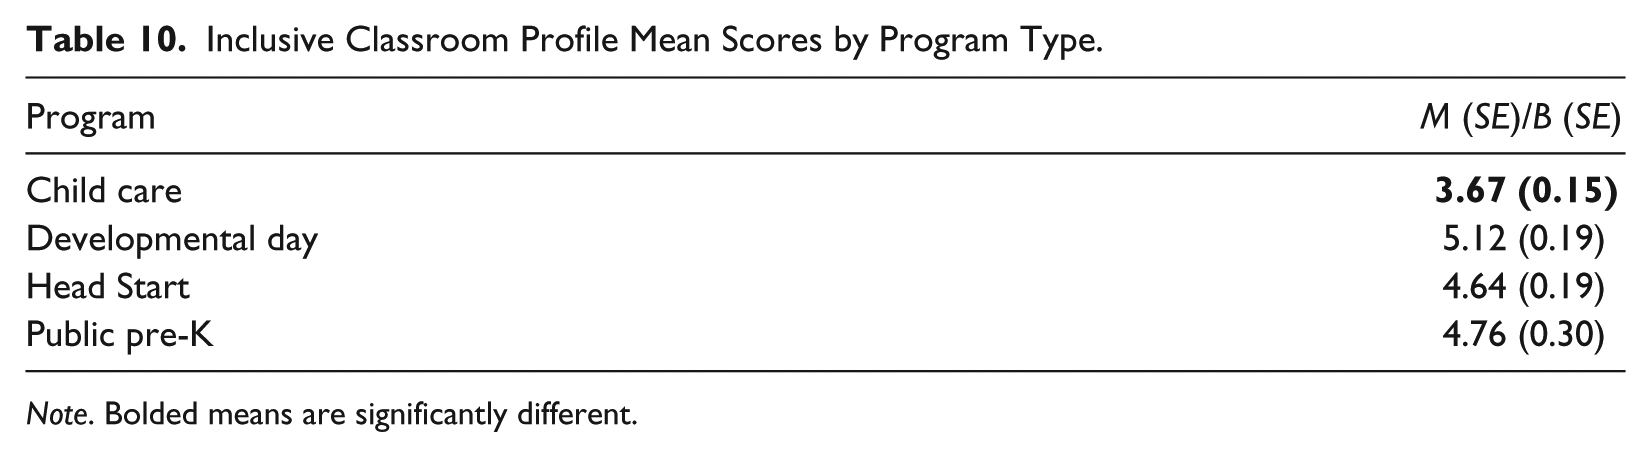
Note. Bolded means are significantly different.
Given the high correlations of the ICP with these predicted variables and the differences between program types, an exploratory analysis was conducted to further test the relationship between the ICP and these predictors. The following predictors of ICP scores were tested in a hierarchical series of five models with a predictor variable added at each step: teacher education level, number of course hours in special education, number of children in the classroom with an IEP, ratio between children and adults, and program type. ECERS-R total score was also entered as a predictor. The initial model tested for differences in ICP scores based on program type. This model was significant, F(3, 47) = 14.00 and accounted for a substantial portion of the data, R2 = .47. Adding the remaining predictors in sequence enabled us to test not only the unique contribution of each of the predictor variables but also whether the presence of one affects the apparent impact of the others. Of particular interest were the expected program type differences and whether those differences were collinear with the predictors. The significant difference for the child care programs compared with all other program types was maintained upon controlling for ECERS-R total score, teacher education, course hours in special education, and number of children with an IEP. Aside from ECERS, which was significant at p < .05, none of the remaining variables were significant. Adding ECERS increased the R2 to .58; the addition of the other variables only increased R2 to a maximum of .64. Most importantly, the pattern of means among the types of care did not change appreciably as the model was modified.
Acceptability of the ICP for Quality Assessment
A secondary objective of the study was to learn about the acceptability of the measure and the quality of the proficiency training from the data assessors, who had not been involved in the development of the ICP. Results from the social validity assessment (using a 1- to 5-point scale with 1 being low and 5 being high) indicated that assessors rated the importance of the constructs measured by the ICP very highly (m = 5) and that they would highly recommend the ICP measure to others (m = 5). With regard to the usability of the ICP, the assessors found the measure easy to administer (m = 4). Finally, assessors rated the overview training session (information on administration and scoring) as useful (m = 3.75), and all four assessors reported that they felt well prepared after the reliability training observations (m = 4). Findings from the focus group confirmed the high level of acceptability of the ICP by the assessors and guided further revision of the ICP and training program. Specifically, feedback related to administration included recommendations for organizing the interview and documentation review process of the ICP assessment. Feedback related to scoring focused on further clarifying several terms used for describing classroom practices, along with clarification of several indicator-specific scoring guidelines. Feedback related to the training emphasized the usefulness of the video examples of inclusive practices assessed by the ICP and suggested incorporating additional opportunities for scoring practice through additional interactive activities and video-based instruction.
Discussion
This article reported findings from the first U.S. pilot study of the ICP, an observation measure designed to assess the quality of inclusive classroom practices in early childhood inclusive programs. Overall, results from this study replicate previous findings from the U.K. study, providing evidence for the reliability, construct validity, and factor structure of the measure. New data on the discriminant validity of the ICP extend what is known about the measure. The reports from the small sample of assessors who were trained to proficiency to collect data for the study provide preliminary information on the acceptability and usability of the ICP.
Reliability assessments showed that assessors were able to achieve reliability proficiency upon training on the ICP (85% agreement maintained at three reliability observations), and were also able to maintain interrater agreement throughout the data collection period (M ICC = .71). One item, “Adult Guidance of Children’s Play,” had low interrater reliability in the present sample (.11). The item was retained in the measure for two reasons. Closer analysis of the interrater agreement ratings at the indicator level along with feedback from the assessors indicated that difficulty reaching agreement was centered on a few (1-2) indicators within that item as opposed to score differences across the item’s indicators; and interrater agreement results on the ICP items from a previous study had shown a high interrater agreement for the same item (.92) as measured by Cohen’s kappa analysis. Given the promising psychometric properties of the item based on current analysis (factor structure, internal consistency, and social validity results), the item was retained in the ICP total score for analysis in this study.
Consistent with previous findings on the factor structure and internal reliability of the ICP, results from EFA confirmed a one-factor solution model fit and showed high internal consistency for the ICP items. With regard to construct validity, the present study replicated a similar pattern of moderately higher and lower correlations between the ICP and subscale scores of the ECERS-R confirming evidence of construct validity.
New information on the differences of classroom quality between types of programs (public pre-K, Head Start, developmental day programs, and child care) provides initial evidence for the measure’s ability to discriminate among types of programs, further strengthening the measure’s construct validity. In this pilot sample, the quality of inclusive practices as observed by the ICP in child care programs was significantly lower compared with other types of programs. The developmental day classrooms had the highest ICP scores. This finding most likely reflects the fact that child care programs have never had a direct mandate or mission associated with serving children with disabilities. Nor have they had the technical assistance related to serving children with disabilities, which has been available historically to developmental day programs through state initiatives. This technical assistance support may be associated with the finding that children with disabilities in developmental day programs were more likely to receive their services in their regular classrooms as compared with child care, Head Start, and public pre-K classrooms where specialized services were delivered elsewhere. A factor that was not tested in the regression model that one could speculate might negatively affect ICP scores was the level of severity of disabilities of the children being served. However, as depicted in Table 2, the majority of children across all program types had moderate or severe disabilities.
Exploration of the social validity of the ICP indicated that assessors found the practices assessed in the measure useful and accepted its use for quality assessment and professional development. The four assessors who collected data in this study were highly experienced and had been conducting program quality assessments for the state of North Carolina using measures such as the ECERS-R and the CLASS.
Limitations and Directions for Future Research
This pilot study provided further evidence for the psychometric properties of the ICP in the first U.S. sample. At the same time, size and characteristics of the pilot sample limit the generalization of the present results. While recruitment efforts aimed at enrolling a sample diverse enough to test the ICP items in classrooms that varied in type of program, general program quality, number of children with disabilities, as well as in the type and severity of children’s disability, the present sample included fewer public pre-K programs compared with other types. Therefore, additional research is needed to assess the reliability and validity of the ICP in larger and more diverse samples with respect to program, child, and classroom characteristics. For example, future studies should pilot the ICP in programs that serve greater numbers of children with disabilities. Also, the present sample included fewer “low quality” classrooms based on the North Carolina star rating system. This was, in part, because most available ECERS-R assessments were scored at a “fair” to “good” level of quality (based on ECERS-R scores) and many 1- to 2-star programs that were contacted did not respond to invitations to participate.
In addition, while the ICP was designed to be used in classrooms serving children 2 to 5 years of age, in this pilot sample children’s age ranged between 3.20 and 4.62. Therefore, piloting the ICP in classrooms that include younger children will be important for assessing the usability of the tool with additional age groups. The association between child age and type of disability and psychometric information on the measure would be also important to explore in future studies.
With respect to feasibility of implementation, exploration of the social validity of the ICP indicated that the highly experienced assessors who participated in the study were able to be trained accurately and reliably on the ICP. However, because information on the acceptability of the ICP was gathered from only four assessors, more research is needed to examine the effectiveness of training procedures with a larger number of assessors as well as with less experienced assessors. Currently, training in using the ICP involves a 4- to 5-day proficiency and reliability program. Piloting the measure with diverse users will allow us to identify recommended prerequisites for participation in training (e.g., familiarity with inclusion, experience using observational measures) and to adjust the training program according to individual learner characteristics. While interrater reliability scores for the overall measure were acceptable, there was one item that had low interrater reliability. Revisions to the scoring guidelines and training procedures are being made to address this limitation. Interrater reliability is being measured as part of this ongoing work. Finally, this study did not assess the predictive validity of the ICP. Future research is needed to explore the relationship between the ICP ratings and outcomes for children with disabilities and their families. Examination of the relationship between the ICP and additional measures of classroom quality can also provide important information on the construct validity of the ICP.
Implications for Research, Policy, Professional Development, and Practice
Findings from the present study have implications for use of the ICP in research, policy, classroom quality assessment, and professional development. As a research instrument, the ICP could be used to assess and compare quality across inclusive programs, as well as to examine the relationship between quality of inclusive practices and outcomes for children with disabilities and their families. Efforts are underway to develop online, web-based materials for training assessors to reliably and accurately administer the ICP.
The ICP also could be used as a quality assessment measure to evaluate the quality of inclusion at a classroom level. A growing number of states and communities who are developing and improving quality initiatives to increase the focus on high needs children have expressed interest in the ICP as part of that work. Building the capacity to provide information and training about the ICP is a priority. Additional research is needed to study the use of ICP in the context of program evaluation.
A third use of the ICP is by administrators, supervisors, coaches, and consultants for professional development and program improvements. The majority of early childhood personnel are not adequately prepared to implement instructional and curricular modifications to ensure that young children with disabilities make progress and experience early school success (Chang, Early, & Winton, 2005; Early & Winton, 2001; Hyson, Horm, & Winton, 2012). In addition, once employed, evidence suggests that early childhood teachers do not receive adequate support to feel competent or confident in implementing inclusive practices (Buysse, Wesley, Keyes, & Bailey, 1996). Currently, there is no reliable and valid measure of high-quality inclusive practices that can serve as a general rubric for self, peer, or coach assessment that might guide professional development interventions that support inclusion. The ICP can potentially meet that need by serving in an assessment capacity as part of a training approach that strategically links data with instructional decision making. A number of states, communities, and projects have expressed interest in coupling the ICP with professional development interventions designed to support teachers in implementing evidence-based inclusion practices into their early childhood settings. More research is needed to examine the use of ICP in professional development. Developing and testing a framework for ways that the ICP can serve as an assessment component of a professional development approach is a key focus for continuing efforts by the lead authors.
Footnotes
Acknowledgements
Thanks to the North Carolina Rated License Assessment Project (NCRLAP) team of assessors and to Ben Kurgat for their important work in all phases of data collection, management, and analysis.
Declaration of Conflicting Interests
The author(s) declared no potential conflicts of interest with respect to the research, authorship, and/or publication of this article.
Funding
The author(s) disclosed receipt of the following financial support for the research, authorship, and/or publication of this article: This work was funded by the National Professional Development Center on Inclusion (NPDCI), through a grant from the Office of Special Education Program, U.S. Department of Education; Frank Porter Graham Child Development Institute, University of North Carolina; the North Carolina Rated License Assessment Project; the Division of Child Development and Early Education; and the North Carolina Department of Public Instruction, Exceptional Children.