



Abstract
A simulation study that used 3,000 computer-generated event streams with known behavior rates, interval durations, and session durations was conducted to test whether the main and interaction effects of true rate and interval duration affect the error level of uncorrected and Poisson-transformed (i.e., corrected) count as estimated by partial-interval recording. For both count estimates, shorter intervals and lower true rates resulted in less error than longer intervals and higher rates. For all conditions tested, Poisson-corrected estimates were more accurate than uncorrected estimates. Therefore, using Poisson-corrected estimates and short intervals are recommended when partial-interval recording is used to estimate counts. Generality of results might be restricted to events that are about 1-s long. A URL was provided to aid in the computation of corrected counts.
Introduction
Practitioners serving young children in early intervention/early childhood special education (EI/ECSE) contexts should use progress monitoring to evaluate learning and identify the need for intervention modifications (Division for Early Childhood, 2014; Ledford et al., 2016). Some behaviors can be quantified easily via observation; for example, by identifying the number of times it occurs (count), for how long it occurs (duration), or the degree to which it occurs correctly rather than incorrectly (accuracy; Ayres & Ledford, 2014). Each of these methods can be described as continuous timed-event sampling measurement (i.e., all behavior is measured and the time of occurrence is recorded), but this type of measurement may be too resource-intensive to be feasible for some behaviors in EI/ECSE contexts (Ayres & Ledford, 2014). In addition, some critical behaviors in early childhood settings (e.g., engagement, play diversity) may be difficult to quantify using continuous data collection methods. Thus, alternative systems are needed that are not only feasible but also valid and reliable.
Partial-Interval Recording (PIR)
Three interval-based recording systems, sometimes referred to as discontinuous methods, are commonly used in educational research: PIR, whole-interval recording, and momentary time sampling. When using these systems, an observation session is divided into intervals (often between 5 and 30 s in duration for research with young children; Lane & Ledford, 2014), which are then scored for the presence or absence of a behavior of interest. For PIR, the most commonly used discontinuous method, an occurrence of behavior is scored for an interval when an event occurs at any time during the interval. Once a single behavior has been identified as an occurrence within an interval, additional occurrences of the behavior within the same interval do not change how the interval is scored.
PIR is more feasible than using continuous measurement (e.g., timed-event behavior sampling) in low-resourced contexts. For example, partial-interval recording does not require us to separate events that occur close in time (i.e., segmenting). Such segmenting is required in continuous measurement using timed-event sampling (Yoder & Symons, 2010). Adding to its efficiency, live simultaneous scoring of multiple event types within a participant is possible with PIR (Ayres & Ledford, 2014).
Interval-based recording is often used, with researchers estimating occurrence at about 45% of published single-case research in both ECSE (Lane & Ledford, 2014) and behavioral research (in the Journal of Applied Behavior Analysis; Mudford, Taylor, & Martin, 2009). It is also commonly used in other experimental research (e.g., randomized controlled trials; Lawton & Kasari, 2012) and in descriptive studies (e.g., Chung, Carter, & Sisco, 2012). Among the interval-based recording methods, PIR is the most commonly used interval-based method in ECSE research (used in approximately 29% of recent studies), particularly in intervention studies designed to increase the occurrence of prosocial behaviors (Lane & Ledford, 2014). Another review reported the use of PIR for nearly 80% of studies related to functional analyses in classroom settings (Lloyd, Weaver, & Staubitz, 2016). Thus, PIR is widely used in research for individuals with disabilities.
Potential Problems With the Use of PIR
Even when we do not explicitly recognize it, we are estimating count or duration when using interval-based recording. The natural units that quantify “amount” of a behavior are count and duration, not intervals. In addition, it is important to recognize which metric, count versus duration, we are estimating because the type of interval recording that best estimates count is different from that which best estimates duration. Although previous research has shown that PIR estimates are inaccurate for estimating both count and duration (Harrop & Daniels, 1986; Ledford, Ayres, Lane, & Lam, 2015; Powell, Martindale, Kulp, Martindale, & Bauman, 1977), PIR is better than momentary or whole-interval approaches for estimating count for behaviors with relatively short durations (Devine, Rapp, Testa, Henrickson, & Schnerch, 2011; Meany-Daboul, Roscoe, Bourret, & Ahearn, 2007; Schmidt, Rapp, Novotny, & Lood, 2013).
Even when PIR is estimating count, error occurs in PIR when more than one event occurs in an interval. For brief events (i.e., those most relevant for count estimation), multiple occurrences of the key event will occur more often when (a) intervals are long and (b) rate of the key behavior is high. For example, many behaviors of interest to ECSE researchers and practitioners (e.g., utterances of young children with autism, number of hits by a young child who engages in self-injurious behavior) may occur clustered in time (e.g., many occur within a short time frame). When this occurs and PIR is used to quantify count, a single occurrence will be recorded, even when multiple instances of the behavior occurred within the interval. When this single interval is used in an estimate of count, the use of PIR results in a lower estimate than the actual count of the behaviors. The effect of interval duration on error level of PIR-estimated count relative to true count has been documented—the longer the interval, the more error (Ledford et al., 2015; Mann, Ten Have, Plunkett, & Meisels, 1991). The effect of true rate on error has also been documented—the higher the true rate, the more error (Mann et al., 1991).
Given that PIR is usually used to estimate the number of onsets of brief events (i.e., count), we can quantify PIR’s error in estimating count by comparing it with count derived from timed-event behavior sampling. We can compute amount of error as percent of the timed-event count. For example, if a timed-event estimate of count is 100 but the PIR estimate is 60, then the percent error is 40% (i.e., {[100 − 60] / 100} × 100).
For high rate data (i.e., more than 8 events/min), Mann et al. (1991) demonstrated a 200% error level for PIR-estimated count even when the interval duration was only 5 s. Thus, even when brief intervals are used, count estimates generated with PIR have error levels that some researchers consider unacceptable (Mann et al., 1991; Repp, Roberts, Slack, Repp, & Berkler, 1976).
It is not clear whether the effect of interval duration and true rate on PIR-estimated count is additive (i.e., detected by main effects) or multiplicative (i.e., detected by a statistical interaction of true rate and interval duration). The effect of these factors on PIR-estimated error levels may be particularly important because research often requires a priori decision making regarding metric and behavior sampling in situations in which true rate is not known or is likely to change (e.g., between baseline and intervention conditions or depending on group assignment). Moreover, syntheses (e.g., meta-analyses) often involve summarizing across outcomes measured with continuous recording and via PIR with varying interval durations. Combining effects across low-error and high-error count estimation measures results in less accurate literature syntheses than would be the case if we could reduce the error of PIR to estimate count. Researchers in ECSE need an estimate of count that minimizes error under many true rate and interval duration conditions.
Using Poisson Correction to Mitigate Problems With Use of PIR
One suggested solution to the high error of PIR-estimated count has been to use a Poisson correction (Mann et al., 1991). Altmann and Wagner (1970) clarified the rationale for using the Poisson correction of PIR-estimated count estimates. They noted that PIR-estimated counts (what they called Hansen frequencies) have been used in ethology (i.e., the study of animal behavior) since 1929. However, all agree that such estimates were not “true frequency of occurrence[s].” Altmann and Wagner proposed that the temporal distribution of a behavior can be estimated by a Poisson probability distribution if we provide the proportion of intervals without the key behavior and the duration of the interval. Altmann and Wagner also indicated that using the Poisson correction makes certain the underlying assumptions that will never perfectly be met in nature. The question is not whether perfect estimation of count results from Poisson correction of PIR-estimated count but rather whether using the Poisson process to transform PIR-estimated counts results in an estimate of count that is more accurate than untransformed PIR-estimated counts. The Poisson distribution is a frequently used distribution to describe the probability of a particular rate of occurrence given observed constraints (Woolfson, 2008). Woolfson (2008) described the distribution and its assumptions. The Poisson distribution applies when (a) the event is something that can be counted in whole numbers and (b) it is possible to count how many events have occurred, but meaningless to ask how many such events have not occurred. Counts fit these characteristics well. Technically, Poisson distributions estimate count most accurately when the average frequency of occurrence for the time period in question is known. In reality, rather than a true frequency, we know the proportion of intervals in which coders do not record the key event (i.e., “empty intervals”). The transformation uses this information instead of the true average frequency. Similar to Altmann and Wagner (1970), Mann et al. (1991) did not claim that Poisson transformation resulted in accurate count estimation because they recognized that particular situations might not fit the assumptions of the distribution. For example, Poisson distributions might be more accurate when the average inter-response time is known. Unfortunately, we do not usually know the average inter-response time. However, even without such information and with only estimates of the average frequency, the Poisson transformation may still be more accurate than uncorrected PIR count estimates. Thus, the Poisson transformation that Mann et al. proposed uses the mean of the Poisson distribution to estimate count given a particular interval duration and the number of intervals of nonoccurrence. Doing so assumes that a certain number of intervals scored as occurrences include more than a single event (Woolfson, 2008). Using the Poisson distribution to estimate count is thought to be more trustworthy than using the proportion of intervals with at least one event because uncorrected PIR count estimates do not provide information on the number of events in an interval, beyond a minimum of one event. In addition, the accuracy of Poisson correction is affected by interval duration—the longer the interval, the less successful the correction will be. Finally, the correction will logically work better for short duration events because long events are more likely to be observed across multiple intervals. Thus, we applied the Poisson correction to brief duration events (i.e., 1 s). Given these constraints, Poisson-corrected count estimates should overestimate true count. Using a single data set, Mann and colleagues (1991) showed that using the Poisson correction produced substantially lower error levels than uncorrected PIR estimates of count. However, even for the shortest interval (i.e., 5 s), the mean error was still more than 20% for the Poisson-corrected counts. Importantly, the rate of behavior in this demonstration study was quite high (i.e., about 8 events/min) relative to typical rates of behavior of interest in ECSE (i.e., typically below 5 events/min; see later described literature review findings). Because the Poisson distribution is more accurate for “rare” events, this difference probably matters (Woolfson, 2008). It is not clear what rate should be considered rare in the statistical literature. The current study seeks to clarify this value. Thus, we do not know the percentage error that Poisson correction produces when the true rate is more typical of those of interest in ECSE research.
Rationale and Research Hypotheses
Additional data are needed to determine the error produced by Poisson-corrected PIR-estimated count for rates of behavior typically demonstrated in research relevant to ECSE. To date, no systematic analyses exist regarding error levels of PIR-estimated counts and the use of Poisson correction of such count estimates, with attention to the interactions associated with interval size and true rate. Our first hypothesis was that there would be a substantial statistical interaction effect of true rate by interval duration on the mean error levels of uncorrected and Poisson-corrected, PIR-estimated counts. Second, we expected Poisson-corrected estimates to be more accurate than uncorrected estimates for a variety of interval duration and true rate conditions. Finally, we sought to identify the mean percentage error and confidence interval around the mean for uncorrected and Poisson-corrected PIR-estimated counts in a variety of true rate and interval duration conditions. This last normative information could be used to begin a dialogue regarding how much error warrants transforming PIR-estimated count.
Because manipulating true count and interval duration provides the most internally valid test of the effects of count and interval duration on error, a simulation that produced known count and interval duration was required. A simulation is a study that tests hypotheses with computer-generated data with known properties. Grounding the levels of true rate and interval duration in the ECSE literature improved the degree to which the results of the simulation inform real-world applications.
Method
Literature Review That Guided the Selection of “True Rate” in the Simulation
To identify true rates of behavior likely to occur in ECSE research, a limited literature review was conducted for four journals commonly publishing single-case ECSE research: Education and Treatment of Children, Journal of Early Intervention, Journal of Positive Behavior Interventions, and Topics in Early Childhood Special Education. In addition, articles from a fifth journal likely to include articles with interventions designed to decrease behavior (Journal of Applied Behavior Analysis) were included because the initial four journals included many more articles with a stated purpose of increasing rather than decreasing behaviors. A hand search was conducted in January 2016 for each journal for all issues published in 2015 and any available issues from 2016. Inclusion criteria were (a) plotted data, (b) clearly demarcated y-axis scale, so that values could be extracted, (c) inclusion of at least one dependent variable related to rate (number per min; studies reporting count and session time were included, and data were converted to rate), and (d) inclusion of a baseline-intervention comparison (e.g., multiple baseline designs, alternating treatments design with an ongoing baseline condition) for the purposes of increasing a desirable behavior or decreasing a problematic behavior. For each baseline-intervention comparison (e.g., each panel in multiple baseline studies, A-B conditions in withdrawal studies), the purpose (increase or decrease behavior) was coded and mean value of data points in the first intervention condition (increase studies) or first baseline condition (decrease studies) was extracted using Plot Digitizer (Huwaldt, 2015). We decided to focus on the baseline condition for decrease studies and intervention condition for increase studies because these were the phases in which the higher rate was most likely to occur. Higher rates are logically more problematic for PIR to estimate than are lower rates. One outlying value (18.42 occurrences per min) was removed from the analysis. Four values were identified across 60 studies (26 decrease, 34 increase). The minimum and mean rates estimated for increase studies were 0.03 and 1.49 occurrences per min, respectively. The mean and trimmed maximum rates of decrease studies were 2.02 and 4.96 occurrences per min, respectively. Because a rate of 0.03 occurrence per min was too low to yield meaningful results (i.e., a single occurrence was unlikely, given the simulated session lengths), the remaining three values were used in the current simulation study (i.e., the mean rate for increase in the treatment phase, the mean rate for decrease in the baseline phase, and the maximum for decrease in the baseline phase). The mean rates were selected to provide situations that were most typical of ECSE studies. We also wanted to model a probable worst case scenario for ECSE studies. We selected the trimmed maximum rate for decrease studies instead of the maximum for increase studies because the former was highest of the two values.
Literature Review That Guided the Selection of Interval Durations Modeled
A previously published article (Lane & Ledford, 2014) described the extent to which interval-based systems were used in recently published research in EI/ECSE (i.e., with children below the age of 8 who had disabilities or were identified as “at risk”). In addition, this review identified characteristics of interval-based systems used (e.g., type of system, interval duration, behavior type). The results of this review indicated that the minimum, median, and maximum interval durations were 5, 10, and 30 s long. We used these data from the published review to inform interval sizes used in the simulation described below.
Simulation
The fourth author wrote the code for and implemented the program to generate the data and summarize the results for the simulation. The Microsoft Visual Basic code was written using the Microsoft Visual Studio. Three thousand behavior streams were generated such that 1,000 each were generated using true rates of 1.49/min, 2.02/min, and 4.96/min, respectively. That is, three true rate groups of 1,000 cases each were generated.
The process by which behavior streams were generated involved randomly selecting a session duration using a uniform distribution with a minimum and maximum between 900 s (i.e., 15 min) and 3,600 s (i.e., 60 min). Variable session duration was necessary to provide variation in count under each of the true rate conditions. Fifteen and 60 min were used because they represent reasonable observation session durations in ECSE. The process ensured that 250 behavior streams that occurred in each session duration quartile crossed within levels of the true rate factor. Using the selected session duration and assigned true rate, the true count was computed and each instance of the event type was randomly placed along the time line (separated in seconds) using a uniform distribution with a minimum of zero to a maximum of the selected session duration in seconds.
For each behavior stream, counts were estimated using the PIR method under three interval duration conditions (i.e., 5 s, 10 s, or 30 s). Using the partial-interval method, intervals with at least one instance of the onset of the key event type were counted and recorded. These were called the uncorrected count.
Each uncorrected count was transformed to Poisson-corrected count and recorded. Altmann and Wagner (1970) suggested using the following formula, using Excel notation for the natural log, to transform the uncorrected count estimate to Poisson-corrected rate per second:

Once Poisson-corrected rate has been computed, Poisson-corrected count was computed by multiplying Poisson-corrected rate by session duration in seconds. Session duration refers to the part of the session in which active observation occurred, not record intervals. An Excel spreadsheet with the formula is provided at http://tinyurl.com/Poisson-Correction
Two dependent variables were used: Mean Percentage Error (MPE) and Mean Absolute Percentage Error (MAPE). The former is used to indicate the average error with direction of error indicated (i.e., bias). When the MPE value was a negative number, the estimated count was an overestimate of true count, and when it was a positive number, the estimate was an underestimate of true count. The latter is used to indicate the amount of error without regard to direction of error (i.e., accuracy). The formula for MPE was taken as follows:

The formula for MAPE was taken as follows:

We used two metrics to judge the error for uncorrected and Poisson-corrected PIR-estimated count because they can differ when an estimation method produces underestimates and overestimates of the true rate. For example, if events occur at the border of two intervals, uncorrected PIR will count an event as occurring in both intervals. This would produce a situation in which MAPE > MPE. These metrics were computed for uncorrected and for Poisson-corrected estimated count estimates. IBM SPSS Statistics for Windows, Version 22 software was used to conduct the analyses (IBM Corp., 2013).
Results
Without considering true rate or interval duration, uncorrected count underestimates true count, on average, by 23% (MPE; SD = 10%). In contrast, Poisson-corrected count overestimates true count, on average, by 4% (MPE; SD = 6%). With regard to accuracy (i.e., MAPE), uncorrected count has an average 23% error (SD = 9.6%) and Poisson-corrected count has an average 6.5% (SD = 4.6%) error. Given that MPE and MAPE are equal for uncorrected partial-interval count, we can conclude that all the uncorrected estimates are underestimates. Because MPE is less than MAPE for Poisson-corrected count, we can conclude that, although most of the errors are overestimates, a minority are underestimates.
To test the interpretation that MAPE did not provide additional information over MPE for uncorrected interval-estimated counts but did for Poisson-corrected interval-estimated counts, we computed the correlation coefficient between the two. As expected, the correlation between MAPE and MPE for uncorrected estimates was a perfect positive association, r = 1.0. In contrast, the correlations between MAPE and MPE for Poisson-corrected interval-estimated counts were –.75, –.64, and –.81 for 5 s, 10 s, and 30 s intervals, respectively. The results for Poisson-counted interval-estimated counts were analyzed and presented for both MAPE and MPE (i.e., accuracy and average bias). The results for the uncorrected PIR estimated count is just on MPE.
Test of First Hypothesis: Interval Duration and True Rate Affect Bias and Error
A mixed ANOVA was used in which true rate was a between-case factor with three levels and interval duration was a within-case factor with three levels. The assumption of sphericity was violated for all analyses. Thus, the Greenhouse–Geisser correction was used to test Interval Duration × True Rate interactions (Greenhouse & Geisser, 1959). The hypothesis that interval duration would statistically interact with true rate to predict error and bias was confirmed for both uncorrected and Poisson-corrected interval-estimated counts.
Uncorrected interval-estimated count
We found a very large effect of True Count × Interval Duration on bias level of uncorrected estimates, F(4, 5302.4) = 8,004, p < .001; η2p = .84. That is, the effect of interval duration on bias level introduced using uncorrected, PIR-estimated count depended in part on the true rate in the data.
Poisson-corrected interval-estimated count
The effect size for the same interaction on MPE levels of the Poisson-corrected estimate was small to medium, F(4, 3431.8) = 70.8, p < .001; η2p = .045. The effect size for the same interaction on MAPE levels of the Poisson-corrected estimate was medium, F(2.3, 3463) = 124.6, p < .001; η2p = .08. Again, the effect of interval duration on bias and error level produced using Poisson-corrected, PIR-estimated count varied by true rate in the data.
All three effect sizes were judged to be nontrivial. Thus, mean accuracy and bias levels for the uncorrected and Poisson-corrected count estimates were presented at the most detailed level the design afforded in later parts of this “Results” section.
Figure 1 displays the MPE by interval duration for the three rate groups. Ten percent error (+/–) was marked to provide a benchmark, beyond which we judged the error to be unacceptably high (Lane & Ledford, 2014). The uncorrected count estimate produced higher than this threshold for all but two conditions (i.e., the two mean rate conditions with the minimum interval duration). In contrast, the Poisson-corrected count estimate produced a mean bias and mean accuracy level that was less than this threshold in all but one condition (i.e., the maximum true rate and maximum interval duration condition). MAPE is not displayed in Figure 1 because the same pattern of results occurs and doing so renders the figure less comprehensible.
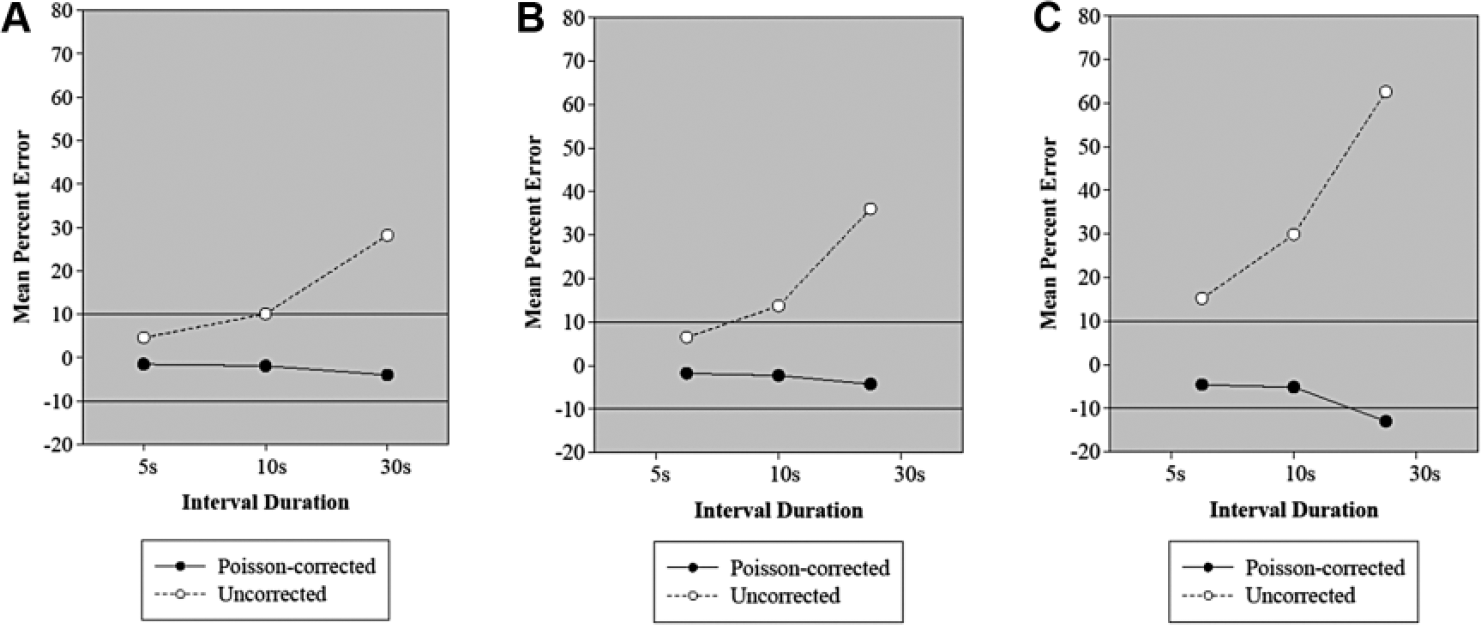
Mean Percentage Error (MPE), an estimate of bias for uncorrected and Poisson-corrected count estimates by true rate and interval duration: (A) 1.49 events/min, (B) 2.02 events/min, (C) 4.96 events/min.
Test of the Second Hypothesis: Poisson-Corrected Estimates Have Less Error and Bias Than Uncorrected Estimates
The second hypothesis was confirmed. Even when restricted to the conditions for which the uncorrected estimate produced the least bias and error (i.e., shortest interval, lowest true rate), the effect size for the difference in bias or error between uncorrected and Poisson-corrected count was still large. For bias, the within-subjects’ d = .75, p < .001, with less mean bias for the Poisson-corrected count. For error, the within-subjects’ d = 1.18, p < .001. Other effect sizes, also showing less bias and error for Poisson-corrected count, were even larger (d > .75).
The data addressing the third goal of the article are provided in Table 1, which contains the mean error and bias (and their confidence intervals) at the level resulting from crossing true rate with the interval duration. The confidence intervals were very tightly bound around the mean bias and error estimates because the sample size per rate group was so large (i.e., n = 1,000). Thus, the means are trustworthy estimates of the error and bias that one is likely to find under conditions common in the 60 ECSE and behavioral research studies we reviewed, given the constraints of the simulation.
Means and 95% Confidence Intervals for Percent Bias or Error by True Rate and Interval Duration for Uncorrected and Poisson-Corrected Count Estimates.
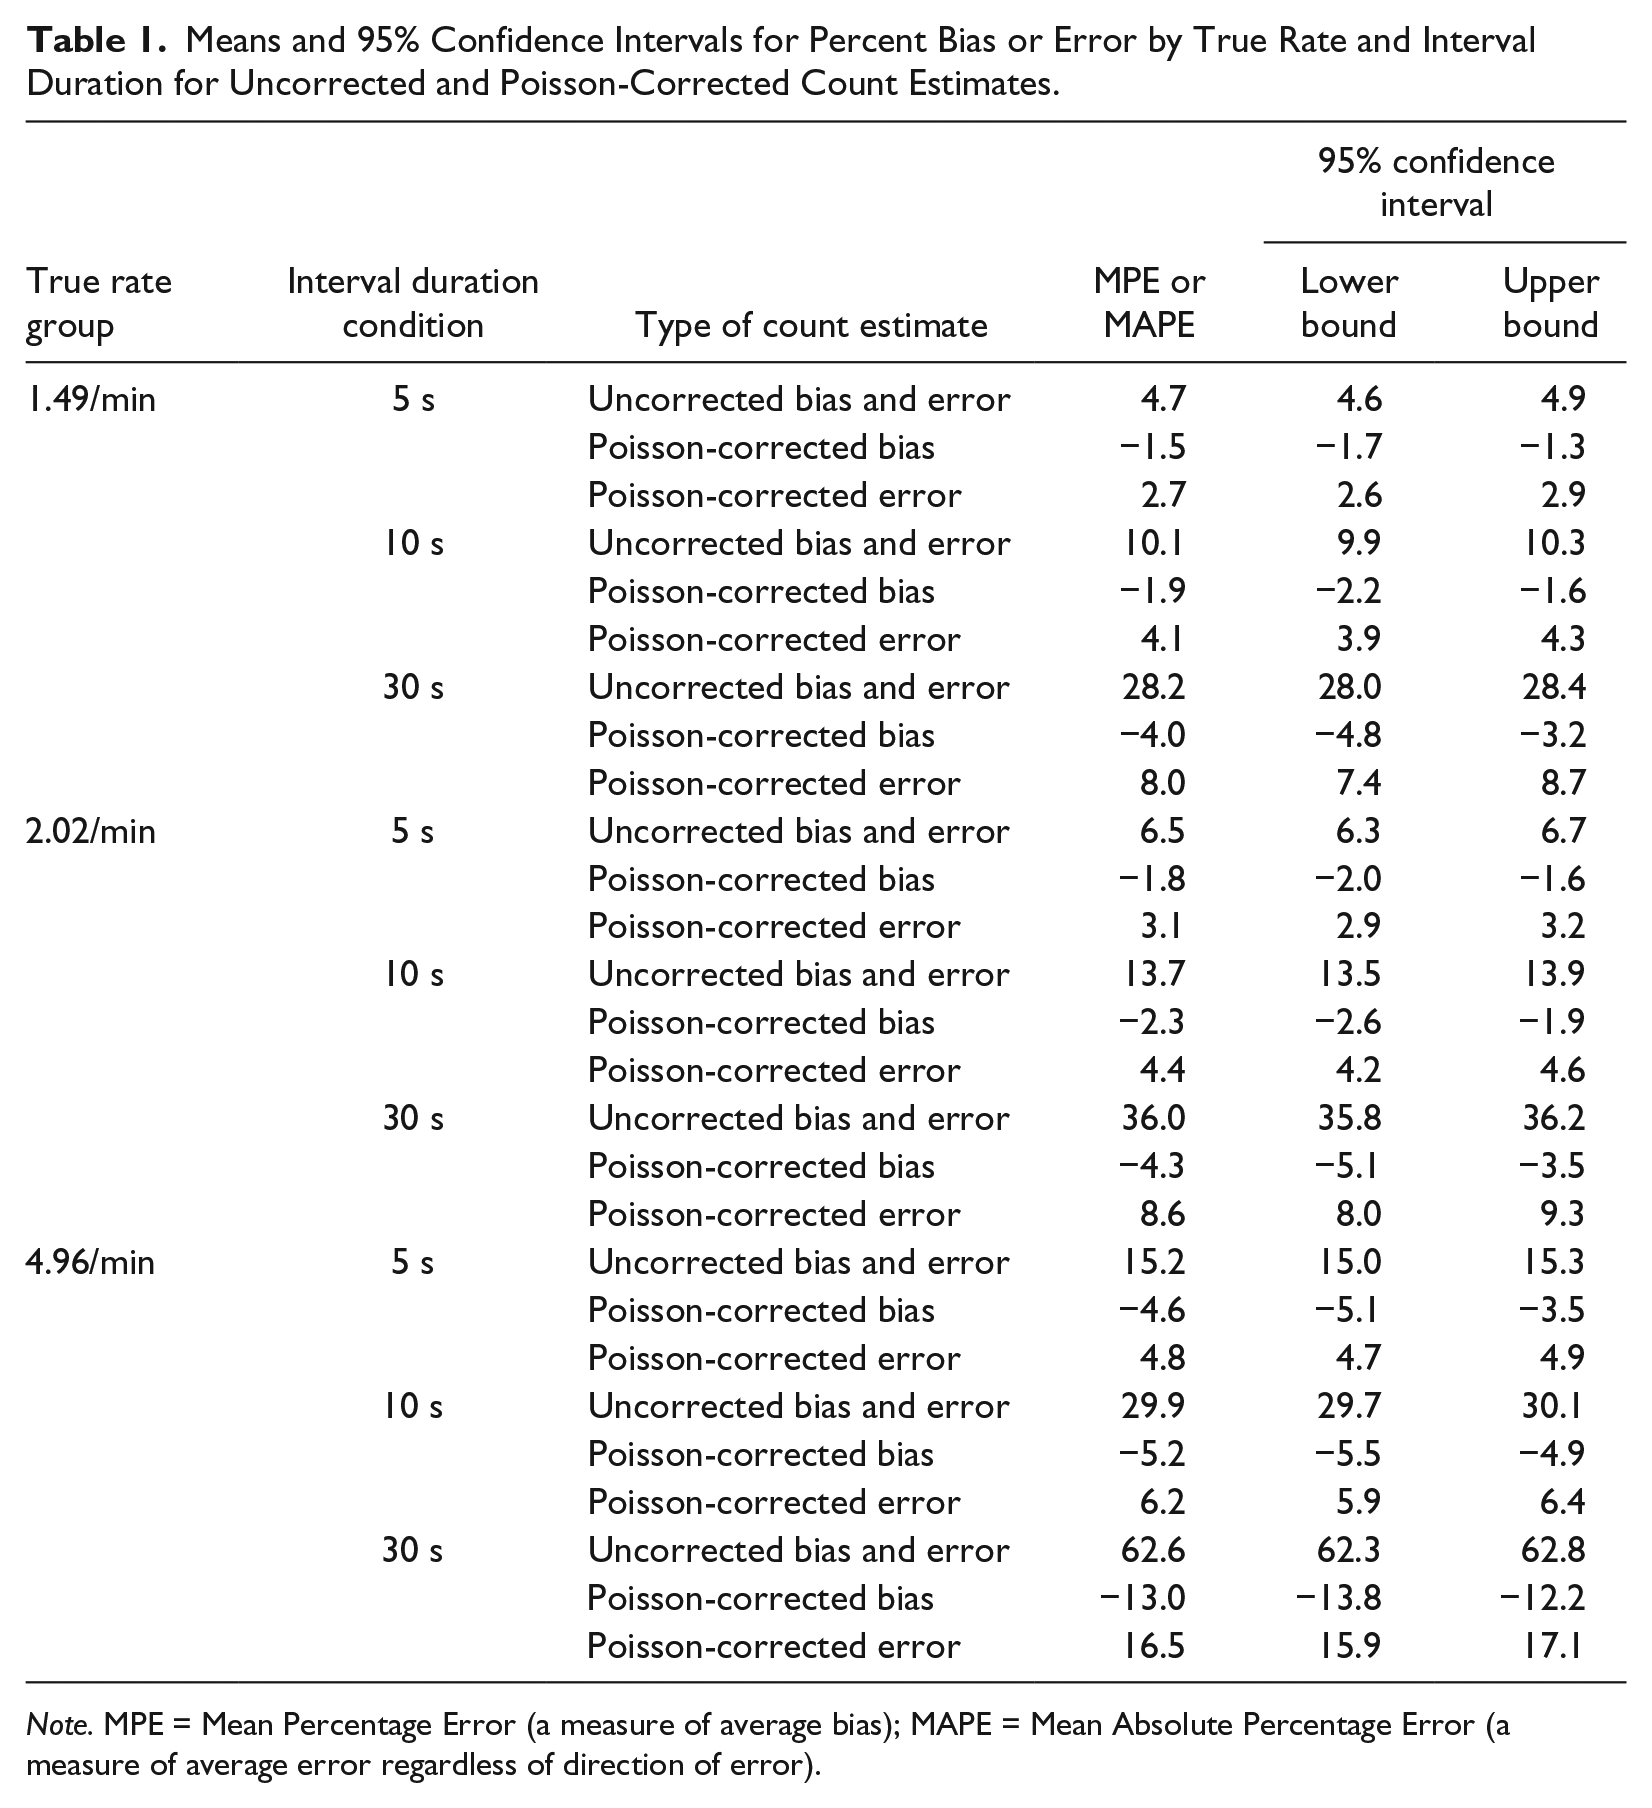
Note. MPE = Mean Percentage Error (a measure of average bias); MAPE = Mean Absolute Percentage Error (a measure of average error regardless of direction of error).
Discussion
This simulation was conducted to test whether the improved error level that Mann et al. (1991) demonstrated for Poisson-corrected count estimates would hold up under conditions that were realistic for ECSE. We identified the minimum, median, and maximum interval duration from studies in a recent review of interval-estimated counts and duration (Lane & Ledford, 2014). Similarly, we used the results of a literature review to identify the observed rate of mean values from studies that sought to increase behavior and the mean and trimmed maximum found in studies seeking to decrease behavior. Thus, true rate was known, which in turn enabled computation of the mean percent error and bias for uncorrected and Poisson-corrected interval-estimations of count. By selecting the manipulated values of interval duration and true rate from studies published in journals relevant to ECSE, the applicability to real-world situations was improved relative to what would have occurred without such grounding. The true rate and interval duration served as the manipulated variables in a mixed experimental design, which allowed strong interval validity for testing whether these factors affected error and bias levels.
The findings indicated that for all modeled situations, the Poisson-corrected count was more accurate than the uncorrected count. In addition, the Poisson-corrected count produced a mean bias and error that exceeded 10% only for the highest true rate and longest interval duration condition, and even then, the bias level was only 13% and the error level was only 16.5%. Conceptually, the Poisson transformation seeks to estimate the average number of events in each interval using the mean of the Poisson distribution, given the proportion of intervals without the key event, the number of intervals, and the duration of the interval. As true rate and interval duration increased, the number of intervals with zero occurrences diminished. Because Poisson distribution is best suited for “rare” events, it makes sense that the Poisson correction becomes less accurate as the number of intervals with zero occurrences diminishes.
Limitations
Several limitations of the simulation exist. First, these data do not inform us of the value of Poisson-corrected count for higher (or lower) true rates than were modeled. As mentioned earlier, we suspect that its value is reduced for such high rate events. Second, the results may not generalize to longer events than were modeled (i.e., 1 s). This may be particularly true when the events are closer in duration to the interval size (e.g., estimating count for 3 s events using 5 s intervals). However, outcomes similar to those found in this study might hold true when the relative event duration to interval size duration ratio is similar (e.g., estimating count for 3 s events using 30 s intervals). Still, empirical demonstration of this principle is needed. Similarly, we modeled events occurring for a full second; some events are much briefer than that. To the extent that event duration is related to clustering of events in close proximity to one another, uncorrected event count estimates might be even more biased (i.e., underestimated) because many events could occur during even an interval.
Finally, recent suggestions for three other transformations have been posited, but these other approaches have not been tested using simulation methods (Pustejovsky & Swan, 2015). In addition, the most promising of these other transformations requires average duration and inter-response time estimates at a behavior and individual level and, ideally, they would be derived from very long continuous observations. Even if eventual simulation studies show that one or more of these alternatives is more accurate than the simple Poisson transformation recommended in the current study, it is not clear the needed input information will be sufficiently accurate to enable the alternative transformation’s use in the real world.
In contrast, the only information needed to implement the simple Poisson transformation recommended in the current study is (a) the number of intervals without an occurrence of the target behavior, and (b) the duration of intervals. Fortunately, Mann et al. (1991) showed that applying the Poisson transformation to partial-interval estimated count reduces the level of error even when the sample data do not adhere to the Poisson distribution. Thus, even though Poisson transformation of count did not provide error-free estimates, the amount of bias and error was less than that provided by uncorrected count estimates, even when sample distributions were not Poisson-distributed.
Implications
It has long been recognized that interval estimates of count are not as accurate as those produced by timed-event behavior sampling. However, PIR produces a more accurate estimate of count than the momentary and whole-interval recording does (for review, see Yoder & Symons, 2010). In addition, interval (i.e., time sampling) behavior recording is primarily used when resources do not allow the more expensive timed-event behavior sampling. Thus, PIR will likely continue to be used. When used to estimate count, we can improve our estimates by Poisson-correcting PIR-estimated count. However, even for Poisson-corrected count estimates, we can further minimize error using the shortest interval duration affordable.
When comparing data across two conditions (single-case design [SCD]; baseline, intervention) or two groups (control, intervention), differences in rates are often expected (e.g., researchers intend to increase rate via an intervention). The current results indicate that researchers can expect the error level of PIR-estimated count to vary based on true rate. In addition, Poisson correction results in overestimating true rate. Depending on how true rate varies between conditions (or groups), it is possible that using Poisson-corrected, PIR-estimated counts as the dependent variable could increase the likelihood of Type I error, especially when large intervals are used (e.g., 30 s). For example, an apparent treatment effect on increased rate could occur due to the greater overestimation of true count in the higher rate condition (or group). Thus, researchers should avoid using large intervals when estimating count to describe differences between conditions or group even when Poisson correction is used. When smaller intervals are used, the relative error is low (generally less than 10%), reducing the likelihood of identifying a causal relation when one does not exist. However, even corrected counts are imprecise; thus, only relative levels and trends, not absolute counts, can be trusted.
Traditionally, SCD researchers have considered the presentation of raw data to be a strength of the paradigm (Gast & Spriggs, 2014; Parsonson & Baer, 1992). Thus, one might expect some reluctance to transform data. However, when using interval-based recording, data are already in a form that does not capture behavior occurrence as precisely as timed-event sampling. Moreover, in some areas of behavioral research, the use of semi-logarithmic charts, rather than equal-interval graphs, is common (e.g., precision teaching; Lindsley, 1992). Thus, the transformation of data is neither novel nor problematic in SCD research. Relative to uncorrected PIR-estimated count, the Poisson correction improves the researcher’s ability to detect a functional relation and to more accurately describe the size of the effect with less error.
In addition to using the Poisson correction to estimate count during research studies, it can also be used to estimate count based on PIR data from published studies. This might be particularly useful in literature syntheses in research areas in which PIR-estimated counts are common (e.g., functional analyses) because across-study analyses between timed-event-based counts and uncorrected interval-based estimates are not meaningful. The Poisson correction would allow researchers to convert these PIR-estimated counts to more accurate estimates, minimizing error and allowing for across-study comparisons of the impact of interventions on event rate. As many acceptable meta-analytic methods in SCD require raw data (e.g., as provided by authors or extracted from graphs; Shadish, Hedges, Horner, & Odom, 2015), transforming these data would represent a manageable burden for researchers.
In sum, we suggest researchers (a) use intervals as short in duration as their resources allow when estimating counts using PIR, (b) use the Poisson correction rather than uncorrected counts or uncorrected percentage of intervals when using PIR, and (c) cautiously interpret results from their own and other studies when uncorrected PIR estimates are used to estimate count or rate. Future work is needed to better specify the conditions under which this simple Poisson transformation is better than uncorrected or other transformations of PIR-estimated count.
Footnotes
Authors’ Note
The content is solely the responsibility of the authors and does not necessarily represent the opinion of National Institutes of Health personnel.
Declaration of Conflicting Interests
The author(s) declared no potential conflicts of interest with respect to the research, authorship, and/or publication of this article.
Funding
The author(s) disclosed receipt of the following financial support for the research, authorship, and/or publication of this article: This research was supported by EKS of NIH under award U54HD083211.
