
Abstract
This study examines the impact of macrolevel indicators of social environment on officially recorded crime motivated by racial bias and xenophobia across 44 regions in 7 European nations between 2002 and 2011. In doing so, we estimate multilevel Poisson regression growth models where time is nested within subnational units, which avoids direct comparison of biased crime across different nations. We test the utility of various theoretical frameworks that have proven to be of relevance in explaining crime motivated by bias. The results reveal that the role of a hostile social climate is of particular interest, as xenophobic and racially motivated crimes are higher in regions with higher levels of anti-immigrant sentiment and higher levels of ethnic discrimination, in line with the “Doing Difference” approach developed by Perry. Consistent with the Power-Differential Hypothesis and Group Contact Theory, xenophobic and racially motivated crime rates are negatively associated with the percentage of the foreign-born population. Finally, the results reveal that xenophobic and racially motivated crime rates are higher in regions with lower levels of social integration, which is congruent with social disorganization theory. We conclude with a discussion of the effects of social climate on crime motivated by bias.
Over the past few decades, European countries have seen a considerable increase in immigrants from the Middle East and North Africa. Statistics reveal that the number of people immigrating to the European Union from non-Member States almost doubled in the recent years, ranging from approximately 1.6 million in 2013 to 2.6 million in 2015 (Eurostat, 2017). In light of these events, a burgeoning body of scholarly work has devoted attention to the issues of immigration and crime motivated by bias, 1 typically defined as “unlawful, violent, destructive, or threatening conduct in which the perpetrator is motivated by prejudice toward the victim’s putative social group” (Green, McFalls, & Smith, 2001, p. 480). Drawing largely upon ethnic competition theories, this line of research has consistently revealed that a large or growing out-group population is associated with biased crime within a single nation (Disha, Cavendish, & King, 2011; Lyons, 2007) and with anti-immigrant perception across European nations (Quillian, 1995; Semyonov, Raijman, & Gorodzeisky, 2006, 2008). Related work has also found that indicators of a hostile climate—assessed by public discourse and the strength of right-wing populist parties—considerably boost the probability of attacks against minority group members (Jäckle & König, 2016; Koopmans & Olzak, 2004).
While scholars have highlighted the role of the contextual effects in our understanding of intergroup dynamics (Disha, Cavendish, & King, 2011; Lyons, 2007), comparative empirical research on the impact of social environment on crime motivated by bias is rather scarce. Moreover, no study to date has used data from different European nations to examine the plausible relationship between a culture of hostility in a given European region and crime motivated by bias over time. The paucity of comparative research on this topic is certainly due, at least in part, to data limitations. Although access to such data is increasingly available as various European nations adopt better data collection methodologies, until recently it has been difficult to acquire reliable data on crime motivated by bias (Goodey, 2008). Further complicating the picture is the fact that conceptual and methodological differences between nations in the reporting and recording of crime motivated by bias often prevent direct comparisons (Garland & Chakraborti, 2012; Perry, 2003, 2010). 2
In the present study, we seek to address these important gaps in the literature by exploring the impact of the social environment on hate crimes. Specifically, we analyze the effects of different indicators that have proven to be of relevance in prior research in explaining officially recorded crime motivated by racial bias and xenophobia across different regions in seven European nations between 2002 and 2011. In doing so, we seek to test the utility of various theoretical frameworks. Our theoretical and empirical focus will be on the effect of a region’s hostile climate, an indicator we call “culture of hostility,” and on the occurrence of such acts. To what extent do widely shared prejudices, ethnic discrimination, and a large share of right-wing oriented persons in a region create a culture of hostility that is conducive to hate crimes? By including macrolevel indicators of a culture of hostility, along with other relevant predictors of bias-motivated crime such as regional indicators of minority group’s size, prosperity, and social cohesion, a competitive perspective is offered that allows revealing theoretical overlaps and intersections.
In pursuing these objectives, we take advantage of a multilevel Poisson regression growth model that combines regional-level data on officially recorded xenophobically and racially motivated crime with aggregated responses on anti-immigrant sentiment and ethnic discrimination from several waves of the European Social Survey (ESS). This model estimates biased crime as a function of time and the independent variables. As such, it enables us to examine changing patterns of hate crime across different European regions while avoiding their direct comparison. This allows us to test for causal inferences of our hypotheses, which offers insights into the rather scarce evidence on hate crime causation that exists at the international level at present.
Taken together, our study offers a distinctive and holistic approach to the study of hate-motivated violence. It generates notable insights into the study of hate crime by incorporating indicators of a hostile climate to predict the actual counts of crime motivated by racial bias and xenophobia.
Theoretical Background on Crime Motivated by Bias
The academic explanations of hate crime can be split into two broad categories—social psychological explanations that focus on the role of individual characteristics, on the one hand, and structural explanations that examine the social context, on the other. Psychological explanations of hate crime draw primarily from the fields of social psychology and psychiatry and have aimed to identify psychological and behavioral features of hate crime offenders that lead them to commit hate-motivated violence. Accordingly, it has been argued that the same trait that pushes offenders to commit hate crime is also responsible for the discriminatory sentiments that these persons hold against their victims. In this account, hate crime is thus viewed as an extreme form of discrimination or prejudice (Allport, 1954; see Green et al., 2001). 3
With regard to the structural explanation of hate crime, the most prominent one is the “Doing Difference” by Perry (2001). This approach is closely connected to the motivations discussed above because it argues that hate-motivated crimes are best understood as extreme forms of discrimination that have emanated from a history of segregation, discrimination, and marginalization of people who are perceived as somehow “different.” Persons who fall out of society’s identity ideals are labeled as different and pose to some of the majority’s members a potential threat. By abusing and attacking those who are “different,” perpetrators send a clear message that they or their identities are not welcome and thereby try to keep the established structures. Behind these violent acts are stereotypes and ideologies of unequal worth for different groups in society. This might be additionally codified into operating procedures, policies, or laws that may give rise to an environment where perpetrators feel a sense of impunity when acting against minority group members and contribute to a “culture of hostility.”
Another prominent line of theorizing that places emphasis on the importance of the context are intergroup theories of prejudice and bigoted violence, often conceptualized in the form of ethnic competition theory (e.g., Schneider, 2008). These theories assume that intergroup relations are shaped by intergroup competition over status, power, and material rewards (Blalock, 1967; Blumer, 1958). Driven by a fear of losing their privileged position, the dominant groups develop feelings of prejudice and discrimination toward subordinate groups and, consequently, commit hate-motivated violence. Thus, their hostile feelings and behavior constitute reactions to perceived or actual threat, which is typically measured by assessing economic conditions, demographics, and the distribution of political power (Disha et al., 2011; Green, Strolovitch, & Wong, 1998; Lyons, 2007). Ethnic competition theory also states that the membership in certain social categories—such as low status individuals, as well as individuals living in urban areas—makes some people more prone to perceive threat and develop prejudices.
Several variants of these theories have been developed in an attempt to understand the mechanisms behind the minority group size-biased crime nexus. The neighborhood-defended hypothesis, for instance, suggests that hate crimes will occur most frequently in socially organized places that experience a rapid in-migration of newcomers (Lyons, 2007). There is a great deal of comparative research on minority group size and anti-immigrant attitudes consistently revealing and confirming this effect: As the relative size of the out-group population increases across European nations, anti-immigrant perception increases as well (Quillian, 1995; Semyonov et al., 2006, 2008; Schneider, 2008).
Other studies have drawn upon intergroup contact theory (see, e.g., McLaren, 2003), arguing that increased opportunities for positive and constructive interactions between racial and ethnic groups dispel stereotypes and animosity between groups and offer friendship potentials (Allport, 1954). Thus, places with higher numbers of foreigners are expected to be characterized by increased levels of tolerance and reduced social distance because of greater familiarity with and integration between group members. Yet, contact is often operationalized more directly (on the individual) than on the societal level as the individual’s number of interethnic friendships or colleagues (Schneider, 2008). The same directional effect, yet with a different rationale, would be expected from a Power-Differential Hypothesis perspective, which suggests that foreign-born people have a lower risk of victimization in areas where they constitute a higher proportion of the population because in those places, the members of the dominant group may be fearful of acting on their prejudice or committing hate crime (Green et al., 1998; Levine & Campbell, 1972).
Despite a large body of work utilizing intergroup theories of prejudice and bigoted violence intergroup theories, recent scholars made an attempt to refer to other criminological theories to explain crime motivated by bias (Benier, Wickes, & Higginson, 2015; Grattet, 2009; Walters, 2011). A thriving body of recent work, for instance, has utilized social disorganization theory to examine crime motivated by bias (Benier et al., 2015; Grattet, 2009). Building on the crime inductive effect of social and economic disadvantage, this theory focuses on economic disadvantage, coupled with residential instability and racial and ethnic heterogeneity, as creating social disorganization eventually resulting in higher levels of crime in neighborhoods (Shaw & McKay, 1972 [1942]). In studying the neighborhoods of Chicago, Shaw and McKay argued that impoverished areas would lack stable social structures, which in turn would lead to higher levels of crime.
In a revised systemic social disorganization theory, the concept of “collective efficacy” is defined as a “social cohesion among neighbors combined with their willingness to intervene on behalf of the common good” and is introduced as a mediating factor in the relationship between economic disadvantage, ethnic/racial heterogeneity, residential instability, and crime rates (Sampson, Raudenbush, & Earls, 1997, p. 918). A breakdown in social control, social cohesion, and social bonds is to associate with a lack of trust, friendships, and solidarity among neighbors and to create a neighborhood subculture that is supportive of crime and violence. Many studies have registered this effect on traditional crime rates (see, e.g., Sampson & Bartusch, 1998; Sampson et al., 1997). Yet, while researchers have examined the impact of residential mobility, economic disadvantage, and in-migration on hate crime (Benier et al., 2015; Grattet, 2009), little work on hate crime, to our knowledge, has focused on the role of social bonding.
Comparative Research on Hate Crime and Culture of Hostility
The utility of the theories outlined above has been examined in a fairly large body of work, focusing mainly on either crime motivated by bias (e.g., Disha et al., 2011) or on bias, often conceptualized as perceived threat (e.g., Quillian, 1995). Given the data limitations outlined above, much of these studies have focused on crime within a single nation and, in line with theories of intergroup crime and bigoted violence, have largely reported a positive impact of the influx of out-group population on crime motivated by bias (Lyons, 2007; Stacey, Carbone-Lopez, & Rosenfeld, 2011). A number of studies have also sought to explore links between prejudice and hate crime (for further overviews see, e.g., Brown, 2011 or Chakraborti & Garland, 2015).
Cross-national work on intergroup crime has evolved with two slightly different focuses: The first utilized a multilevel approach in an attempt to evaluate survey respondents’ attitudes toward out-group populations (Quillian 1995; Semyonov et al., 2006, 2008), while the second has a more political focus aiming to examine the growing strength of extreme right-wing parties purportedly associated with levels of bigoted violence (e.g., Koopmans, 1996). Research within the first strand of comparative work, as noted earlier, revealed that the relative size of the out-group population is positively associated with anti-immigrant perception across European nations (Quillian, 1995; Semyonov et al., 2006, 2008; Schneider, 2008). Heath and Richards (2016) found very stable attitudes when analyzing data of the ESS between 2002 and 2014. However, a deeper analysis of ESS data on attitudes of both the majority and the target groups reveals that Europeans have become slightly more favorable toward migrants from the same racial or ethnic group as the majority while at the same time becoming less positive about migrants from poorer countries outside Europe.
Research within the second strand of comparative work has shown that in Western countries, an association can be found between anti-foreigner sentiment and the tendency to vote for extreme right parties (Semyonov et al., 2006). The success of extreme right parties in Western European nations has been found to be associated with levels of immigration, economic conditions, and political environment (e.g., Lubbers, Gijsberts, & Scheepers, 2002). A study by Koopmans (1996), meanwhile, showed that levels of racist crime are inversely correlated with the strength of extreme right and racist parties in Western European countries, while work by Dancygier (2010) found a positive association between the strength of right-wing parties and the occurrence of racist crimes at the local level.
A concurrent line of research has examined the impact of the public discourse or the strength of right-wing populist parties on crime motivated by bias as confined to a single nation. Jäckle and König (2016), for example, found that the strength of right-wing parties in German districts considerably boosts the probability of attacks on refugees in that area. Koopmans and Olzak (2004), meanwhile, reported that differential public visibility, resonance, and legitimacy of right-wing violence are related to the rate of violence against different target groups in Germany.
Taken together, the vast majority of cross-national work employs a multilevel approach to examine anti-foreigner sentiment or the strength of extreme right-wing parties across various nations. These findings indicate that a culture of hostility is a crucial component in understanding crime motivated by bias. Stronger extreme right parties could be expected to shape public opinion with their potential for mobilization and with their organizational basis, as they may contribute to an overall political and social climate that is more conducive to violence against foreigners by evoking feelings of hatred, implicitly establishing foreigners as legitimate targets of violent action. Along the same line of reasoning, widely shared anti-immigrant attitudes can also contribute to and create a social climate that is hostile toward immigrants and might tolerate and, if not, encourage violent actions taken against minorities.
Building on the findings from the comparative work discussed above and the argument that difference poses a threat for many perpetrators executing a hate crime (Perry, 2001; Walters, Brown, & Wiedlitzka, 2016), the objective of the present research is to analyze the link between the sociopolitical environments and hate crime more thoroughly. Of peculiar interest is the role of prejudice and the question how hate crimes can become the product of particular hostile social climates. We do so by introducing the structural concept “culture of hostility,” which includes regional levels of anti-immigrant attitudes, ethnic discrimination as well as the share of right-wing sympathizers. This predictor is conceptualized below and builds on promising insights into prior research on intergroup conflict. By including this broader concept and by exploring its effects on biased crime, our study seeks to bridge a gap between the two strands of comparative work discussed earlier.
The Present Study
The prior literature and theoretical models discussed above provide a wide and fertile ground within which it is possible to investigate the relationship between macrolevel indicators of prejudice and crime motivated by bias across different subnational units. While these theories and prior research do not directly account for the link between prejudice and biased crime, they often imply that a hostile regional climate may be particularly relevant in explaining crime motivated by bias. This suggestion is bolstered by the existing statistics, which show that nations with the highest percentage of people subject to discrimination are generally also the nations with the highest percentage of respondents who report being a victim of biased crime (Eurobarometer, 2009, 2015). Statistics also show that there is “a strong relationship between citizens defining themselves as part of a minority group and the experience of discrimination” (Eurobarometer, 2009, p. 24) and between hate crime victimization and immigrant status (Van Dijk, Manchin, van Kesteren, Nevala, & Hideget, 2007).
Accordingly, we suggest that in a social climate that is hostile toward immigrants, people are expected to be more likely to manifest their prejudice by at least supporting—if not committing—bias-motivated crime. The reasoning is 2-fold here—on the one hand, there is the straightforward argument that there is a higher probability for hate crimes, when more persons are prejudiced in a region. On the other hand, there is an additional amplifying structural mechanism at work, which is the distinct product of a specific social environment that is shared by many persons. In such a culture of hostility, there might also be a lack of community condemnation of certain prejudice resulting in turning a blind eye even to hate incidents and giving the perpetrators the feeling of impunity. A culture of hostility can be manifested through shared prejudices, widespread discriminations as well as widely shared right-wing supporters. The idea of this general link is formalized in the following hypothesis:
Second, we analyze the impact of the relative size of minority groups. As elaborated above, there are diverging results in the prior literature offering competing hypotheses. From an ethnic competition theory point of view (Blalock, 1967; Blumer, 1958; Schneider, 2008), one would expect more hate crimes in regions with more foreigners, as they could be seen as a threat to the majority. Transferred to hate crimes toward newcomers, social disorganization theory would suggest that ethnic heterogeneity leads to increased hate crimes. This begets the following hypothesis:
By contrast, the well-established intergroup contact theory (Allport, 1954; McLaren, 2003) would expect an opposite effect: In regions where people have better chances to meet, get in contact, and establish friendships with out-group members, prejudices are expected to be reduced and hate crimes less likely to occur. The Power-Differential Hypothesis also predicts a negative effect of foreign-born population on crime motivated by bias (Levine & Campbell, 1972). Regions with a higher share of foreigners are then expected to show less hate crimes.
Third, we include further indicators of other relevant concepts for explaining the occurrence of hate crimes. social disorganization theory (Shaw & McKay, 1942/1972) and intergroup theories of prejudice and bigoted violence (Blalock, 1967; Blumer, 1958) focus on economic disadvantage as a predictor for the occurrence of biased crime. The newcomers might be seen as invaders of indigenous territory posing a threat to the already unstable economic security. Accordingly, it is expected that hate crimes occur more frequently in economically weaker regions.
4
Fourth, measures of low social control and low trust might play a role, which can be directly allocated to the prominent criminological approach of social disorganization theory (Shaw & McKay, 1942/1972) and the collective efficacy (Sampson et al., 1997) approach. Here, a lack of social cohesion within a smaller geographical unit serves as a rationale for increased crime. In the study at hand, we test whether such structural indicators operate on explaining the occurrence of hate crimes.
Data and Measures
The sample we use for the analysis consists of observations on 44 major regions (Nomenclature of Territorial Units for Statistics System [NUTS] 1) in 7 European nations between 2002 and 2011. These nations include Belgium, Finland, France, Germany, Slovakia, Sweden, and the United Kingdom. According to the European Agency for Fundamental Rights (henceforth FRA, 2012), all nations under investigation offer either good or comprehensive data collection systems on officially recorded hate crimes, and more importantly, they provide comprehensive data on hate crimes at the subnational levels (FRA, 2012; Goodey, 2008).
Our unit of analysis is a major European region referred to as NUTS 1 in the European Union’s classification system. This unit is present in all data sources used in the analysis. The NUTS system was created in an attempt to provide a reference for statistical analysis of the regions in the European Union. It subdivides national territories of the Member States into three hierarchical levels: NUTS 1 (major regions), NUTS 2 (basic regions), and NUTS 3 (small regions; Eurostat, 2011). The availability of data on dependent and focal independent variables at the NUTS 1 level determined the selection of nations and the period to be investigated. After listwise deletion of missing data, the total number of 329 region/years combinations, covering the period between 2002 and 2011 was used in the analysis.
To test the hypotheses outlined in the previous section, we combined data on crime motivated by bias with aggregated responses from the ESS—an academically driven cross-national survey that collects data across Europe every second year since 2001 (documentation and data collection at www.europeansocialsurvey.org). The survey measures the attitudes, beliefs, and behavior patterns of individuals in European nations. The ESS employs a multistage random sampling design with the surveys conducted by face-to-face interviews with representative samples of citizens aged 15 years and older (Jowell, Roberts, Fitzgerald, & Gillian, 2007). Our study makes use of the following ESS waves: Round 1 (2002), Round 2 (2004), Round 3 (2006), Round 4 (2008), and Round 5 (2010). 5 The survey questions incorporated in the present study were asked in all five rounds. For this research, the responses to these questions were aggregated to the corresponding European regions (NUTS 1) as discussed in the following section. To account for differences in the population size, we applied the design weights provided by ESS (Jowell et al., 2007). Finally, given that the ESS has been conducted every second year since 2002, in “off-survey” years we carried over the survey responses from the previous wave.
The dependent variable
The central dependent variable for the analysis is racist or racist/xenophobic crime as reported by country’s official reports. These reports provided data for our dependent variable and have been described by the FRA (2013). Notably, in Belgium, France, and Sweden, racist crimes are recorded along with xenophobic crimes. The FRA (2013), thus, reports them under the same category of “racist crimes.” Following the FRA, we included both racist and racist/xenophobic crimes in the current analysis. Because Germany does not record data on xenophobic crimes at the subnational level, we utilized “politically motivated crimes-right” in the current research. For an overview of the dependent variable in each country of interest see Appendix A.
A note of caution concerning the measurement of crime motivated by bias is warranted. As FRA notes, there may be some annual deviations in biased crimes reflecting “how these crimes are defined in criminal law, changes in how incidents are recorded, the willingness of victims and/or witnesses to report incidents, and the actual occurrence of racist, xenophobic and related crime” (FRA, 2012, p. 160). Thus, the hate crimes addressed in this study should be understood as a proxy for the actual hate crime rates (FRA, 2013). At the same time, the FRA reports that data collection systems were changed in 2008 only in two, Sweden and Finland, of the seven countries used in our analysis (FRA, 2012). We included a dummy variable for these two countries to control for this change.
The independent variables
For testing our first hypothesis, we include three independent variables a “prejudiced climate,” an “ethnic discriminatory climate,” and the share of right-wing leaning persons, which are all assumed to depict the same phenomenon—a culture of hostility. However, the respective indicators will be introduced and included separately in the model.
For capturing the “prejudiced climate,” we employ responses to three questions from the ESS that cover general attitudes toward people from other countries (see Table 1). The items differentiate between autochthonous and immigrants referred to as “people coming to live here from other countries” offering a clear-cut distinction between an imagined in- and out-group. These group allocations play a huge role in offering increased in-group self-esteem by devaluating out-group members (see, e.g., Tajfel & Turner, 1979). Moreover, these distinctions offer deviations from an imagined society’s identity ideal and produce persons that are “different,” that for some pose a potential threat to their own social norms and values (Perry, 2001). The items cover important aspects and mechanisms of prejudice, as there are the aspect of immigrants posing a cultural, symbolic threat as well as there is the notion of placing blame onto others by asking whether immigrants are seen as burden to the nation’s economy and serve as scapegoats for potential economic crises. All 3 items have been reverse-coded, so that higher values indicate more negative attitudes toward immigrants. These items were found to have good reliability (eigenvalue 2.48; Cronbach’s α = .84). Accordingly, we create a composite index by using factor analysis. This index is aggregated to the NUTS 1 level to reflect the regions’ spread of anti-immigrant sentiments in our measure of “prejudiced climate.”
Descriptive Statistics for Variables Used in Analysis.

Note. GDP = gross domestic product.
Our secondary focal independent variable—the “ethnic discriminatory climate”—is an index of ethnic discrimination. The ESS includes the question “Would you describe yourself as being a member of a group that is discriminated against in this country?” followed by the question “On what grounds is your group discriminated against?” Separate items were created for response categories. Given the focus of the current research and the fact that discrimination on the basis of ethnicity is seen as most widespread in the European Union (Eurobarometer, 2015), we include an index of ethnic discrimination in the analysis. 6 This index is comprised of the item “ethnic group” provided in ESS and is coded as 1 = marked and 0 = not marked. This index is aggregated to the NUTS 1 level to reflect the regions’ spread of perceived ethnic discrimination.
A third independent variable focuses on the share of right-wing leaning persons in a region. Therefore, we used the question: “In politics people sometimes talk of “left” and “right.” Using this card, where would you place yourself on this scale, where 0 means the left and 10 means the right?” Based on the response categories, we created a dummy variable wherein responses of seven or more were coded as 1 (right) and all others as 0 (not right). This variable is aggregated to the NUTS 1 level to reflect the regions’ share of right-wing leaning persons.
Regarding the two competing hypotheses of minority’s group size derived from ethnic competition theory and intergroup contact theory (Hypotheses 2 and 3), two indicators are included in the models: the percentage of the foreign-born population and the immigration rate (per 1,000 inhabitants). We included the size of the foreign-born population (in number of persons) in a given year, as reported by the National Statistical offices, in order to gauge the relative size of the out-group population. 7 We included the size of the foreign-born population (in number of persons) in a given year as reported by the National Statistical offices. Data on the foreign-born population in France were available only for the years 1999, 2006, 2009, 2010, and 2011, and foreign-born population data were not available for Slovakia. As a proxy for the latter measure, we used the number of persons with a permanent residence permit in a given year. These data were obtained from the Ministry of the Interior of the Slovak Republic. To assess the influx of the out-group population and biased crime, we incorporated the total influx of immigrants from abroad in a given year, as reported by the National Statistical offices. Again, data on total immigration from abroad in France were available only for the years 1999, 2006, 2009, 2010, and 2011.
To assess the impact of economic disadvantage on the occurrence of hate crimes (Hypothesis 4), we make use of regional indicators of economic prosperity such as the gross domestic product (GDP) and the unemployment rate (source: Eurostat database).
Finally, the measures of low regional social control and low social cohesion, related to social disorganization theory and the collective efficacy approach (Shaw & McKay, 1942/1972; Sampson et al., 1997) are hypothesized as crime incentives (Hypothesis 5). Low regional social control and low social cohesion is measured in the following by a lack of social integration in terms of lacking social relationships and friendships, a lack of general trust in others as well as in organizations. Here, we again incorporate individual-level measures from the ESS, which are aggregated to the NUTS 1 level. Thus, they reflect the regions’ spread of persons with trust in organizations, general trust in others as well as the spread of social integration. For an overview on all aggregated individual-level variables see Appendix B.
As control variables, this study additionally incorporates the percentage of young population (15–24) and the total number of crimes (Disha et al., 2011) in the region. Data on the percentage of young were available to download from the Eurostat database. The total number of crimes in Germany and Belgium was obtained from each country’s Federal Police, and each country’s national statistical offices in Finland and the United Kingdom. Data on the total number of crimes in Sweden were available to download from the National Council for Crime Prevention and, in the Slovak Republic, from the Ministry of the Interior of the Slovak Republic. Finally, data on crime in France were obtained from cartocrime.net.
Analytic Strategy
Targeting a selection of 44 regions in 7 countries, the purpose of this research is to examine the effects of a derogative social climate on racist, racist/xenophobic, or politically motivated crime across different regions over time. To achieve this goal, a two-level, random effects Poisson regression growth model with the offset of logged population was estimated. In this model, time—the first level of the data structure (Level 1)—is nested within the region (Level 2; Rabe-Hesketh & Skrondal, 2008). This technique is well suited for this study: It renders possible the ability to examine the changing patterns of racist crime in major regions across different countries while allowing the analysis to extend beyond a direct comparison of hate crime levels.
The data utilized in this study are structured as pooled, cross-regional annual time series. Analysis of data structured in this way typically involves fixed effects or random effects models. The Poisson growth model utilizes the hybrid approach (Allison, 2005), encompassing both fixed and random effects. The hybrid approach is particularly appropriate for this study because the effects of time can vary randomly across the units and gain a stronger causal inference by using within-unit variance. The hybrid models produce both group-centered means and a difference from that mean, but for the sake of simplicity, the regression coefficients displayed below represent only differences from group-centered means.
The outcome variable used in this study is the rate of xenophobically and racially motivated crimes. Because the numerator is a positively skewed distribution of event counts, it is modeled as a Poisson sampling distribution. The Poisson regression model provides unbiased estimates for positively skewed counts and is often employed to study infrequently occurring events, such as crimes (e.g., Sampson et al., 1997). The conditional distribution of this variable is specified in a link log function (Rabe-Hesketh & Skrondal, 2008). A random effects Poisson regression growth model at Level 1 with a population risk offset may be written as:

where
This model at Level 2 can be expressed as:
where
Here μ ij refers to racist crime for the ith unit at Level 1 and the jth unit at Level 2. Y ij has a Poisson distribution with exposure TIME ij and random error ε ij . At Level 1, π0j is the intercept for the unit j, ε ij is the stochastic error, and π1j is the coefficient for the effect time in the subnational unit j. At Level 2, υ0j is a random effect that accounts for random variation at Level 2, while β00 and β10 are the random effects for the intercept and the TIME slope, respectively. Thus, in this model π0j varies randomly, providing assessment of the variation in racist crimes across subnational units. At Level 2, β01 is the coefficient on the independent variable X1… X k for subnational unit j.
The results of the Wooldridge test for autocorrelation in panel data indicated that the model suffered from significant autocorrelation. To correct for this autocorrelation, a first-order autoregressive term was incorporated into the models. In addition, all models include the Huber-White robust estimates of standard errors to account for the heteroscedasticity found to be present in the data set. Finally, the results of the Dickey-Fuller test for unit root indicated that the nonstationarity was not a problem in the data set and that the null hypothesis of nonstationarity of racially motivated crime should be rejected at .001 α level. All models control for contextual effects associated with national context by including country-specific dummy variables. The models also account for the effects of time by including time trends and country-specific trends. Each model was estimated in SAS Version 9.3, using the GLIMMIX procedure.
Results
To facilitate a visualization of the spatial patterning of xenophobically and racially motivated crime rates, we applied techniques from exploratory spatial data analysis. In Figure 1, we display the quantile map for absolute rates of xenophobically and racially motivated crimes across European regions. The results reveal that the levels of crime motivated by bias are highest across regions in the United Kingdom. This reflects a very broad definition of hate crime adopted in this nation, wherein anyone can decide whether a person has been a victim of a hate crime.2 In contrast, the classification of hate crime in Germany, for example, is based on police assessment (Garland & Chakraborti, 2012). Accordingly, the levels of hate crime are generally low across German regions. Xenophobically and racially motivated crime rates are also generally low across regions in Belgium, Finland, France, and Slovakia and somewhat higher across the Swedish regions. This again reflects methodological and conceptual differences in the reporting and recording of hate crime between European nations and lends credibility for the body of work reporting sharp differences for hate crime levels across different nations (Goodey, 2008; Perry, 2010).
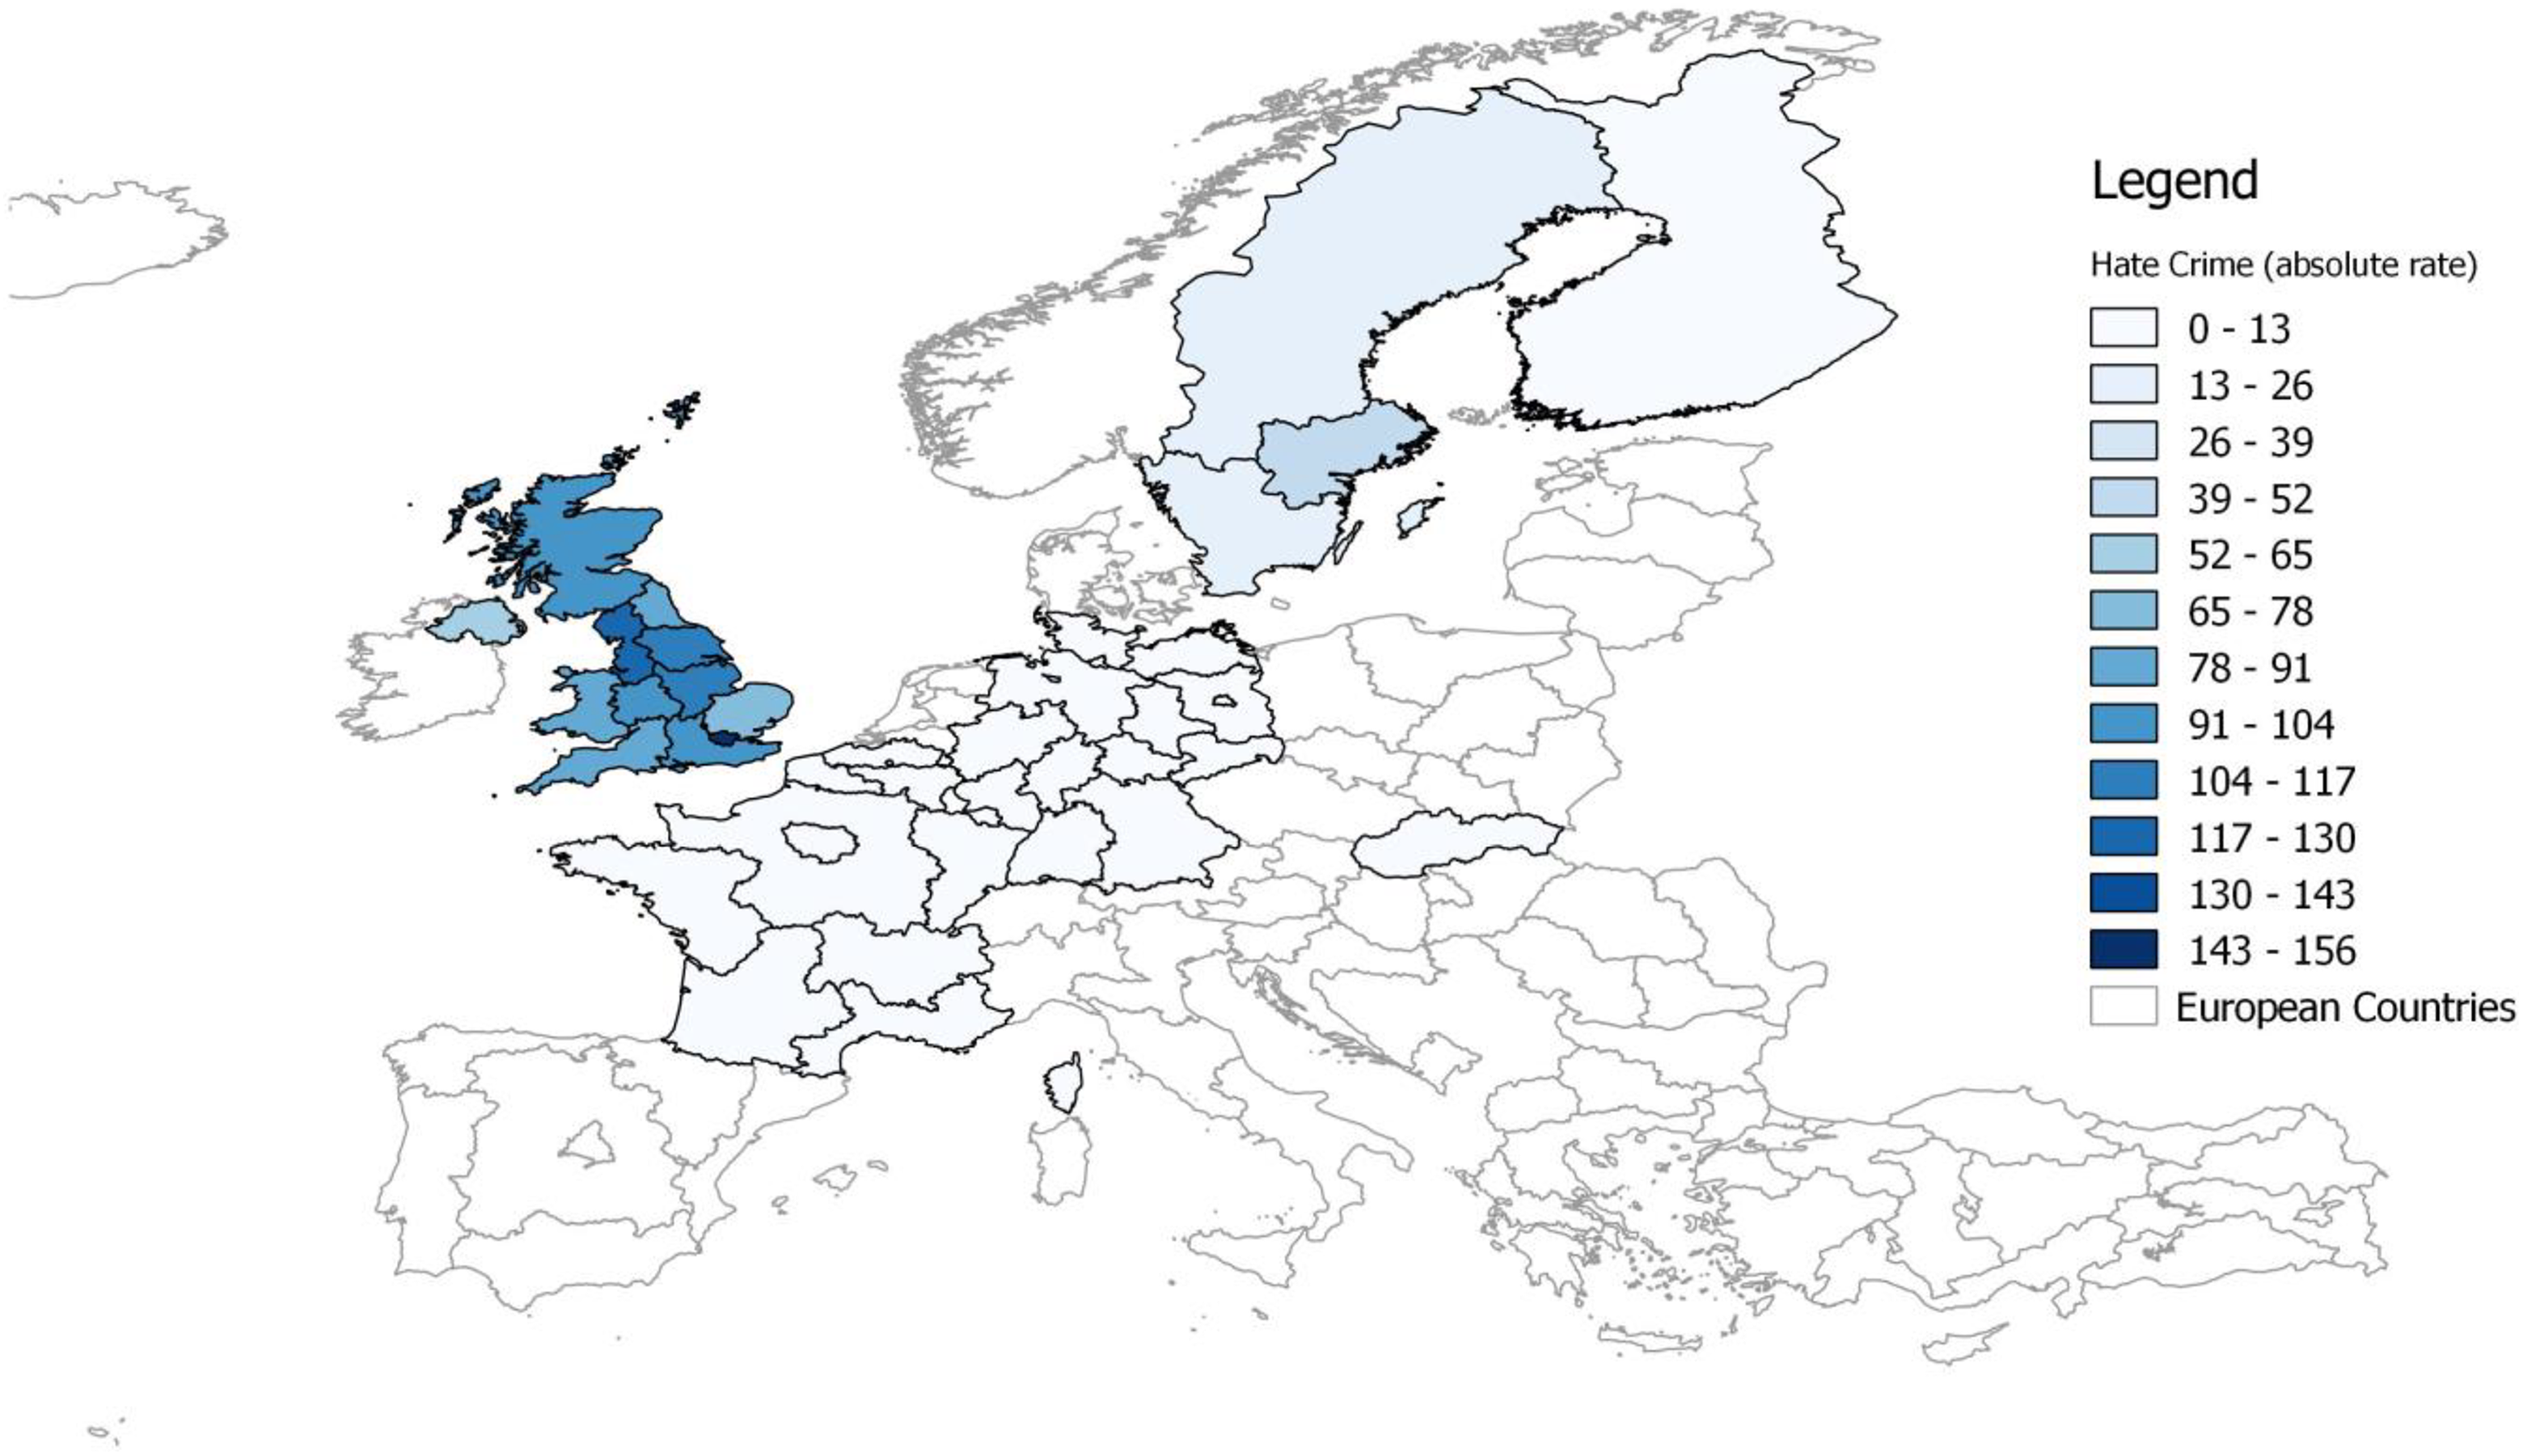
Xenophobically and racially motivated crime (absolute rates).
In Figure 2, we present the quantile map for xenophobically and racially motivated crimes rates relative to the country’s mean. We do so in an attempt to explore the spatial patterning of xenophobically and racially motivated crime rates across the regions within a single nation. Distinctive geographic imprints emerge from this map. Consistent with previous research (Krueger & Pischke, 1997), the results reveal that hate crime rates are higher in Eastern than in Western parts of Germany. This reflects the division between the former East and West Germany and might be a result of long-standing higher anti-immigrant attitudes in the East (e.g., Zick, Küpper, & Krause, 2016). Similarly, xenophobically and racially motivated crimes are generally low in the Dutch-speaking northern region of Flanders in Belgium, and high in the French-speaking southern region of Wallonia and the Brussels Capital region. Finally, the North West part of England, London, as well as the North East past of France register the highest hate crime rates, in contrast to that found in other parts of these countries. Taken together, these findings indicate crucial differences in level of hate crime not only across European regions but also within single nations.
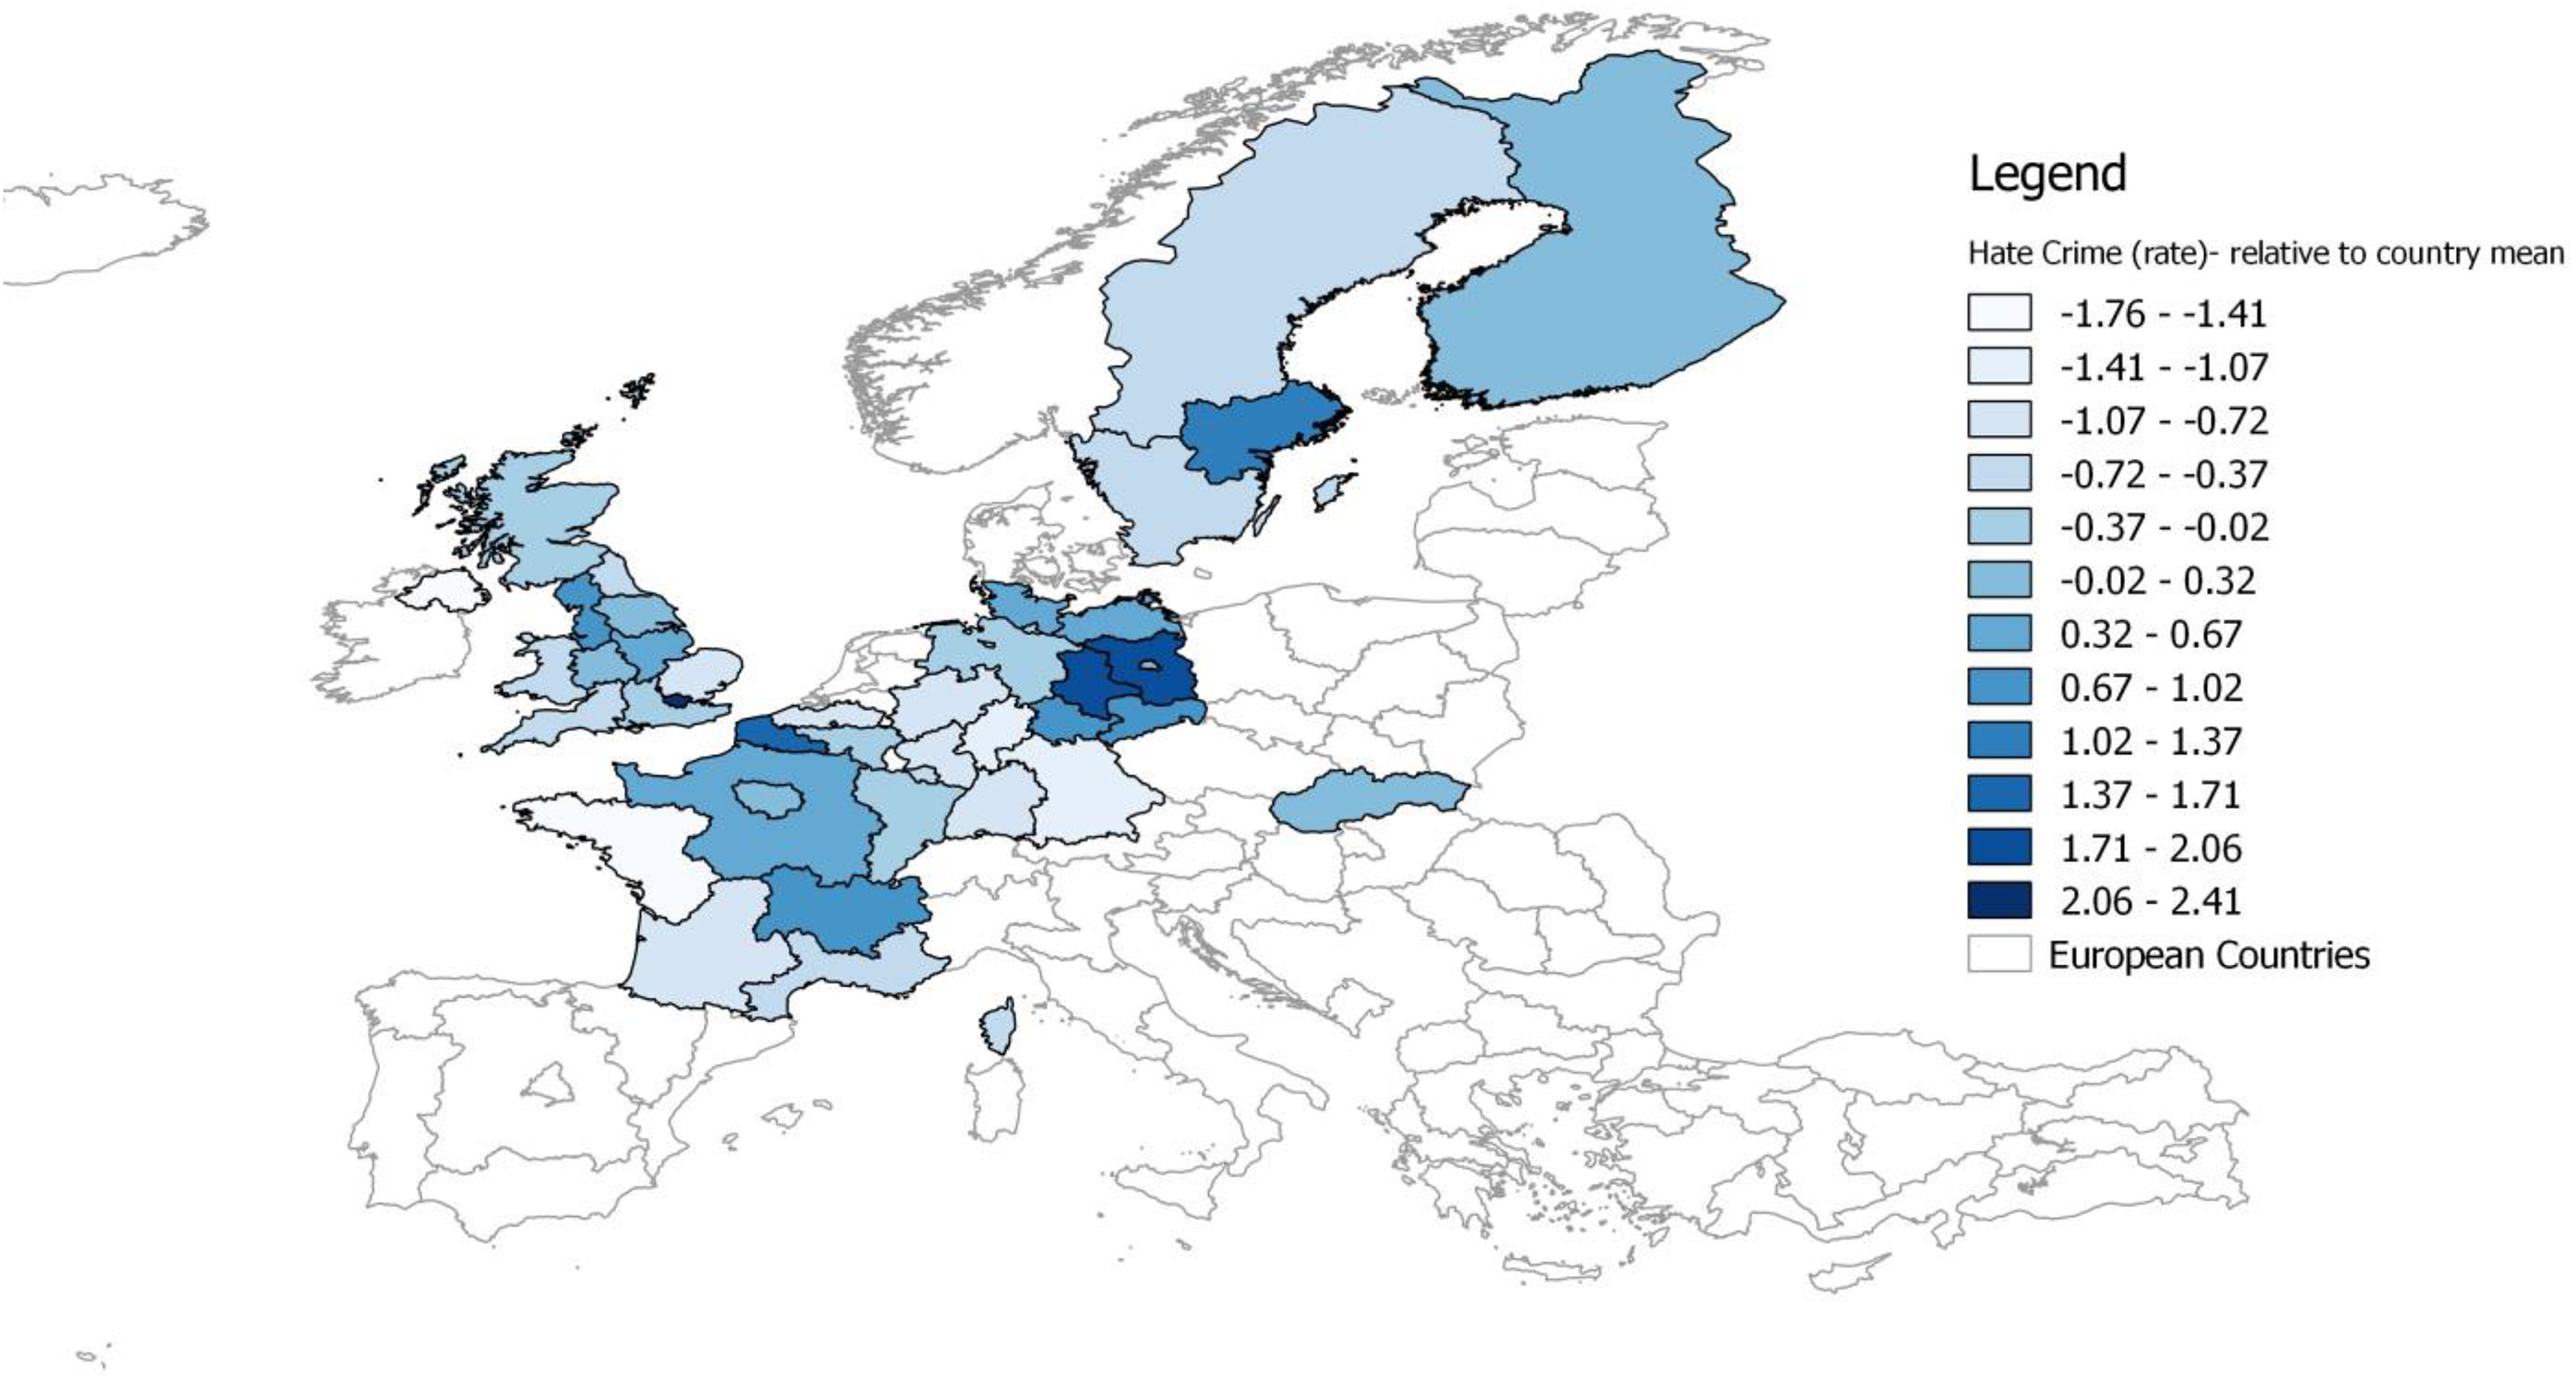
Xenophobically and racially motivated crime (rates relative to country mean).
Descriptive statistics of the variables used in the analysis are displayed in Table 1. 8 On average, European regions experienced 31.97 xenophobically and racially motivated crimes 9 (per 100,000) with an SD of 44.40. This further indicates that hate crime rates substantially diverge across subnational units (Goodey, 2008; Perry, 2010). Table 1 also reveals that about 1% of respondents experienced discrimination on the grounds of ethnicity. This is somewhat consistent with previous work, which found that 2% of respondents across European nations in a 2008 report were discriminated against on the basis of ethnic origin (see, e.g., Eurobarometer, 2009). 10
The results also show that there are great variations with respect the other variables between the subnational units. For example, the mean of prejudiced climate is .115 with an SD of .344, indicating that anti-immigrant attitudes vary considerably between European regions. In fact, the additional analysis revealed that the most intensive prejudiced climate can be found in the regions Nord-Pas-de-Calais in France and Brandenburg in Germany, whereas, consistent with previous research (Semyonov et al., 2008), the least intensive prejudiced climate can be found in Sweden and Finland (see Appendix C for descriptive statistics for the outcome variables and for individual-level variables aggregated to NUTS 1 by country and region). Similarly, there is great variation in the percentage of foreign-born population (M = 8.28, SD = 6.40), immigration rates (M = 12.94, SD = 22.02), and GDP per capita (M = 28722.8, SD = 9543.70).
In Table 2, we display the results of the Poisson regression growth model, regressing xenophobically and racially motivated crime on independent variables. 11 Model 1 reports the effect of prejudiced climate and ethnic discriminatory climate only. As can be seen in the significant and positive regression coefficients, both prejudiced climate (b = 0.136; p < .01) and ethnic discriminatory climate (b = 2.24; p < .05) exhibit significant and positive effects on xenophobically and racially motivated crime across European regions consistent with our first hypothesis.
Random Effects Poisson Regression Growth Model Regressing Xenophobically and Racially Motivated Crime on Independent Variables.
Note. GDP = gross domestic product. All models include nation fixed effects, time trend, and country-specific time trends. The estimates represent difference from group-centered mean. Unit-specific mean variables are controlled in the regressions. Standard errors in parentheses. N = 329.
* p ≤ .05. ** p < .01. ***p < .001.
Model 2 incorporates our third focal independent variable—share of right-wing leaning persons. Contrary to our first hypothesis, this indicator exhibits a null effect on xenophobically and racially motivated crime across subnational units. Thus, culture of hostility matters insofar as it is assessed by the prejudiced and ethnic discriminatory climate and less by political orientation. Yet, this discrepancy may be due to diverging understandings of “right” and “left” across different countries (see, e.g., Finlay, Simon, & Willson, 1974; Jahn, 2010). In fact, political scientists have frequently noted that a single left–right axis is insufficient for describing the existing variation in political beliefs and often include other axes (see, e.g., Nolan, 1971). An example showing the wide range of different understandings of “left” and “right” suggest how problematic and undercomplex a universal dual concept of the political spectrum might be (see, e.g., Elchardus & Spruyt, 2012): from the level of government intervention to equality versus hierarchical social order or equality versus liberty or a party reference in specific countries that drive individuals to locate them on the political left–right self-assessment scale. Notably, adding political orientation to the model yields no significant change to the effects of anti-immigrant sentiment and ethnic discrimination stressing the stability of the other two indicators’ effects.
To assess the utility of ethnic competition theory, Power-Differential Hypothesis, and Group Contact Theory, and to test Hypotheses 2 and 3, we add the relative size of the foreign-born population and immigration rate into the regression equation in Model 3. The results reveal that a lower share of foreign-born population is associated with higher levels of xenophobically and racially motivated crime (b = −0.057; p < .05), providing support for Hypothesis 3 contrary to Hypothesis 2. The negative effect we found for this measure is consistent with both Group Contact Theory (Allport, 1954) and the Power-Differential Hypothesis (Levine & Campbell, 1972), which suggest a negative effect of the relative size of foreign-born population on crime motivated by bias. Surprisingly, and in contrast with previous findings reported in the literature on hate crime (Green et al., 1998; Lyons, 2007), the measure of immigration rates exhibit a null effect on xenophobically and racially motivated crime.
Model 4 incorporates measures of economic conditions into the model. In contrast to Hypothesis 4, the results demonstrate that the unemployment rate as a measure of economic conditions of the region exert no significant effects on biased crime across subnational units. While the results of Model 4 reveal a weak, yet significant effect of the region’s GDP on hate crimes (b = 0.012; p < .05), this significant effect diminishes in the subsequent models when further variables are included.
Model 5 incorporates trust in organization, trust in others, and social integration into the model testing Hypothesis 5. Consistent with the collective efficacy theory (Shaw & McKay, 1942/1972; Sampson et al., 1997), social integration is significantly negatively associated with xenophobically and racially motivated crime across the subnational units (b = −0.212; p < .01). This offers support for Hypothesis 5 assuming that stronger social bonding in a given region generates lower levels of biased crime.
Finally, Model 6 adds the control variables into the model. The reported effects remain with Prejudiced and ethnic discriminatory climate exerting an upward effect on xenophobically and racially motivated crime at the 0.05 level, net of the control variables included in the models. Turning to the control variables, the results reveal one additional noteworthy effect—a significant positive borderline effect of the percentage of the young population (b = 0.097; p = .055). This indicates that biased crime occurs more frequently in regions with a higher percentage of young adults, which is consistent with prior research on crime motivated by bias (e.g., Disha et al., 2011).
Conclusion and Discussion
The overarching objective of the current research was to explore the structural conditions of 44 regions in seven European countries with higher levels of bias-motivated crime. The study helps to respond to important gaps in the hate crime literature by analyzing the impact of a hostile social climate at the macrolevel on the occurrence of hate crimes with cross-cultural data over time. The executed and elaborated multilevel Poisson regression growth models reveal the following most important findings.
When the social climate of a region can be described as hostile and pejorative, the probability of hate crimes increases. This holds true for two of our main focal independent variables capturing anti-immigrant sentiments (prejudiced climate) as well as the ethnic discriminatory climate clearly supporting Hypothesis 1. Thus, no matter whether this hostile social climate is manifested in shared attitudes or more widespread ethnic discrimination, such regions experience more hate crimes. These indicators of a hostile social climate depict important and robust predictors of hate crimes as they appear with statistically significant effects, even when variables of other important predictors are included in the models. However, the indicator of the political left–right self-assessment yielded no significant effects, which might be due to problems of cross-cultural comparability of the understanding of this classification of political positions, as discussed earlier. This finding of the important impact of a hostile social climate underlines the risk and harmfulness of shared prejudices and discriminatory actions and illustrates the close connection of pejorative attitudes and hostile behavior shown here at the societal level. It emphasizes the need of a high sensibility toward any kind of prejudice or discrimination—be it in media representations, laws and policies, or in everyday interactions.
A region’s social cohesion plays an important additional role for preventing hate crimes; however, this does not hold true for all indicators. The models reveal an independent effect of social integration on hate crimes, indicating more hate crimes in regions where more persons lack social integration. Surprisingly, indicators assessing the level of trust yield no additional effects. 12 This result can be interpreted in terms of social disorganization theory, which argues that ecological characteristics shape the likelihood for individuals to commit crimes. In particular, the contribution of Bursik and Grasmik (1993) can help to understand this result. The authors stress the importance of social control within smaller geographical units in preventing crime, identifying personal relationships between neighbors and friendship networks as crucial for establishing trust, and eventually social control, within the community. The absence of social integration, or more specifically the lack of social activity and friendships within a community as measured in our study, is a reflection of minor social control resulting in more widespread hate crimes. Thus, our results extend the scope and significance of social disorganization theory by showing that social cohesion also affects hate crime rates. Moreover, the findings underline the importance of cohesive, nonhostile communities where prejudices are not tolerated but condemned and discrimination is not turned a blind eye to. Strengthening and promoting local social integration and cohesion offers a potent leverage point for policies to avoid the occurrence of hate crimes.
The findings of the present study additionally reveal empirical insights into a highly debated question of the role of the relative size of the immigrants’ population in a region. The results from our models indicate that the smaller the proportion of the foreign-born population in a region, the more hate crimes occur. A higher proportion of foreign-born population seems to be offering the opportunity for more positive interethnic contact, less perceived group threat, and less ethnic competition. This finding is in line with the intergroup contact thesis (Allport, 1954; McLaren, 2003) and, importantly, stands in contrast with theories of ethnic competition and group threat (Blumer, 1958; Blalock, 1967). Alternatively, this result might be interpreted from a standpoint of the Power-Differential Hypothesis, which attributes increased hate crimes in regions with a lower foreign-born population to perpetrators having less to fear by way of reprisal (Levine & Campbell, 1972). Interestingly, the immigration rate seems to be of less importance, as no significant effects emerge in our models. The actual immigration rate is thus not as important for explaining the occurrence of hate crimes as the more long-term related number of foreign-born persons in a region. In other words, how many foreign-born people live in a region is the key factor, regardless of whether they have recently migrated or have been living there for years.
Moreover, additional demographic characteristics of the structure yield further results in our models. 13 The average age of a region’s population plays a role in the occurrence of hate crimes, revealing more hate crimes in regions with a younger population. This result is not surprising, given the well-established finding of a higher propensity toward violence, in general, but also toward hate crimes, in particular, among juveniles (see, e.g., Roxell, 2011). More surprisingly, neither the total crime rate nor the economic strength of the region exerts influence on the region’s hate crime level. The nonexistent effect of economic strength is in contrast to Hypothesis 4 and is unexpected especially from an ethnic competition standpoint, wherein immigrants are viewed as a threat as competitors for limited resources (and, therefore, potential hate crime targets) when the economic situation is tense. Nevertheless, this finding is consistent with a growing body of work that reports a null effect of economic conditions on crime motivated by bias (Green et al., 1998; Krueger & Pischke, 1997, see also King, 2009). Given this line of research coupled with our findings, future research might focus on interactions of indicators of economic strength with relevant other structural explanations such as hostile climate or share of foreign-born population to depict these processes even more directly.
We acknowledge certain limitations of our analysis. One caveat is the limited number of European countries (7) included in the study. However, the relevant unit of analysis in the models is major regions (NUTS 1 level), with a sufficient N of 44. This sample choice was driven by the limited availability of reliable data on crime motivated by bias at the regional level.
Regarding the question of transferability of the results to other countries of the world, the included countries, albeit all European, encompass a relative wide diversity regarding their history, economic situation, immigrant population related to size, and heritage. The sample is composed of large western European countries with liberal or conservative welfare states (United Kingdom, France, and Germany), social–democratic Scandinavian countries (Finland, Sweden), and former socialist Eastern European countries (Slovakia). For future research on the effects of a hostile social climate, it will be worthwhile to consider a more detailed regional level such as the NUTS 2 to apprehend the impact of the social context even more locally. As the data continue to improve, future research may also gain insights from incorporating other non-Western European nations.
A further note of caution related to the aspect of comparability is warranted when interpreting the study’s results. While the applied methodological technique is well suited for this study by allowing the analysis to extend beyond a direct comparison of hate crime levels, and additional arrangements were taken as described in the analytical strategy section to increase the comparability of hate crimes across regions, it needs to be acknowledged that the definitions of the outcome variable vary between the countries. Therefore, at the general level, the outcome variable in this study is best understood as what is defined as Xenophobically and Racially Motivated Crime within each societal context. Our results indicate that Xenophobically and Racially Motivated Crime are influenced by structural conditions, regardless of the equality of the definitions adopted in each country. As data on hate crime continue to improve, an important task for future research is to examine in a more detailed way whether the patterns of hate crime predictors vary between countries with different definitions of the phenomenon.
The study at hand concentrated on explaining crime that is racially and xenophobically motivated. Building on Allport’s (1954) highly influential research showing that prejudice can be generalized across targets—see also concepts of “generalized prejudice” (e.g., Akrami et al., 2011) and “group-focused enmity” (e.g., Zick, Küpper, & Hövermann, 2011; i.e., a person who is anti-Black is likely to be anti-homosexual, too)—one could expect the structural component of a hostile social climate to be influential not only for hate crimes toward foreigners or ethnic minorities but also toward other groups. However, this is just speculative and could depict an atomistic fallacy. Further research is needed to investigate how far the structural factors considered here also play a role toward affecting other bias-motivated crimes.
Moreover, we acknowledge some issues related to methods of police recording for hate crimes in the countries under investigation. As noted earlier, in the United Kingdom, any individual can define which incidents are motivated by prejudice or hate. In contrast, most of the nations under scrutiny grant the classification of hate crimes to police assessment (e.g., Germany, Belgium; Garland & Chakraborti, 2012; Glet, 2009). The police then determines whether the actions of perpetrators are motivated by bias or hate, and they also decide what is or is not classified as a hate crime. Police procedures may themselves be inherently flawed since there is a good deal of latitude in hate crime classification. Different recording procedures and likely flaws mean that the results of this study must to be interpreted with caution.
Additionally, there may be some issues related to hate crime reporting. Research shows that only small proportions of hate crimes are reported to the police (Chakraborti & Garland, 2015). Many hate crimes may be underreported because the victims fear retributive attacks from their aggressors if they contact the police. Members of the out-group population may also have some language or cultural barriers as well as distrust in the criminal justice system; they may additionally be uninformed about their rights and the appropriate procedures for hate crime reporting. These factors may vary from one country to the next, again suggesting that the results from this study should be interpreted with due caution.
In addition to important implications related to the theoretical models and contextual effects, there are numerous limitations of hate crime data that warrants attention of policy makers and the public. Considerable differences in hate crime reporting and recording impede the creation of a single cross-national database, and data in most of the European nations are very new and limited in multiple ways. Data restrictions have led scholars interested in hate-motivated crime to resort to surveys and focusing on anti-foreigner sentiments, but these approaches have substantial drawbacks (i.e., failing to account for actual hate crime levels). The call for more refined and comprehensive data on hate crime seems well reasoned and worth attention, given both our findings and increasing trends in hate-motived violence (see, FRA, 2012, 2013). Certainly, developing such data would deepen our understanding of crime motivated by bias.
As it is not the goal of any structural explanation, the study at hand offers no reasoning for the burning question why only certain individuals commit hate crimes while others in the same region choose not to. This study takes an exclusively structural perspective and tested several structural explanations competitively in a European context. Although our study does not answer questions about individual differences, we can offer an additional explanatory factor that proves to be worthwhile when analyzing the impact on xenophobically and racially motivated crime. Namely, our results generally underscore the fruitfulness of considering structural indicators of a hostile social climate such as the prejudiced and ethnic discriminatory climate. The analyses emphasize the importance of including measures not only on the individual level but also on a structural macrolevel of analysis, given the considerable explanatory power of the macrolevel variables for explaining the occurrence of hate crimes. In doing so, this study can be seen as an effort in offering a rather holistic theoretical framework of the highly complex phenomenon of hate crime. Finally, the dangerous and destructive power of prejudices, anti-immigrant attitudes, and discrimination for creating a hostile and pejorative social climate cannot be stressed enough, as they turn out to be closely connected to actual crimes that are racially or xenophobically motivated.
Footnotes
Appendix A
Definitions and Sources of the Dependent Variable Racist or Racist/Xenophobic Crime.
| Country | Definition | Source | Unit and Period Covered |
|---|---|---|---|
| Belgium | Racism and xenophobia, which refers to the “violations of the Belgium law that punishes the discrimination based on nationality, race, skin color, descent, or national or ethnic ancestry” of the victim (Belgian Federal Police, 2014, p. 1) | Data published by the Belgian Minister of Interior Affairs in the “Politiële Criminaliteitsstatistieken 2000–2013” | 2000–2012. Available at all NUTS levels |
| England and Wales | Racist incidents; hate crime defined as “any hate incident, which constitutes a criminal offense perceived by the victim or any other person, as being motivated by prejudice or hate” (ACPO, 2005, p. 9 as cited in Hall, 2005). Crime can only be identified as hate crime if the motivation for prejudice or hate crime is based on race, sexual orientation, faith, or disability | Data published by the Ministry of the Interior in Biennial Reports on Statistics on Race and the Criminal Justice System | 2003–2012. Available at NUTS 2 level. Data have been aggregated to corresponding NUTS 1 regions |
| Finland | Offenses of suspected racist crimes; Subcategory of hate crime defined as “crime against a person, group, somebody’s property, institution, or a representative of these, motivated by prejudice or hostility toward the victim’s real or perceived ethnic or national origin, religion or belief, sexual orientation, transgender identity or appearance, or disability” (Police College of Finland, 2014, p. 2) | Data published by the Police College of Finland | 1999–2012 (except 2000 and 2005); Available at all NUTS levels |
| France | Actions and threats with a racist and xenophobic character, wherein “actions” refer the acts against persons or property with a certain degree of severity and “irremediable” degradations and “threats” the other facts or threatening gestures, graffiti, leaflets, insulting demonstrations, exactions, minor and other acts of intimidation (La Lutte Contre le Racisme, L’Antisémitisme et la Xénophobie, 2014, p. 221; our own translation) | Data published in the Annual Reports of the National Consultative Commission on Human Rights | 1996-2013 (except 2008 and 2009); Available at the NUTS 2 level. Data have been aggregated to corresponding NUTS 1 regions |
| Germany | Politically motivated crimes right; Hate crime constitutes a subcategory of politically motivated crimes and is further subdivided into xenophobic and antisemitic offenses, where xenophobic crimes are defined as “crimes which were committed due to the victim’s actual or perceived nationality, ethnicity, and race, color of skin, religion or origin” (Bundeskriminalamt, 2004, p. 8 as cited in Glet, 2009) | Data published by the Federal Ministry of the Interior in the Constitutional Protection Reports | 2001–2012; Available at the NUTS 1 level only |
| Northern Ireland | Incident(s) with racist motivation; “A racist incident is defined as any incident which is perceived to be racist by the victim or any other person. A racial group can be defined as a group of persons defined by reference to race, colour, nationality or ethnic or national origins” (Annual Bulletin, 2012, p. 6) | Data published by the Police Service of Northern Ireland in the Annual Bulletin on Trends in Hate Motivated Incidents and Crimes | 2005-2012 Data have been aggregated to corresponding NUTS 1 region |
| Scotland | Racist incidents; The definition as given by Sir William MacPherson in his Report on the Stephen Lawrence Inquiry is: “A racist incident is any incident which is perceived to be racist by the victim or any other person” (Statistical Bulletin, Crime and Justice Series, 2009, p.6) | Data published by the Scotland Police in the Statistical Bulletin, Crime and Justice Series | 2004–2012; Data have been aggregated to corresponding NUTS 1 region |
| Slovakia | Crimes with a racial motive; Subcategory of hate crime defined as any act threatening a person in a group of people because of race, nationality, color of skin, ethnicity, origin, or religion (Criminal Code, Regulation no. 300/2005) | Data published by the Ministry of the Interior of the Slovak Republic | 1997-2013; Available at all NUTS levels |
| Sweden | Offences with xenophobic or racist motives; Hate crimes defined as “crimes committed because of fear, hostility or hatred toward a person, group, property or institution because of skin color, nationality or ethnic background that activates a reaction toward the person or those persons who is/are or is/are perceived to be of foreign or Swedish descent, or representatives of the people with Foreign or Swedish descent” (Swedish National Council for Crime Prevention, 2015, p. 50) | Data published by the Swedish National Council for Crime Prevention in “Hatbrott” | 1999–2012; Available at all NUTS levels |
Appendix B
Definitions of the Individual-level Variables Aggregated to the Corresponding Regions.

| Variables | Definition |
|---|---|
| Prejudiced climate | Factor score created from 3 items (eigenvalue 2.48; Cronbach’s α = .84): “Would you say it is generally bad or good for [country]’s economy that people come to live here from other countries?” (0 = bad for the economy to 10 = good for the economy). “Would you say that [country]’s cultural life is generally undermined or enriched by people coming to live here from other countries?” (0 = cultural life undermined to 10 = cultural life enriched). “Is [country] made a worse or a better place to live by people coming to live here from other countries?” (0 = worse place to live to 10 = better place to live). All 3 items were reverse-coded. |
| Ethnic discriminatory climate | Index constructed from item: “Would you describe yourself as being a member of a group that is discriminated against in this country? On what grounds is your group discriminated against?” Ethnic group (0 = not marked, 1 = marked) |
| Share of right-wing leaning persons | Dummy variable created from an item: “In politics people sometimes talk of ‘left’ and ‘right.’ Using this card, where would you place yourself on this scale, where 0 means left and 10 means right?” (≥7 = right) |
| Social integration | Factor score created from 2 items (eigenvalue 1.32; Cronbach’s α = .45): “How often do you meet socially with friends, relatives or work colleagues?” (1 = never to 7 = every day). “Compared to other people of your age, how often would you say you take part in social activities?” (1 = much less to 5 = much more) |
| Trust in organizations | Factor score created from seven items (eigenvalue 2.24; Cronbach’s α = .88): “Please tell me on a score of 0-10 how much you personally trust each of the institutions I read out…[country]’s parliament?…the legal system?…the police?…politicians?…the European Parliament?…the United Nations? (0 = no trust at all to 10 = complete trust) Now thinking about the [country] government, how satisfied are you with the way it is doing its job?” (0 = extremely dissatisfied to 10 = extremely satisfied) |
| Trust in others | Factor score created from three items (eigenvalue 1.97; Cronbach’s α = .74): “Would you say that most people can be trusted, or that you can’t be too careful in dealing with people? (0 = you can’t be too careful to 10 = most people can be trusted).” “Do you think that most people would try to take advantage of you if they got the chance, or would they try to be fair? (1 = most people would try to take advantage of me to 10 = most people would try to be fair).” “Would you say that most of the time people try to be helpful or that they are mostly looking out for themselves?” (1 = people most look out for themselves to 10 = people mostly try to be helpful) |
Note. Adapted from European Social Survey (2002, 2004, 2006, 2008, 2010), own calculation.
Appendix C
Mean Values for Dependent Variable and Focal Independent Variables by Country and Region.
| Region (NUTS 1) | Hate Crimes (count) | Hate Crimes (rate) | Prejudiced Climate | Ethnic Disrim. Climate | Share of Right-Wing Persons | Trust in Organiz. | Trust in Others | Social Integrat. |
|---|---|---|---|---|---|---|---|---|
| Belgium | 361.704 | 14.765 | .135 | .005 | .081 | −.022 | −.324 | −.033 |
| Brussels-Capital | 265.000 | 25.752 | −.105 | .009 | .064 | .108 | −.385 | .032 |
| Flanders | 420.556 | 6.892 | .188 | .003 | .102 | .027 | −.044 | −.035 |
| Wallonia | 399.556 | 11.650 | .321 | .002 | .077 | −.202 | −.543 | −.096 |
| Finland | 671.778 | 12.679 | −.318 | .002 | .207 | .613 | .617 | .045 |
| Mainland Finland | 671.778 | 12.679 | −.318 | .002 | .207 | .613 | .617 | .045 |
| France | 87.208 | 1.146 | .297 | .009 | .126 | −.320 | −.363 | .276 |
| Bassin Parisien | 138.667 | 1.291 | .430 | .000 | .123 | −.364 | −.393 | .179 |
| Centre-Est | 117.667 | 1.555 | .245 | .004 | .140 | −.306 | −.351 | .397 |
| Est | 60.000 | 1.120 | .382 | .007 | .158 | −.298 | −.405 | .325 |
| Île-de-France | 142.000 | 1.205 | −.056 | .019 | .079 | −.192 | −.317 | .142 |
| Nord | 73.333 | 1.817 | .598 | .000 | .120 | −.523 | −.563 | .181 |
| Ouest | 41.667 | .489 | .282 | .005 | .114 | −.247 | −.191 | .404 |
| Sud-Ouest | 56.333 | .824 | .140 | .021 | .132 | −.307 | −.286 | .333 |
| Méditerranée | 68.000 | .870 | .357 | .015 | .143 | −.326 | −.396 | .249 |
| Germany | 54.476 | 1.451 | .097 | .008 | .058 | −.214 | −.215 | −.217 |
| Baden-Württem. | 60.778 | .567 | −.053 | .009 | .060 | −.085 | −.088 | −.265 |
| Bayern | 58.778 | .471 | .131 | .008 | .066 | −.226 | −.195 | −.258 |
| Berlin | 57.778 | 1.695 | −.143 | .019 | .056 | −.167 | −.150 | −.091 |
| Brandenburg | 79.333 | 3.110 | .586 | .003 | .041 | −.457 | −.320 | −.558 |
| Bremen | 6.333 | .955 | −.135 | .000 | .098 | −.120 | −.277 | −.229 |
| Hamburg | 22.333 | 1.268 | −.241 | .027 | .073 | .020 | −.206 | .002 |
| Hessen | 24.000 | .395 | −.053 | .008 | .072 | −.138 | −.148 | −.143 |
| Mecklenburg-Vor. | 31.667 | 1.875 | .385 | .007 | .053 | −.416 | −.411 | −.565 |
| Niedersachsen | 104.000 | 1.305 | .041 | .008 | .074 | .005 | −.070 | −.083 |
| Nordrhein-Westf. | 134.500 | .747 | .033 | .011 | .060 | −.032 | −.184 | −.020 |
| Rheinland-Pfalz | 26.556 | .657 | .072 | .000 | .074 | −.107 | −.196 | −.084 |
| Saarland | 9.556 | .915 | .120 | .006 | .013 | −.390 | −.259 | .035 |
| Sachsen | 86.667 | 2.044 | .192 | .002 | .029 | −.380 | −.148 | −.342 |
| Sachsen-Anhalt | 79.556 | 3.259 | .390 | .003 | .035 | −.397 | −.362 | −.270 |
| Schleswig-Holst. | 50.556 | 1.786 | .051 | .012 | .074 | −.112 | −.092 | −.267 |
| Thüringen | 48.111 | 2.080 | .169 | .007 | .041 | −.396 | −.339 | −.315 |
| Sweden | 943.885 | 30.277 | −.553 | .007 | .161 | .408 | .571 | .339 |
| East Sweden | 1382.750 | 39.514 | −.681 | .009 | .179 | .467 | .595 | .347 |
| North Sweden | 445.333 | 26.130 | −.543 | .005 | .123 | .347 | .614 | .374 |
| South Sweden | 1052.333 | 26.213 | −.449 | .006 | .184 | .416 | .506 | .298 |
| Slovakia | 156.750 | 2.899 | .282 | .012 | .155 | −.452 | −.768 | −.363 |
| United Kingdom | 5325.978 | 97.389 | .305 | .012 | .084 | −.280 | .025 | −.025 |
| England | 6145.188 | 103.665 | .328 | .015 | .084 | −.296 | −.017 | −.004 |
| East Midlands | 4815.143 | 108.977 | .460 | .007 | .092 | −.431 | .028 | −.025 |
| East of England | 4107.714 | 72.390 | .361 | .015 | .101 | −.278 | .103 | −.046 |
| London Region | 12020.75 | 156.417 | −.263 | .029 | .068 | −.112 | −.091 | .010 |
| North East | 2111.625 | 82.458 | .485 | .000 | .066 | −.391 | −.126 | −.108 |
| North West | 8215.000 | 118.523 | .432 | .024 | .055 | −.283 | .015 | .169 |
| South East | 7885.500 | 94.397 | .248 | .009 | .105 | −.208 | .011 | −.055 |
| South West | 4412.857 | 85.253 | .304 | .011 | .096 | −.278 | .134 | −.051 |
| West Midlands | 5692.375 | 104.393 | .469 | .017 | .087 | −.313 | −.098 | .109 |
| Yorkshrie Humber | 5408.250 | 104.632 | .476 | .017 | .089 | −.386 | −.093 | −.052 |
| Wales | 2536.750 | 84.434 | .434 | .003 | .071 | −.291 | .071 | .027 |
| Scotland | 4874.750 | 94.199 | .119 | .007 | .070 | −.209 | .230 | −.023 |
| Northern Ireland | 954.286 | 53.973 | .144 | .000 | .114 | −.182 | .160 | −.296 |
Declaration of Conflicting Interests
The author(s) declared no potential conflicts of interest with respect to the research, authorship, and/or publication of this article.
Funding
The author(s) disclosed receipt of the following financial support for the research, authorship, and/or publication of this article: The preparation of the manuscript was supported and funded by a Deutsche Forschungsgemeinschaft research fellowship (DFG, German Research Foundation) to Andreas Hövermann [HO 5858/1-1].