



Abstract
What explains contemporary numbers of interest groups in America? To answer this question and help address conflicting narratives in research, I examine the rise of interest groups in the states. Assembling an original dataset based on archival and secondary sources, I find that relatively few groups lobbied legislators prior to the 1960s or 1970s. During those decades, numbers of interest groups began to grow rapidly. I find that increases in lawmaking activities present inconsistent effects on the political mobilization of groups but increases in spending are strongly correlated with mobilization. In additional tests, I find that the effects of spending on group numbers vary by state and are not discernible in most states. In general, a historic transformation of state governments helps to account for the growth of state lobbying. Interest groups have remained active in state capitols ever since.
What explains contemporary numbers of interest groups in America? Social scientists offer different accounts of interest in government. Whereas political scientists tend to attribute lobbying efforts to lawmaking activities or policy change, several economists propose that interest groups lobby in response to government spending. Moreover, there are disagreements over whether lobbying by interest groups responds to or precipitates lawmaking activities or government spending. I use historical data from the American states to gain insight into these conflicting narratives. The data are produced from archival and secondary sources and show that comparatively few groups lobbied legislators prior to the 1960s or 1970s. During those decades, as states developed economically and Congress delegated the implementation of federal programs and standards to the states, legislatures increased lawmaking productivity and spending. I find that changes in lawmaking activities present inconsistent effects on numbers of groups, but that increases in spending are strongly correlated with growth in groups. While lobbying grew in tandem with state budgets, the effects of spending vary across states are not statistically discernible in most.
The transformation of state government was a “quiet revolution” in American politics (Elazar 1974, 90), and served as both an energizing and destabilizing event for interest groups. In a contemporary context, Lowery and Gray (1995) show that different numbers of interest groups lobby different state legislatures. In their model, numbers of interest groups are a function of energizing factors and stable institutions. Lawmaking activities serve to energize groups into lobbying, whereas large-scale changes in government, including in the size of government, destabilize communities of interest groups. While I employ their model specification to predict interest populations, I examine a dataset that includes the years of the quiet revolution. Specifically, I examine numbers of interest groups registered to lobby in thirty states from the 1890s to the present. Similar analyses have neglected the revolution because of limited datasets. By examining cross-sections of states starting in 1975, or yearly observations from the past decade, other studies generally find no or conditional relationships between lawmaking or government spending, and lobbying (e.g., Boehmke 2005; Holyoke and Cummins 2020; Lowery and Gray 1998; Strickland 2019b). These studies miss a pivotal time in the states, and their findings are at odds with studies of congressional lobbying. Jones, Theriault, and Whyman (2019, 227–42) find that the number of associations based in the nation’s capital more than tripled between 1961 and 1981, and that this growth is correlated with congressional lawmaking and spending. Therefore, while my study helps to address conflicting narratives of group mobilization in the states, it also addresses inconsistent findings between studies of state and federal lobbying.
America’s state capitols have not always been crowded with hundreds of interest groups. Over time, state legislatures have produced laws in more policy domains and spent increasing amounts of money. Throughout much of the twentieth century, the interest groups that lobbied state legislators were small and stable in number. This changed as states expanded their lawmaking activities and budgets, thereby precipitating a quiet revolution in state lobbying. I show that historic increases in group numbers cannot be attributed entirely to improved lobby laws, although such laws strengthened the relationships between lawmaking, spending, and group numbers.
Of normative concern, as growth in lobbying mirrors growth in government, growing governments may be increasingly subject to interest group pressure, and reforms may be needed to help insulate officials from growing influence. Such reforms include limits on campaign contributions or personal gifts. If interest groups influence state policies or slow down the adoption of new policies (a phenomenon coined “demosclerosis”), then growing states may become increasingly unwieldy Leviathans of interest coalitions and enact policies that do not reflect the preferences of voters (Rauch 1994). Alternatively, if lobbying activities respond to government growth, then concerns over group influence on government are less warranted. I provide indirect insight into these questions.
Government Growth and Interest Populations
There are numerous institutions, associations, and membership-based groups in the United States, but not all these organizations lobby legislators. Most of them never or rarely lobby (Lowery 2007, 37–38). Organizations or groups choose to lobby when their “wants and values” intersect with public policy or legislative agendas (Bevan 2013, 547; Heinz et al. 1993, 24). Under this perspective, political interests are created by government activity (Leech et al. 2005, 20). While it is impossible to count all the organizations within society, lobbyist registration laws require disclosure of the organizations that lobby. Such totals are known as “interest populations” (Gray and Lowery 1996). 1
Lowery (2007) argues that organizations lobby for different reasons in different contexts. Some lobby out of instrumental, strategic considerations. Lowery highlights the case of Microsoft, which did not hire lobbyists until the U.S. Justice Department began to prosecute the company as a monopolist in the late 1990s. Second, organizations sometimes lobby defensively to prevent the adoption of policies they dislike. This is often the case if social or environmental organizations advocate policy changes that businesses dislike. Most lobbying in Congress is defensive in nature (Baumgartner et al. 2009). Lobbying might also be a nonrational, purposive act for some groups, especially membership-based groups. Finally, organizations may lobby to achieve multiple goals concurrently. In addition to affecting policy change, goals may include incentivizing member or donor support and maintaining an organization’s reputation as a major policy player.
Given that different groups lobby under different circumstances, the expansion of government activities (e.g., new laws or spending) can increase numbers of organizations that lobby in multiple ways. Studies of legislative agendas and group mobilization suggest that more lawmaking activity can energize groups into lobbying. Legislative activity is seen as having the potential to create both winners and losers, thereby affecting (and attracting) the interests of more societal organizations. Studies that link government activity with interest populations include Baumgartner and Leech (1998), Gray et al. (2005), and Leech et al. (2005). The prospect for policy change encourages individuals into supporting groups. Membership-based groups that engage in political advocacy tend to last longer than those that do not (Bevan 2013). Groups may also mobilize to avoid potential losses. Jones, Theriault, and Whyman (2019) argue that the 1960s rise of citizen groups and expansion of policy agendas in Congress led to a conservative backlash in lobbying. New business interests mobilized in response to higher taxes and more regulations. Hertel-Fernandez (2019) documents similar processes in the states. During the same decade, state taxes and spending on public education increased. In response, business-supported, conservative groups began to form and pressure lawmakers to roll back new spending. These groups were reacting primarily to policy changes they disliked.
Separately, economists Buchanan and Tullock (1962, 285–87) argue that historic increases in lobbying are due to new government spending. In their view, groups are more likely to lobby as the perceived, potential benefits from lobbying increase. Such benefits increase with state spending, particularly spending on selective as opposed to collective benefits. This is more akin to the instrumental lobbying Lowery (2007) mentions and implies that government austerity curbs overall lobbying.
While the studies that link government growth with interest populations offer different accounts of which aspects of government (lawmaking or spending) are correlated with groups, narratives also differ over causal directionality. Those who study legislative agendas tend to argue that lawmaking attracts interests. Others argue that groups help to steer government agendas or size. In this latter group, sometimes labeled the Virginia School (i.e., public choice), Mueller and Murrell (1986) argue that groups seek selective benefits from government in exchange for corralling votes or other forms of support for incumbent leaders. In their account, government awards additional selective benefits as additional groups mobilize. Similarly, Holyoke and Cummins (2020) argue that interest groups push state governments to spend more and accrue more debt, particularly for selective benefits. Still others suggest that groups extract benefits via regulatory capture (e.g., Peltzman 1976; Stigler 1971).
It may be the case that multiple kinds of government growth are linked with lobbying, or that there is bidirectional causality. Jones, Theriault, and Whyman (2019) linked both legislative activities in new policy domains and increased spending with group mobilization. They remain mum on causal direction: “interest groups respond to policy-making activities as much as they cause them” (227). Interests and social movements may have caused Congress to increase lawmaking and spending, but the great expansion of government spurred a conservative backlash. Buchanan and Tullock (1962, 285–87) explicitly adopt a view of bidirectionality in which government spending attracts interests, and the granting of selective benefits has a snowballing effect on group mobilization. Sobel and Clark (2016) argue further that Buchanan’s (1965) theory of club goods implies that there is an optimal level of lobbying for every possible level of government size, thereby suggesting a bidirectional causal relationship. They apply Granger causality tests to spending and lobbying statistics from the federal government and find evidence for bidirectionality.
Gaining Insight from the States
At the beginning of the twentieth century, state legislatures produced comparatively few laws and spent small amounts of money. Teaford (2002, 1–5) writes that state governments were viewed as incompetent institutions that were unable or unwilling to provide various services. From the Gilded Age to the New Deal era, the federal government increased its policymaking capacity relative to that of the states. Throughout the Gilded Age, the balance of federal and state power divided the major parties (Les Benedict 2010). Increasing interstate commerce spurred more federal involvement in economic activity (Teaford 2002, 2). Federal power expanded with acts to regulate food packaging, starting with the Oleomargarine Act. Multiple states tried unsuccessfully to regulate railroads, and federal regulation was enacted in 1887 as part of the Interstate Commerce Act (McCraw 1984, 57–79). This was followed by the Sherman Antitrust Act in 1890. The Progressive Era saw the ratification of the Sixteenth and Seventeenth Amendments, which allowed for the federal income tax and popular election of U.S. senators, respectively. These changes concentrated additional power in the federal government, which became even more involved in economic affairs years later in response to economic depression.
Beginning in the 1960s and 1970s, state governments began to grow rapidly and reform institutionally. State taxes increased more quickly than federal taxes during these decades (Teaford 2002, 9). Legislatures came to rely more heavily on income and sales taxes for raising revenue, including many states that had not previously imposed such taxes. Between 1959 and 1970, the states enacted 410 new sales, income, and excise taxes, and own-source revenue in the states jumped from 6.6 to 9.1 percent of personal income (Teaford 2002, 217). States also strengthened the powers of governors and professionalized their legislatures (Squire 2012). Elazar (1974, 90) considers the expansion and transformation of state government a “quiet revolution” in American politics, but tax increases led to local tax revolts (notably in California), and small-government advocacy groups, including the American Legislative Exchange Council, began to pressure legislators into undoing tax increases (Hertel-Fernandez 2019). 2
While state governments experienced a period of rapid growth and reform, they also maintained lobbyist records. The states were the first governments in the world to require lobbyists to register. Massachusetts first enacted a statute in 1890. 3 Over time, registration laws were adopted in three spurts. First, multiple states adopted registration during the Progressive Era. Second, several more required lobbyists to register after Congress did so in 1946. Third, the remaining states adopted registration either during the 1960s when legislatures became more professional assemblies or in the 1970s following the Watergate scandal. By 1975, all states required lobbyists to register. The statutes or chamber rules also required lobbyists to disclose the identities of clients (i.e., institutions, associations, or membership-based groups). The online supplemental material includes a table that lists the years when each state first required lobbyists to register. 4
Figure 1 presents the lobbyist registration form used in Massachusetts from 1891 until 1975. Legislative dockets in the state contain hundreds of these forms. From the form presented, the Massachusetts State Grange hired James W. Stockwell, a farmer by trade, to lobby. Stockwell was the first registered lobbyist in Massachusetts. In general, when states first adopted lobbyist registration, lobbyists were required to list their clients, addresses, occupations, and lobby subject matters. Legislative dockets or notebooks containing blank forms were maintained primarily by secretaries of state. In addition to requiring that lobbyists sign dockets, Massachusetts and several other states required lobbyists to submit expense reports at the end of each legislative session. Depending on the state’s statute, reports included amounts for compensation, travel expenses, or costs related to entertaining lawmakers.

The first lobbyist registration form in Massachusetts, dated July 11, 1891.
Figure 2 tracks total interest groups with registered lobbyists over time in the 30 states with the oldest available records. 5 The figure is separated into ten panels. While all the panels present interest populations, the scale of the axes differ somewhat depending on the observations. To allow for easy visualization of trends, states with similarly sized populations are grouped together. Within each panel, the state with the oldest records is listed first. For all states where possible, individuals who registered to lobby on behalf of personal interests (i.e., did not list a client) are excluded. 6 The statistics presented in Figure 2 are based mostly on records the author collected from archives and libraries in the states. The records are transcribed by research assistants. Where records are not available, secondary sources are consulted. These sources include Pierce (1951), Zeller (1954), Kentucky Legislative Research Commission (1955), Lane (1964), Hrebener and Thomas (1992, 1993a, 1993b), Gray and Lowery (1996), and Strickland (2019a). 7
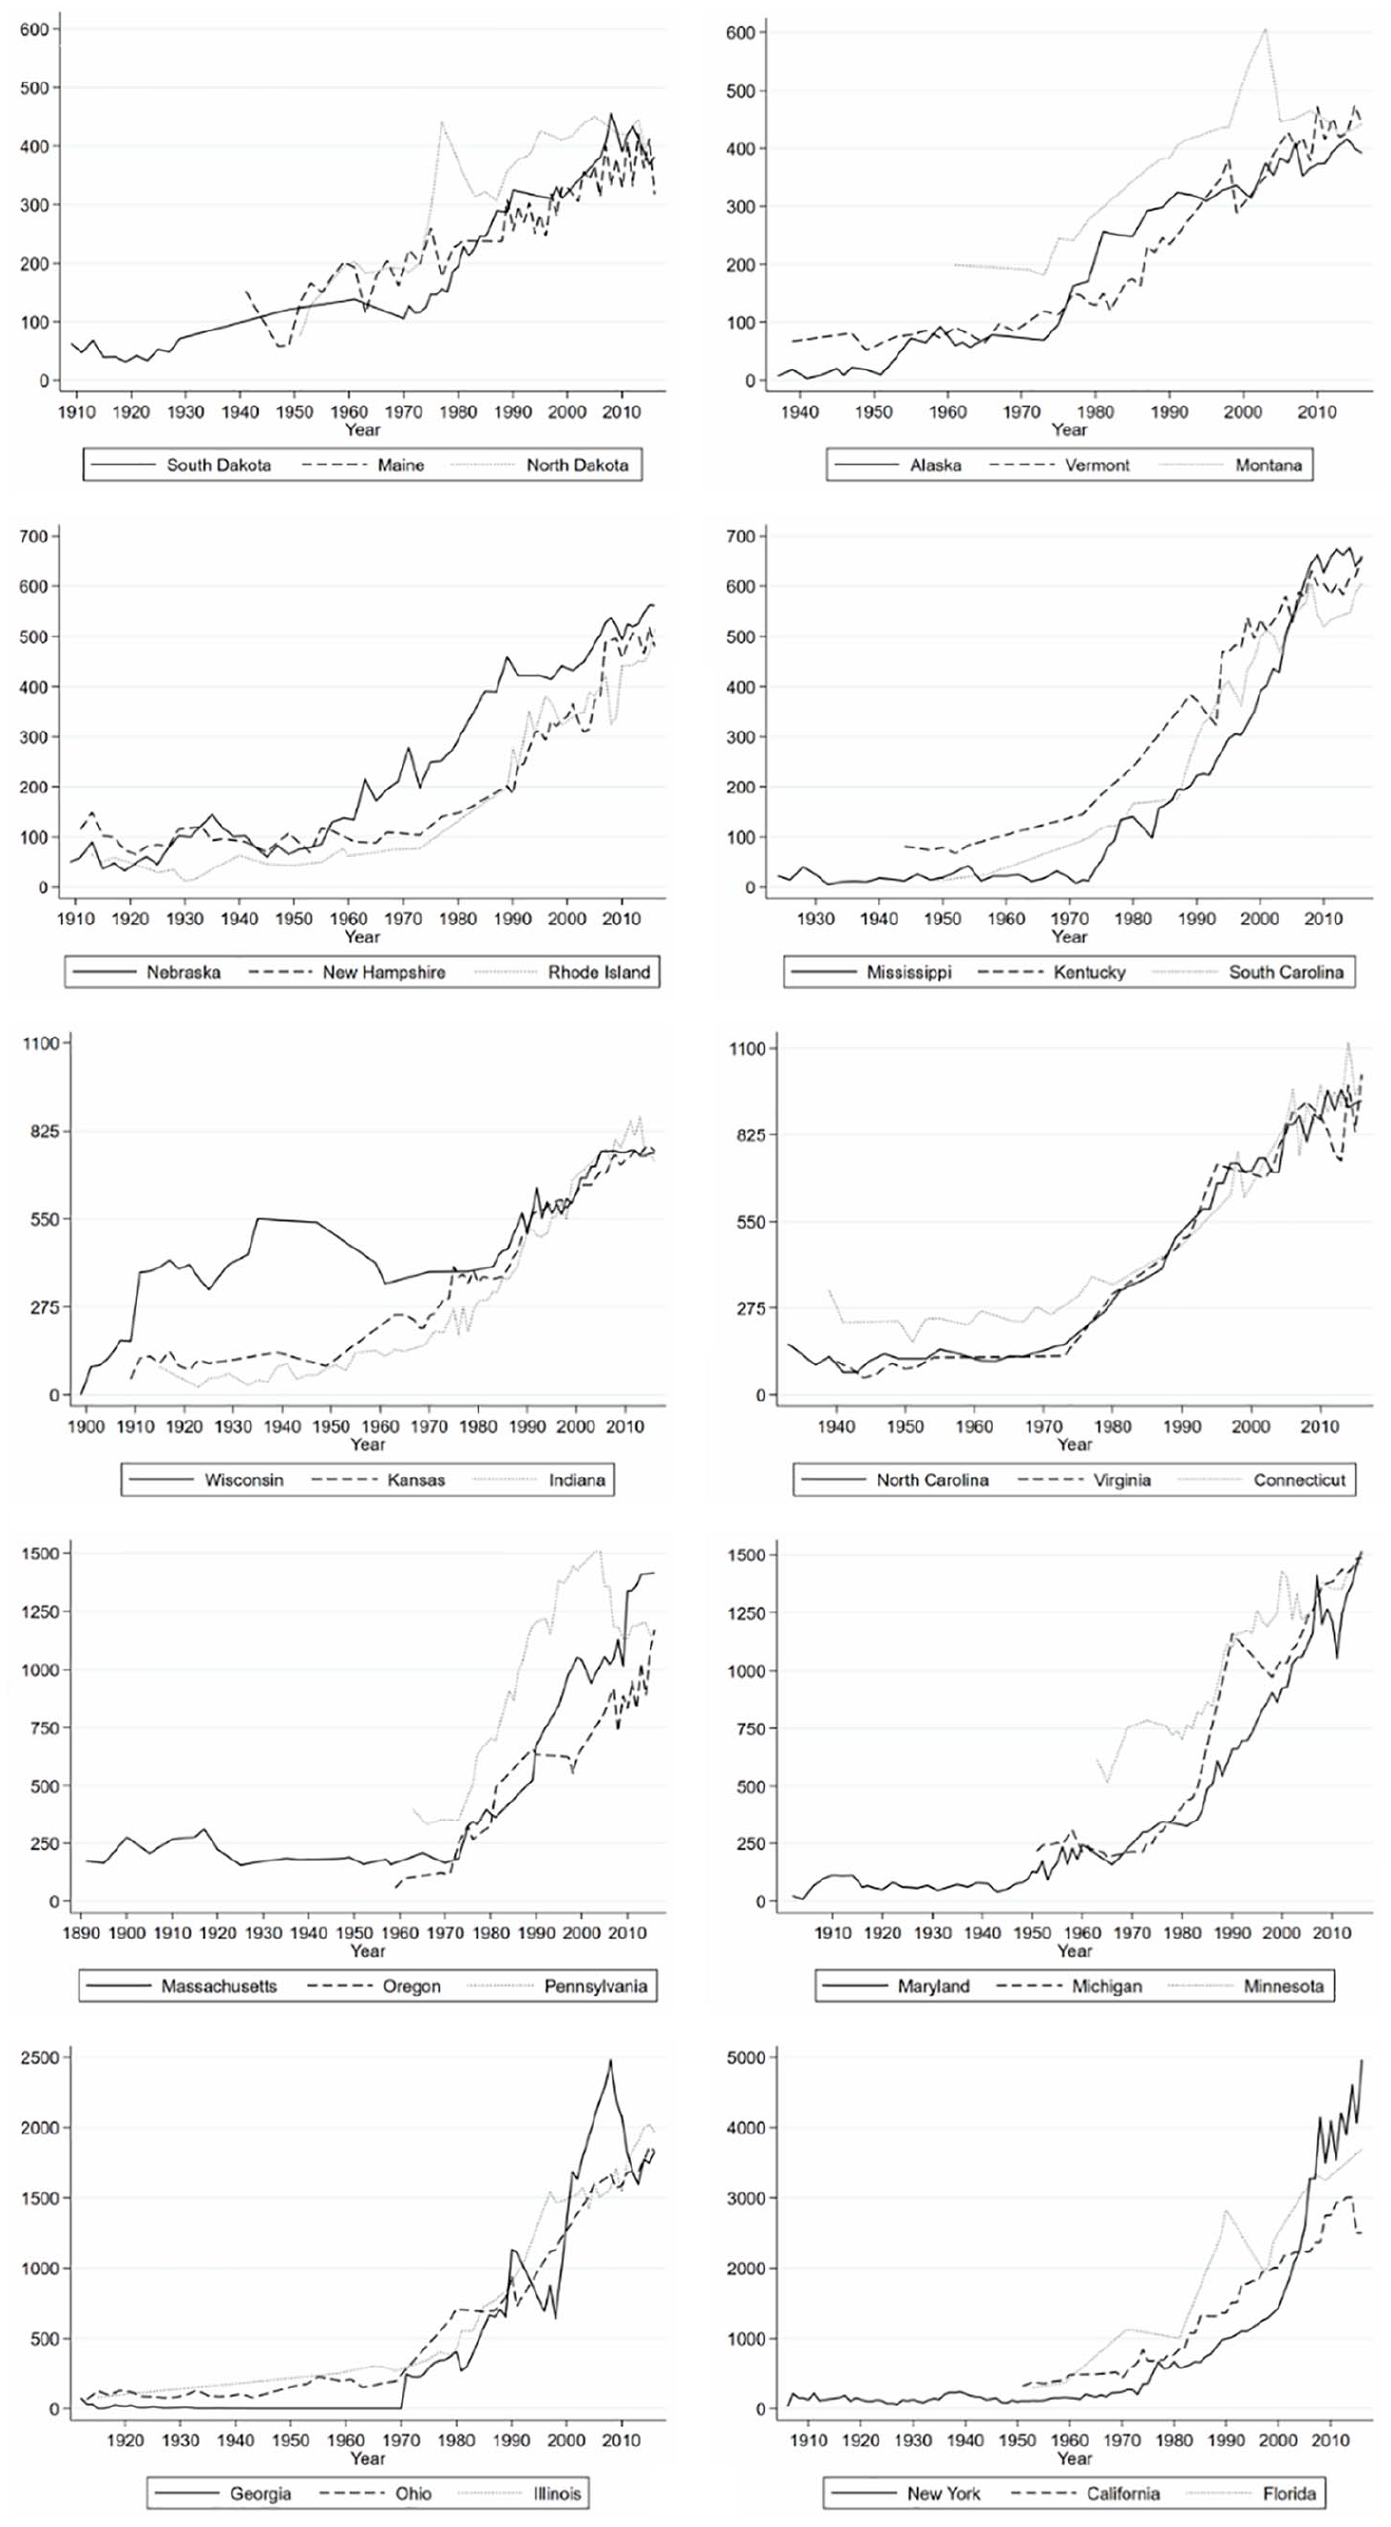
Interest populations across thirty states, 1891–2016.
From the panels in Figure 2, four trends are notable. In nearly every state, interest populations begin to increase precipitously during the 1960s or 1970s. The strongest exception is Wisconsin. That state’s unusually Progressive legislature and all-encompassing lobby law likely explain the early appearance of numerous interest groups (see Lane 1964, 155–57; Squire 2012, 286–97; Teaford 2002, 56–58). A second trend is that interest populations continue to grow over time. Whereas populations in some states seem to shrink or stabilize around 2010, populations in most states continue to grow until 2016. Third, there is a great amount of variability within states in recent decades. There are visible, temporary bursts of lobbying activity in Florida, Georgia, Montana, North Dakota, and Pennsylvania. 8 Fourth, the growth of state interest populations reflects accounts of interest populations in Congress. Jones, Theriault, and Whyman (2019, 227–44), and Schlozman and Tierney (1986), find similarly timed increases in congressional groups.
Modeling Interest Populations
Lowery and Gray (1995) develop a regression model that predicts how many organizations lobby in each state. Such organizations include institutions such as individual businesses, universities, or hospitals; associations of institutions such as chambers of commerce; and membership-based groups such as the Sierra Club. They label their model the energy, stability, area (ESA) model of interest populations. In the model, group numbers respond to energizing factors such as lawmaking: “the appropriate analog of energy for interest groups [is] constituent interest, or government goods and services—whether actually or potentially provided—that the group might value” (11). For example, if a legislature considers gun-control proposals, then it energizes pro- and anti-gun-control groups into lobbying. Such energy helps the groups to recruit members and donations, especially if members or donors perceive that policy change is more likely than before. The stability of governing institutions, including the size of government, also affects interest totals. Finally, area or state size helps to account for cross-state differences. Large state economies contain more businesses and constituents that might lobby or join groups. States have limited capacities for organizations as there is competition for limited customers, members, or other supporters.
Explanatory Variables
In the ESA model, lawmaking activities are energizing features of political environments: interests are attracted to governments that perform more functions or legislatures that consider more bills. Gray et al. (2005) find support for this proposal by looking to the states. Leech et al. (2005) examine numbers of bills enacted in Congress across different policy domains. Jones, Theriault, and Whyman (2019) examine total numbers of enactments. All authors find that more introductions or enactments are correlated with more lobbying by groups. Although I cannot identify how many bills the state legislatures enacted across different policy domains over time, I include the numbers of total bills enacted into law in my models. This variable captures the relationship between lawmaking and interest populations. I also include lengths of legislative sessions, in days, in my regression models. With longer sessions, legislators have more time to enact laws, thereby possibly attracting the interest of more groups. Law counts and session lengths are collected from various editions of the Book of the States, an annual compendium published by the Council of State Governments.
I include two additional variables capturing the expansion of legislative agendas in states. I employ a measure of policy liberalism created by Caughey and Warshaw (2015). The measure covers 148 diverse policy areas. According to this measure, most states have adopted generally more liberal policies since the 1930s. In terms of policy liberalism, Northeastern states have all become more liberal while Plains states have become more conservative. Southern states have always been conservative whereas Midwestern states have generally remained moderate over time. I expect more groups to mobilize as states adopt progressively more liberal policies. Next, I turn to a measure of policy innovativeness developed by Boehmke and Skinner (2012). The innovativeness index is based on enactments in 137 diverse policies. Higher scores indicate that states more often adopted policies before other states. Unlike with policy liberalism, there are fewer regional trends, and it appears that each region of the country had one or two policy leaders. Just as with policy liberalism, I expect groups to mobilize in tandem with more policy innovation.
Moreover, the possibility for policy change also energizes lobbying. During the years included in my dataset, states experienced large changes in partisan competition. Southern legislatures in particular transitioned from one-party domination to competitive environments during the 1980s and 1990s. Evidence is mixed as to whether partisan dominance affects total interests, with Gray et al. (2015) finding no correlation while Strickland (2019a) finds that more partisan competition is correlated with more groups (as Lowery and Gray 1995 originally propose). I include a folded Ranney (1976) index in my study to capture one-party dominance. The folded index ranges in value from 0.5 to 1. Lower values indicate more one-party domination (from any party) of a legislature. These measures are provided by Klarner (2013).
As for stabilizing factors, Lowery and Gray (1995) use the age of a state’s political system and find no evidence that older state governments are lobbied by more groups (as Olson 1982 suggests). They also incorporate spending into their models as a stability-based variable. 9 While they do not find evidence that spending contributed to interest populations, Chamberlain, Yanus, and Pyeatt (2019) do find a correlation between group membership and government size during the Progressive Era. To help capture stability and test Buchanan and Tullock’s (1962) expectations, I include a measure of state spending within my models. Annual spending statistics are collected from the Census Bureau’s Governments Division and provided by Klarner (2015) in terms of millions of real dollars. The totals include spending on education, public welfare, hospitals, health, highways, police protection, corrections, natural resources, parks and recreation, general administration, interest on general debt, and miscellaneous expenses. The spending statistics exclude utility, liquor store, and insurance trust expenditures because those expenditures are often supported with special sources of revenue such as payroll taxes or voluntary premiums, and are sometimes set aside for state agencies that are restricted from lobbying. I show in the online supplemental material that including these expenditures does not change my substantive findings. A discernible, positive relationship between spending and lobbying would provide evidence in favor of Buchanan and Tullock’s (1962) expectations.
The legislative and legal contexts of states have changed over time. Legislative reforms and the implementation of new lobbyist registration laws may be considered additional stabilizing factors that affect interest mobilization. Berkman (2001) shows that fewer interests lobby in more professionalized legislatures. This effect is attributed to groups not being able to command as much influence in professionalized assemblies due to the presence of staff researchers who provide legislators with information (and thereby serve as substitutes for informative lobbyists). To help account for any effect linked to legislative professionalization, which occurred generally between the 1960s and 1970s, I include a measure of total spending on each state legislature divided by numbers of incumbent legislators. Such a measure is expected to capture the effects of legislative informational support but is an imperfect measure as it also includes legislator incomes. Spending statistics are produced by the Census Bureau’s Governments Division and provided by Klarner (2015).
I introduce two control variables for different kinds of lobby laws found in the U.S. states. The first variable is simple: the age of the state’s first lobbyist registration requirement, in years. Massachusetts is the first state in my sample to require lobbyists to register, in 1891. Oregon is the last state and first required lobbyists to register in 1965. 10 I include in my models the total number of years lobbyists have ever been required to register. These data are provided by Strickland (2020). I expect that lobbyists who register in any given year are more likely to register in subsequent years, even if lobby laws are reformed or strengthened. Therefore, I expect that older laws generally capture more lobbyists than newer laws. The second variable is a dichotomous indicator for whether a state’s original lobby law has been replaced by a new lobby law and is no longer in effect. Lane (1964) documents that lobby laws enacted during the Progressive Era were sparsely detailed and poorly enforced. Most states’ original laws were not updated until the 1960s during the legislative professionalization movement, or 1970s as part of a national response to the Watergate scandal (see Greenwald 1974). The dichotomous indicator in my models helps to isolate the effects of states’ initial lobby laws and subsequent reforms: if a state’s first lobby law had been replaced by a new law and was no longer in effect, then the state received a score of one for this variable. The score remains at one for every year the updated lobby law remains in effect, including if subsequent laws were enacted. In accordance with Strickland (2019a), I expect stronger lobby laws to capture more groups in general. 11
Finally, I turn to a state’s area or size. Lowery and Gray (1995) find that there are more groups in states with larger economies but as economic output increases, interest populations increase with declining marginal returns (i.e., populations are “density-dependent” or self-regulating) (10). Lowery and Gray use economic output as a measure of state size as most interest groups are institutions such as business firms that do not have members. Unfortunately, output measures are not available by state for years before 1963 when federal agencies began to calculate such statistics. As a result, instead of holding output constant, I control for differences in resident populations. Holyoke (2015, 82) finds a correlation between resident populations and interest groups similar in form to the correlation between economic output and interest populations. Following Lowery and Gray’s model specification, I estimate one coefficient for resident populations and another coefficient for squared resident populations. I expect both variables to be discernible predictors of group populations. The first coefficient should have a positive value and the second coefficient a negative value, thereby indicating declining marginal returns.
Data, Estimation Method, and Results
To diagnose which factors (energizing, stabilizing, or area-related) are correlated with historic increases in interest populations, I construct a dataset of observations taken from thirty states roughly every decade. The states include all those presented in Figure 2. 12 As some states are early adopters of lobbyist registration, there are significantly more observations available for some states than for others. Estimating regression models with all available observations results in estimates that reflect trends in some states more than trends in other states. To avoid this outcome and equalize the influence of each state in my sample, I estimate regression coefficients using observations that occur roughly every ten years in each state beginning in 1949. 13 In summary, I gather seven complete waves for twenty-five states. Five states are missing population counts from the late 1940s. Data limitations prevent me from examining populations for the same year for every state in every wave. As a result, some observations are collected from nearby years. The box plot presented in Figure 3 shows interest population averages and outliers for each of my seven waves. The plot shows the gradual increase in populations that occurred throughout the twentieth century. With each successive wave of observations, interstate variance increases. The online supplemental material includes a line chart showing the average number of interest groups registered per decade across all states except Wisconsin, which is charted separately.
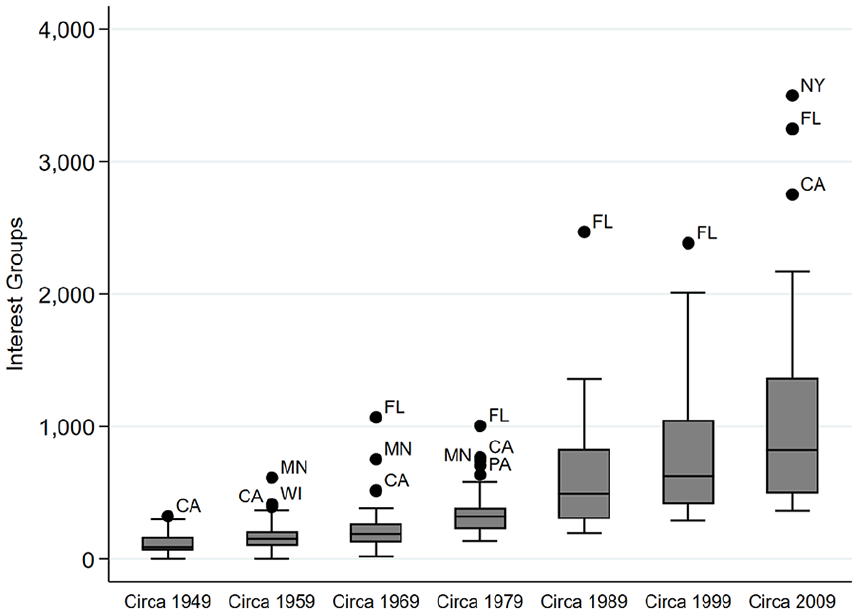
Interest populations across sampled states.
My dependent variable is the total number of interest groups registered to lobby within each state and year. The variable is a count of positive, discrete events with overdispersion, so I estimate negative binomial regressions to capture the overdispersion. As there are repeated observations from each state within my dataset, and because I am most interested in explaining over-time changes in interest populations, I estimate models with both state- and year-level fixed effects. The state-level effects capture different average values in populations for each state, and year-level effects capture national averages in group populations for each year. The use of both sets of fixed effects force my models to estimate coefficients based only on within-state changes that occurred over time (Mummolo and Peterson 2018). I estimate additional model specifications in the online supplemental material.
As the range of observations differs across states, I estimate a series of models with different samples. Five states in my sample lack observations from the late 1940s because they did not then require lobbyists to register. These states include Illinois, Pennsylvania, Minnesota, Montana, and Oregon. Observations for explanatory variables are missing for an additional state (Alaska) at that time. Moreover, as Nebraska and Minnesota have (or had) officially nonpartisan legislatures, I estimate models with and without my measure of one-party dominance. Table 1 presents results from six regression models. I begin by estimating Model 1, which uses all available observations from my sample of thirty states. The second model excludes the variable for one-party dominance. In model 3, I estimate coefficients using complete waves only (so, observations from all states except the six with any missing observations). The fourth model examines the same states but excludes one-party dominance. In model 5, I use only observations of interest populations from years before the revision of initial lobby laws. Most of these observations date from before the 1970s, although Kentucky and New Hampshire waited until the 1980s and 1990s to replace their initial lobby laws, respectively. I estimate model 6 using observations only from after the implementation of updated or improved lobby laws. Most of these observations are from after the 1970s, although Wisconsin and California replaced their initial registration requirements in 1947 and 1950, respectively. All the observations from those states are used to estimate model 6.
Government Growth and Lobbying by Interest Groups.
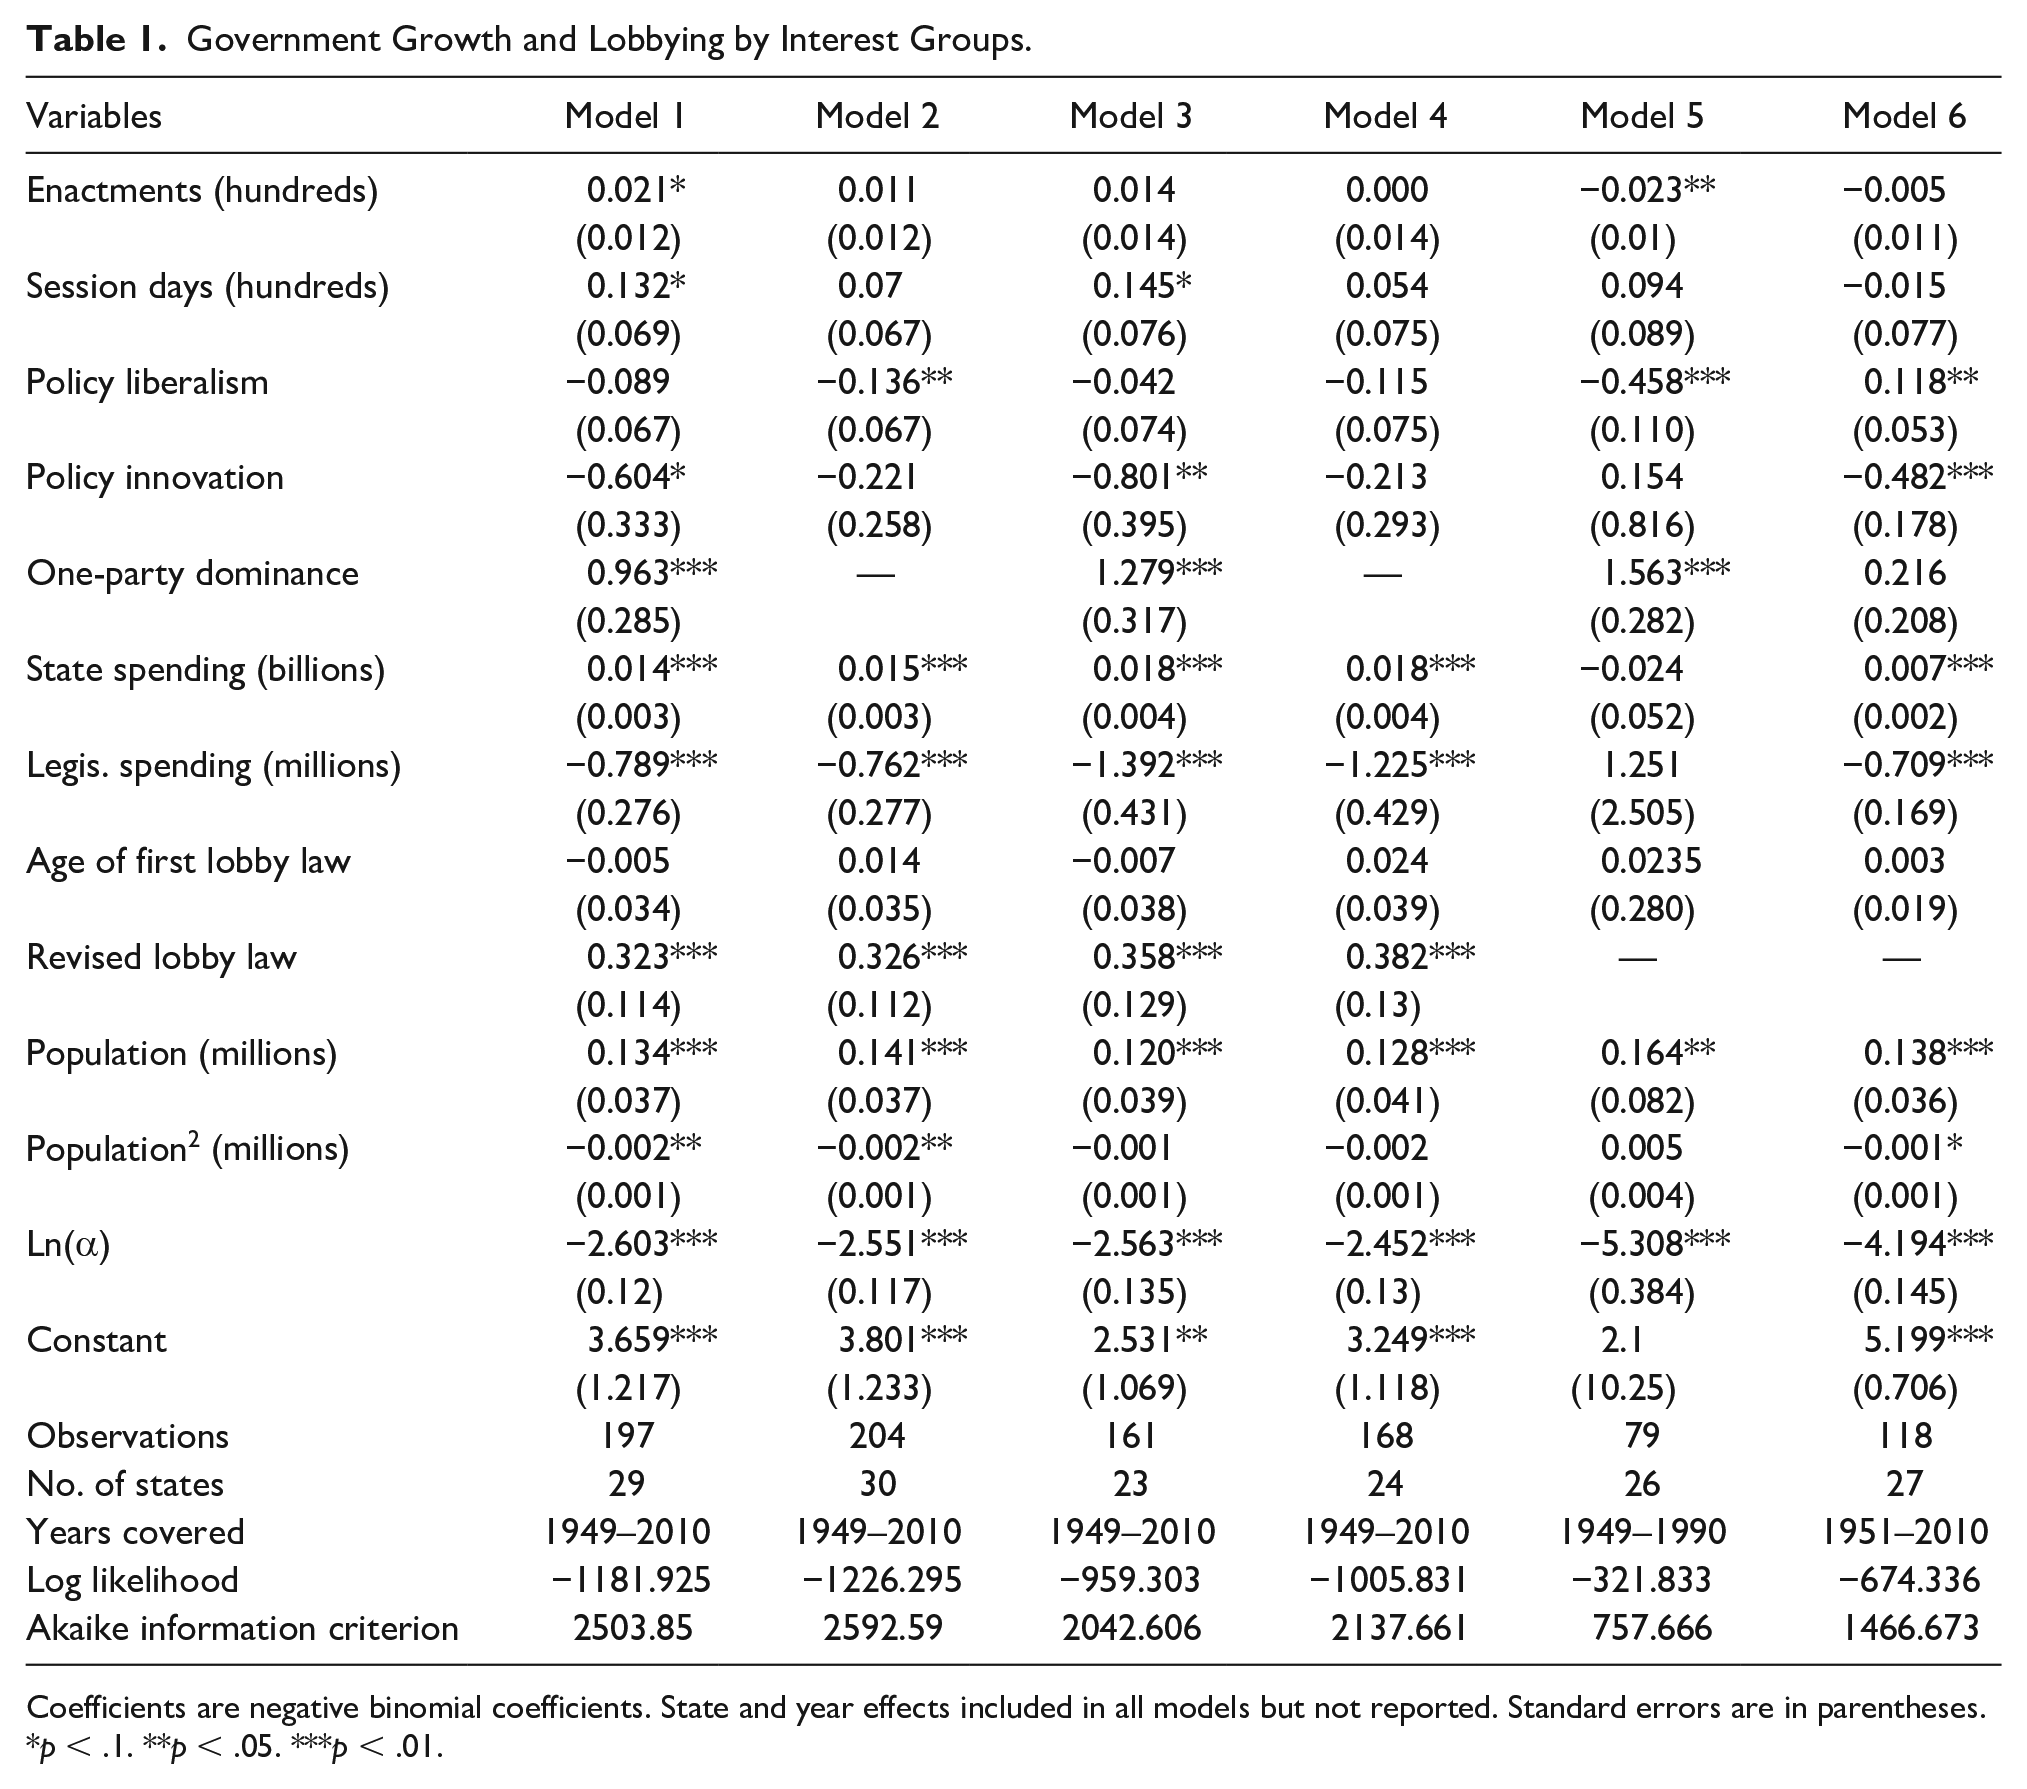
Coefficients are negative binomial coefficients. State and year effects included in all models but not reported. Standard errors are in parentheses.
p < .1. **p < .05. ***p < .01.
Results
Table 1 presents the results of six regression models. In general, there is inconsistent evidence that changes in energizing factors (such as bill enactments, session length, policy liberalism and innovation, and one-party dominance) are correlated with changes in interest populations. The absence of discernible findings is likely not due to multicollinearity given that the highest correlation coefficient among the five variables is 0.47 (between session length and policy liberalism). Stabilizing and area-related factors explain much more variation in interest populations, and the estimated effects of these variables are consistent across models. None of these results change when I include observations from Nebraska’s nonpartisan legislature, in models 3 and 4. 14
As for stabilizing factors such as state spending, legislature spending, and lobby laws, results are consistent across models. From Table 1, state spending is a discernible and consistent predictor of interest group populations. More spending is associated with more groups choosing to lobby. Moreover, the substantive size of the effect is consistent across time. According to model 1, each additional billion dollars in state spending (decade over decade) is associated with around 1.45 percent more groups on average, ceteris paribus (i.e., the incidence rate ratio for spending is 1.0145). To put this change into perspective, state spending increased by an average $14.32 billion within my sample states between the late 1990s and late 2000s. The states contained an average of 830 groups in the late 1990s. The average spending increase is correlated with approximately 190 additional groups registering a decade later. The effects for overall spending are generally consistent across models. Increases in spending on a state’s legislature are negatively correlated with changes in group totals. This supports the expectations of Berkman (2001). According to results in model 1, every additional (decade over decade) million dollars in spending per state legislator reduces groups by about 55 percent on average, ceteris paribus. Most states adjusted their per-legislator spending by much less than $1 million every decade, however, so this effect appears larger than what occurs in reality. For example, between the late 1990s and late 2000s, sampled states spent an additional $125,161 per legislator on average. I do not find that the age of a state’s lobby law is correlated with interest populations, but the enactment of improved laws is correlated with more interests. From model 1, a state’s transition from its first lobby law to a new law resulted in roughly 38 percent more interest groups registering to lobby.
Finally, resident popular is a discernible and consistent predictor of interest group populations. This result is unsurprising given the findings of Lowery and Gray (1995) and Holyoke (2015). Resident population appears to be a good proxy for state economic output in models. My findings also provide support for the self-limiting nature of interest populations. How might populations be self-limiting given consistent growth in most states, as presented in Figure 2? The functional form of the correlation between residents and interest group totals changes when one excludes outlier observations. In models not presented, the exclusion of observations from California, Florida, New York, or any set of those states results in models where resident populations and group totals are linearly correlated (i.e., with constant marginal increases).
Taken together, the results generally support Lowery and Gray’s (1995) ESA model, and indicate that long-term changes in stabilizing and area-related factors explain the most variation in historic interest populations. As opposed to lawmaking (an energizing factor), government spending (a stabilizing factor) is a consistent, positive predictor of groups. This provides support for Buchanan and Tullock’s (1962) expectations but results from model 6 also suggest that legislative agendas likely influence mobilization in the present era. The results presented in Table 1 are based on aggregated measures of policy activity (similar to but not the same as those used in Jones, Theriault, and Whyman 2019), but do not rule out the possibility that sector-specific activities might spur different kinds of interests to lobby.
Granger Tests for Causal Directionality
The results presented in Table 1 show that growth in government spending is correlated with additional interest groups. The results do not indicate if government spending spurred more groups into lobbying or if groups spurred government into spending. To understand these processes better, I conduct a series of Granger causality tests using spending statistics and interest populations from twelve states. The tests are not intended to determine causal directionality between spending and groups once and for all states, as each set of test results is based on data from an individual state. While lobbying might lead to spending in some states, the order might be reversed in others. Yet in other states, there might be no causal link or, alternatively, lobbying and government both affect each other. The regression estimates presented in Table 1 are based on multiple states, but trends can vary in individual states. I conduct the Granger tests on states with at least thirty consecutive annual or biennial observations of interest populations and state spending. I am left with a geographically varied set of twelve states: California, Colorado, Illinois, Kansas, Maine, Maryland, Minnesota, Mississippi, Nebraska, New York, North Carolina, and North Dakota. 15
To conduct the tests, I ensure that my observations of spending and group totals are stationary. In other words, over-time trends in the means and variances are removed (see Box-Steffensmeier et al. 2014, 125). Trends in time series may mask autoregressive processes. This is likely the case in this study as both spending and groups increase over time in every state. Indeed, augmented Dickey-Fuller tests show that every variable in its original form is nonstationary (Dickey and Fuller 1979). I generate first or second differences in observations of spending totals and interest populations. Applying the augmented Dickey-Fuller tests to the differenced variables, I then reject the null hypothesis of nonstationarity for each variable. 16
Granger tests are intuitively simple: “a variable Xt is said to Granger-cause another variable Yt if Yt can be better predicted from the past of Xt and Yt together than from the past of Yt alone” (Box-Steffensmeier et al. 2014, 112). Each test requires two regression equations for which either spending or group totals is the response variable. In the tests presented, the null hypotheses propose that year-to-year differences in one variable (either spending or groups) do not predict differences in the other variable. Alternative hypotheses propose the opposite, including the possibility for bidirectional causality. I expect that any autoregressive processes within spending or groups last for only one year but, as a robustness check, I also perform Granger tests with multiple lags.
The results of my Granger tests each using one lag are presented in Table 2. The first column and second column of results test different null hypotheses. The results are scaled in differences of thousands of interest groups and billions of real U.S. dollars. Table 3 presents similar tests for California, Mississippi, and New York, but with multiple lags. Those tests are presented as robustness checks and provide additional support for the trends presented in Table 2. 17
Granger Causality Tests of State Spending and Interest Groups.
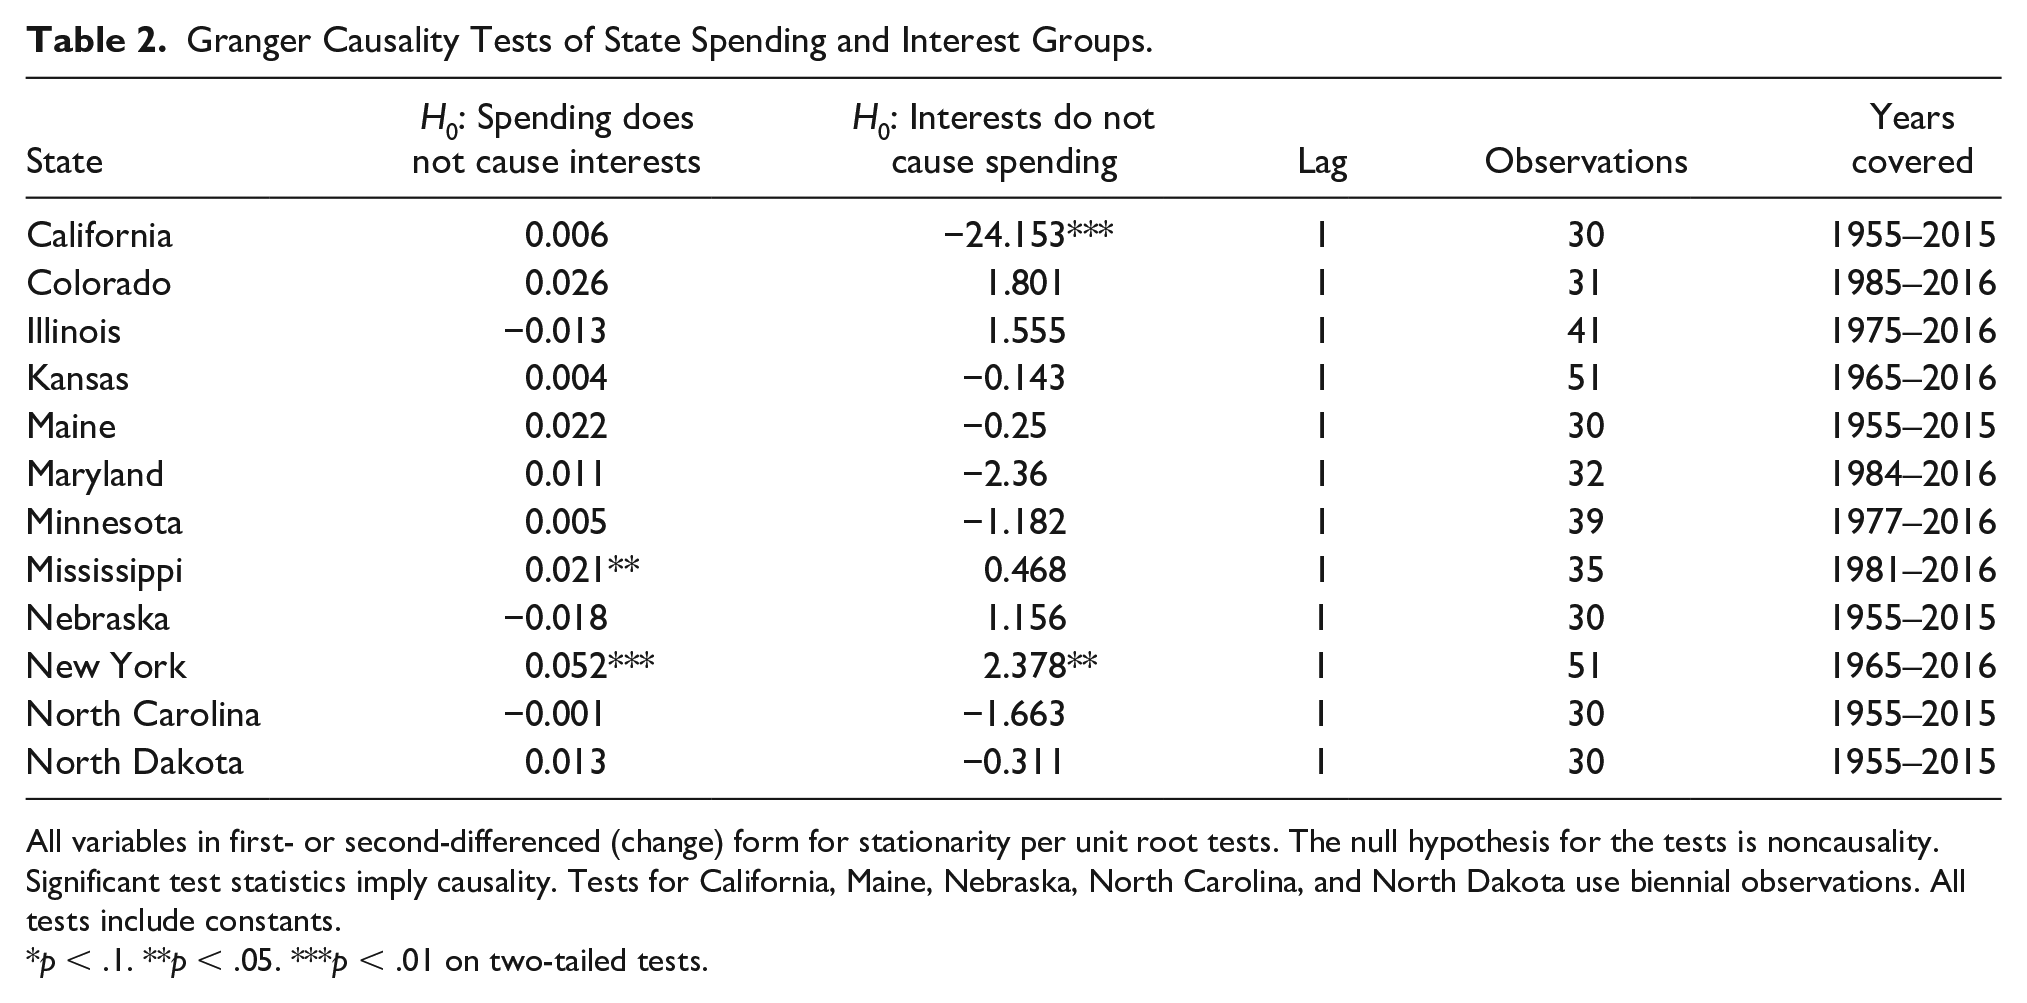
All variables in first- or second-differenced (change) form for stationarity per unit root tests. The null hypothesis for the tests is noncausality. Significant test statistics imply causality. Tests for California, Maine, Nebraska, North Carolina, and North Dakota use biennial observations. All tests include constants.
p < .1. **p < .05. ***p < .01 on two-tailed tests.
Granger Causality Tests of State Spending and Interest Groups.
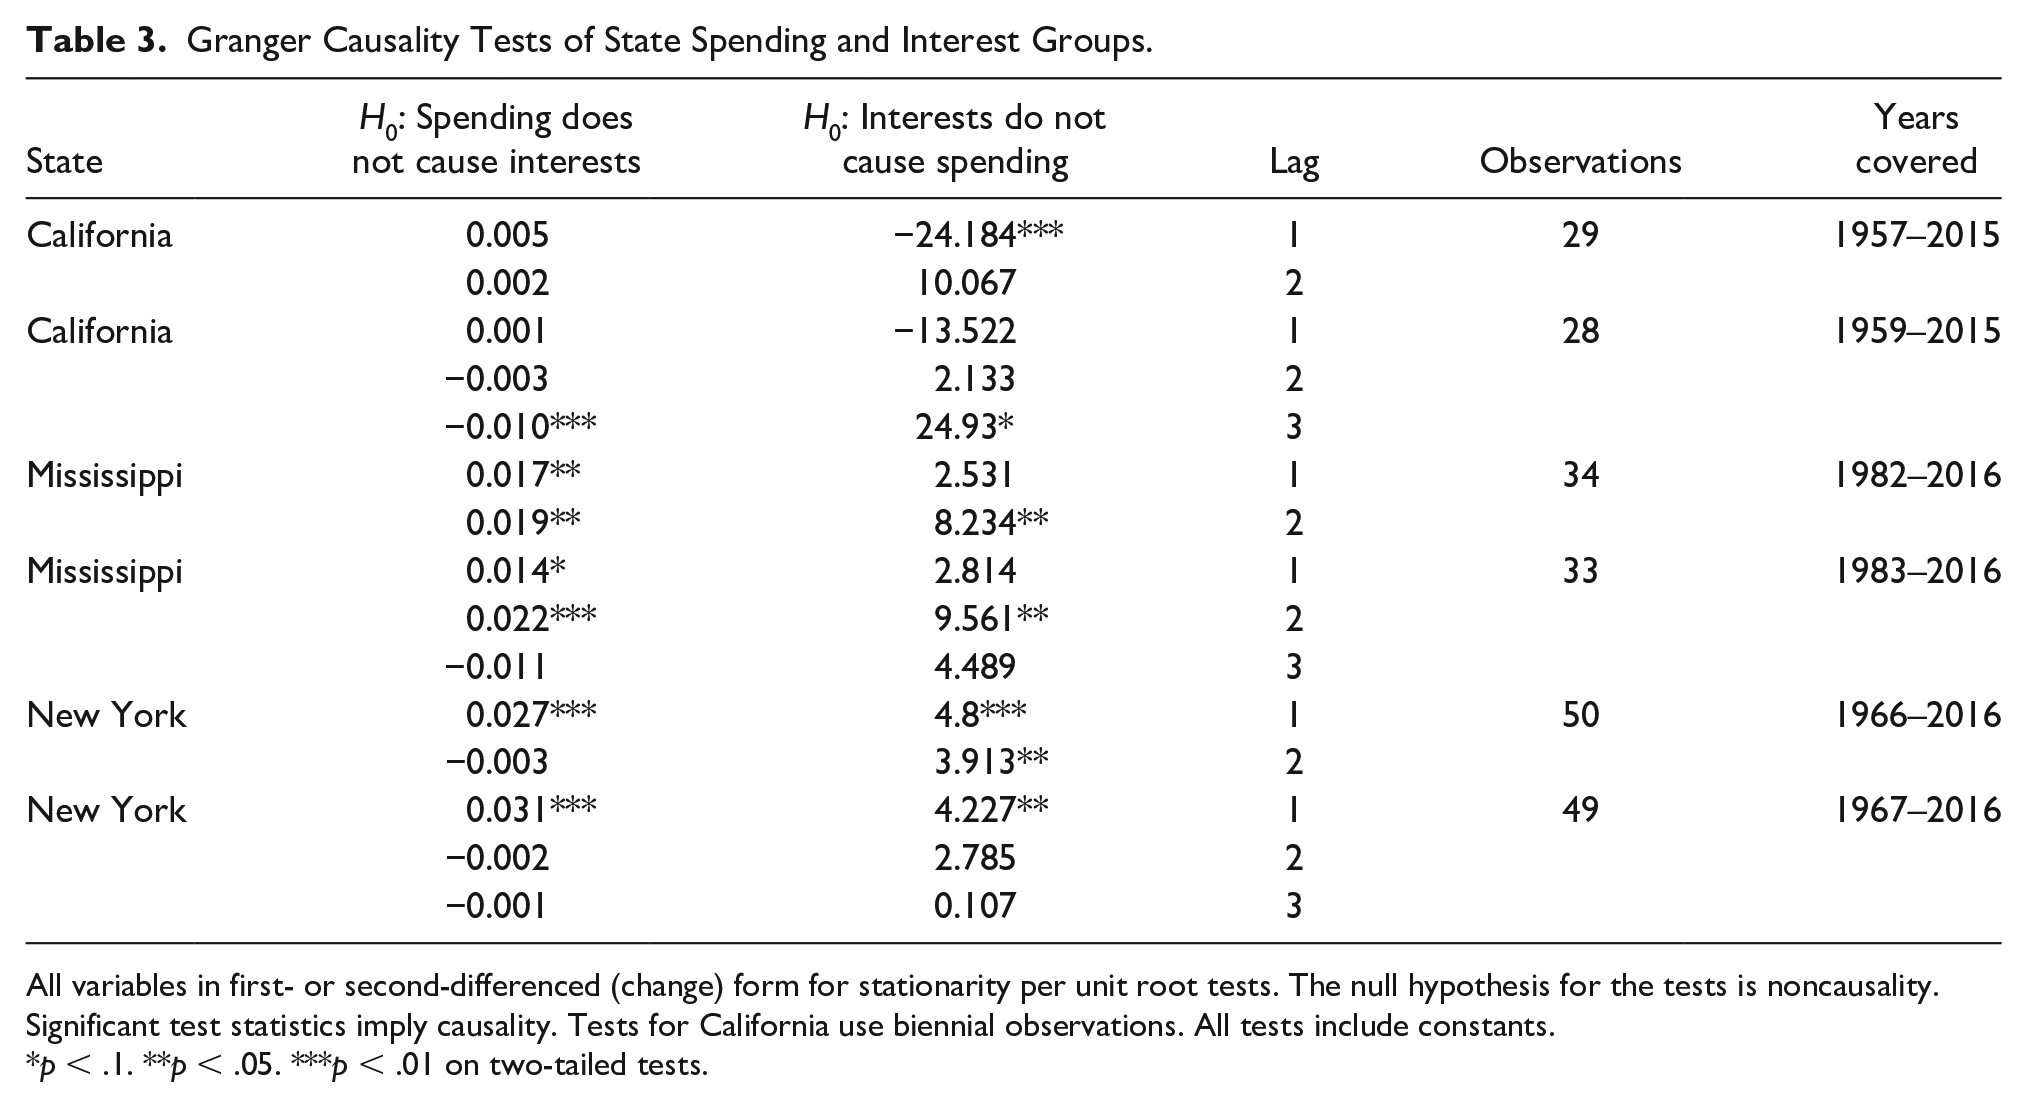
All variables in first- or second-differenced (change) form for stationarity per unit root tests. The null hypothesis for the tests is noncausality. Significant test statistics imply causality. Tests for California use biennial observations. All tests include constants.
p < .1. **p < .05. ***p < .01 on two-tailed tests.
Based on the results presented in Table 2, data from the states do not lend consistent support to any of the narratives linking groups with state spending. In nine states, I fail the reject the null hypotheses that groups or spending do not Granger-cause each other. In California, however, I find evidence that growth in interest groups discourages state spending. This result does not persist when one includes additional lags, as reported in Table 3. The results for Mississippi and New York are robust. In Mississippi, spending appears to Granger-cause lobbying by groups. On average, every $21 million in additional, year-over-year spending results in one new group lobbying. This result weakens somewhat but persists with the inclusion of additional lags. In New York, results suggest that there is bidirectional causation. Every year-over-year increase of $52 million in spending results in an additional group lobbying. Also, about 2.4 additional groups mobilizing each year results in an additional billion dollars in differenced spending. While both effects persist with the inclusion of more lags, the latter result does not persist when one excludes observations from before 1975 when group counts are based on totals of lobby reports provided by the Secretary of State. While the effect sizes seem small in comparison to total spending or groups, the results are based on year-over-year differences in either variable.
Discussion
America’s state capitols have not always been as crowded with competing interests as they are today. Throughout much of the twentieth century, state governments were incompetent institutions that were unable or unwilling to provide various services. Comparatively few interest groups lobbied state legislators prior to the “quiet revolution” in state government (as in Elazar 1974, 90). During the 1960s and 1970s, states saw increased policy liberalism, substantial increases in tax rates and spending, and institutional reforms such as legislative professionalization. As state governments expanded their lawmaking activities and budgets, a similar revolution occurred in lobbying: numbers of interest groups registered to lobby increased dramatically. Importantly, these increases do not reflect mere increases in the supply of potential organizations that may lobby, as measured by numbers of residents within states.
I sought to determine which sources of state growth most influenced interest mobilization. My findings support Lowery and Gray’s (1995) ESA model but suggest that stabilizing factors such as the size of government help to guide long-term trends in interest populations. By exploring observations of interest populations older than those used in previous studies, I provided insight into the least examined aspect of the ESA model: stability. This study is the first to examine repeated interest populations in the states from before the quiet revolution when state governments began to grow. Others may build on these findings. While state and year effects in my regression models control for time-invariant factors, there might be omitted time-variant factors.
What can we make of the inconsistent results presented across Tables 1 and 2? First, interest groups may lobby in response to components of state spending that are correlated with overall spending. In addition to raising more revenue, state governments increasingly came to rely on categorical and block grants from the federal government throughout the twentieth century. Interest groups may have responded to federal- or state-based spending. Also, as Buchanan and Tullock (1962) suggest, groups may both pursue and advocate for spending on selective benefits. The percentage of overall spending earmarked for selective benefits may differ across states such that overall spending fails to predict group mobilization in some states but does predict it in others. It is unknown just what percentages of state budgets are spent on selective benefits, and many goods provided by governments may not be clearly classified as either selective or collective benefits (Jacoby and Schneider 2009). A second explanation for the inconsistent findings is that different guilds or sectors of groups may lobby in response to spending in particular policy domains (as in Gray et al. 2005). This explanation is like Buchanan and Tullock’s (1962) narrative but suggests that different guilds may enter and exit the lobbying environment at different times. Given enough entry and exit in the groups that lobby, overall interest populations may increase as government spends more money, but the composition of groups may change drastically from one year to the next. Additional sources of data and coding of interest groups are needed to parse these alternative explanations.
It remains to be seen if growth in interest populations is partly due to association splintering. Organizations with similar interests, particularly businesses, often lobby together as members of associations (Lowery et al. 2012, 25). Prominent examples include chambers of commerce and manufacturing associations. These groups may lose member organizations as lawmaking or spending become more specific or grow in volume. As government activities affect the separate interests of institutions differently, some have more reason to part with their generalist associations and either join niche associations or lobby independently. Such association splintering likely explains only a small portion of growth in interest populations, however, given that large states house many niche associations (Lowery et al. 2012). Growth in interest populations is likely being driven instead by new organizations mobilizing and hiring lobbyists for the first time (see Drutman 2015; Gray and Lowery 2001).
Given that state registration documents are the oldest regularly collected sources of lobby data available, they can be used to answer additional questions about interest mobilization. Lobby records from the Progressive Era may interest those studying the development of party or group politics in America. The kinds of lobbyists hired over time might have also changed with groups relying more often on multiclient contractors (Drutman 2015). It may also be the case that as state governments expand and more interests lobby, there may be a snowballing effect among interests. In this perspective, lobbying is akin to a collective action problem in which groups seek to compete with other groups and either preserve benefits or protect themselves from unfavorable policies (Lowery 2007). Some have suggested that interest groups slow down lawmaking processes and policy innovation (Rauch 1994). It remains to be seen if the new corps of interests in the states undermine the provision of public goods or slow economic growth.
Supplemental Material
sj-pdf-1-prq-10.1177_1065912920975490 – Supplemental material for A Quiet Revolution in State Lobbying: Government Growth and Interest Populations
Supplemental material, sj-pdf-1-prq-10.1177_1065912920975490 for A Quiet Revolution in State Lobbying: Government Growth and Interest Populations by James M. Strickland in Political Research Quarterly
Footnotes
Acknowledgements
The author thanks Jesse Crosson, Ingrid Grosse, Michael Heaney, Thomas Holyoke, Adam Newmark, Jason Roberts, Trevor Rubenzer, Alixandra Yanus, and three anonymous reviewers for providing invaluable feedback on drafts of this article.
Declaration of Conflicting Interests
The author declared no potential conflicts of interest with respect to the research, authorship, and/or publication of this article.
Funding
The author(s) disclosed receipt of the following financial support for the research, authorship, and/or publication of this article: The author received financial support from the University of Michigan Rackham Graduate School, Arizona State University School of Politics and Global Studies, and Institute for Humane Studies for the research, authorship, and/or publication of this article.
Supplemental Material
The data and materials required to verify the computational reproducibility of the results, procedures, and analyses in this article are available on the James Strickland Dataverse within the Harvard Dataverse Network, at:  . Supplemental materials for this article are available with the manuscript on the Political Research Quarterly (PRQ) website.
Notes
References
Supplementary Material
Please find the following supplemental material available below.
For Open Access articles published under a Creative Commons License, all supplemental material carries the same license as the article it is associated with.
For non-Open Access articles published, all supplemental material carries a non-exclusive license, and permission requests for re-use of supplemental material or any part of supplemental material shall be sent directly to the copyright owner as specified in the copyright notice associated with the article.
