
Abstract
This research addresses a challenge within cross-national surveys of salespeople and sales managers: systematic differences between respondents from different countries in their interpretation of response categories associated with survey items measuring a construct of interest. As a result of these discrepancies in interpretation, analyses based on uncorrected survey responses may yield misleading results. The authors mathematically demonstrate the issue and then, drawing on the literature in education and political science, demonstrate a potential solution, the use of anchoring vignettes, which possesses substantial appeal in contexts where a researcher is interested in comparing construct means across contexts where intergroup differences would otherwise make such comparisons problematic. The authors use the proposed method on data from a cross-national survey of 1,051 salespeople and 163 sales managers across three countries (Brazil, Japan, and the United Kingdom) to evaluate self-assessments and upward assessments of a sales manager's drive. The findings highlight the importance of correcting for systematic differences in survey responses driven by cross-national differences, especially when the goal is to compare construct means. Further, the authors demonstrate the value of anchoring vignettes concerning several analytical goals relevant to academics and practitioners.
In international studies, researchers often need to compare groups of individuals from different countries on constructs most appropriately measured through surveys. Even when explicit comparisons are not conducted, these researchers require respondents across countries to understand their construct measures and use the response categories associated with them in the same way for conclusions drawn from their analyses to be valid (e.g., Steenkamp and Baumgartner 1998). Although not limited to international sales research, cross-country comparative analyses are often important in sales research and practice. Recent sales literature indicates the need to examine similarities and differences across countries and cultures in sales force characteristics and activities and the importance of linking these factors to relevant outcomes (e.g., Baldauf and Lee 2011).
In this article, we introduce anchoring vignettes (e.g., King et al. 2004; Kristensen and Johansson 2008) to the literature in selling and sales management to address contexts where a researcher is interested in comparing construct means across different countries through surveys. From a high level, anchoring vignettes allow a researcher to directly measure and correct for incomparability in how a respondent interprets and uses response categories associated with a construct by asking respondents to rate depictions of fictional individuals with varying levels of that construct. We provide greater details of how this works subsequently in the article.
Surveys are used to study diverse phenomena, leveraging samples of salespeople and sales managers spanning multiple countries. The substantive topics examined include sales force recruitment (e.g., Rouziès, Segalla, and Weitz 2002), training (e.g., Honeycutt, Siguaw, and Hunt 1995), compensation and control systems (e.g., Piercy, Low, and Cravens 2004; Segalla et al. 2006), and others. Table 1 provides an illustrative sample of these research endeavors. These studies primarily focus on examining relationships between constructs, with varying measures taken to explore (or account for) country-level differences in relationships between constructs. These studies typically either argue for comparability of the underlying features of their construct measures based on the design of their studies or formally examine this assumption using statistical approaches.
Illustrative Sample of Empirical International Sales Research Using Cross-Sectional Surveys and Multiple Countries.

For those studies where assumptions of cross-country comparability of construct measures are examined within the data collected, it is uncommon for these efforts to include a formal examination of the assumptions required for construct means to be comparable across countries. The absence of proof supporting the assumption of cross-country comparability of construct means is not a direct challenge to the validity of many of these studies’ main findings, given their interest in examining relationships between constructs (e.g., De Carlo, Agrawal, and Vyas 2007; Honeycutt, Siguaw, and Hunt 1995; Piercy, Low, and Cravens 2004). However, it limits the potential insights researchers can obtain from these studies concerning cross-country differences in construct means. International sales studies commonly include salespeople representing many firms and industries within each studied country, a nice feature that points to their potential to offer generalizable insights that could inspire future research by including meaningful cross-country comparisons of constructs. Concerning this last point, several of these studies report univariate statistics by country for their constructs (e.g., De Carlo, Agrawal, and Vyas 2007; Honeycutt, Siguaw, and Hunt 1995; Piercy, Low, and Cravens 2004). However, without formal tests of the required assumptions undertaken (or steps taken to correct issues of cross-country incomparability of these measures), it is unclear what substantive conclusions can be drawn from any similarities or differences shown for univariate statistics (e.g., means) associated with each country in such studies.
Many international sales studies that do not compare construct means across countries (and do not report univariate statistics by country) examine constructs for which it would be interesting for sales researchers to know whether they vary in levels across countries. For example, Honeycutt, Siguaw, and Hunt (1995) measure American and Taiwanese salespeople's customer orientations as part of their study, and Piercy, Low, and Cravens (2004) measure sales managers’ use of behavior controls across Malaysia, Greece, and India. The ability to provide this kind of knowledge could, for instance, motivate research aiming to explain the theoretical sources of this type of variation. To summarize, a review of this literature leads us to the position that a lack of a tool that can be proactively implemented to correct for potential differences in interpretation of survey items across different countries presents a challenge to generating new knowledge within the international selling and sales management domain.
In practice, sales organizations invest substantially in efforts to identify, develop, and reward sales talent (e.g., Chung and Naryandas 2017; Wiseman et al. 2022). For instance, this investment is estimated to be upward of $800 billion annually in the United States alone (Pourmasoudi et al. 2022). Central to a global sales organization's efforts to identify, develop, and motivate sales force members is the ability to effectively assess the members on constructs of relevance to job performance. A key challenge when engaging in these types of exercises is determining whether the responses obtained across the national markets comprising a firm's global sales force are comparable. If the responses are not comparable, then critical resources may be misallocated across the sales force in each market as leaders misidentify which markets (1) require greater investments in training and development to improve on specific competencies of importance, (2) require adjustments to incentive programs or control systems to motivate salespeople to engage to a greater degree in desirable behaviors, and (3) require greater investments in hiring to bring in more members who possess desired levels of critical traits. For instance, differences across countries in the interpretation of the degree to which an employee who is a strong communicator engages in specific behaviors could lead to the false conclusion that, on average, sales managers within one national market are stronger communicators (according to the firm's definition of communication skills) than sales managers within another. Importantly, this type of issue can be effectively addressed through anchoring vignettes. The ability to address this issue is especially important in today's selling world, where sales force management entails managing salespeople from various countries worldwide.
From a methodological standpoint, to compare groups of people in terms of their level on a specific construct or to examine whether two constructs are differentially related to each other across groups of people, a researcher must assume that the numerical values being examined are on the same measurement scale for each group (Drasgow 1984; Reise, Widaman, and Pugh 1993). This assumption is commonly referred to as measurement invariance, and there is a large body of literature on testing for measurement invariance (e.g., Baumgartner and Steenkamp 2001; Milfont and Fischer 2010; Schmitt and Kuljanin 2008; Steenkamp and Baumgartner 1998; Van de Vijver and Leung 2021). If measurement invariance holds, cross-country analyses assessing the relationships between constructs and comparing the means of constructs are valid.
Measurement invariance operates at several levels (for a detailed assessment of these levels, see Steenkamp and Baumgartner [1998]). We primarily focus on contexts where the assumption of scalar invariance (one level of measurement invariance) plays a critical role in drawing meaningful conclusions from data. Scalar invariance refers to the equality of the item intercepts of a focal construct across those groups for which a researcher is interested in making comparisons. As noted by Steenkamp and Baumgartner (1998, p. 80), “scalar invariance implies that cross-national differences in the means of the observed items are due to differences in the means of the underlying construct(s).”
When a construct does not demonstrate full scalar invariance, then a researcher requires a marker item within the focal construct and at least one other item within it to exhibit invariant factor loadings and invariant intercepts to derive substantive meaning from a cross-country comparison of means for the focal construct (e.g., Steenkamp and Baumgartner 1998). In the absence of these conditions, cross-country comparisons of traits and competencies captured within a questionnaire will be invalid, limiting a sales organization's ability to engage in various strategic decisions (e.g., more macro strategic decisions at the country level related to training, hiring, rewarding, and promoting) using the information gathered. Even if the minimum required conditions are met for partial scalar invariance (i.e., two items within a construct demonstrate invariance in their factor loadings and intercepts), cross-country comparisons of construct means are less reliably estimated as the number of invariant items within a construct increases (Chen 2008; Steenkamp and Baumgartner 1998; Steenkamp and Maydeu-Olivares 2021; Steinmetz 2013). We introduce anchoring vignettes to the selling and sales management literature as a way of enabling cross-country comparisons in settings where a researcher suspects that most items associated with at least one construct of interest vary systematically depending on how respondents from different countries interpret (and use) the response categories associated with that construct.
In addition, to the best of our knowledge, the selling and sales management literature has not empirically examined the value of addressing violations of scalar invariance in contexts where respondents are providing assessments for themselves and others (e.g., upward and downward assessments). For instance, a large sales organization may have salespeople evaluate their sales managers on specific capabilities and have sales managers evaluate themselves on those same capabilities. In contexts where employees are evaluating managers and managers are evaluating themselves (just as one example), correcting issues of cross-country incomparability in survey responses occurring at multiple levels is important. Addressing this issue enables researchers to consider more nuanced dynamics within a sales organization and describe how these dynamics differ across different countries and cultures. We demonstrate the efficacy of anchoring vignettes for selling and sales management research that involves self-assessments and upward assessments using a measure of a sales manager's drive for illustration. We define the construct of sales manager drive as an individual's desire for success concerning career progression and job effectiveness. Although anchoring vignettes are used in survey research (e.g., Grol-Prokopczyk, Freese, and Hauser 2011; King et al. 2004; Kristensen and Johansson 2008), prior research does not apply them in a context that involves assessments of self and others (see Table 2).
A Sample of Past Research Using Anchoring Vignettes.

In the following sections, we first explain the issue in more detail. In the next section, we formally discuss anchoring vignettes and how they can be productively employed. After that, we report the results of implementing anchoring vignettes in a cross-national survey, focusing on a measure of a sales manager's drive for illustration. Finally, we conclude by describing the theoretical and managerial implications of using anchoring vignettes. In conjunction with this discussion, we provide guidance to selling and sales management researchers concerning when and how to implement this approach in their research.
Formal Explanation of the Issue
Large, cross-national surveys are a fundamental tool for researchers in marketing (e.g., measuring global brand equity by Hsieh [2004], studying interdependence of channel members and distributor attitudes by Kim [2003], and investigating fresh-start mindset by Strizhakova, Coulter, and Price [2021]) and in sales (e.g., studying the transformation of sales by Guenzi and Habel [2020], investigating incentive sales compensation by Segalla et al. [2006]). Nevertheless, people from different countries, and even respondents within the same country, can have diverse interpretations of the same survey questions (King et al. 2004; Steenkamp and Baumgartner 1998). This may be especially true for selling and sales management constructs, such as a sales manager's drive, conscientiousness, or communication skills.
A person who has a high level of conscientiousness to one respondent could be a person with low conscientiousness to another. As a result, the conclusions generated from survey questions used in varied populations are jeopardized by this interpersonal incomparability (which can also be thought of as a form of scale variance). A large portion of this incomparability is often associated with differences operating at the country level (i.e., what we term “intergroup incomparability”). Drawing on previous literature (e.g., Holland and Wainer 2012; Hopkins and King 2010), we define a survey question as having interpersonal incomparability if two individuals with the same underlying quantity of interest have unequal probabilities of providing the same answer intended to measure that underlying quantity of interest. Intergroup disparities in survey responses that appear to be meaningful could be due to differences in how groups view the response categories used to measure a given construct. In addition, no disparities might be detected within a survey response when there is, in fact, a significant difference in the underlying perceptions across groups.
For exposition, we use a running example of measurement of a sales manager's drive to explain the underlying issue associated with country-specific intergroup incomparability and how the use of anchoring vignettes offers a feasible solution for such issues. Imagine two groups of sales managers, in Country A and Country B, whom we want to assess in terms of their level of a particular construct, drive. These sales managers are identical in terms of their level of drive but differ in their interpretation of the survey questions used to measure the construct of drive. For instance, imagine that the sales managers in Country A generally indicate that a sales manager who works through all hours of the night is worthy of a 6 (on a scale from 1 to 7, where 7 represents the highest level) on a survey question measuring drive. In contrast, the sales managers in Country B generally indicate that the same sales manager is worthy of a 4 on the same survey question intended to measure drive. Our goal in this example is to measure the construct of drive to see which group is more driven. Put formally, by assuming a country-specific constant effect that captures the difference in interpretation of the survey question's response categories for Country A and Country B, measured drive in each group consists of the following:
Similarly, for Country B, we can write the following:
As a result, we can simplify the comparison between the measured drive in both groups as follows:

If sales managers in Country A respond to the questions about drive differently from sales managers in Country B (e.g., on the basis of their cultural background), the difference between the means of the measures of the two groups is
Although we focus on sales managers in the preceding example, we could easily have presented this example in terms of salespeople, and the same insights would apply. Next, we briefly summarize anchoring vignettes and how they help address intergroup incomparability.
Anchoring Vignettes
Anchoring vignettes have been implemented in recent research projects in several countries to understand how respondents across countries compare on different constructs. Such settings include the World Health Organization's World Health Survey, health studies (see, e.g., Salomon, Tandon, and Murray 2004), personality studies (see, e.g., Weiss and Roberts 2018), politics and government (King et al. 2004), the Wisconsin Longitudinal Study (Grol-Prokopczyk, Freese, and Hauser 2011), job satisfaction studies (Kristensen and Johansson 2008), and the World Bank (e.g., Beegle, Himelein, and Ravallion 2009).
Anchoring vignettes can address the problem of intergroup incomparability caused by systematic group-based variations in the interpretation of response categories associated with survey questions intended to measure different constructs. A vignette describes the content of a hypothetical scenario. For example, Table 3 shows three vignettes describing hypothetical sales managers with different levels of drive.
Description of Vignettes Used for Drive Construct.

Each respondent is presented with a different vignette (alternatively, respondents can be presented with each vignette or a subset greater than one). For each vignette, the respondent is asked to rate that scenario using one or more items measured on a Likert scale. For example, the respondent is asked to rate a sales manager's drive after reading about the hypothetical scenario by responding to a set of items that measure the construct (the full set of items used to measure this construct is included in Appendix A). To continue with this example, consider the following item on a seven-point scale (1 = “Strongly disagree,” and 7 = “Strongly agree”): This sales manager has a strong desire to achieve at a level beyond what most others aspire to.
If the vignette has the same response categories as the corresponding self-assessment (or upward assessment) question, the responses to the vignette provide a shared reference point that allows researchers to rescale the original response. For instance, if a sales manager indicates being very driven but gives a high score to the “Low” scenario, we can infer that this sales manager might not actually be that driven.
The key idea here is to measure the incomparability of responses to survey questions directly and then correct it. In a somewhat simplified sense, we are trying to obtain measures for the country-specific constant effects (i.e., from the prior section, CA, CB) from the prior section's example to remove them from the underlying equations of sales manager drive (for each country). In doing so, we can obtain a measure that allows cross-country comparison for the associated sales managers.
The most basic method of analyzing anchoring vignette data formalizes the logic employed in the example from the prior section. That is, each individual's vignette responses for the focal construct are compared with the self-assessment for that same construct (King et al. 2004). When just one vignette is provided, a nonparametric measure is constructed, indicating whether the respondent’s self-assessment is at a level greater than, equal to, or lower than the level at which the respondent placed the person in the vignette. Correspondingly, this nonparametric measure would take on a value of 3, 2, or 1, respectively. This nonparametric measure can be viewed as ordinal, enabling comparisons of a focal construct that give a clearer picture of the degree to which one respondent possesses higher levels of that construct.
This procedure can be applied for as many vignettes as desired, with a greater degree of discrimination achieved by using a larger number of anchoring vignettes (King et al. 2004; King and Wand 2007). That said, the benefits will likely diminish as the number of vignettes employed increases. When there are two vignettes (one representing a higher level of the focal construct and another representing a lower level of the focal construct), the nonparametric measure can take on up to five values (i.e., 5, 4, 3, 2, and 1), depending on where the self-assessment score for the focal construct is positioned relative to the respondent's scores for each of the two vignettes. For instance, if a respondent's self-assessment score is between the scores the respondent provided for the two vignettes, the nonparametric measure would take on a value of 3. If the respondent’s self-assessment score were instead higher than what the respondent provided for the vignette representing the higher level of the construct, then the nonparametric measure would take on a value of 5.
This approach converts a self-assessment and J vignettes measuring a construct into 2J + 1 ordinal categories that are comparable across individuals. To formalize this, let 
A simpler method can be used if the goal is to correct only for country-level differences rather than individual differences. In this alternative method, averages of each vignette for each country can be calculated instead of correcting for individual differences using individual vignettes. That is, let 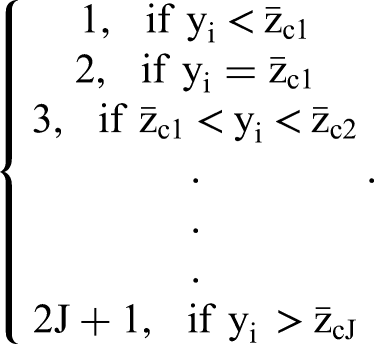
The advantage of this method is that the researcher is not required to administer all vignettes associated with a construct to all respondents. To elaborate, the researcher can infer the averages for each anchoring vignette in each country by randomly assigning a subset of the anchoring vignettes associated with a construct to respondents within each country. In conjunction with this approach (or as an alternative), the researcher could randomly assign a subset of respondents in each country to see some or all of the anchoring vignettes associated with a construct (i.e., through this approach, a subset of respondents would not see any anchoring vignettes). In either case, the researcher should consider the potential precision of the averages obtained for anchoring vignettes in each country resulting from using one or both approaches. In the following section, we illustrate how the first approach (i.e., randomly assigning all respondents to see a subset of anchoring vignettes associated with a construct) can be employed with international sales data.
Example of Implementing Anchoring Vignettes in Sales Research
Institutional Background and Data
The data used for this analysis come from a multinational pharmaceutical firm that operates across a range of countries, in both the developed and developing world. The focal firm employs a large sales force to market its products to medical professionals (e.g., physicians). For this study, leadership within three of the focal firm's markets (i.e., countries) collaborated with the research team to assess their first-line sales managers on a set of traits and competencies widely viewed as important for leading and managing salespeople. The three countries were Brazil, Japan, and the United Kingdom. In total, 1,051 salespeople reporting to 163 first-line sales managers participated in the survey, giving us a response rate across the three countries of about 83% and 95%, respectively. The response rate for salespeople by country was about 72% for Brazil, 95% for Japan, and 74% for the United Kingdom. The response rate for sales managers by country was about 88% for Brazil, 100% for Japan, and 96% for the United Kingdom. The high response rates across these countries help increase our confidence in the degree to which our subsequent analyses represent the focal firm's sales force in each country, bolstering our confidence in the validity of the comparisons made for the focal firm.
Leadership within each of the focal firm's participating markets wanted to examine how their first-line sales managers compared within each market and across markets. Cross-market comparisons of traits and competencies (which can be conceived of as more malleable) would help the global sales organization identify richer opportunities for improvement concerning sales managers’ hiring, promotion, incentivization, and training. This desire motivated the research team to propose the use of anchoring vignettes as a means of enabling cross-country comparisons. In this context, anchoring vignettes play a critical role relative to other methods of addressing measurement invariance. This is because they allow the researcher to obtain levels of an underlying construct that allows for meaningful comparisons across countries. As illustrated in the following sections, incorporating anchoring vignettes into the data collection effort proved to be a prudent decision.
Participants were randomly given one of the three anchoring vignettes associated with a sales manager's drive (Table 3) to enable the research team to gather information on the degree to which country-level differences influenced the interpretation of the response categories associated with this construct. Both salespeople and sales managers were asked to rate the level of drive of a fictional sales manager who varied in her level of drive (as described in the corresponding vignette). We used these responses to calculate the within-country averages for each anchoring vignette. We then used these averages to construct a nonparametric measure of drive by comparing a given respondent's uncorrected score on the drive measure (an average of the three items measuring this construct; Appendix A details the specific items) to their country's averages for each of the three anchoring vignettes. The previous section titled “Anchoring Vignettes” offers a formal explanation of this procedure.
Given the primary goal of this research (i.e., to illustrate the application of anchoring vignettes in a sales context that involves both self-assessments and upward assessments of sales managers), a detailing of the full procedure associated with this data collection effort is out of scope. Still, it is helpful to discuss one important detail for any cross-national survey effort where the primary language spoken varies. Specifically, after developing the initial survey (including the anchoring vignettes) in English, we employed a translation service provider to translate our survey into the other required languages (i.e., Japanese, Portuguese, and Spanish). After that, we had colleagues who are both fluent in English and native speakers of one of the respective languages compare the relevant translated versions to the English version to examine whether the translations materially changed the meaning of any elements of the measurement instruments within the survey (and provide notes if so).
First Examination: Between-Group Comparison (Example: Upward Assessment)
To study this method, we included the questions on drive described previously in a survey of three different countries, Brazil (353 salespeople), Japan (573 salespeople), and the United Kingdom (125 salespeople). As noted previously, salesperson response rates within each country were above 70%. Salespeople in these countries were asked to rate their sales manager on drive. Later in the survey, they were presented with the vignettes and asked to rate a hypothetical sales manager on drive. We include the items used to measure sales manager drive in Appendix A. The raw results are depicted in Figure 1.

Measured (Uncorrected) Versus Corrected Averages for Drive (Salesperson Upward Assessments) by Country.
As one can see, salespeople from the United Kingdom view their sales managers as possessing the highest level of drive (6.46), followed by Brazil (5.89). Japanese salespeople seem to view their sales managers as possessing the lowest level of drive (5.71). However, when looking at the vignettes, we see that Japanese salespeople give lower ratings across vignettes than other countries (see Table 4).
Average Vignette Scores by Country.

Given our use of three anchoring vignettes for the construct of drive, we construct a nonparametric measure that can take on one of seven different values. This nonparametric measure's exact value for a given salesperson depends on where the upward assessment of the sales manager's drive is positioned relative to the averages for each vignette associated with the salesperson’s country. We average the scores associated with a given anchoring vignette for each country, given our focus on addressing issues of incomparability at the country level. After correcting for the intergroup incomparability biases using the nonparametric method previously explained (see the section titled “Anchoring Vignettes”), we find that the ordering of construct means by country changes (see Figure 1). Salespeople from the United Kingdom still view their sales managers as having the highest level of drive (4.6), but they are now followed closely by Japan (4.41). In our empirical context, salespeople in Brazil view their sales managers as having the lowest drive (2.93). The constant 1.3 has been added to the bars in Figure 1 to make Japan the baseline and ease comparability (e.g., we added 1.3 to the corrected value for Japan of 4.41 to arrive at the value of 5.71 shown in Figure 1).
Second Examination: Self-Assessment
We also asked the first-line sales managers to rate themselves on drive to evaluate this method in self-assessments, correcting them using the country averages captured within the anchoring vignettes (i.e., we follow the same procedure as in the first examination described in the previous section). As mentioned previously, the sales managers are from Brazil (57 sales managers), Japan (82 sales managers), and the United Kingdom (24 sales managers). The raw results are depicted in Figure 2. As one can see, sales managers from the United Kingdom rated themselves as having the highest level of drive (6.43), followed by Brazil (6.32). As in the prior examination, Japanese sales managers rated themselves as having the lowest drive (5.82).

Measured (Uncorrected) Versus Corrected Averages for Drive (Sales Manager Self-Assessments) by Country.
After correcting for these biases using the method explained previously, we find that the order of construct means changes again (see Figure 2). Sales managers from Japan (4.44) are tied with sales managers from the United Kingdom (4.44) for the highest level of drive, with sales managers in Brazil rating themselves as having the lowest level of drive (4.25) in this empirical context. The constant 1.38 has been added to the bars in Figure 2 to make Japan the baseline and ease comparability (e.g., we added 1.38 to the corrected value for Japan of 4.44 to arrive at the value of 5.82 shown in Figure 2).
Third Examination: Testing Against an Objective Variable
Finally, we wanted to see how the method helps against an objective variable. To evaluate this method against an objective variable, we used data from salespeople's evaluations of their sales managers’ drive in the sample mentioned previously. For this examination, our objective measure is the average number of hours a sales manager works per week.
To establish the convergent validity of our measure, we ran a correlation of weekly hours worked over both the measured assessment of drive and the corrected measure of drive using anchoring vignettes. Results are shown in Table 5. Without correcting for cross-country bias, one can see a negative (correlation: −.16) and statistically significant (p < .05) relationship between a sales manager's drive and the number of hours salespeople work. This result seems surprising and does not make much sense considering that a more driven sales manager is likely one who works harder in pursuit of goals. At a minimum, we would not expect higher levels of drive to be associated with working fewer hours per week on average (and we note that this same pattern of results held when we ran a regression using as the outcome measure the average number of hours per week worked by salespeople reporting to a given manager). After correction of the original measure of sales managers’ drive using anchoring vignettes, a positive (correlation: .05) but statistically insignificant (p > .6) relationship between a sales manager's drive and the number of hours salespeople work appears.
Relationship Between Sales Manager's Drive (Uncorrected and Corrected) and Hours Worked.

Discussion
Our findings show that creating anchoring vignettes to adjust responses to survey items is feasible and valuable. Crucially, we illustrate how failing to account for intergroup incomparability associated with the response categories associated with a construct's measure can lead to erroneous research findings, including estimation of differences in construct means between groups and estimation of an effect's strength, including reversal of its sign. For sales researchers, anchoring vignettes can serve as a remedy when one or more of the research questions posed in a study involves assessing the average levels of constructs of interest across countries (or other groups) in the presence of systematic group-based differences in the interpretation of response categories associated with survey questions. For sales practitioners, anchoring vignettes can serve as a valuable tool when managers are interested in assessing how members of their sales force compare on traits, competencies, and behaviors of importance where comparisons are being made at the country level (e.g., to support higher-level resource allocation decisions). As we discuss next, anchoring vignettes can be applied to address survey response incomparability factors that are likely to vary within sales teams (e.g., differences in demographic characteristics such as an individual's gender, age, or educational background).
In this article, we focus our discussion and empirical illustration on addressing issues of incomparability associated with country-level differences. However, this method can address differences in how respondents interpret a survey question's response categories that go beyond this factor. Although research points to a substantial source of interpersonal comparability occurring at the country level, other sources of interpersonal incomparability could be important to account for. These could include differences based on age, gender, prior work experience, or other factors. When respondents rate fictional individuals described in anchoring vignettes, researchers can use the respondents’ scores to examine the main sources of interpersonal incomparability in an empirical setting. For instance, it could be that salespeople with a lot of prior experience come to have higher standards regarding what a more driven manager looks like. This could lead these more experienced salespeople to provide relatively lower scores on a measure of drive than the scores provided by their relatively less experienced peers reporting to a different sales manager. Such a dynamic could obfuscate a researcher's ability to assess how relatively driven each of the associated sales managers is. To empirically test for prior sales experience as a source of interpersonal incomparability, a researcher could regress the scores provided by each salesperson on an anchoring vignette depicting a relatively driven sales manager on a variable capturing a salesperson's prior experience. Finding a statistically significant relationship between these variables would suggest that prior sales experience is a source of interpersonal incomparability among salespeople.
From an international sales research perspective, it could be valuable to investigate when sources of interpersonal incomparability related to a salesperson's (or sales manager's) characteristics vary in their influence depending on the country they are from. Building on the prior example involving sales manager drive and a salesperson's prior experience, we might theorize that ideas of what age and experience mean within a given country influence the degree to which prior work experience is a source of interpersonal incomparability. In this case, a researcher might test this hypothesis by regressing the scores provided by each salesperson on an anchoring vignette depicting a relatively driven sales manager on an interaction term capturing a salesperson's prior experience and the country they are from (along with variables capturing the corresponding lower-order terms). Finding a statistically significant result for the interaction term would suggest that the degree to which prior sales experience is a source of interpersonal incomparability varies depending on the salesperson's country.
Although the literature provides effective solutions that researchers commonly apply to address issues related to measurement variance when examining the relationship between constructs (e.g., Steenkamp and Baumgartner 1998), anchoring vignettes provide an additional way to solve this problem that may be particularly useful in some contexts. Specifically, anchoring vignettes can be a useful tool to identify valid relationships between constructs in those instances where (1) a given construct is affected by interpersonal (or intergroup) incomparability and (2) the associated source of incomparability in responses is correlated with another construct. Correcting for the source of incomparability in the affected construct(s) in these instances can help address the bias arising from such statistical factors. It can also allow the researcher to retain a larger amount of useful variation in the associated variables than they would if they had to rely on some other solutions. For instance, in those cases where the source of incomparability resides at the country level, the inclusion of country-specific fixed effects may help address the underlying statistical issue but require the researcher to rely only on the within-country variation in the associated variables. Alternatively, country-specific random effects may help address the underlying statistical issue but require the researcher to rely on a weighted average of the within- and between-country variation that is based on statistical relationships in the data that go beyond the intergroup incomparability issue that the researcher is trying to address.
Guidance for Research on International Selling and Sales Management
Anchoring vignettes are well suited for contexts where a researcher is interested in comparing the means of constructs and is concerned with the cross-country comparability of the responses provided. Suppose questions intended to measure a construct of interest and the response categories associated with them can be designed or implemented to avoid issues of cross-country comparability (or other sources of interpersonal incomparability, for that matter). This position is sometimes taken by sales researchers, who argue that features of the measures they use or the cross-country samples they study make this assumption reasonable (e.g., see Table 1). In that case, there would be no need for anchoring vignettes or other corrective measures. Unfortunately, it is difficult to achieve this goal when measuring many of the constructs that social science researchers are interested in (King et al. 2004 provide some further reflection and discussion on this point). In addition, it is difficult to gauge whether such a construct would exhibit this property before a survey is launched and data are collected.
If a researcher includes anchoring vignettes to measure one or more constructs of interest, and the scores obtained from them vary systematically across countries (e.g., according to statistical tests comparing averages by countries), we encourage the researcher to incorporate anchoring vignettes into their analysis of the associated constructs. We recognize that this recommendation assumes that a researcher has already invested valuable resources (e.g., time) to implement this approach. In the following paragraphs, we provide some information and guidance to help researchers decide whether to invest in the implementation of anchoring vignettes in their research projects. In addition, we discuss a potential option that a researcher might consider should they realize that they would benefit from anchoring vignettes after their primary data collection has been completed. We discuss practical considerations for designing, implementing, and assessing anchoring vignettes in Appendix B.
Determining When to Use Anchoring Vignettes
The source of cross-country incomparability addressed in this research through anchoring vignettes fits within the broader concept of scalar invariance (a specific level of measurement invariance). The assumption of scalar invariance (see, e.g., Steenkamp and Baumgartner 1998) is required to compare construct means across different countries meaningfully. The marketing literature identifies ways of assessing scalar invariance and addressing violations. In this regard, multigroup confirmatory factor analysis is the most widely accepted approach to address it (Steenkamp and Maydeu-Olivares 2021). In recent years, this approach has been expanded to incorporate a random intercept into the model, intended to address common method variance that may vary across countries (Steenkamp and Maydeu-Olivares 2021). In either case, these methods hinge on evidence supporting scalar invariance (partial or full). Steenkamp and Baumgartner (1998) indicate that the minimum conditions required to make meaningful comparisons of means across countries include that a marker item and at least one other item within a construct exhibit invariant factor loadings and invariant intercepts. In a review of the measurement invariance literature, Putnick and Bornstein (2016) note that specific evidence-based guidance on the number or proportion of items that should be invariant seems to be missing from the literature. In addition, some studies demonstrate that as the proportion of items within a construct that are allowed to be noninvariant increases, so does the bias in means obtained for associated constructs (e.g., Chen 2008; Steinmetz 2013).
Considering the preceding points, we offer guidance on situations in which a researcher should consider implementing anchoring vignettes for relevant constructs of interest:
At least one construct of interest for which the researcher is interested in comparing means across countries needs to be measured using a single item (e.g., if the organization that the researcher has partnered with has placed constraints on the length of the survey to be employed). A researcher might also consider the more limited degrees of freedom they have if a construct of interest is measured using only two items. We note this given the inability to relax the invariance constraints on these intercepts (since the invariance of these two items is the minimum condition required to compare means across countries for this construct). The assumption of full or partial scalar invariance across countries seems unlikely to hold for the sample from which data will be collected. In this regard, a researcher might consider consulting the literature to assess whether evidence suggesting scalar invariance has been found (or, conversely, has been refuted) in studies measuring the same constructs the researcher plans to measure (or similar constructs). In addition, the researcher should consider whether scalar invariance has been found for respondents in the same countries as those the researcher plans to survey (or in similar countries). Concerning the assessment of similarity of countries, a researcher might consider linguistic, economic, and cultural factors when determining the degree of similarity of countries where assessments of scalar invariance have been conducted. Statistical analyses testing the assumption of full or partial scalar invariance suggest that these assumptions do not hold (for additional details on these tests, see Steenkamp and Baumgartner [1998] and Steenkamp and Maydeu-Olivares [2021]). Beyond the absolute minimum degree of feasibility, there are no exact recommendations concerning how many intercepts of items within a construct (or factor for multidimensional constructs) should be invariant across countries to make meaningful comparisons of construct means. Steenkamp and Baumgartner (1998, pp. 81–82) note that “ideally, a majority of factor loadings and intercepts will be invariant across countries because in that case the latent means are estimated more reliably (i.e., they are based on many cross-nationally comparable items) and differences in latent means succinctly summarize the pattern of differences in observed means across countries.”
In those cases where a researcher has collected data already and found evidence that one or more constructs (for which they wish to compare means) do not support an acceptable degree of scalar invariance, they might consider conducting a follow-up data collection including anchoring vignettes for the affected constructs. This follow-up data collection could use a sample of respondents that can be theoretically argued to be representative of the sample from which the data were originally collected. In a sales context, this could be a random sample of the original cross-country sales force surveyed or a set of salespeople across the same countries as the original data collection that can be argued to be similar to the original salespeople. In either case, the researcher will need to make assumptions about the comparability of respondents (and ideally provide strong arguments and evidence in support of those assumptions). However, such an approach may be a useful way of remedying the issue, and investigating how to take such an approach effectively could be a valuable effort for future researchers.
Conclusion
In this article, we discuss an issue common to cross-national research in selling and sales management. We introduce a potential remedy that has been successfully applied in some other fields outside of marketing (i.e., anchoring vignettes). We focus primarily on the value of this approach in addressing issues of interpersonal incomparability related to the country a respondent is from and touch on the broader value of this approach in dealing with other sources of interpersonal incomparability. Through our empirical example, we highlight the value of this approach for both sales researchers and practitioners.
In our empirical context, we demonstrate that conclusions concerning how each country's sales managers ranked on drive would have been incorrect if anchoring vignettes had not been used to account for intergroup incomparability. The high response rate across these countries helps increase our confidence in the degree to which our subsequent analyses are representative of the firm's sales force in each country included. This was a point of practical importance for the firm, given the interest that leadership within each country had in comparing the average drive of their sales managers to see which country had a more driven group.
It is worth noting that the number of respondents in each country surveyed as part of our empirical context varied substantially. This cross-country variation in the number of respondents was due to differences in the focal firm's sales force size within each country. This is not a problem per se, but it does call attention to a potential limitation of our empirical illustration that is useful for researchers to keep in mind when implementing anchoring vignettes in a similar manner. The parameters we estimated using the ratings respondents provided on each drive vignette are constructed by averaging the ratings at the country level. Thus, the precision of these estimates is a function of how many respondents within each country rated each vignette. Our empirical illustration using sales manager responses should be viewed in a more tentative light because the number of respondents providing ratings for each drive vignette was relatively low (e.g., about eight ratings per vignette for sales managers from the United Kingdom). The relatively consistent patterns we find across our examination of salesperson upward assessments and sales manager self-assessments give us some confidence in our results. Still, we would encourage researchers to consider recommendations from the literature concerning statistical power when conducting studies featuring anchoring vignettes. For instance, if the number of sales managers in each country being surveyed is relatively small (or response rates are expected to be relatively low), then it may be wise to have every sales manager see every vignette associated with a given construct of interest (or, at least, a larger subset of them).
We hope that researchers and practitioners interested in conducting sales research in international settings will consider anchoring vignettes as a tool for extracting meaningful insights from survey-related efforts involving comparisons spanning countries and varied cultural contexts.
Footnotes
Authors Contributions
All authors contributed equally. Author order was determined by dice roll.
Special Issue Editors
Nawar Chakar, Johannes Habel, Alex Zablah, and Kelly Hewett
Declaration of Conflicting Interests
The author(s) declared no potential conflicts of interest with respect to the research, authorship, and/or publication of this article.
Funding
The author(s) received no financial support for the research, authorship, and/or publication of this article.