
Abstract
The aim of this study was to present the initial validation of a new questionnaire, the Transition to Retirement Questionnaire (TRQ) and to study its relationship with resistance to change and personality dimensions. Based on Schlossberg’s typology of the retired, the TRQ is designed to assess five dimensions related to personal perceptions of transition to retirement, retirement, and personal plans and activities. The sample consisted of 1,054 professionally active or retired adults from the Swiss French-speaking Canton of Vaud. Exploratory principal components and confirmatory factor analyses highlighted a five-factor solution that fit coherently with Schlossberg’s typology. Moreover, TRQ dimensions were related to resistance to change tendencies and personality dimensions. The TRQ seems to be an interesting tool for use in research but also for interventions with young retirees or people preparing for retirement.
Introduction
In the past two or three decades, due to growing life expectancy and the need to manage the associated social constraints, transition to retirement has aroused the interest of an increasing number of researchers (Beehr & Adams, 2003). More specifically, the concepts of “retirement” and “transition from work to retirement” require a redefinition to encompass new forms of these concepts (Beehr & Adams, 2003). However, whether the transition to retirement brings positive or negative outcomes, for example, in terms of subjective well-being, is still a matter of debate, and research to find consistent results remains difficult (e.g., Pinquart & Schindler, 2007; Wang, 2007). Moreover, the focus is mainly on interindividual differences in retirement outcomes, for example, health and activities (Löckenhoff, Terraciano, & Costa, 2009), and there is a lack of research about profiling the retired in a perspective of vocational counseling and in the life span perspective. Recently, Schlossberg (2007) developed a typology of retired persons describing five main paths (i.e., continuers, adventurers, easy gliders, searchers, and retreaters). The main purpose of this study was to develop a questionnaire concerning the representation of transition to retirement based on this typology.
Retirement represents a milestone in adult life, which is frequently associated with changes in everyday activities and routines, finances, social roles, and network (Butterworth, Gill, Rodgers, Anstey, Villamil, & Melzer, 2006; Kim & Moen, 2002; Pinquart & Schindler, 2007). However, the transition to retirement is a relatively recent subject of study. One of the main reasons for its growing interest in recent years is due to changes in the economic context across western societies. These changes have an impact on social security and pensions that will force many baby boomers to continue working after the age at which their parents left the labor force (Besl & Kale, 1996; Hesketh, Griffin, & Loh, 2011) and on the world of work, notably in terms of functioning and professional paths and transitions. For example, as indicated by Beehr, Glazer, Nielson, and Farmer (2000), work and retirement are no longer completely distinct. Moreover, due to growing life expectancy, lifetime as a retired person continues to increase. With regard to the transition from work to retired life and the adjustment to retirement, several aspects were explored in recent years. Focus was placed on factors having an influence on the retirement decision, links between the context and structure of work and the retirement process, and finally, the impact of retirement and preretirement on individual functioning and well-being (e.g., Beehr, Glazer, Nielson, & Farmer, 2000; Donaldson, Earl, & Muratore, 2010; Potocnik, Tordera, & Peiro, 2009). For example, the study by Donaldson and colleagues (2010) has shown that a high sense of mastery and more favorable conditions of retirement (in terms of level of preparation) predicted personal adjustment to retirement more than perceived physical health and income.
Although this has been the subject of extensive empirical study, how and in which direction retirement and transition to retirement impact general functioning and well-being is still an open question (Pinquart & Schindler, 2007; Wang, 2007). Actually, as indicated by Wang (2007), knowledge about predictors of the different retirement transition and adjustment patterns is still limited and previous research findings have been inconsistent until now. Moreover, only a minority of retirees (varying across studies from 10% to 30%) showed a general well-being decline after the transition or reported some problems during retirement (Szinovacz, 2003). Although the retired were generally satisfied with life, some individuals had a poorer adjustment process to retired life. Kim and Moen (2002), in a sample of 458 married men and women, showed that within 2 years following retirement, the transition can be associated with more depressive symptoms especially among men. More recent research illustrates the complexity of studying such transitions and their outcomes. For example, Pinquart and Schindler (2007) used a longitudinal approach assessing life satisfaction before, upon, and after retirement, which meant that they interviewed individuals on average 15 times between 1985 and 2003. The results highlighted three patterns relating to life satisfaction changes. The majority of participants showed a slight and temporary increase of life satisfaction after the transition. The three groups differed, for example, in socioeconomic status, physical health, retirement age, and unemployment before retirement. On this subject, Kim and Moen (2002) underlined the importance of considering the complexity of the transition by examining various resources and contexts surrounding retirement, such as gender, prior level of psychological well-being, spouse’s circumstances, and changes in personal control, marital quality, subjective health, and income adequacy.
With respect to individual differences in terms of retirement adjustment and transition process, the inconsistency of current findings is probably due to the differences in methodology and notably to the methodological weaknesses of cross-sectional designs (Wang, 2007). That is why more recent research (e.g., Löckenhoff et al., 2009; Pinquart & Schindler, 2007; Wang, 2007) has tried to understand the transition by using longitudinal designs in order to reduce complexity and to take retirement in a life course perspective by considering it as a process and not just as an event which affects the subject in later life (Donaldson et al., 2010; Topa, Moriano, Depolo, Alcover, & Morales, 2009). The temporal perspective should definitely be taken into account in order to more accurately describe the fast changes that occur during these transitions and capture the transition to retirement as a process in which, among others, well-being can fluctuate. For example, using growth mixture modeling analysis on two samples of retired people, Wang (2007) identified multiple change patterns of psychological well-being during the transition to retirement and adjustment process, that is, a maintaining pattern, a recovering pattern, and a U-shape pattern. These results suggested that retirement transition and adjustment are not uniform.
In the field of vocational psychology, researchers shed light on the types of preretirement careers, career-specific norms or older workers’ competence and vocational skills (Shultz & Wang, 2011). However, in this field, it is difficult to find research that shows how people plan their retirement. In fact, if financial plans are explored (e.g., Glass & Kilpatrick, 1998; Vlaev, Chater, & Stewart, 2009), there is lack of information about global retirement projects in terms of life plan. However, recently Schlossberg (2007) proposed distinguishing 5 types of retired persons, based on a large number of interviews and several focus groups. Interviews were conducted with 100 men and women, white-collar and blue-collar workers. Schlossberg also studied retirement with four focus groups by exploring the major topics in retirement: leaving work, changing relationships, body, and self. While insisting on the high variability of paths that people can take, Schlossberg identified 5 main types of paths. The first type of retirees, called the continuers, are characterized by a certain continuity. When they leave the workplace, continuers maintain some important aspects of their worker’s identity. They tend to focus on some key competencies and to continue to use them in new activities (work, volunteering, etc.). Sometimes, they only reduce their work activity or stay in the company as a consultant. For the second type of retirees, called the adventurers, retirement is perceived as an opportunity to organize their own time and space in a different manner. The inclusion criteria for this type would be the development of new abilities or a change in life course. A person may, for example, start a new career or move to another country to start a new life. The easy gliders, that is the third type of retirees, describe people who tend to see retirement as a “freedom period.” The key concept is the wish not to specify any particular project for the future. A person may, for example, want to spend time with their family one day and to have hobbies or to work on another day. The fourth type of retiree is called searcher. This category recalls that retirement can be seen as a process, that transition is a time to reach a new life balance, where people go through trials and errors, trying something one day and changing their mind the next day. People in this category can be compared with many high school and college graduates as they try to figure out what is next. This category could be seen as an inevitable transitory stage before entering one of the four other types. Finally, the fifth type of retiree is called retreaters. More than a temporary life step, retreaters are those who give up and disengage from life entirely. They have a higher probability of lacking resilience and being unskilled in facing this transition. Sometimes it may be difficult to distinguish them from searchers, but in both cases it is for these people that it would perhaps be most necessary to develop a counseling program. It is interesting to note that consequently, Schlossberg (2009) proposed different ways of finding happiness in retirement. She argued that retired people may improve their well-being in retirement notably by revitalizing their identity (finding a new identity that is satisfying) and relationships (by making new connections or energizing a continuing relationship), and find a new purpose in life after retirement.
This typology shows the importance of taking into account individual differences when practitioners try to help people to face such a transition. Indeed, a continuer who does not have the possibility of continuing to work, even part time, after retirement, would be likely to face more difficulties in coping with the transition than an easy glider who takes things as they come. Thus, to benefit from this typology, it would be useful to have an instrument able to evaluate individuals in order to clarify their specific type. Therefore, the first aim of this study was to develop and validate a questionnaire based on Schlossberg’s (2007) typology of the retired. Indeed, this typology provides a simple manner of assessing individuals’ thoughts on retirement. The second aim was to compare—using a cross-sectional design—the representations of the transition to retirement of individuals just before and just after retirement. Finally, we assessed the relationships between such representations of the transition to retirement with dispositional resistance to change and personality dimensions.
Method
Participants
The total sample consisted of 1,054 French-speaking adults (484 women and 570 men) living in Canton Vaud (Switzerland) and aged from 59 to 72 years old (M age = 63.13, standard deviation [SD] = 1.38). Concerning the professional situation, 503 participants were professionally active and 551 were retired or partially retired (n = 61). The group of active participants (n = 503) consisted of 247 women (49.1%) and 256 men (50.9%); 323 (64.2%) had a partner (married or unmarried) and 417 (82.9%) had one or more children. The mean age of the professionally active group was 62.71 years (SD = 1.23, age range: 60-69). The group of retired individuals (n = 551) was composed of 237 women (43.0%) and 314 men (57.0%); 386 (70.7%) had a partner (married or unmarried); 422 (76.6%) had one or more children. The mean age of this group was 63.57 years (SD = 1.38, age range: 59-72). In Switzerland, the official retirement age is currently 65 and as of 2005, women have been allowed to retire at age 64. However, over the past two decades, early retirement has gained importance. The proportion of women and men differed significantly, but the effect size associated with this difference is negligible, χ2(1) = 3.93, p < .05, d = .15. Finally, both for the active group, t(498) = −9.77, p < .001, d = .87 and the retired group, t(544) = −9.10, p < .001, d = .79, men have a higher mean age.
Development of the Transition to Retirement Questionnaire
The Transition to Retirement Questionnaire (TRQ), inspired by Schlossberg’s (2007) typology of retired people, is a new questionnaire developed to assess people’s perception of their future retirement or the representation of their own daily experience and life as a retiree. Before presenting the final version of the TRQ analyzed in this study, in the next section we introduce the main steps in relation to the construction of the questionnaire.
Using an inductive process, a team of two career counselor specialists generated an initial set of 32 items and 5 vignettes attempting to cover the main characteristics of the retiree typologies described by Schlossberg (2007). Afterward, two other independent specialist career counselors checked for clarity the wording statements, redundancy between items, the capacity to reflect fundamental facets of the retirement perception and experience, as well as the logical structure and flow of the items. Based on this evaluation, changes were made to several items. Subsequently, the items were translated into English by an independent professional translator and submitted to Nancy Schlossberg for a review of item content and pertinence, and amendments were made where needed following Schlossberg comments.
Considering that the TRQ was developed to assess the personal perception of the coming transition to retirement and life as a retiree, the item reduction and identification process was conducted only for the professionally active group (n = 503). In fact, as indicated by Topa and colleagues (2009), on one hand, for individuals who are still professionally active, retirement and life as a retiree is an expectation and a forthcoming event and situation. On the other hand, for retired individuals, retirement is a present reality, a daily experience. However, retirement planning and organizing continue even after the transition to retirement (Donaldson et al., 2010).
First, items with poor acceptability defined by missing data equal to or greater than 5% were excluded. Indeed, a too large amount of missing data could reflect a problem in the formulation of the item or, in the understanding of the question or acceptance by the participants (see Guarino, Lamping, Elbourne, Carpenter, & Peduzzi, 2006). Second, a principal component analysis (PCA) with varimax rotation was conducted (a very similar structure was found using a varimax and an oblimin rotation). The number of components to be considered was based on Cattell’s (1966) scree test, a parallel analysis (O’Connor, 2000), and on the interpretability and coherence of the sorted structure. After having identified five components, the items with loadings lower than 0.4 were eliminated (Stevens, 1992; Tabachnick & Fidell, 2001), with the exception of Item 13, which was not excluded in order to have a sufficient number of items for the easy gliders dimension. Third, for the remaining set of items, a control for poor contribution to the factor with corrected item-total correlation (<.30) and for item redundancy measured by inter-item correlation coefficients (>.70) was also achieved (Tabachnick & Fidell, 2001). Fourth, items-vignette coherence and interpretability for each component were reanalyzed. Indeed, the vignette represents a larger item presenting the main characteristics of the factor concerned. It was therefore necessary to have a certain coherence between items and vignette in the same factor and to avoid content overlap between factors. During this process, we excluded 6 items (due essentially to loading factors <.40 and insufficient contribution to the factor concerned). For all the items and vignettes, the amount of missing data was lower than 5%. Therefore, we reran the analysis (i.e., second to fourth steps) to verify the factorial structure and reliability with the remaining pool of items and vignettes.
Measures
Transition to Retirement Questionnaire
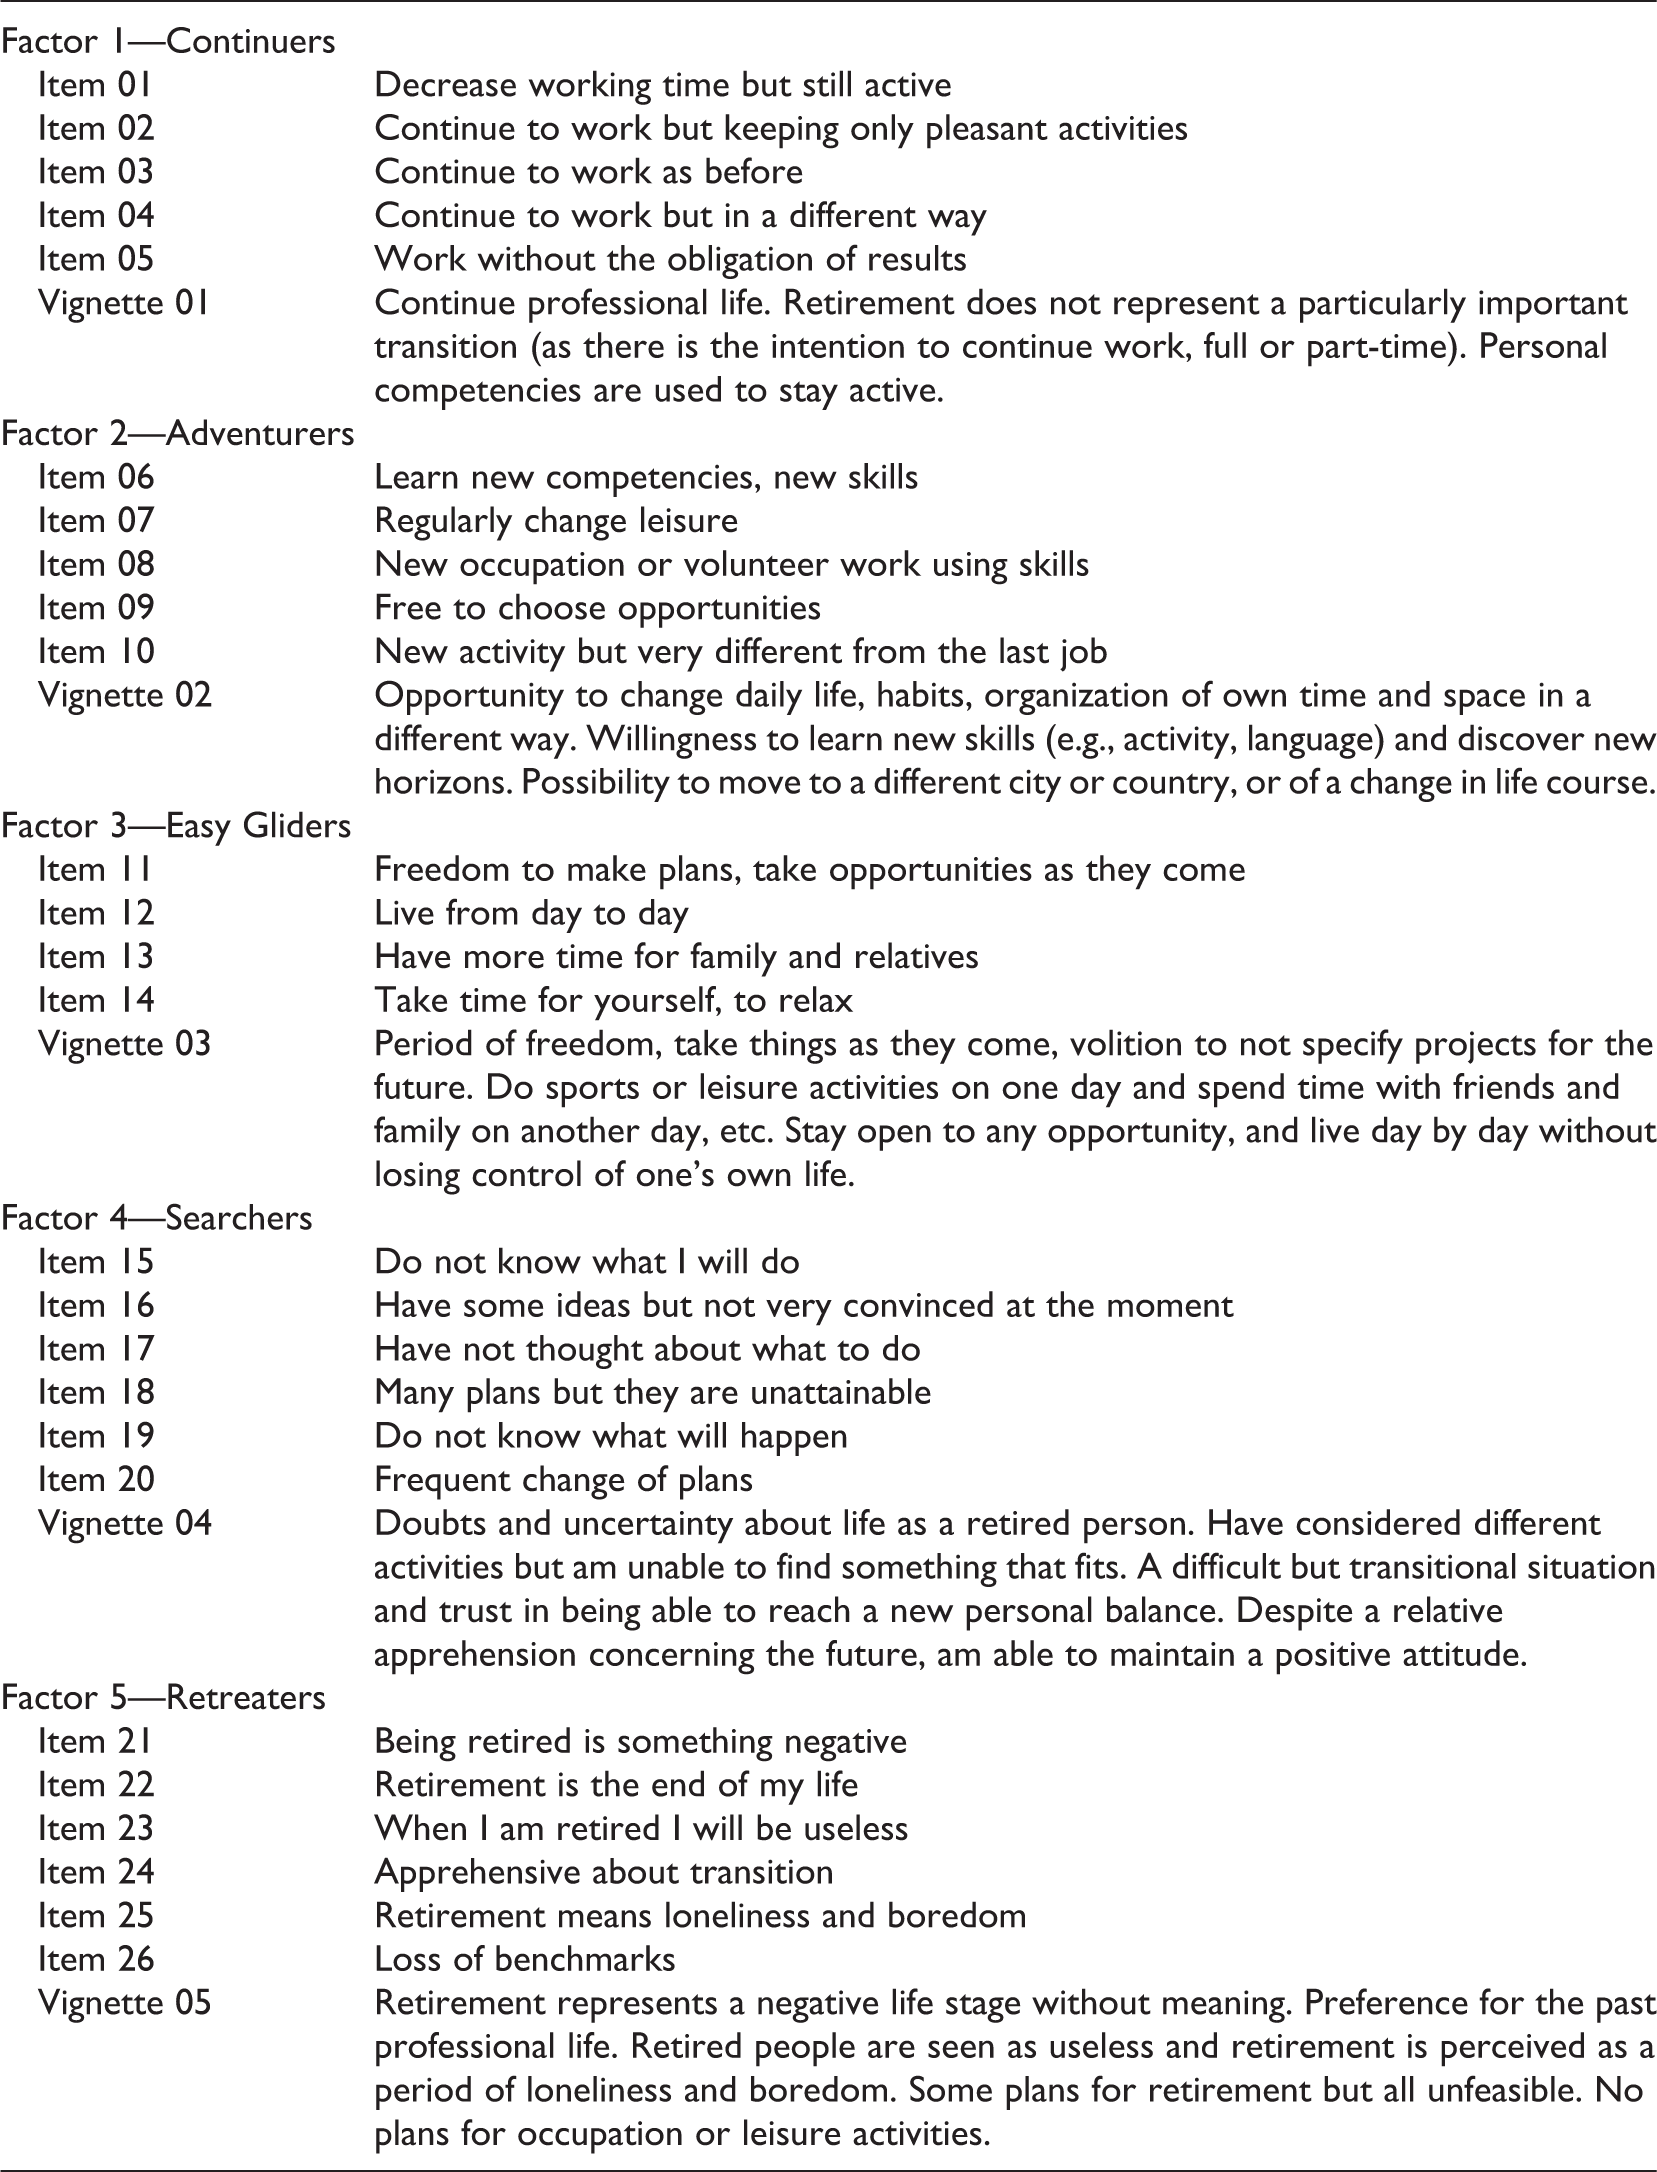
The version of the instrument used in this study included 26 items and 5 vignettes (see Appendix) measuring five dimensions named according to Schlossberg’s typology: continuers, adventurers, easy gliders, searchers and retreaters. Both items and vignettes are rated on a 6-point Likert-type scale ranging from 1 (strongly disagree) to 6 (strongly agree). Participants receive a score for each dimension and are not classified exclusively in one of the five dimensions. The score for each dimension reflects the perception of and attitude toward retirement (and the transition to retirement). The first dimension, called continuers (5 items and 1 vignette), represents the intention and the willingness to maintain a professional activity. This is done either by maintaining exactly the same activity or a part of it (e.g., only the most pleasant activities, reduction of working time), or by changing the way of working. This dimension is close to the concept of bridge employment describing paid or unpaid work after retirement (Wang & Shultz, 2010; Zhan, Wang, Liu, & Shultz, 2009). The second dimension, named adventurers (5 items and 1 vignette), reflects the perception of retirement as an opportunity to engage in new leisure activities, to learn new things and develop new skills. This dimension also includes the willingness to start a new professional activity (very different from the last job) or to do volunteer work. The third dimension, called easy gliders (4 items and 1 vignette), reflects the desire to take time for oneself (e.g., to relax), spend more time with relatives and friends, and the intention to take things as they come without a particular schedule, living from day to day. Overall, this dimension describes retirement as a period of freedom. The fourth dimension, labeled searchers (6 items and 1 vignette), refers essentially to uncertainty, indecisiveness, and doubts concerning future personal occupations and projects during retirement (plans have still to be developed). The last dimension, called retreaters (6 items and 1 vignette), represents a negative perception of retirement. Retirement is described here in terms of feelings of personal uselessness, a source of loneliness, loss of reference points, and as “the end of life.” The two last dimensions represent a more uncertain and more negative perception of the transition to retirement and retired life.
Resistance to Change Scale
The 17-item Resistance to Change scale (RTC, Oreg, 2003) aims to measure the personality component of the multidimensional construct named “dispositional resistance to change” (Oreg, 2006). This construct concerns the individual’s inherent tendency to resist and avoid changes or to accept and adopt changes (Arciniega & González, 2009). The scale includes four subscales (i.e., routine seeking, emotional reaction, short-term focus, and cognitive rigidity) and a composite score. The composite RTC scale score has been shown to predict individuals’ reactions to change both in voluntary and in imposed conditions (Oreg, 2003, 2006). Using a 6-point Likert-type scale (ranging from 1 = strongly disagree to 6 = strongly agree), participants are asked to indicate the extent to which they agree with each item. The total scale’s reliability α score is .92 and subscale coefficients rank from .78 for emotional reaction, short-term focus, and cognitive rigidity to .82 for routine seeking (Oreg, 2003). For the purpose of this study, authors developed a French-version of the questionnaire, via a translation and back-translation procedure, with the support of Shaul Oreg, the author of the original scale. Internal consistency values are presented in the Result’s section.
NEO Five-Factor Inventory Revised
The NEO Five-Factor Inventory—Revised (NEO-FFI-R, Aluja, García, Rossier, & García, 2005; McCrae & Costa, 2004;) is a short form of the revised NEO personality inventory (Costa & McCrae, 1992). The NEO-FFI-R consists of 60 items measuring five dimensions of normal personality, that is, neuroticism (N), extraversion (E), openness to experience (O), agreeableness (A) and conscientiousness (C). Responses are recorded on a 5-point Likert-type scale ranging from strongly disagree to strongly agree. The NEO-FFI-R French version was validated within 1,090 adults living in Switzerland. This version showed adequate internal reliability, with α coefficients for the five dimensions ranging from .70 for A to .83 for N (Aluja et al., 2005).
Procedure
Data presented in this article are part of the first wave of a longitudinal study with three data collection waves over a period of 3–4 years. We used a random sample of 3,000 adults aged between 60 and 65 living in the Swiss Canton Vaud drawn from the Vaud Address Office. Participants received the survey at home with a letter explaining the aims of the study and with a prestamped envelope to return the completed research protocol. Questionnaires were returned by 1,150 individuals. Thus, the response rate was 38.3%. Successively, we eliminated 104 participants (essentially due to the higher number of missing data or because they did not meet inclusion criteria, such as age and professional situation). However, regarding the response rate, we have to consider a certain number of errors in the initial database (e.g., age too young or too old) and nonvalid addresses. Participation in the study was voluntary and participants did not receive any participation incentives. However, they could request an individual descriptive feedback. This research complied with the ethical standards of the Swiss Society for Psychology and of the American Psychological Association.
Data Analysis
All analyses were conducted using the Statistical Package for Social Sciences (IBM SPSS Statistics) version 19.0 (SPSS Inc., Chicago, Illinois) and AMOS version 19.0 statistical package (Arbuckle, 2006). In addition to exploratory PCA and internal consistency discussed earlier, we conducted bivariate correlational analyses to assess possible relations between the five TRQ dimensions. We calculated congruency coefficients (CCs) to obtain a global estimation of the structural equivalence between the active and retired groups (Haven & ten Berge, 1977; Wrigley & Neuhaus, 1955). These coefficients vary from −1 to +1. CCs of .80 or lower indicated a poor structural equivalence, CCs between .81 and .90 suggested a borderline equivalence, and CCs above .90 indicated a high structural equivalence. To test the presence of gender effect on the TRQ dimensions, a series of one-way analyses of variance were computed for both the groups. Effect size was measured using Cohen’s d (1988). Possible differences between the active and retired groups and subgroups on TRQ mean values controlling for gender were explored with a series of analyses of covariance (ANCOVA). We calculated partial eta square (partial η2) to evaluate the magnitude of these effects. In order to assess the structural validity of the TRQ solution obtained with the PCA, we performed a confirmatory factor analysis (CFA) with the active subsample. To achieve model identification, regression coefficients of the error terms over the endogenous variables were set at 1. In order to assess the model fit, following the recommendation by Kline (1998), multiple fit indices were considered. These include the χ2 per degree of freedom (χ2/df), the goodness of fit index (GFI), the comparative fit index (CFI), the Tucker-Lewis index (TLI), and the root-mean-square error of approximation (RMSEA) with LO90 and HI90. A model is considered to have an acceptable fit if the χ2/df is equal to or below 3 and the GFI, CFI, and TLI values are about .90 or higher. An RMSEA below .06 would indicate an adequate fit. Subsequently, to assess if TRQ items operate similarly across the two groups (active and retired), we tested multigroup invariance based on the final model obtained with the active group. Finally, to assess the impact of personality and tendency to resist changes on the TRQ dimensions, a series of hierarchical multiple regressions were realized (with an Enter method). To control for a confounding effect of the demographic variables (i.e., age, gender and singleness), they were entered in Step 1. Resistance to change subscales and personality dimensions were entered in Step 2.
Results
Descriptive
Internal reliabilities tested on the total sample (N = 1,054) were adequate for all the TRQ dimensions: continuers (α = .77), adventurers (α = .71), easy gliders (α = .71), searchers (α = .78), and retreaters (α = .87). For the active group, reliabilities were all adequate, Cronbach’s αs were almost adequate for all the dimensions: continuers (α = .77), adventurers (α = .69), easy gliders (α = .72), searchers (α = .77), and retreaters (α = .89). Regarding the retired group the reliabilities were still acceptable, with .72 for continuers, .73 for adventurers, .69 for easy gliders, .77 for searchers, and .82 for retreaters. Concerning the RTC subscales, analysis showed an internal reliability on the total sample of .68 for routine seeking, .75 for emotional reaction, and .70 for short-term focus. Unfortunately, for cognitive rigidity the α value was unsatisfactory (< .60). Concerning personality, reliabilities reported by the total sample for neuroticism, extraversion, openness, agreeability, and conscientiousness were, respectively, .79, .75, .72, .70, and .79.
Concerning gender differences on the TRQ dimensions in the active group, men had a significantly higher score on the continuers dimension (d = .31), while women had higher scores on the easy gliders dimension (d = .32). In the retired group, women reported a higher score (d = .25) on the easy gliders dimension. The results regarding the RTC highlighted only a significant but negligible difference on the emotional reaction subscale in the retired group (d < .20). In fact, women showed a higher score on this subscale. As for personality dimensions, in both groups women had significantly higher scores on neuroticism (d = .28 for active participants, d = .29 retired participants), openness (respectively, d = .47 and d = .36), and agreeability (respectively, d = .60 and d = .62). Table 1 reports descriptive statistics for the TRQ dimensions for the active and the retired groups. After controlling for gender, ANCOVAs indicated significant differences on all the TRQ dimensions except for the adventurers dimension. Professionally active participants reported a higher mean score on the continuers, searchers, and retreaters dimensions. Retired and partially retired participants showed a higher score on the easy gliders dimensions. Differences were usually associated with a small effect size (η2 < .06); only the difference on the continuers dimension was associated with a medium effect size (η2 = .14). Despite different specific mean values, the two groups show a similar pattern of results. Indeed, both the active and retired groups showed the highest mean score for adventurers (respectively, 3.93 and 3.91) and easy gliders (4.30 and 4.61) and the lowest mean score for searchers (2.56 and 2.16) and retreaters (1.67 and 1.42).
Mean Differences Between Active and Retired Participants for the TRQ Dimensions After Controlling for Gender.

Exploratory Principal Component Analyses
An exploratory PCA with varimax rotation was computed for the professionally active group (n = 503) on the final pool of 26 items and 5 vignettes. The Kaiser-Meyer-Olkin (KMO) measure of sample adequacy was greater than .87. KMO values for individual selected items were above .70 and Bartlett’s test of sphericity was significant, χ2(465) = 4,459.22, p < .001. The 5-factor solution explained 51.35% of the total variance. The first six eigenvalues were 6.42, 3.60, 2.93, 1.63, 1.32, and 1.06. All items showed a loading greater than .40 on the factor concerned (see Table 2), except for Item 13. Moreover, data revealed no secondary loading higher than .40. To assess relations between the TRQ dimensions in the active group, we analyzed the five scales’ scores represented by the mean of the scale items (i.e., sum of the items scale divided by the number of items concerned), and the factor score obtained from the PCA after rotation. Correlation coefficients between factor score and scale mean were all above .90 (varying from .92 for the searchers dimension to .98 for continuers). Concerning the relations between the TRQ dimensions’ mean score, the retreaters dimension correlated with the searchers dimension (r = .59, p < .001). Retreaters also correlated positively with continuers (r = .17, p < .001) and negatively with easy gliders (r = −.22, p < .001). Easy gliders also correlated negatively with continuers (r = −.25, p < .001) and positively with adventurers (r = .28, p < .001). Finally, we observed a significant correlation between adventurers and continuers (r = .10, p < .05).
Exploratory Principal Component Analyses for Active and Retired Participants.
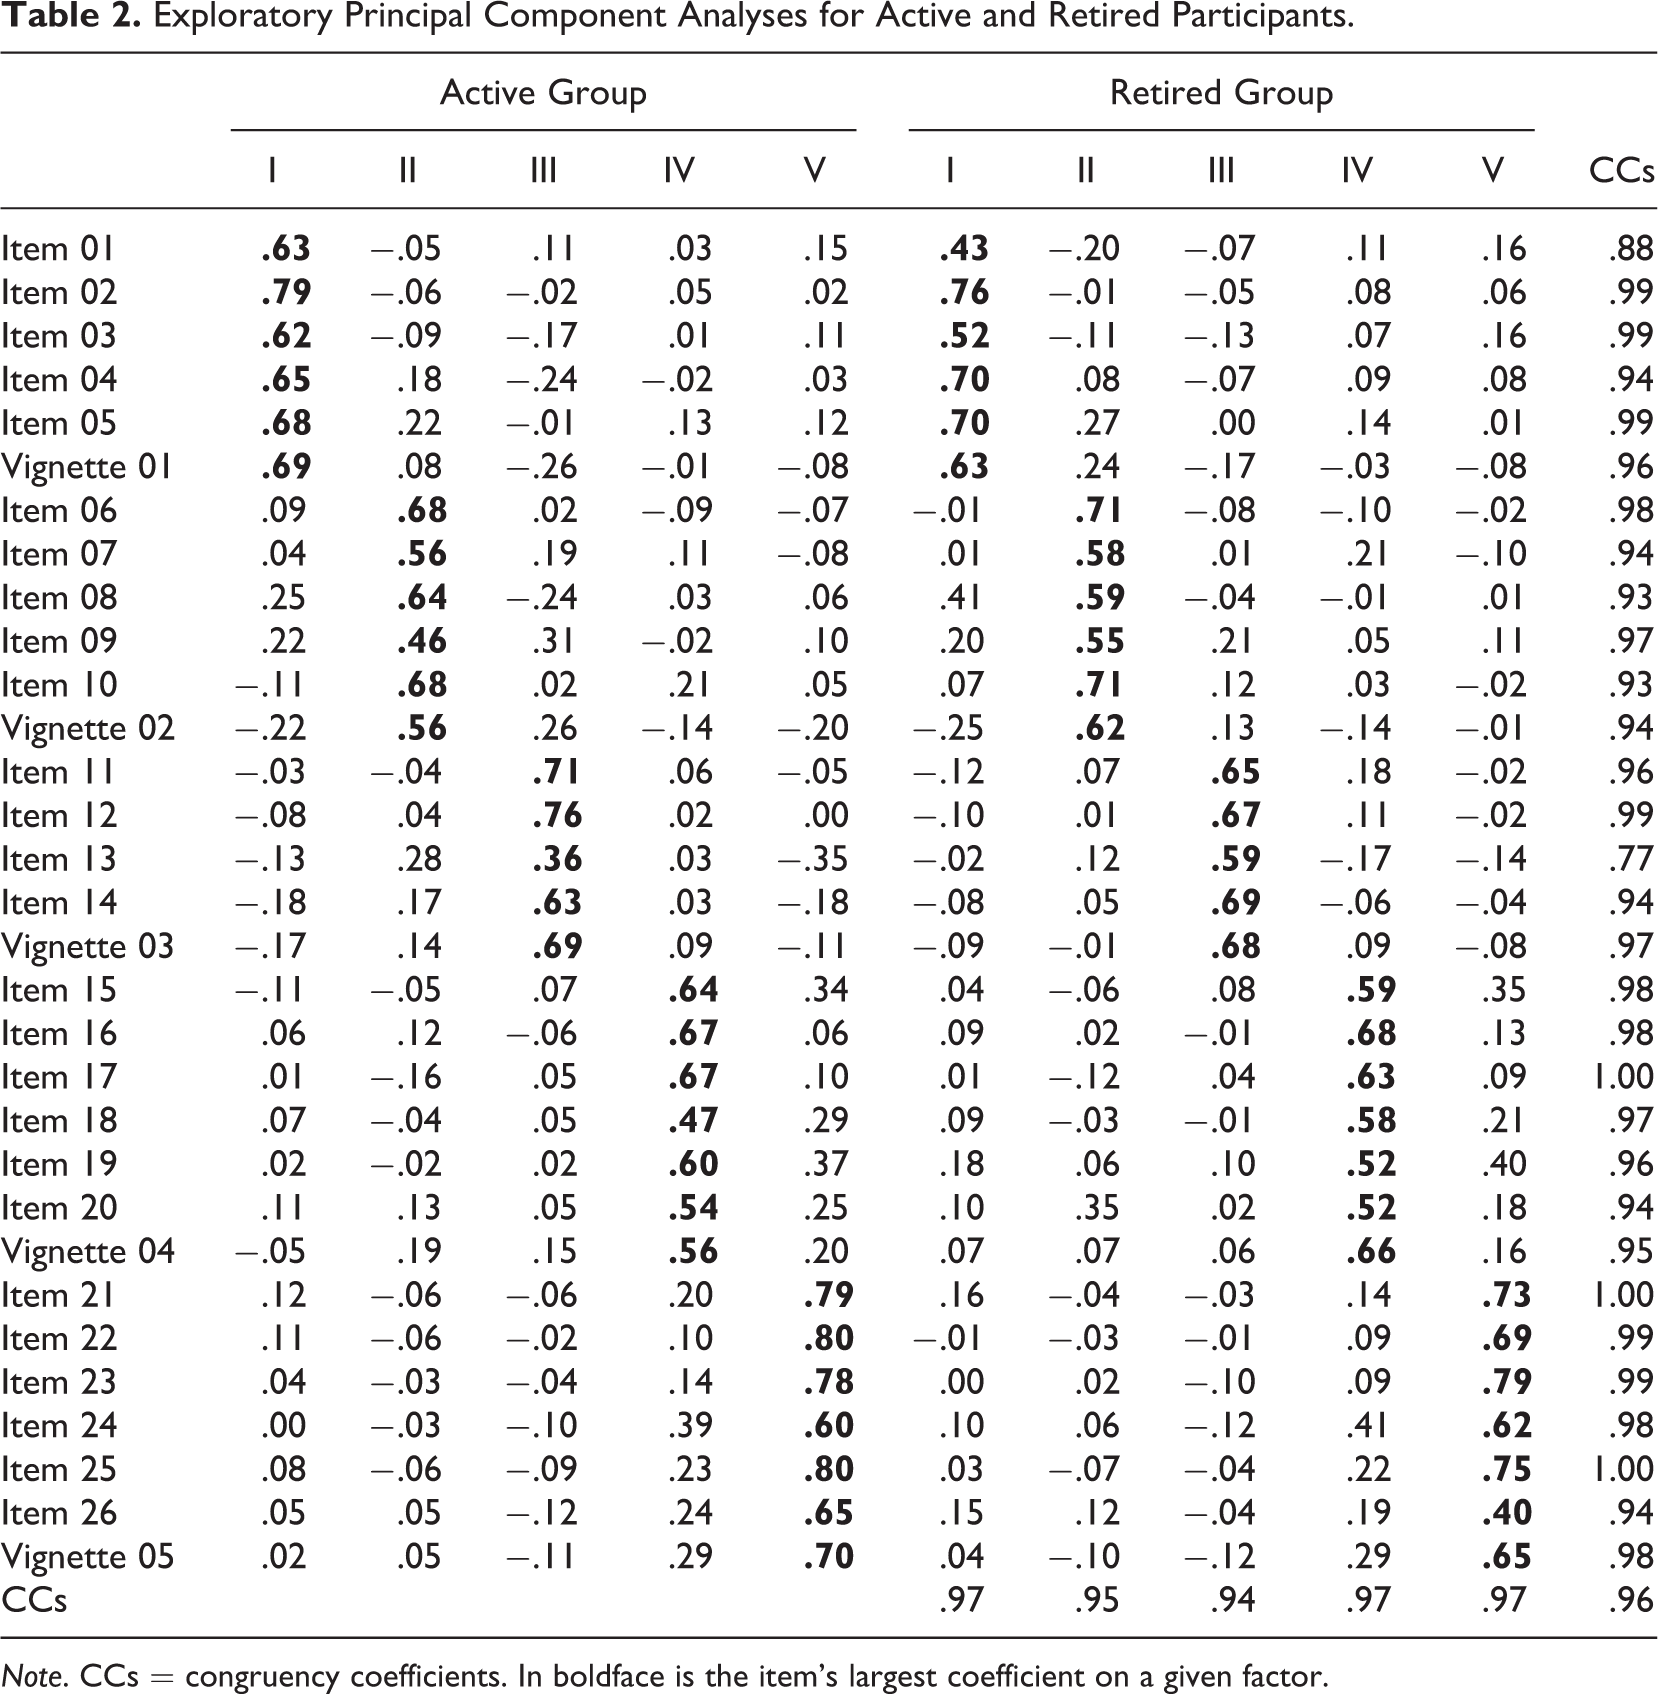
Note. CCs = congruency coefficients. In boldface is the item’s largest coefficient on a given factor.
Exploratory PCA analysis for the retired group (n = 519) on the final pool of items and vignettes indicated a KMO measure of sample adequacy of .857 and KMO values for individuals items were all >.75. Bartlett’s test of sphericity was significant, χ2(465) = 4,164.60, p < .001. This solution explained 47.72% of the total variance and the first six eigenvalues were, respectively, 5.86, 3.19, 2.88, 1.77, 1.30, and 1.10. All the items showed a loading greater than .40 on their main factor. However, analyses evidenced three secondary loadings, all of .41. Correlation coefficients between factor scores’ and dimensions’ mean score varied from .92 (for retreaters) to .97 (for easy gliders). Regarding the professionally active group, correlation analyses between TRQ dimensions’ mean score highlighted a similar pattern of results. We tested the equality of these correlation coefficients between the professionally active and retired groups. Results showed a nonequality (Zobs > 1.96) only for continuers–searchers (r = .25, p < .01) and adventurers–easy gliders (r = .15, p < .01) dimensions correlations. Finally, in order to compare the loading matrix obtained for the retired group with the loading matrix obtained for the professionally active group, CCs were calculated. As we can observe in Table 2, except for Item 13 (.77), the items’ CCs are generally very high (median [Mdn] = .97). Furthermore, the CC of each dimension rank from .94 to .97 and the total CC is .96, indicating that the structure was very similar across the two groups.
CFAs and Measurement Invariance
Table 3 shows the results of two models for both subsamples. 1 The first model considers five factors that are not independent and the second model is an adjusted model based on modification indices (MIs > 10). Concerning professionally active participants, the first model showed a relatively good fit with χ2/df value under 3, however the GFI, the TLI, and the CFI were slightly below .90. Finally, the RMSEA indicated an adequate fit. Taking into account 17 covariances between the error terms associated with a modification index above 10 significantly improved the model fit, χ2(17) = 290.14, p < .001. The adjusted model showed acceptable to good fit for all indices. In this model, except for 1 item (Item 8), all standardized loadings ranged from .40 to .83. These results suggest that the 26 items and the 5 vignettes are good to strong indicators of the latent variables. For the group of retired participants, the results were very similar. All standardized loadings ranged from .44 to .79, except for Items 1 and 26 (factor loading <.40). To assess whether TRQ items operate similarly with the active and the retired participants, we tested metric invariance across the two groups based on the 5-factor adjusted model highlighted with the active group and presented above. The nested model comparison measure, χ2(27) = 90.37, p < .001, showed that the full metric equivalence model was significantly worse than the unconstrained model as usually observed. Nevertheless, the different fit indices concerning the full metric equivalent model were still acceptable. Overall, these results confirm the indications highlighted previously in the exploratory procedure and support the idea that the 5-factor structure is appropriate to represent the pool of 26 items and 5 vignettes for both the active and retired groups.
Confirmatory Factor Analyses of the TRQ.
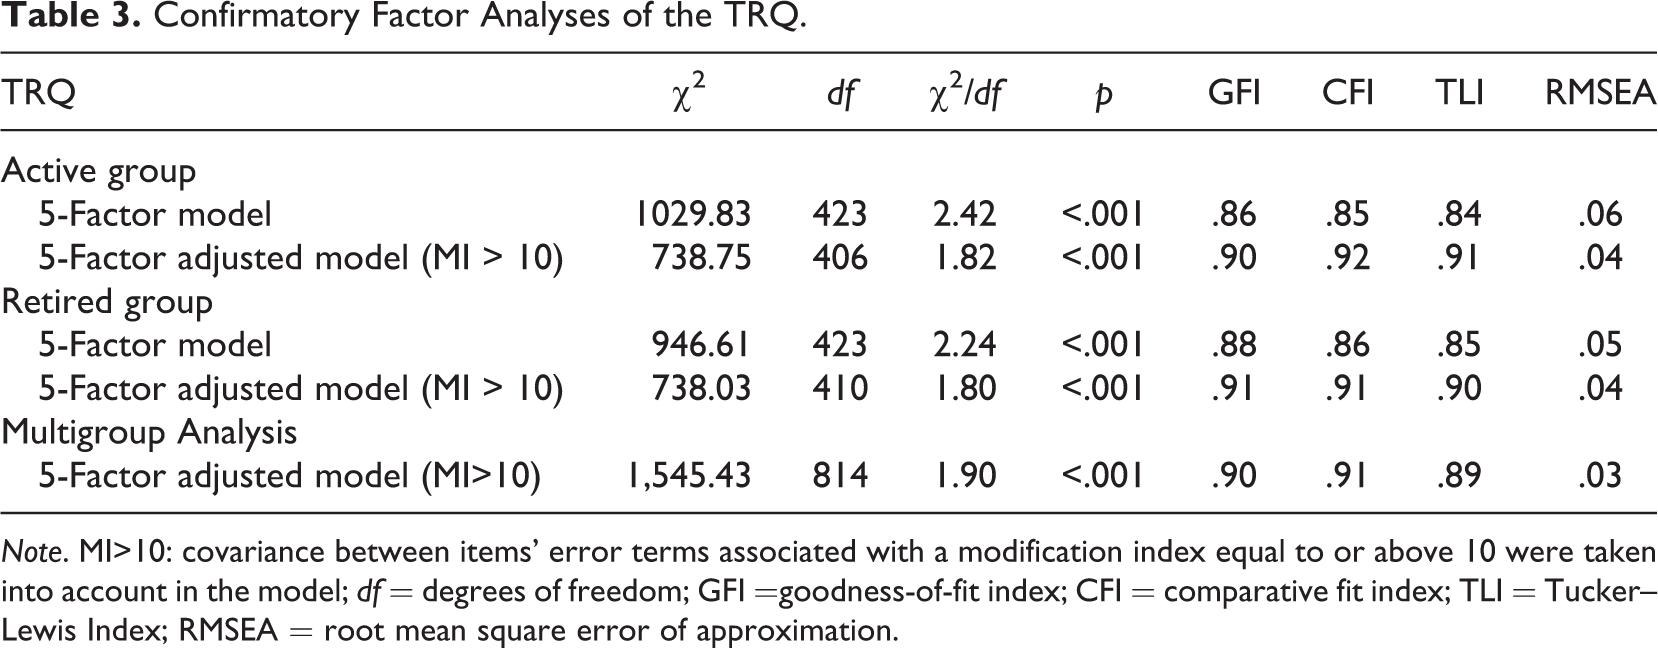
Note. MI>10: covariance between items' error terms associated with a modification index equal to or above 10 were taken into account in the model; df = degrees of freedom; GFI =goodness-of-fit index; CFI = comparative fit index; TLI = Tucker–Lewis Index; RMSEA = root mean square error of approximation.
Retirement and TRQ Dimensions
To further explore the differences between the two groups and the possible impact of retirement on the TRQ dimensions, we conducted a new series of ANCOVAs (with Bonferroni correction for the post hoc comparisons), controlling for gender. In these analyses we considered exclusively participants 5 years maximum before and 5 years maximum after retirement. These participants were divided into six mutually exclusive subgroups in relation to the number of years to or from the retirement transition: (i) less than 5 years before retirement (n = 161), (ii) less than 2 years before retirement (n = 116), (iii) less than 1 year before retirement (n = 141), (iv) less than 1 year after retirement (n = 149), (v) less than 2 years after retirement (n = 61), and (vi) less than 5 years after retirement (n = 164). When, we compare these subgroups in relations to the TRQ dimensions, except for the adventurers dimension, results showed a significant main effect of the distance to retirement on TRQ dimension scores: for continuers, F(5, 784) = 14.31, p < .001, η2 = .08; for easy gliders, F(5, 785) = 4.10, p < .01, η2 = .03; for searchers, F(5, 785) = 9.71, p < .001, η2 = .06, and for retreaters, F(5, 785) = 4.26, p < .001, η2 = .03. Precisely, post hoc comparisons for continuers indicated that all the groups of active participants differed significantly from all the groups of retired participants (all ps < .01). Regarding the adventurers dimension, results showed no difference among the six groups. For the easy gliders dimension, post hoc analyses indicated significant differences exclusively between the less than 5 before retirement subgroup on one hand, and the three groups of retired participants on the other hand. Therefore, among working participants only those furthest away from retirement perceived retirement less as a period of freedom. However, the difference with the less than 2 years after retirement group was marginally significant (p < .10). Concerning the searchers dimension, the results indicated that three subgroups of active individuals and the first subgroup of retired individuals (less than 1 year after retirement) reported a significantly higher score than the less than 5 years after retirement group (all ps < .001). In other words, doubts and uncertainties about future personal occupations as a retired person decrease significantly more than 2 years after the transition. Finally, post hoc analyses for the retreaters dimension revealed that the three active subgroups had a significantly higher score than the less than 5 years after retirement subgroup. This means that professionally active participants have a more negative perception of retirement exclusively than people who spend more time as retired. Consequently, the data showed no difference between active participants and those who had retired less than 1 and 2 years ago.
TRQ, Resistance to Change, and Personality
Correlations between TRQ and RTC showed that for both the active and retired groups, the adventurers dimension is negatively correlated with routine seeking and short-term focus, and that both the searchers and retreaters dimensions are positively correlated with all RTC subscales except for cognitive rigidity (see Table 4). Furthermore, in the active group, the adventurers and easy gliders dimensions are negatively correlated, respectively, with emotional reaction and routine seeking, while in the retired group the continuers and easy gliders dimensions are positively related, respectively, with short-term focus and cognitive rigidity. Regarding the relations between TRQ and NEO FFI-R (see Table 4), for both groups the continuers dimension is positively correlated with openness and negatively with agreeableness. The adventurers dimension is positively related to extraversion and openness, and the easy gliders dimensions is positively related to agreeableness. The searchers and retreaters dimensions are both positively correlated with neuroticism and negatively with extraversion, agreeableness, and conscientiousness. Furthermore, for the professionally active group, the continuers dimension is positively associated with extraversion, and the adventurers and retreaters dimensions are, respectively, negatively associated with neuroticism and openness. In the retired group, continuers is positively related to neuroticism and easy gliders positively to openness. Concerning the correlations between the NEO FFI-R and the RTC on the total sample, both routine seeking and short-term focus are positively correlated with neuroticism (respectively, r = .32 and .42) but negatively with extraversion (respectively, r = −.41 and −.34), openness (respectively, r = −.34 and −.20), agreeableness (respectively, r = −.15 and −.14) and conscientiousness (respectively, r = −.16 and −.22). Emotional reaction is positively correlated with neuroticism (r = .48) and negatively correlated with extraversion (r = −.31) and conscientiousness (r = −.17), whereas cognitive rigidity is positively associated with conscientiousness (r = .13) and negatively with openness (r = −.10). Correlations were similar in the active and the retired groups (Zobs < 1.96).
Correlations Between TRQ, RTC, and NEO-FFI-R Mean Scores for the Active and Retired Groups.
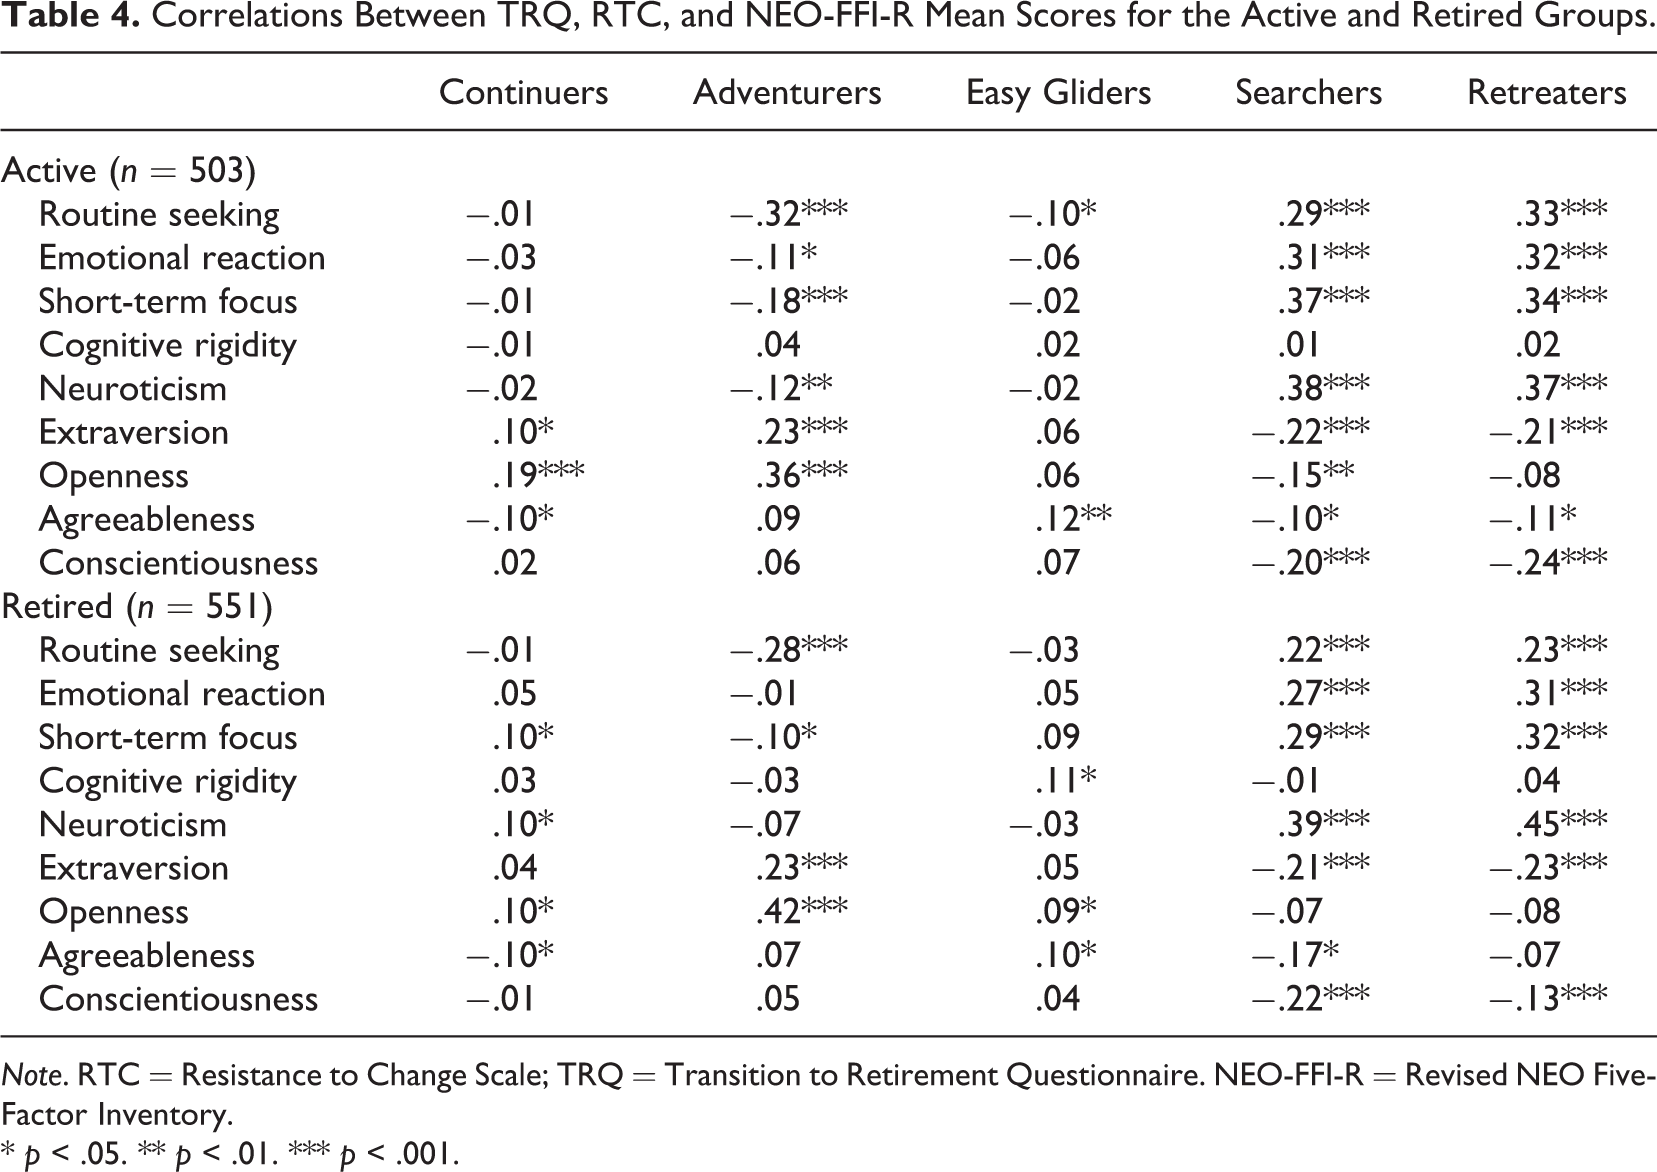
Note. RTC = Resistance to Change Scale; TRQ = Transition to Retirement Questionnaire. NEO-FFI-R = Revised NEO Five-Factor Inventory.
* p < .05. ** p < .01. *** p < .001.
Five hierarchical regression analyses (using the Enter method) were performed in order to examine the impact of resistance to change and personality on the TRQ dimensions with the active group (see Table 5). At Step 1, the demographic variables accounted for a maximum of approximately 4% of the total variance in the TRQ dimensions. In Step 2, after controlling for age, gender, and singleness, resistance to change subscales and personality explained about 20% of the total variance of the adventurers, searchers, and retreaters dimensions, 7% of the total variance of the continuers dimension, and 2% of the variance of the easy gliders dimension. Regarding the retired group, at Step 1 regression analysis highlighted no significant impact from the demographic variables (see Table 6). At Step 2, similarly to the active group, after controlling for demographic variables, resistance to change and personality explained about 20% of the variance of the searchers, adventurers, and retreaters dimensions, and 5% of the variance of the continuers and easy gliders dimensions.
Predicting TRQ Dimensions Using Personality and Resistance to Change for the Active Group.
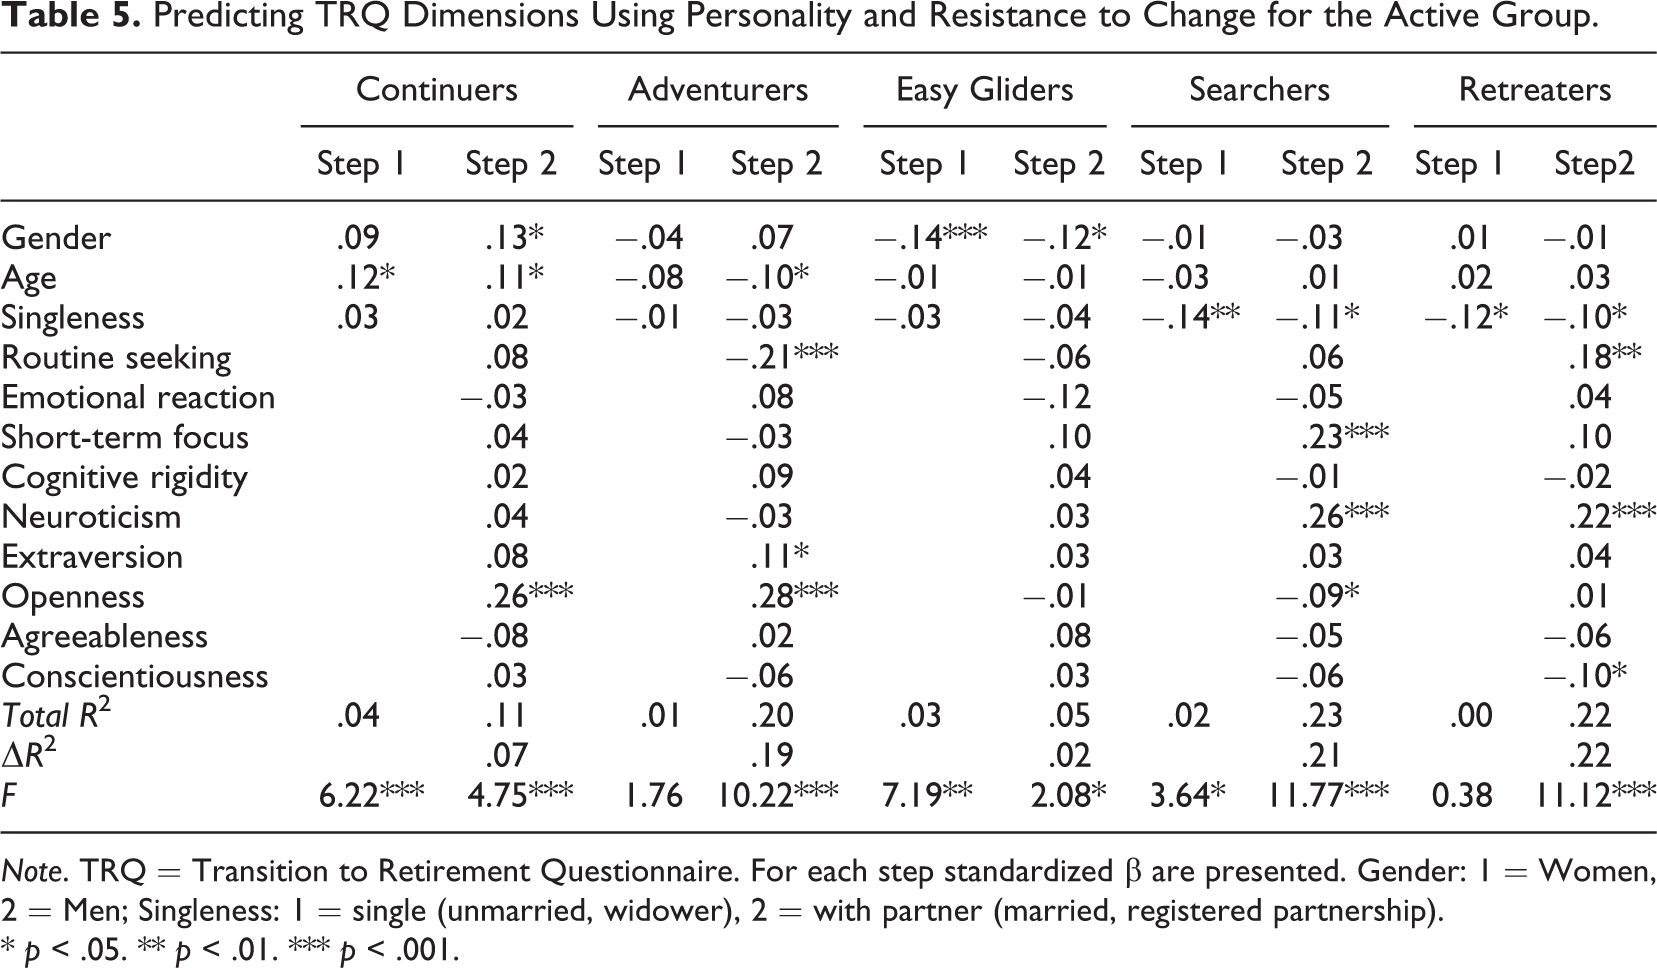
Note. TRQ = Transition to Retirement Questionnaire. For each step standardized β are presented. Gender: 1 = Women, 2 = Men; Singleness: 1 = single (unmarried, widower), 2 = with partner (married, registered partnership). * p < .05. ** p < .01. *** p < .001.
Predicting TRQ Dimensions Using Personality and Resistance to Change for the Retired Group.
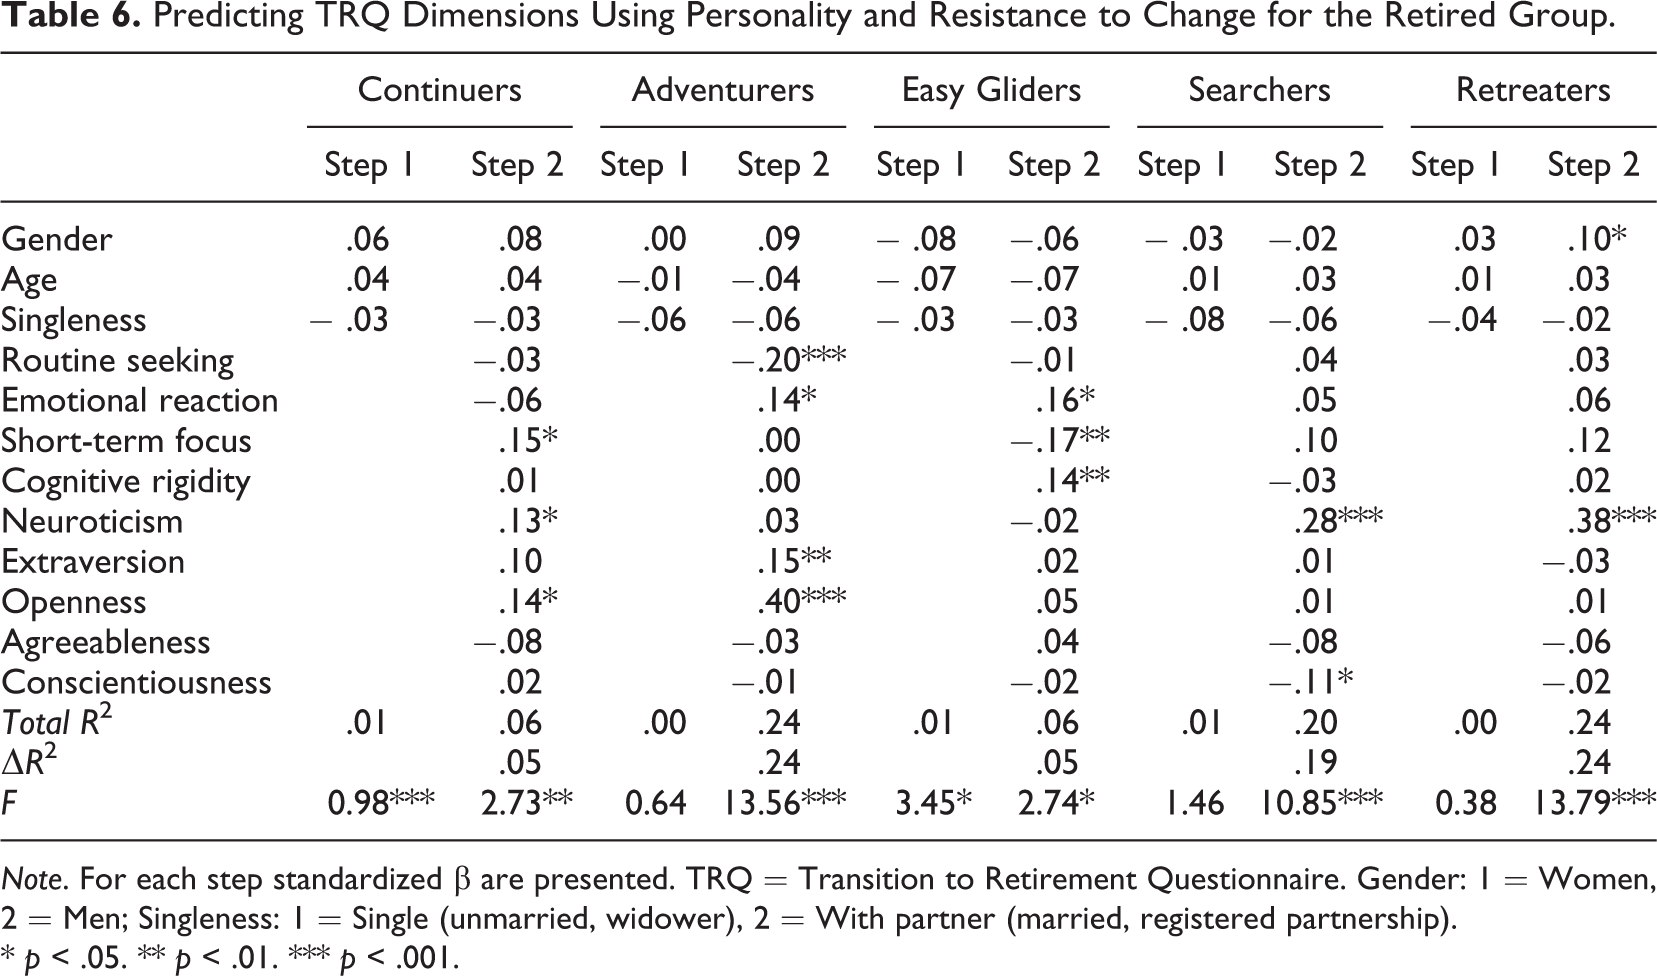
Note. For each step standardized β are presented. TRQ = Transition to Retirement Questionnaire. Gender: 1 = Women, 2 = Men; Singleness: 1 = Single (unmarried, widower), 2 = With partner (married, registered partnership). * p < .05. ** p < .01. *** p < .001.
Discussion
With the current demographic evolution, notably in terms of life expectancy and changing work context across western societies, it is more important than ever to consider personal perception of the transition to retirement and retirement life stage. This article presents the psychometric properties of a new questionnaire assessing the personal perception of the transition to retirement, the TRQ inspired by Schlossberg’s retreaters’ typology (2007). Initially developed with professionally active participants, the questionnaire was then tested with a group of retired participants. Overall, the results showed good psychometric properties, in terms of internal consistency and fit criteria both for the active and for the retired groups. Moreover, the TRQ dimensions (i.e., continuers, adventurers, easy gliders, searchers, and retreaters) were related with personality dimensions and resistance to change tendencies.
Regarding validation of the TRQ questionnaire, the principal component analyses revealed a five-dimension structure that coherently fit the theoretical typology of retired people recently presented by Schlossberg (2007). Each dimension was made up of a vignette and 4 to 6 items. The five-factor solution highlighted with active participants was replicated with retired participants and explained about 50% of the total variance for both the groups. Moreover, the structure was shown to be highly similar in the active and the retired groups. Despite a quite limited number of items, notably for the easy gliders dimension, the dimensions of the TRQ showed acceptable to good internal consistencies for both the active and the retired groups. Regarding the relationships between TRQ dimensions, a positive and relatively high correlation was observed between the retreaters and the searchers dimensions (close to .60). All other associations were lower than .30 (in absolute value). The CFAs indicated acceptable to satisfactory fit for the different indices. Regarding metric invariance across the two groups, multigroup analyses showed, on the one hand, that the unconstrained model was better than the full metric equivalence model, and on the other hand, that the fit indices were still acceptable. Globally, exploratory and confirmatory analyses support the five-factor structure of this newly created instrument assessing the representation of transition to retirement.
Concerning the active and the retired groups, both presented a similar profile on the TRQ dimensions. Indeed, both the groups reported higher scores on the easy gliders and adventurers dimensions and lower scores on the retreaters and searchers dimensions. In other words, the majority of the participants did not necessarily perceive retirement as a negative stage of their life or as a period of uncertainty and described retirement more in terms of freedom and opportunity to learn new skills and leisure activities or to relax and spend more time with friends and family. However, when comparing the two groups, professionally active participants reported slightly higher scores on the continuers, searchers, and retreaters dimensions while retired participants showed slightly higher scores on easy gliders. Moreover, the number of years to or from the retirement transition appeared to have an impact on the perception of this transition or of life as a retiree. For example, scores on the easy gliders dimension increase as the distance to the transition to retirement diminishes, and remains higher after retirement. Scores on the retreaters and searchers dimensions remain stable before and right after retirement, but decrease 2 years after this transition. Thus, the results could indicate that the doubt related to the transition and the organization of their own future and the negative perception of this new life-stage tend to decrease once the person face retirement. However, these changes are not necessarily homogenous and seem to take some time to be reported. At the same time, after the retirement transition, individuals seem to perceive this life stage more and more, as the opportunity to take more time for themselves and for relatives or as a period of freedom. In contrast, the adventurers dimension is more stable over the entire period (i.e., the years preceding and following the transition). Overall, this cross-sectional analysis seems to indicate that the perception of and the plans for retirement evolve during the years before and after the transition and not necessarily only at the time of this transition. This is consistent with the idea that retirement is a process that continues even after this transition (Donaldson et al., 2010). Relative to the typology proposed by Nancy Schlossberg, the TRQ aims to assess the importance of each dimension and not just classify individuals in one specific category. However, it would be useful to test, in an empirical perspective, the ideas and the theoretical background developed by Schlossberg such that individuals are categorized in one dimension only. A longitudinal research, from which stronger inferences might be drawn, would be particularly beneficial, first, to assess intraindividual changes that may occur during the years preceding and following transition to retirement and determine more accurately what time they occur. Second, it would give us the opportunity to determine the presence of some specific profiles that would be more likely to change and the direction of these intraindividual changes. For example, do people with greater apprehension and a more negative vision about life as a retiree continue to have this kind of perception, or do they develop a more positive perspective? Third, in relation to retirees, we will be able to better appreciate the stability—or not—of the changes observed after the transition to retirement over a longer period of time. Moreover, considering the increasing trend of early and part retirement (Wang & Shultz, 2010), it would be important to also consider a group of partly retired individuals (in this study the small number of partly retired people were considered as actually retired). On a practical level, all these indications could be important to develop specific program with the goal to support older workers to plan and prepare for the transition to retirement and life as a retired and increase general life satisfaction and well-being.
Dispositional resistance to change and personality traits had an impact on the personal representation of transition to retirement. Regarding resistance to change tendencies, a higher score on short-term focus predicted a higher score on the searchers dimension, and routine seeking negatively predicted adventurers dimension scores. Concerning personality traits, neuroticism positively predicted the searchers and retreaters dimensions, whereas openness positively predicted the continuers and adventurers dimensions, and extraversion predicted the adventurers dimension. Interestingly, with regard to demographic variables, representation of the transition to retirement was only partly related to age, gender, and singleness. Indeed, among professionally active participants, we observed that willingness to continue with some professional activity (continuers dimension) increases with age and is higher among men. This finding corroborates partially that of Zappala, Depolo, Fraccaroli, Guglielmi, and Sarchielli (2008) who suggested that older employees usually plan to retire later but found no gender difference. However, this result differs from Kim and Feldman (2000), as well as Wang and colleagues (2008), who found that older workers were less likely to engage in bridge employment but who did not investigate gender differences. However, it would be interesting to test the relationship between TRQ dimensions, notably in terms of continuers, and engaging in bridge employment. Our results also highlighted that the representation of retirement as a period to learn new skills or try different leisure activities (adventurers dimension) decreases with age. A representation of retirement in terms of loneliness, boredom, or loss of personal benchmarks (retreaters dimension) is lower among individuals with a partner. Among retired participants, men reported a more negative perception of retirement. Considering previous studies (e.g., Kim & Moen, 2002; Wang, 2007), future research should also investigate the predictive value of the TRQ dimensions for general well-being outcomes, such as somatic health, satisfaction with life, and depression. This later point seems particularly pertinent considering the relationship—among others—between retreaters and searchers dimensions and neuroticism.
A number of limitations should be mentioned. First, the five TRQ dimensions are not all evaluated by the same number of items; additional items might be considered for a revised version, especially for the easy gliders dimension, which only includes 1 vignette and 4 items. Second, although we controlled for several potential confounds related to demographics, there may be other uncontrolled variables able to account for dimension scores and differences between the two groups. For this reason, it would be interesting to integrate new control variables, such as somatic health and type of transition, in future studies (e.g., voluntary or not). Moreover, further studies need to be conducted in order to assess the clinical usefulness of TRQ dimensions for counseling psychology. Third, our study was cross-sectional, and for a more detailed analysis of the transition to retirement, a longitudinal design should be used. Finally, the study was conducted on a random sample of people of this age group in the Swiss Canton Vaud. A representative sample of other regions or countries should certainly be included in future research.
To conclude, the TRQ is a new questionnaire, inspired by the typology of retired people presented by Schlossberg (2007), to assess personal perception of the transition to retirement. This questionnaire includes 26 items and 5 vignettes organized among five reliable dimensions (i.e., continuers, adventurers, easy gliders, searchers, and retreaters). PCA and CFA indicated that this five-factor solution is appropriate, stable, robust, and valid. The TRQ provides an instrument that can be used both with active and with retired people. This study indicates that the TRQ is a valid measurement tool, but further studies need to be conducted in order to assess the clinical usefulness for counseling psychology.
Footnotes
Appendix
| Factor 1—Continuers | |
| Item 01 | Decrease working time but still active |
| Item 02 | Continue to work but keeping only pleasant activities |
| Item 03 | Continue to work as before |
| Item 04 | Continue to work but in a different way |
| Item 05 | Work without the obligation of results |
| Vignette 01 | Continue professional life. Retirement does not represent a particularly important transition (as there is the intention to continue work, full or part-time). Personal competencies are used to stay active. |
| Factor 2—Adventurers | |
| Item 06 | Learn new competencies, new skills |
| Item 07 | Regularly change leisure |
| Item 08 | New occupation or volunteer work using skills |
| Item 09 | Free to choose opportunities |
| Item 10 | New activity but very different from the last job |
| Vignette 02 | Opportunity to change daily life, habits, organization of own time and space in a different way. Willingness to learn new skills (e.g., activity, language) and discover new horizons. Possibility to move to a different city or country, or of a change in life course. |
| Factor 3—Easy Gliders | |
| Item 11 | Freedom to make plans, take opportunities as they come |
| Item 12 | Live from day to day |
| Item 13 | Have more time for family and relatives |
| Item 14 | Take time for yourself, to relax |
| Vignette 03 | Period of freedom, take things as they come, volition to not specify projects for the future. Do sports or leisure activities on one day and spend time with friends and family on another day, etc. Stay open to any opportunity, and live day by day without losing control of one’s own life. |
| Factor 4—Searchers | |
| Item 15 | Do not know what I will do |
| Item 16 | Have some ideas but not very convinced at the moment |
| Item 17 | Have not thought about what to do |
| Item 18 | Many plans but they are unattainable |
| Item 19 | Do not know what will happen |
| Item 20 | Frequent change of plans |
| Vignette 04 | Doubts and uncertainty about life as a retired person. Have considered different activities but am unable to find something that fits. A difficult but transitional situation and trust in being able to reach a new personal balance. Despite a relative apprehension concerning the future, am able to maintain a positive attitude. |
| Factor 5—Retreaters | |
| Item 21 | Being retired is something negative |
| Item 22 | Retirement is the end of my life |
| Item 23 | When I am retired I will be useless |
| Item 24 | Apprehensive about transition |
| Item 25 | Retirement means loneliness and boredom |
| Item 26 | Loss of benchmarks |
| Vignette 05 | Retirement represents a negative life stage without meaning. Preference for the past professional life. Retired people are seen as useless and retirement is perceived as a period of loneliness and boredom. Some plans for retirement but all unfeasible. No plans for occupation or leisure activities. |
Acknowledgments
The authors are grateful to the Swiss National Science Foundation for its financial support. The authors also thank Nancy Schlossberg for having reviewed the items and vignettes of the TRQ and for having reread a first version of this article.
Declaration of Conflicting Interests
The author(s) declared no potential conflicts of interest with respect to the research, authorship, and/or publication of this article.
Funding
This research was partially conducted within the framework of the Swiss National Competence Centre in Research LIVES, Project 7 entitled Professional trajectories: Impact of individual characteristics and resources, and cultural background led by Jérôme Rossier, which is financed by the Swiss National Science Foundation.