
Abstract
A review of empirical research on self-employment of individuals with disabilities in the United States found that success appears to be influenced most by three factors: accountability systems, level of supports, and individual characteristics. In the present study, a conceptual framework based on that review was tested on federal data on individuals with disabilities who had become successfully self-employed through Vocational Rehabilitation (VR) services. Data from all 50 states and the District of Columbia were analyzed using structural equation modeling. The initial model did not converge to an admissible solution; therefore, it was respecified. The subsequent model converged to an admissible solution, however, model fit varied across location and time. A number of factors yet remain to be uncovered and tested to explain these variations. The study concludes with a discussion of limitations, recommendations for further research, and implications for researchers, VR agencies, and policy makers.
Over the last four decades, the U.S. government has enacted numerous initiatives to improve employment outcomes, including self-employment, of individuals with disabilities. This effort has principally involved vocational rehabilitation (VR), codified in the Rehabilitation Act of 1973: “…empower individuals with disabilities to maximize employment, economic self-sufficiency, independence and inclusion and integration into society, and to ensure that the federal government plays a leadership role in promoting employment of individuals with disabilities” (20 U.S.C. §9201).
Since the late 1980s, VR client case-closure rates in self-employment have averaged between 2% and 3% nationally (Ipsen, Arnold, & Colling, 2005; Schriner & Neath, 1996). A recent examination of states’ rates by Revell, Smith, and Inge (2009) revealed that, in fiscal year (FY) 2007, Mississippi had the highest, 12.6%, followed by Wyoming, 7.9%, and Alaska, 6.0%. Also, in FY 2007, the national average weekly self-employment earnings of $396 were higher than the average of $350 for all VR employment closures. Although self-employment case closures in VR continue to remain rare, there are some emerging indicators of its viability as an alternative to other employment options (e.g., Griffin & Hammis, 2008). Interestingly, a recent report by the U.S. Bureau of Labor Statistics (2013) found individuals with a disability were self-employed at a higher rate, at 11.3%, than individuals without a disability, at 6.5%.
Yamamoto, Unruh, and Bullis (2012) conducted a comprehensive review of the U.S. empirical research literature on self-employment of individuals with disabilities. The authors found a small number of studies primarily focused on experiences and perspectives of individuals and service providers, particularly those of VR counselors. Based on their review, the authors posited that self-employment success appears to be most influenced by three factors: (a) individual characteristics, (b) accountability systems, and (c) level of supports.
In the present study, we examined those three factors more closely. The individual characteristics factor can include, but is not limited to, demographic variables such as ethnicity and gender, and personal traits such as motivation. Frequently cited by Yamamoto et al. (2012), these variables represent key personal characteristics in relationship to self-employment success for VR clients. Moreover, in a recent hierarchical generalized linear modeling analyses of national VR data, Yamamoto and Alverson (2013) found that ethnicity, gender, and level of education were not only statistically significant predictors of successful VR self-employment case closure but were also the predictors with the largest effects.
The accountability systems factor represents individuals’ obligations, responsibilities, and constraints in self-employment. These variables can include, but not limited to, organizational or agency policies (e.g., VR requirements for clients in self-employment), government laws and regulations, economic or specific market conditions (e.g., recessions in 2002 and 2008), and revenue/income from self-employment. Yamamoto et al. (2012) reviewed studies that found significant differences between VR counselors in rural and urban areas and their views on self-employment. These differences were explained, in part, by differences in agency policies and counselor flexibility for clients’ employment options. They also found differences among clients’ reasons for pursuing self-employment through VR.
The level of supports factor represents financial and other assistance to individuals in self-employment. These variables can include, but are not limited to, business capital or loans, medical health insurance, and specific individual disability-related services. Yamamoto et al. (2012) found that a number of studies cited serious concerns among VR counselors over the cost of self-employment cases compared to their other employment cases and over clients’ difficulties in obtaining external financial business support through conventional means, such as banks. Counselors also expressed willingness to share resources and expertise by collaborating with other agencies, such as the Small Business Development Centers, to support clients in self-employment, but indicated such collaborations were infrequent, citing interagency barriers.
Thus, given the prominent role of VR in the self-employment of individuals with disabilities, the purpose of this study was to further analyze the conceptual framework outlined by Yamamoto et al. (2012). Specifically, three a priori research questions were investigated: What is the relationship of accountability systems, individual characteristics, and level of supports to self-employment success? Does the relationship of accountability systems, individual characteristics, and level of supports to self-employment success differ over time? Does the relationship of accountability systems, individual characteristics, and level of supports to self-employment success differ by location?
Method
Data Collection
The Rehabilitation Services Administration was the source of VR data analyzed in this study. The annual RSA-911 data set contains data the agency collects and compiles from 50 states, District of Columbia (DC), and U.S. territories (RSA, 2005). For this study, the U.S. territories were excluded due to their legal and political differences. We selected FYs 2003–2007, the years between the two most recent recessions and, therefore, the most recent stable and typical period in the U.S. economy. The variables analyzed in this study were defined by the RSA.
Data Analysis
We utilized a two-step process in analyzing the RSA data. First, these data were screened for distributional statistical assumptions. Second, these data were statistically analyzed using structural equation modeling (SEM) to answer the three a priori research questions.
Data screening
We screened each FY data set by inspecting cases and variables for impossible values; then variables were screened for SEM distributional assumptions. Data were also screened for missing values to determine the amount and nature of missing data. Participant characteristics were very similar across the FYs: majority male (54% in each FY), White (ranging from 73% to 77%), high school level education or less (57–61%), and with a significant disability (91–93%).
SEM statistical modeling
Confirmatory factor analysis (CFA), a well-known type of SEM, was used to analyze the three factors of VR self-employment success: (a) accountability systems, (b) individual characteristics, and (c) level of supports. Only VR clients with disabilities who achieved successful case closure in self-employment were included. From FY 2003–2007, total successful self-employment case closures ranged between 202,000 and 215,000. Typically, but not always, successful case closure can occur after at least 90 consecutive days of stable employment, which is determined by the VR case counselor. The use of CFA in this study was appropriate to test the hypothesized relationship among the three factors of successful VR self-employment case closure because these factors were latent theoretical constructs (see Byrne, 1998). The AMOS 17.0.2 statistics software (Arbuckle, 2008) was used to conduct the analysis.
A full latent variable CFA model was specified and tested, with a measurement model linking observed variables or indicators to a factor and a structural model linking the three factors to each other (see Byrne, 1998). Each indicator represented some hypothesized facet of the underlying latent factor. Three indicators were linked to (or specified for) accountability systems: total cost of VR services, hours worked at closure, and average weekly wages at closure. These three variables were selected from the RSA data as facets of obligation and responsibility (i.e., accountability). Four indicators were specified for individual characteristics: ethnicity, gender, educational attainment, and significant disability status. These demographic variables from the RSA data were chosen because of their known importance across numerous socioeconomic outcomes. Three indicators were specified for level of supports: number of VR services received, public supports (e.g., Social Security Disability Insurance [SSDI]), and medical supports (e.g., health insurance). These variables from the RSA data were chosen as facets of support and the types of assistance typically received by VR clients in self-employment cases.
With 10 measured variables, 10(10 + 1)/2 = 55 variances and covariances were estimable (see Byrne, 1998). In the model, 19 parameters were estimated: 7 direct regression paths from indicators to factors (loadings), 6 indicator residual variances, 3 factor covariances, and 3 factor variances. One regression path for each factor was fixed to 1.0, the “unit-loading identification” constraint (Kline, 2005) required for unstandardized coefficients model identification and scaling. Residual variances for categorical indicators were also constrained to 1.0 (Arbuckle, 2008, 2009). Constraints were not estimated. Model degrees of freedom (df ) were computed as 36 (55 − 19) producing a recursive model, overidentified with more data observations (df ) than parameters freely estimated, which is required for an admissible solution (Byrne, 1998; Kline, 2005). All model parameters were estimated with Bayesian estimation using the Markov Chain Monte Carlo algorithm (Arbuckle, 2009).
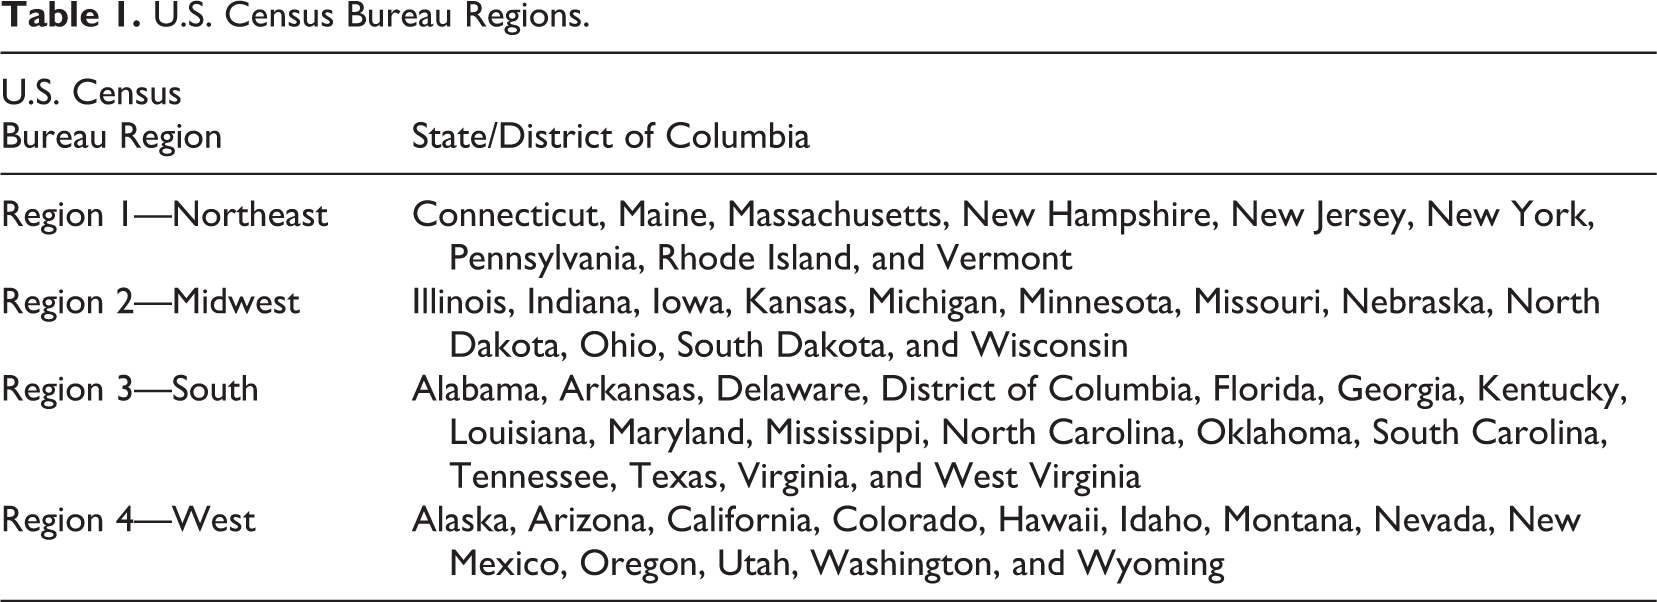
To answer the three a priori research questions, the CFA model testing comprised two steps. First, a national model was tested in each FY, to answer how the three factors were related to successful VR case closure in self-employment. The three-factor CFA model is depicted in Figure 1. Then, in the second step, the model in each FY was tested for invariance across the four U.S. Census Bureau Regions (2010): South, Midwest, Northeast, and West. Table 1 lists the states and DC by their corresponding region.

Three-factor CFA model of VR self-employment success for clients with disabilities from FY 2003 to FY 2007. CFA = confirmatory factor analysis; VR = vocational rehabilitation; FY = fiscal year.
U.S. Census Bureau Regions.
Applying the linear structural relationships or LISREL symbolic notation (Jöreskog & van Thillo, 1972; Jöreskog & Sörbom, 2009), the general LISREL model for this CFA was 
Model testing in SEM is used “to determine the goodness of fit between the hypothesized model and the sample data…there will necessarily be a discrepancy between the two” (Byrne, 1998, p. 7). Across the five FYs, the national CFA model was assessed on four widely recommended SEM goodness-of-fit indexes: (a) Pearson’s likelihood χ2, (b) comparative fit index (CFI), (c) root mean square error of approximation (RMSEA), and (d) standardized root mean square residual (SRMR). Each fit index examines a different model part and assigns a value unique to that index as a measure of how well the model fits the data (Arbuckle, 2009; Byrne, 1998; Hu & Bentler, 1999; McDonald & Ho, 2002).
The Pearson’s likelihood χ2 or model χ2 tests the fit between the restricted covariance matrix, representing the hypothesized structure of relationships among the variables, and the unrestricted sample covariance matrix, representing actual relationships among variables in the observed data (Arbuckle, 2009; Byrne, 1998). As χ2 value increases, model fit becomes worse. This statistic, however, is highly sensitive to large sample sizes (Byrne, 1998; Kline, 2005). The model χ2 df is a measure of model parsimony (Arbuckle, 2009). The associated p value indicates whether the specified model should be rejected as a test of the null hypothesis that the model has perfect fit (Byrne, 1998; Kline, 2005). CFI indicates improved fit of the specified model over the baseline or independence model, which assumes no population covariances among observed variables, with CFI of .90 or greater indicating good fit (Hu & Bentler, 1999). RMSEA measures the discrepancy between the population covariance matrix and specified model (Byrne, 1998), with values less than .05 indicating good fit, .05–.08 indicating reasonable fit, and .10 or greater indicating poor fit (McDonald & Ho, 2002). SRMR measures “the mean absolute correlation residual, the overall difference between the observed and predicted correlations” (Kline, 2005, p. 141), with less than .10 “generally considered favorable” (Kline, 2005, p. 141).
Invariance testing comprises hierarchical steps in fixing certain parameters to be equal across comparison groups and determining whether model fit significantly changes (Arbuckle, 2009; Cheung & Rensvold, 2002; Hoyle & Smith, 1994). The model invariance testing in this study involved several steps: (1) allowing freely estimated parameters across the four regions, (2) fixing factor loadings, (3) fixing factor covariances and variances, and (4) fixing residual variances. Each step beginning with (3) included keeping the previous fixed step/steps in place. In Step 3, factor variances and covariances were fixed to be equal across the regions, and factor loadings from Step 2 were also kept fixed. Each step was compared with the previous step for model-fit change using χ2 and df, CFI, and RMSEA (see Byrne, 1998; Cheung & Rensvold, 2002; McDonald & Ho, 2002). The SRMR index was not used because it was unavailable in the AMOS 17.0.2 (Arbuckle, 2008) software.
Statistical significance, or α, was first set at .01 because of the exploratory nature of this study, proactively addressing nonnormality and minimizing Type I error (see Kerlinger & Lee, 2000; Pedhazur & Schmelkin, 1991). This α needed further correction in the invariance models because of multiple testing on the same data (see Keppel & Wickens, 2004).
Results
Data Screening
Data screening revealed that 1–3% of the RSA data across all five FYs were missing at random (Schafer & Graham, 2002). Missing values were imputed using multiple imputation (see Schafer & Graham, 2002) in the software program, PASW Statistics GradPack 17.0 for Windows Missing Values Analysis (SPSS Inc., 2009).
SEM
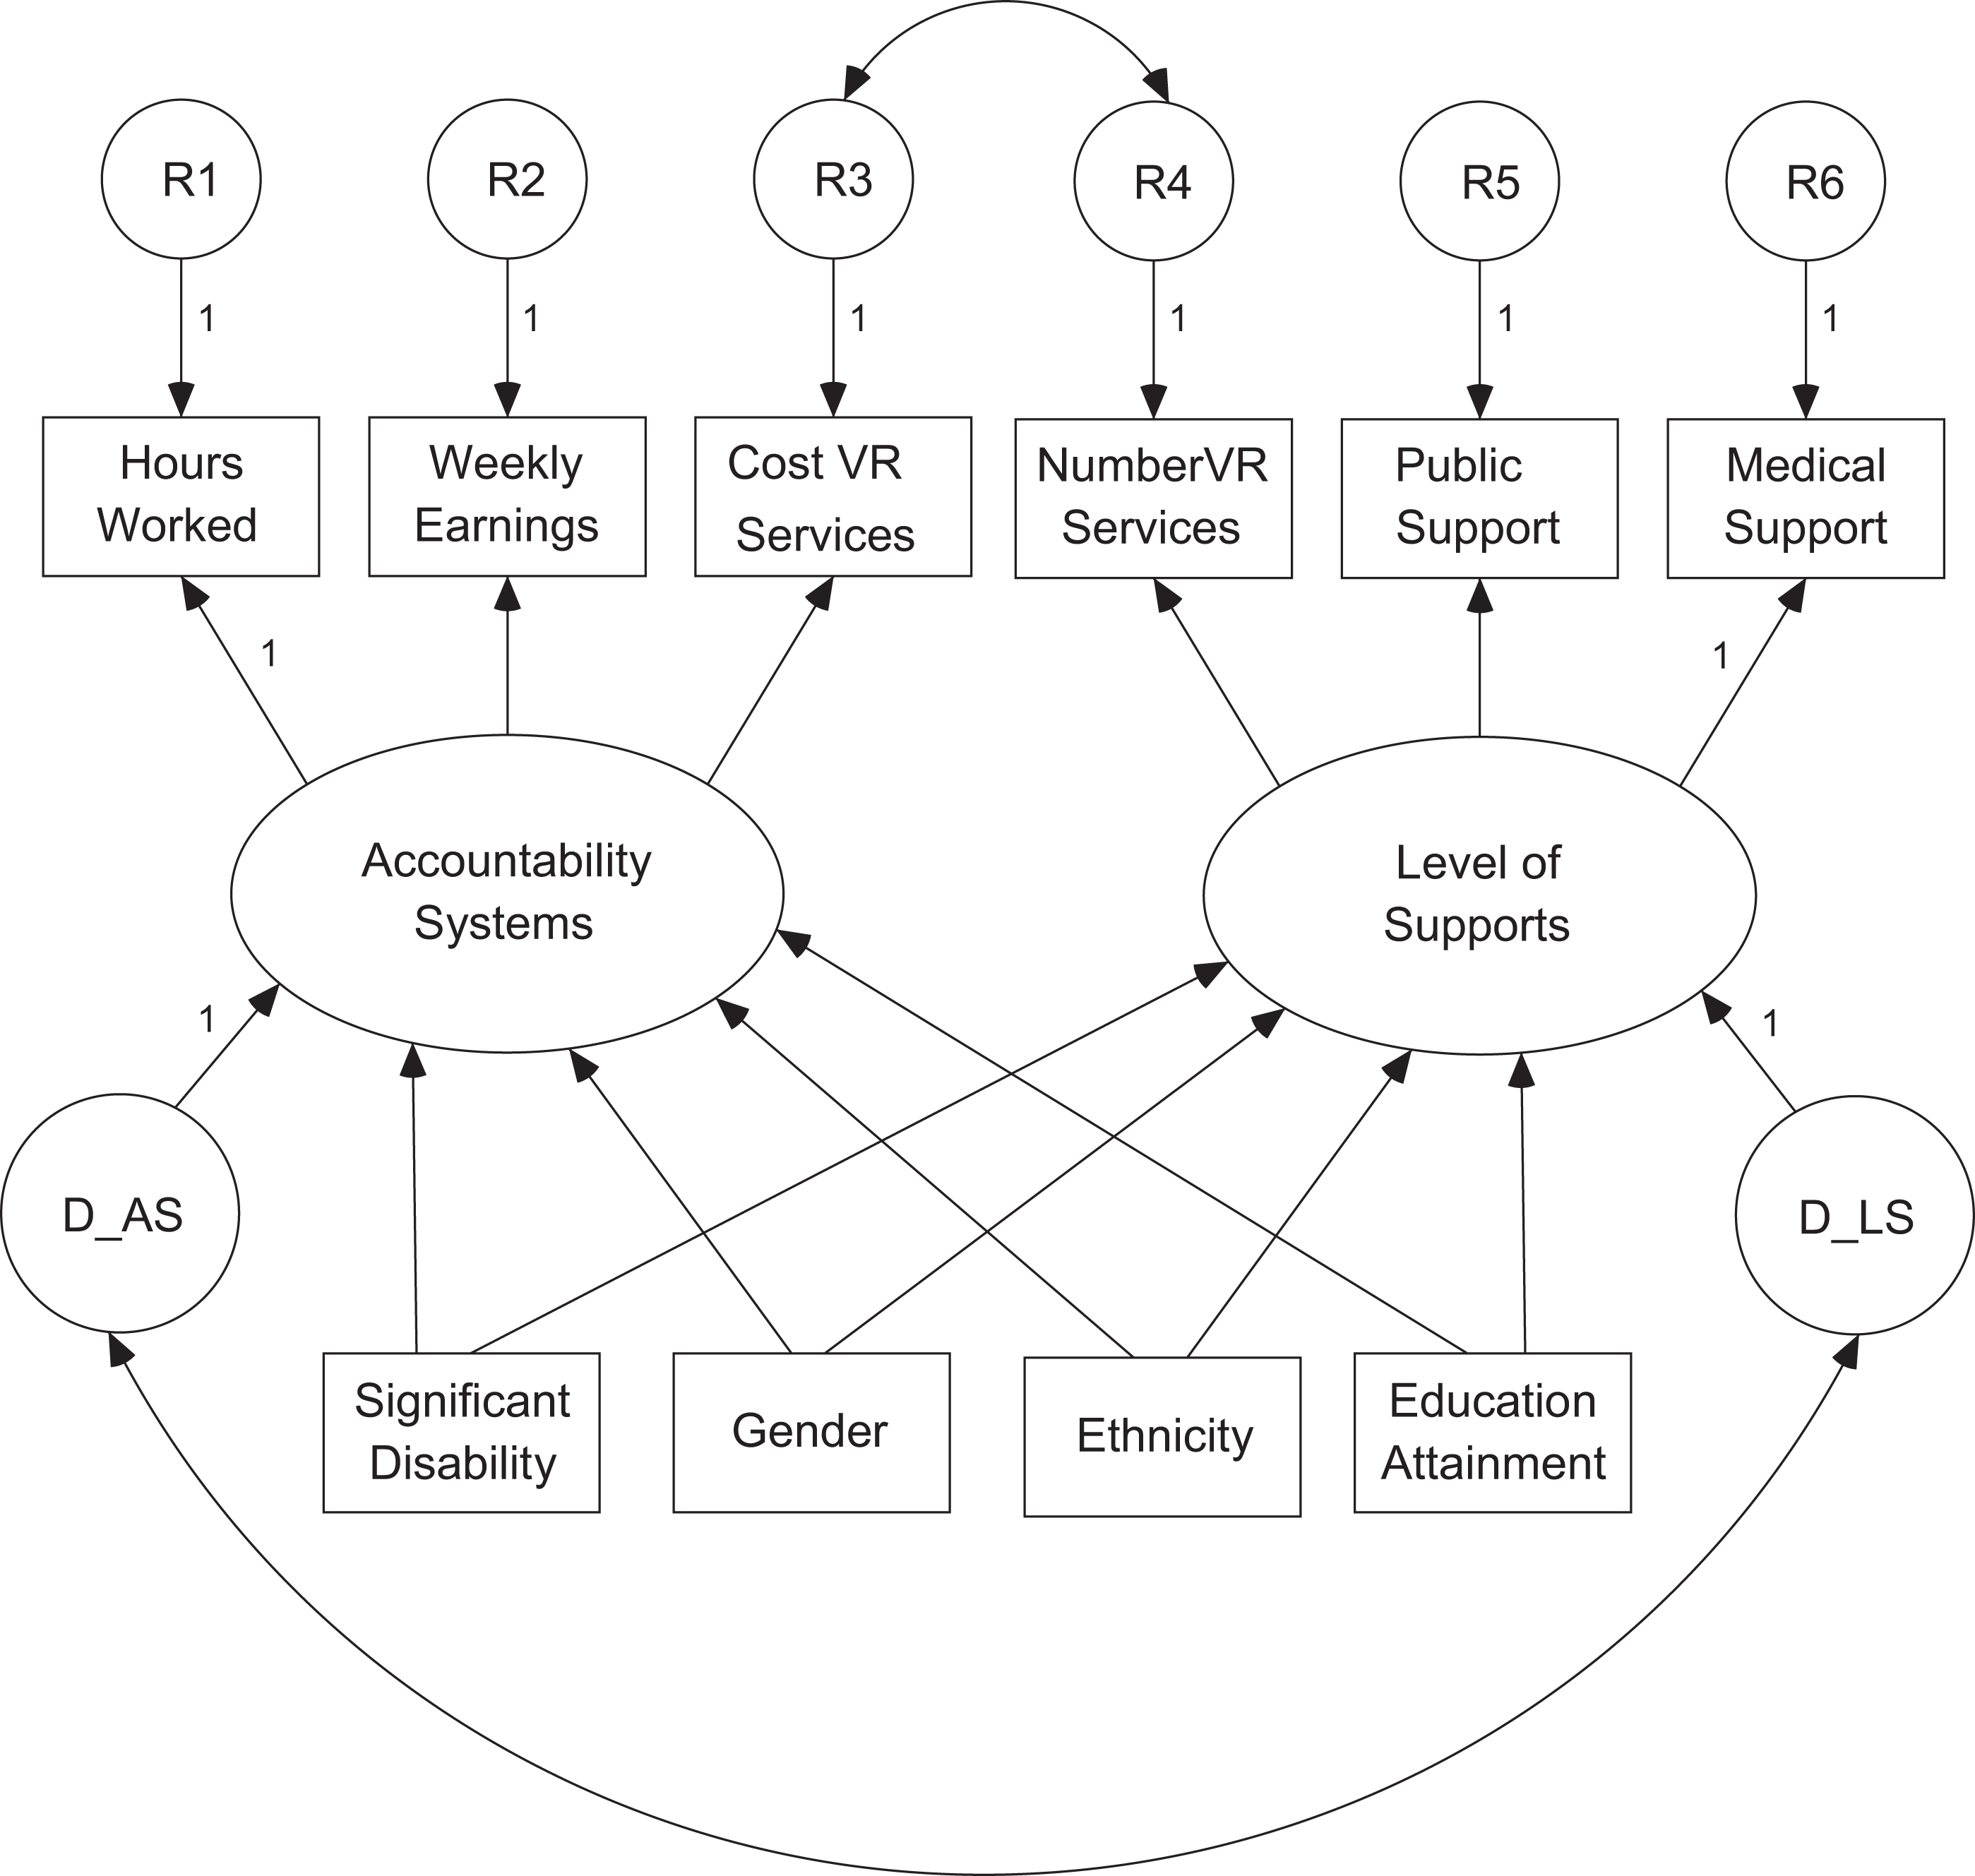
The three-factor CFA model produced an inadmissible solution (see Arbuckle, 2008), indicating problems of improper estimates (Jöreskog & Sörbom, 1984). Therefore, model respecification was necessary (see Arbuckle, 2009; Byrne, 1998). Accountability systems and level of supports factors were retained. The individual characteristics factor, however, was removed, but its four indicators were retained and each respecified as exogenous (previously endogenous) variables, with regression paths to the two factors and respecified not to intercorrelate. The two factors were respecified as both exogenous and endogenous variables with disturbances, which are residuals for endogenous variables (Byrne, 1998). The unit-loading constraints of 1.0 were applied to the paths from disturbances to factors, required for scaling and identification. Disturbances were specified to correlate, reflecting the assumption that “…the factors have common omitted causes” (Kline, 2005, p. 308). Residuals for cost of VR services and number of VR services were also specified to correlate. This respecified model is known in SEM as “multiple indicators and multiple causes” or MIMIC (see Kline, 2005), presented in Figure 2. This model was analyzed in the AMOS 17.0.2 statistics software (Arbuckle, 2008) and parameters were estimated with maximum likelihood (see Arbuckle, 2008).
MIMIC model of VR self-employment success for clients with disabilities from FY 2003 to FY 2007. MIMIC = multiple indicators and multiple causes; VR = vocational rehabilitation; FY = fiscal year.
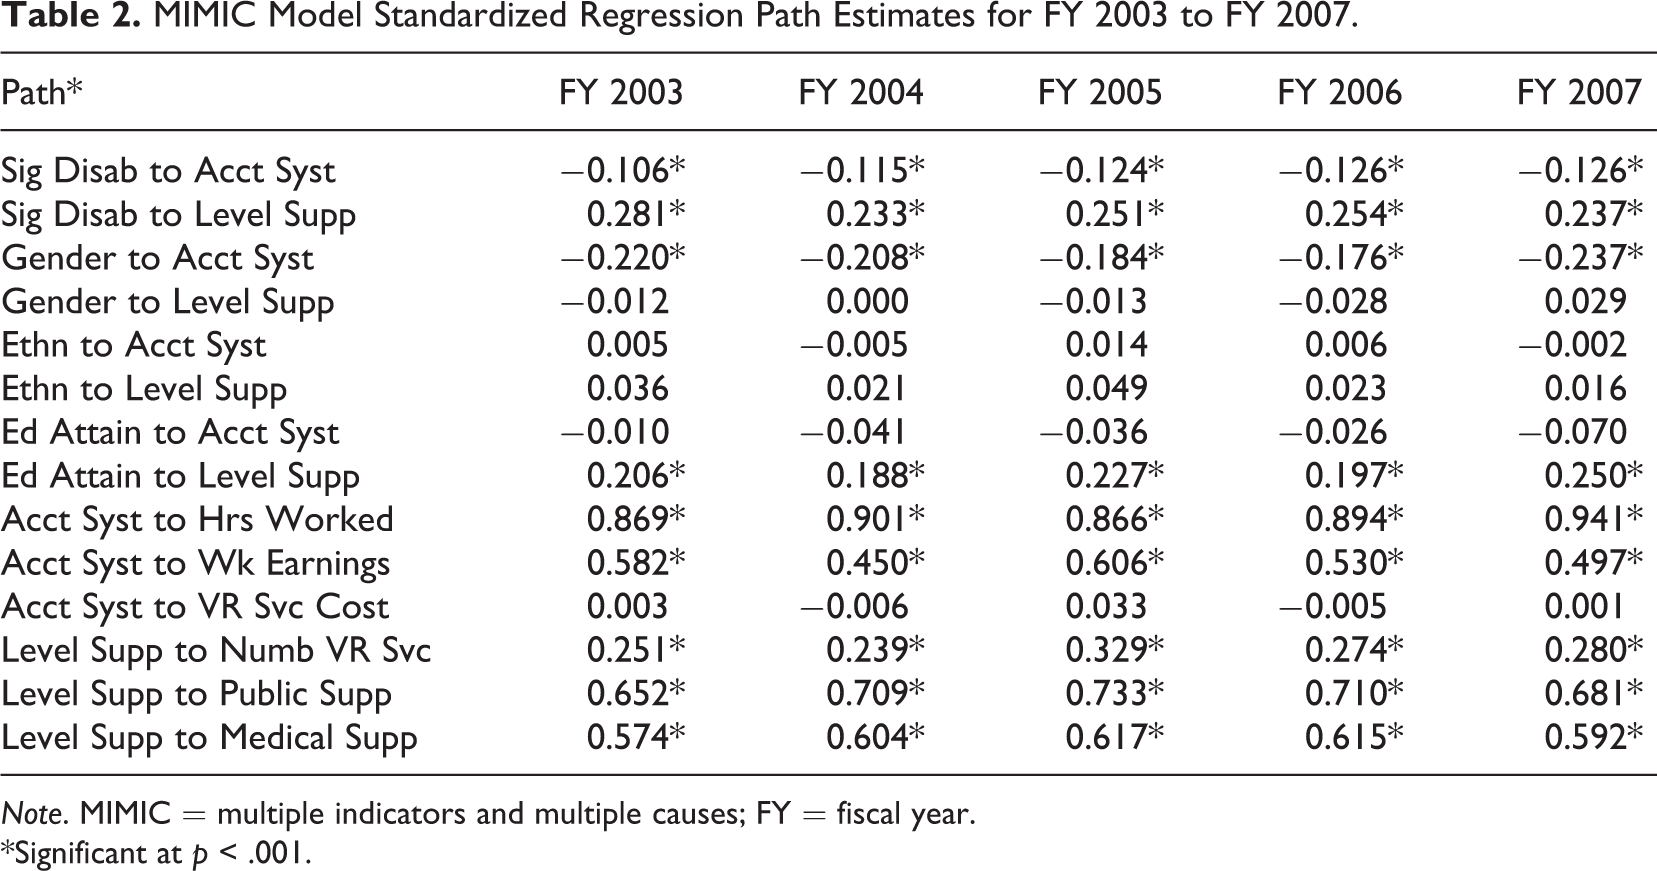
MIMIC Model Standardized Regression Path Estimates for FY 2003 to FY 2007.
Note. MIMIC = multiple indicators and multiple causes; FY = fiscal year.
*Significant at p < .001.
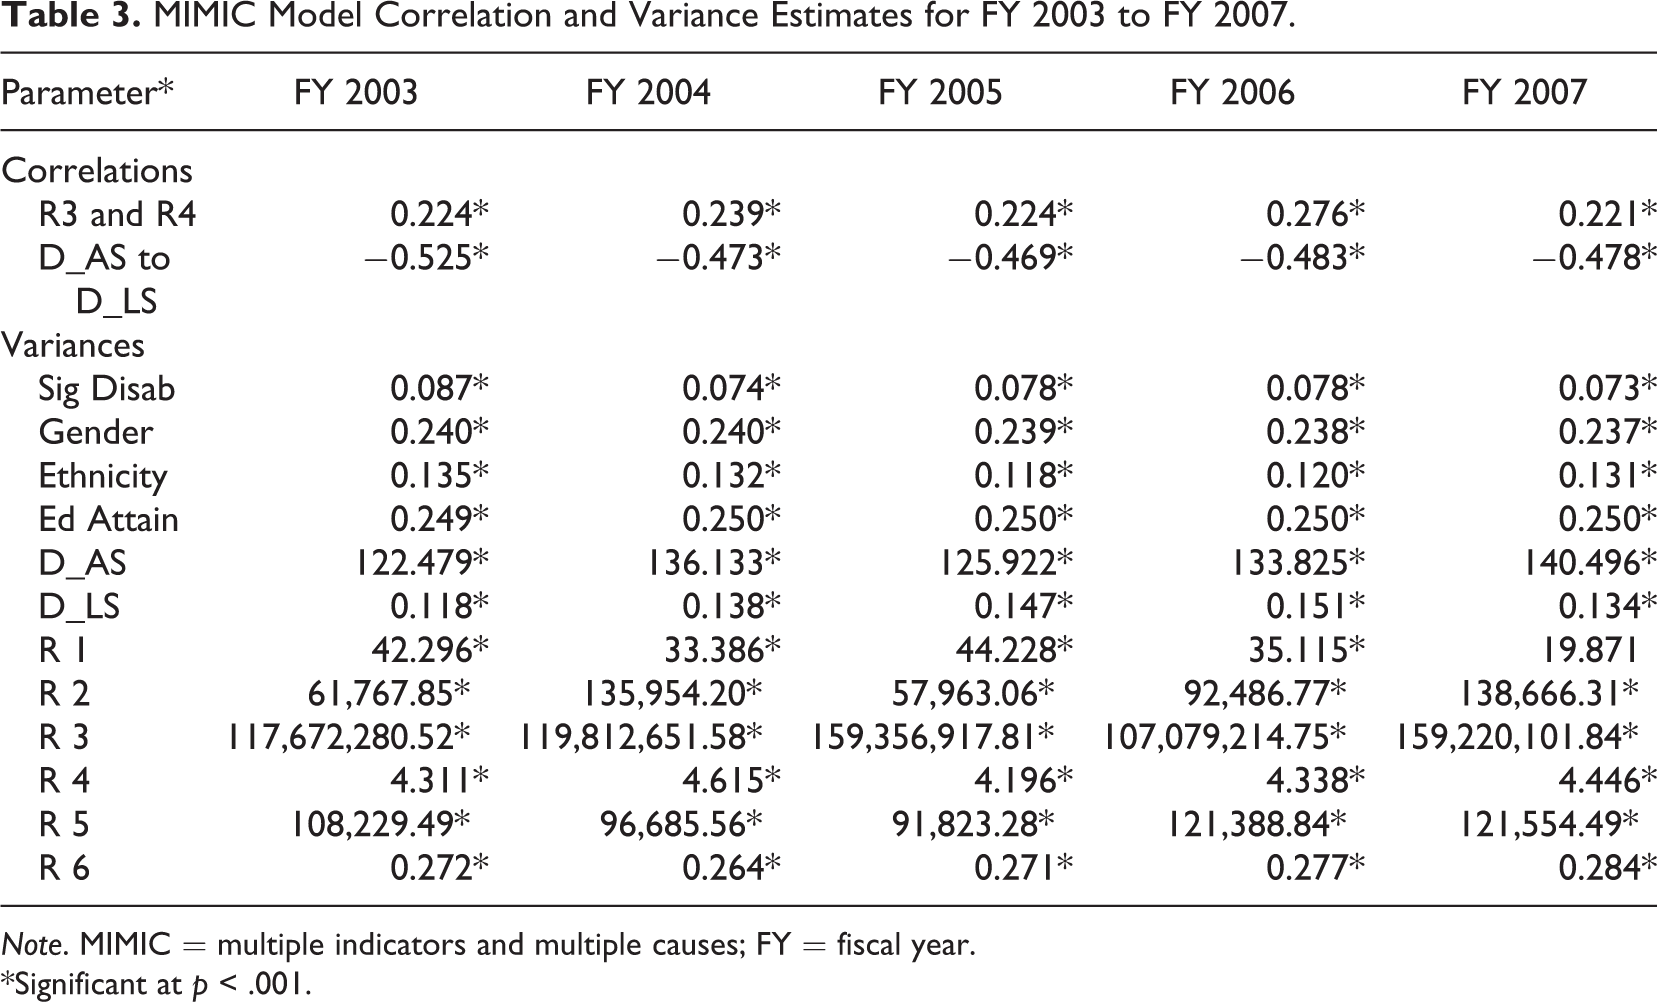
MIMIC Model Correlation and Variance Estimates for FY 2003 to FY 2007.
Note. MIMIC = multiple indicators and multiple causes; FY = fiscal year.
*Significant at p < .001.
MIMIC Model Squared Multiple Correlations for FY 2003 to FY 2007.
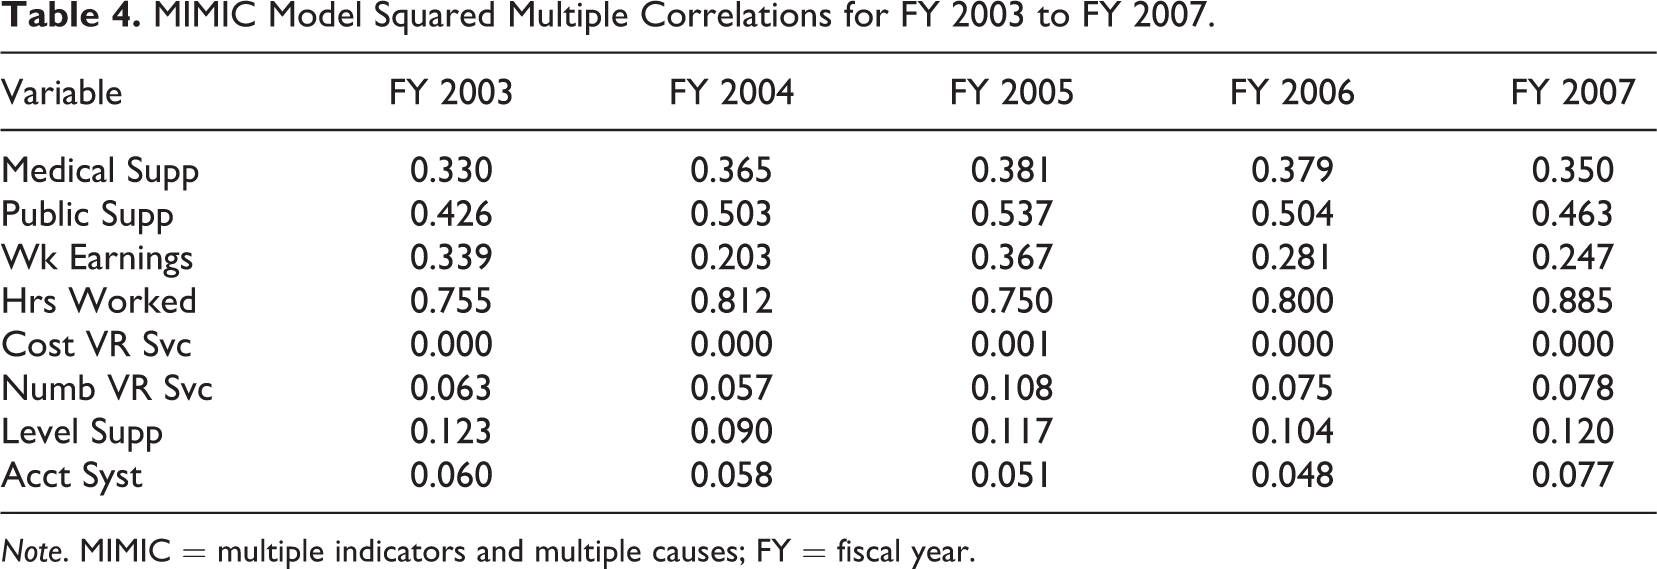
Note. MIMIC = multiple indicators and multiple causes; FY = fiscal year.
MIMIC Model Fit Statistics for FY 2003 to FY 2007.

Note. MIMIC = multiple indicators and multiple causes; FY = fiscal year; CFI = comparative fit index; RMSEA = root mean square error of approximation; SRMR = standardized root mean square residual; df = degrees of freedom.
Squared multiple correlations represent variances explained (i.e., effect size) for the endogenous variables, factors, and indicators across the FYs. Explained variances for level of supports (ranged from 9% to 12%) and accountability systems (5–8%), were small. Explained variances for medical supports (33–38%) and weekly earnings (20–37%) were moderate, whereas explained variances for public supports (43–54%) and hours worked (75–88%) were substantial. Conversely, the number of VR services (6–11%) had a small amount of variance explained, and the cost of VR services (less than 1%) had close to none.
MIMIC Model Invariance Results for FY 2003.

Note. MIMIC = multiple indicators and multiple causes; FY = fiscal year; CFI = comparative fit index; RMSEA = root mean square error of approximation; df = degrees of freedom.
In 2004, the results of which are presented in Table 7, the first step of the invariance test indicated reasonable model fit. Step 2 indicated some misfit. A small change in CFI occurred, but a significant change in χ2 indicated the regions had become significantly different in model fit. Step 3 indicated increasing misfit. Small changes in CFI and RMSEA indicated no significant change in fit. Step 4 indicated poor fit; therefore, further testing was unnecessary.
MIMIC Model Invariance Results for FY 2004.
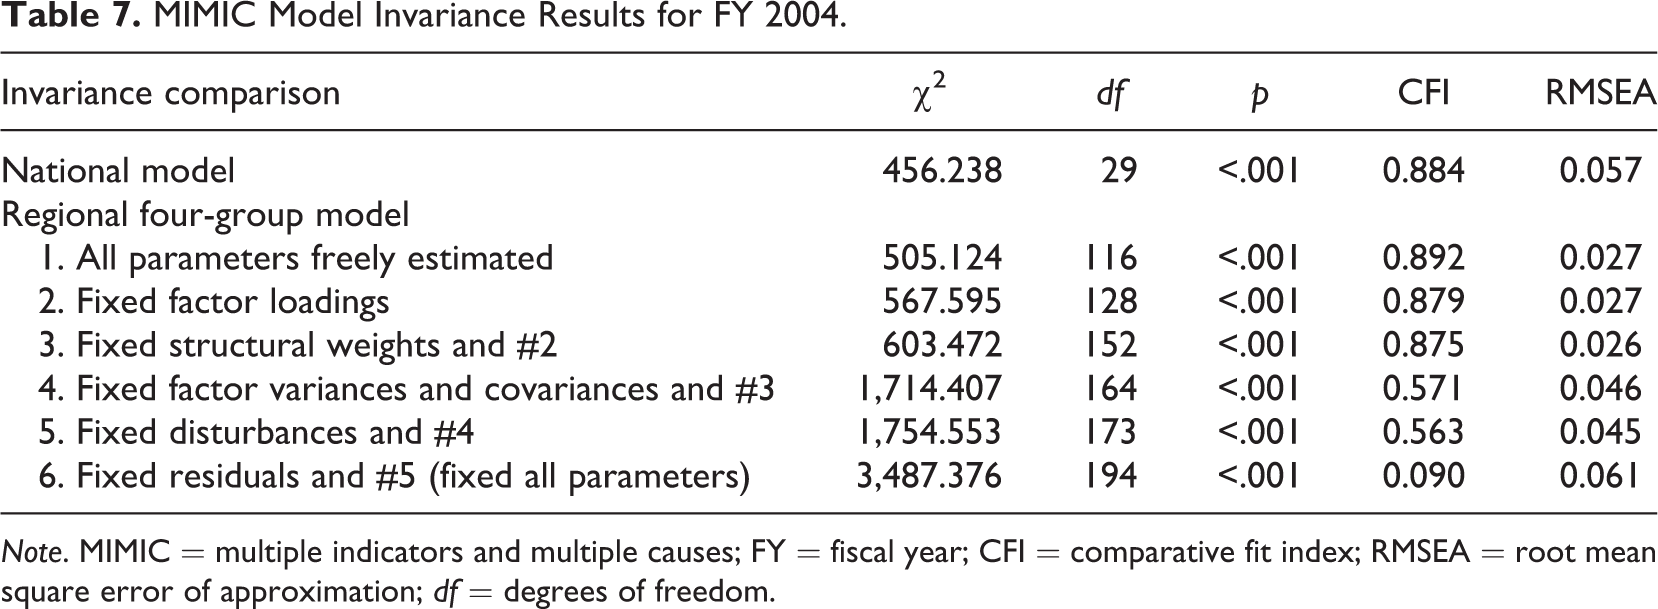
Note. MIMIC = multiple indicators and multiple causes; FY = fiscal year; CFI = comparative fit index; RMSEA = root mean square error of approximation; df = degrees of freedom.
In 2005, the results of which are presented in Table 8, the first step of the invariance test indicated reasonable model fit. Step 2 indicated some misfit. Small changes in CFI and RMSEA occurred, but a change in χ2 indicated the regions had become significantly different in fit. Step 3 indicated increasing misfit. Small change in CFI and χ2 indicated no significant change in fit. Step 4 indicated poor fit; therefore, further testing was unnecessary.
MIMIC Model Invariance Results for FY 2005.
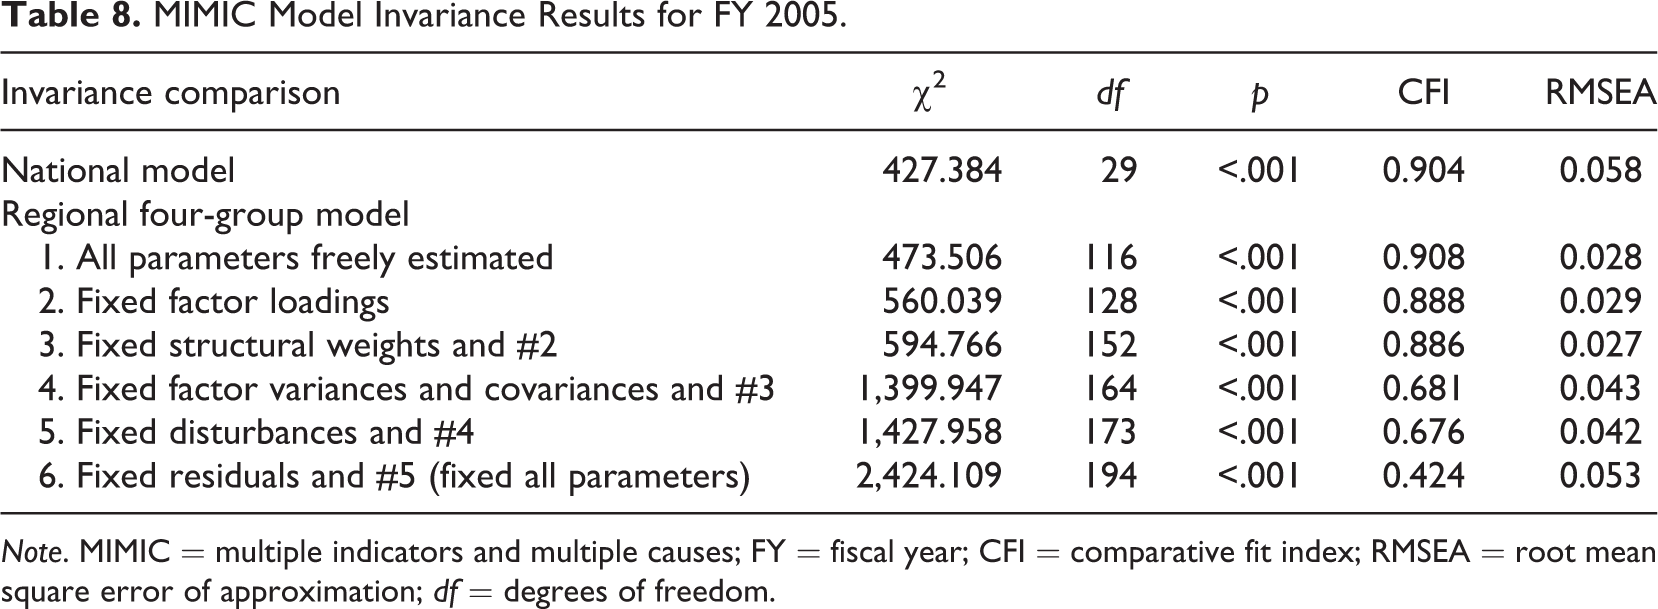
Note. MIMIC = multiple indicators and multiple causes; FY = fiscal year; CFI = comparative fit index; RMSEA = root mean square error of approximation; df = degrees of freedom.
In 2006, the results of which are presented in Table 9, first step of the invariance test indicated some model misfit. Step 2 indicated model misfit. A small change in CFI but significant change in χ2 indicated the regions had become significantly different in fit. Step 3 indicated increasing misfit. Small changes in CFI, RMSEA, and χ2 indicated no significant change. Step 4 indicated poor fit; therefore, further testing was unnecessary.
MIMIC Model Invariance Results for FY 2006.

Note. MIMIC = multiple indicators and multiple causes; FY = fiscal year; CFI = comparative fit index; RMSEA = root mean square error of approximation; df = degrees of freedom.
In 2007, the results of which are presented in Table 10, the first step of the invariance test indicated some misfit. Step 2 indicated further misfit. A small change in CFI but significant change in χ2 indicated the regions had become significantly different in fit. Step 3 results indicated increasing misfit. Small changes in CFI, RMSEA, and χ2 indicated no significant change in fit. Step 4 results indicated poor fit; therefore, further testing was unnecessary.
MIMIC Model Invariance Results for FY 2007.

Note. MIMIC = multiple indicators and multiple causes; FY = fiscal year; CFI = comparative fit index; RMSEA = root mean square error of approximation; df = degrees of freedom.
The national and regional VR self-employment case closure totals in each FY are presented in Table 11. The largest number of VR self-employment closures was 4,867 in 2003; the smallest was 3,889 in 2007. The region with the largest closure total was the South, with 2,339 in 2003. The South also maintained the highest closure rates across the FYs, with the highest in FY 2003 (1.09%) and 2004 (1.08%). These rates, displayed in Figure 3, are based on the total number of successful VR self-employment case closures divided by the total number of successful VR case closures for all employment outcomes.
National and Regional Self-Employment Closures for FY 2003 to FY 2007.

Note. FY = fiscal year.
aIncludes all vocational rehabilitation (VR) employment closures.

Successful VR self-employment case-closure rate (%) by U.S. Census Bureau Region and fiscal year. VR = vocational rehabilitation.
Discussion
The purpose of this study was to analyze factors most influential in a successful VR self-employment case closure. We now turn to a discussion of the results, limitations of this study, recommendations for further research, and implications for stakeholders.
Research Question 1
This question asked, “What is the relationship of accountability systems, individual characteristics, and level of supports to self-employment success?” The initial CFA model was an inadmissible solution, which meant that impossible values, such as negative variances and correlations greater than 1, had been found. The model then had to be respecified, but based on theory rather than on “fishing” the data until the best possible statistical model was found. That approach is standard accepted practice, which allows results to be meaningful beyond the study that produced them (MacCallum, Roznowksi, & Necowitz, 1992). The respecified MIMIC model produced an admissible solution with reasonable, though not excellent, model fit in each FY, best in 2005 and worst in 2007. The overall conceptual framework of this study, thus, remains somewhat intact, but further research investigation of the MIMIC model is needed.
Research Question 2
This question asked, “Does the relationship of accountability systems, individual characteristics, and level of supports to self-employment success differ over time?” The results of this study indicate the MIMIC model differs over time, with indications of more model misfit in FY 2006 and FY 2007. McDonald and Ho (2002) assert “the presence of categorical variables or indicators may cause nonnormality” (p. 70); however, “ML estimation and its associated statistics seem fairly robust against nonnormality” (p. 70). That is, the misfit in 2006 and 2007 is more likely found in model misspecification than variable type. The model captured some aspect of the relationship of individual characteristics, level of supports, and accountability systems to successful VR self-employment closure, but also left much of that relationship unexplained.
Notably across all five FYs, the same regression paths were significant (p < .001) for the exogenous variables predicting the two factors, the paths (i.e., structural weights) from significant disability to accountability systems and significant disability to level of supports. Possible explanations for these findings are (a) VR clients without a significant disability were working longer hours and had different motivations related to a number of gains from self-employment and (b) services and public supports were more likely to accrue for clients with a significant disability due to increased support needs. The significant path from gender to accountability systems suggests male clients were significantly more likely to predict accountability systems. That is, they were likely to be working more hours and having higher average weekly earnings than female clients. The significant path from educational attainment to level of supports suggests clients with post high-school education, on average, could have had greater access to information about and awareness of VR and public services, and, thus, more likely advocate for those needs than clients with high school education level or less.
Across all five FYs, the same factor loadings were significant (p < .001), from level of supports to number of VR services; level of supports to public supports; and level of supports to medical supports. The moderately high loadings for public supports and medical supports indicate they were capturing some important facets of the factor. Having all high factor loadings would represent strong evidence for convergent validity (Byrne, 1998; Kline, 2005). Such evidence, however, is lacking here, indicating model misspecification of indicators with factors and factor structure. In this model, the number of VR services did not seem to cohere as well with public supports (e.g., SSDI) or medical supports (e.g., health insurance) as they did with each other, reflecting a possible a difference between services to clients that are external versus internal to VR. This also suggests that the number of VR services is not a facet of level of supports, but instead, a facet of accountability systems.
The factor loadings of accountability systems and its indicator variables follow a pattern similar to those of level of supports and its indicators (described previously): two indicators with moderate to high loadings but a third that is not. Thus, again, the evidence for convergent validity is lacking. For accountability systems, the residual of its lowest loading indicator, cost of VR services (very miniscule loading), was correlated with the residual for number of VR services, the low-loading indicator of level of supports. The misspecification of these indicators for these two factors is apparent. The cost of VR services for clients probably does not represent a facet of accountability systems. Rather, it is more likely a facet of level of supports, of how much in sheer dollar amounts was spent on a client’s successful self-employment case closure, rather than how much responsibility or obligation for a successful case closure is represented in the dollar amount expended by VR for its clients’ services.
Correlations were significant (p < .001) for the same variables across the FYs. The correlation between residual terms for cost of VR services and number of VR services represent the assumed, albeit modest, association. The negative correlation between the disturbance terms for accountability systems and level of supports indicates common but unanalyzed and external (i.e., outside the model) sources that “caused” these factors (see Kline, 2005). These significant correlations, linking the two factors together in the MIMIC model, suggest that they are related to each other in some way, but just not explained more precisely by the model.
The variances were significant (p < .001) for the same variables across the FYs. The large variances of the disturbances indicate that much more of the variance of accountability systems was unexplained by the model. This means there were other, as yet unidentified, variables influencing accountability systems in VR self-employment. In addition, the four exogenous predictors accounted for more of the explained variance for the level of supports factor, even after accounting for the correlation of the disturbance terms.
Research Question 3
This question asked, “Does the relationship of accountability systems, individual characteristics, and level of supports to self-employment success differ by location?” From 2003 to 2007, the MIMIC model indicated reasonable fit nationally, but not regionally. State-specific effects were present, but they were only indirectly measured as residual variance or as unanalyzed (i.e., external) sources of model variation. The model misfit may also be related to differences in sample size across the regions. For example, in 2006, the number of successful self-employment case closures in Region 3 South (n = 2,004) was more than double the number in Region 2 Midwest (n = 820), more than triple the number in Region 4 West (n = 616), and more than quadruple the number in Region 1 Northeast (n = 463). These regional effects could be explained by any number of economic, social, cultural, and political factors. For example, Yamamoto et al. (2012) reported differences among rural and urban VR populations, the availability of other employment options, and VR counselors’ differing beliefs about their clients’ pursuit of self-employment.
The significant worsening of MIMIC model fit after Step 2 of invariance test demonstrated the regions differed, and previous studies (e.g., Revell, Smith, & Inge, 2009) also reported differences among states in other VR employment outcomes. That the MIMIC model had reasonably good fit only when parameters were allowed to freely vary across regions (i.e., Step 1 of the invariance test) indicates several different MIMIC models may fit the data. At this point, how the MIMIC model differs as a function of time and region is just beginning to be uncovered.
Limitations of This Study
The maximum likelihood estimation used for model parameters in the invariance testing is robust against nonnormality (McDonald & Ho, 2002), but works best for large samples, especially in regression (e.g., SEM) types of analyses (Kline, 2005; Tabachnick & Fidell, 2007). Although the national data analyzed here represent the population of VR case closures in self-employment, sample size is relevant for the invariance testing where certain regions (e.g., Northeast and West), had much smaller samples in all 5 years. Although a stringent α was applied, the use of robust standard errors and corrected statistics (e.g., Satorra–Bentler), or the asymptotic distribution free estimation may be needed in future MIMIC modeling of the RSA data if nonnormality is severe (see Kline, 2005). This was the first study to test Yamamoto et al.’s (2012) conceptual framework with SEM. While some evidence of construct validity may be present, it is tenuous at this point. We acknowledge that technical and conceptual aspects of the analytic design and method could require closer scrutiny and some adjustments in future SEM testing of the conceptual framework with the RSA data. This includes the definition of self-employment success, which in this study was limited to the VR definition of successful case closure and not defined over a longer term (i.e., years not months).
Another limitation is the limited number and types of RSA variables as indicators for the factors of accountability systems, individual characteristics, and level of supports. Other variables, not yet identified, may represent important facets of one or more of these factors. There may also be facets of the factors (e.g., regional indicators) that are not represented by variables available in the RSA data but nevertheless need to be analyzed. Conclusions drawn from this study are tentative. No causal inferences could be or should be drawn. This initial investigation is simply a starting context for understanding VR self-employment.
Finally, any analysis of extant data is limited to the variables and structure of the data set. We had no control over data collection or entry procedures by the RSA. Given that “reliability and validity are attributes of scores in a particular sample, not measures” (Kline, 2005, p. 58), we believe the interpretations we made to be accurate within the limited scope and constraints of this study. Moreover, the model misspecification we identified in the results gives an indication of the degree of measurement error across the models.
Recommendations for Further Research
This study, using SEM to analyze latent factors of national VR data on self-employment of individuals with disabilities in the United States based on a conceptual framework from a recent review of empirical research literature, invariably leaves a number of compelling areas to be explored. First, this line of inquiry could be further developed by an expanded review and synthesis of relevant literature beyond vocational and disability intervention. This could occur, for example, by investigating the role disability plays in employment success and understanding the influence of career education and development on shaping the choices or decisions individuals make about employment options and career pursuits (Ritter et al., 2014; Szymanski & Parker, 2010).
Second, different factor indicators and structures should be examined. Equivalent models, which were not examined in this study, could also be tested. These are models that do not differ in fit from the original model, but are “represented by different relationships among the variables” (MacCallum, Wegener, Uchino, & Fabrigar, 1993, p. 185), which change interpretations and meaning of the model structure (MacCallum et al., 1993). In addition, modification indices from this study could be used to derive a different set of a priori research questions or hypotheses, which then could be tested and cross-validated on future RSA data (i.e., FY 2008–2012), especially for invariance testing across U.S. regions or states. Such a process would not only avoid capitalizing on chance (See MacCallum et al., 1992) but also likely uncover important findings and improve model fit. As Gelman (2007) notes, “All models are wrong, and the purpose of model checking (as we understand it) is not to reject a model but rather to understand the ways in which it does not fit the data” (p. 349).
Finally, further research should clarify and increase our understanding of how the three factors of individual characteristics, accountability systems, and level of supports relate to successful VR self-employment closure, given the impact of recent fiscal and political changes. Knowing there are disparities in employment opportunities and outcomes between men and women, and between high school and college graduates, researchers can more closely examine the interaction of gender, disability, and educational attainment and their relationship to the level of supports factor. This would involve testing model invariance across and within the four regions for individual characteristics to examine differences in the levels of funding or other service supports to these groups. The fact that the MIMIC model demonstrated yearly and regional variations could also guide future research to uncover new variables and factor structures. These new analyses may lead to models used to develop and test theories, resulting in a clearer understanding of VR self-employment and the potential for improving outcomes. Such a process is a necessary part of scientific research, particularly in this sparse area of inquiry.
Implications of This Study
Implications for policy makers
The implications of this study are broadest for policy makers than the other stakeholder groups. One implication pertains to the relationship between the factors of accountability systems and level of supports. Given the fiscal challenges states continue to face, then knowing the amount of resources that are typically used to support clients in self-employment provides a concrete empirical basis from which to develop or change service provision or resource allocation—using data for decision making (e.g., cost–benefit analyses). Data showing that certain regions and states have had consistently higher VR case-closure rates in self-employment could also prompt an examination of policies to learn how and why those rates are occurring. An analysis at the state level also presents an opportunity for cross-state sharing and helping VR maximize its limited resources.
The fact that VR’s self-employment case-closure rates have remained unchanged in nearly three decades while the self-employment rates for individuals with disabilities have been higher outside the VR system (President’s Committee on Employment of People with Disabilities, 2000) leads to these questions: What is happening outside the VR system? Could additional self-employment opportunities be provided outside the VR system and then compare those differences on costs and long-term outcomes? Government policy makers could also expand opportunities by establishing public–private partnerships modeled after the microfinance programs in international development (Griffin & Hammis, 2008; Schriner & Neath, 1996). This model, which currently has a much smaller presence in the United States, is used to address poverty and lack of employment opportunities (Griffin & Hammis, 2008; Schriner & Neath, 1996) and typically entails financiers providing small loans to businesses with five or fewer employees (Griffin & Hammis, 2008; Schriner & Neath, 1996; Walls, Dowler, Cordingly, Orslene, & Greer, 2001). Evaluations of these programs have described success not only in terms of poverty alleviation, skill development, and self-sufficiency but also in terms of self-determination, self-worth, and a sense of community (Lewis, 2004; Niekerk, Lorenzo, & Mdlokolo, 2006; Schreiner, 1999). Also significant is the social media–driven crowd funding, in which many small-dollar investments for small businesses are generated online. This could fundamentally reshape the way individuals with disabilities become self-employed. Regardless of these trends, though, the fact that the overall employment rate, income, and wealth of individuals with disabilities continue to lag behind those of individuals without disabilities provides an impetus for policy makers to act.
Implications for researchers
The size, structure and organization of the RSA data and the sheer numbers of client and agency variables make the data amenable to complex multivariate statistical analyses. Unique in terms of analytic approach and scope, this study reveals methodological and conceptual research benefits in analyzing the RSA data. A yearly analysis of these data with a predetermined (i.e., a priori) set of research questions, such as we did in this study, provides important opportunities to discover or uncover informative patterns and trends in the data of VR services and client activities across states and regions.
Implications for VR agencies
Results of this study align with findings from other research studies on self-employment of individuals with disabilities (e.g., Yamamoto & Alverson, 2013), which found significant differences in VR self-employment outcomes across groups. Thus, results from this study could be used to tailor VR counselor training and professional development in supporting clients who wish to pursue self-employment. For example, the knowledge that individual characteristics are related to accountability systems and level of supports can be used to address business challenges that might be made more acute by a client’s disability, gender, ethnicity, and level of education. Counselors may need to be trained in entrepreneurship and seek active collaboration with small business experts to work with clients in improving their technical skills, and work frequently with families and other support networks to enhance clients’ self-employment experiences. Finally, VR administrators and counselors could use the data analyses and results from this study to improve clients’ opportunities and resources by holding regular meetings and conducting advocacy work with elected office holders in their state.
Footnotes
Declaration of Conflicting Interests
The author(s) declared no potential conflicts of interest with respect to the research, authorship, and/or publication of this article.
Funding
The author(s) received no financial support for the research, authorship, and/or publication of this article.