
Abstract
The purpose of this study was to document the development of the South African Career Interest Inventory and to examine the structural validity of Holland’s circular/hexagonal model in the South African context. The validity of Holland’s model was investigated in a sample of 985 university students in Study 1 and 175 university students and adults in Study 2. The randomization test of hypothesized order relations and covariance structure modeling were used to investigate the fit of a tight circular ordering and four circumplex models. The randomization test found good fit for the tight circular ordering in both the studies. Covariance structure modeling demonstrated unsatisfactory fit across the four circumplex models in Study 1 but satisfactory fit in Study 2. The results suggest that the structural validity of Holland’s circular ordering model in South Africa is tenable. Recommendations for research and practice are presented.
John Holland’s (1973, 1985, 1997) circular/hexagonal theory of vocational personality types is recognized as one of the most influential vocational counseling theories (Gottfredson, 1999; Nauta, 2010) with numerous interest inventories based on the model (e.g., Self-Directed Search and Vocational Preference Inventories). In South Africa, the measurement of vocational interests using his theory is a common practice (de Bruin & de Bruin, 2009; de Bruin & Nel, 1996; Foxcroft, Paterson, le Roux, & Herbst, 2004). Two frequently used interest inventories in the South African context are the Self-Directed Search Inventory (Gevers, du Toit, & Harilall, 1997) and the South African Vocational Interest Inventory (du Toit, Prinsloo, Gevers, & Harilall, 1993). However, despite their popularity, these inventories are outdated in content, have limited evidence of reliability and validity across diverse demographic groups, and have yielded limited evidence in support of the structural validity of Holland’s circular/hexagonal model (du Toit & de Bruin, 2002; Foxcroft et al., 2004; Watson, Foxcroft, & Allen, 2007).
It is necessary to examine the structural validity of Holland’s circular model in the South African context because research has shown that the validity of his model outside the United States is contentious (Rounds & Tracey, 1996). Indeed previous work has suggested that the circular/hexagonal model of vocational personality types may not be valid for Black South Africans (du Toit & de Bruin, 2002). Vocational assessment and counseling based on Holland’s model is moot if the validity of the model is not established in the cultural context where it is used (Darcy & Tracey, 2007; du Toit & de Bruin, 2002; Rounds & Tracey, 1996). Accordingly, the purpose of this article is to report two studies that document the operationalization of Holland’s vocational personality theory using a constrained emic approach through the development of the South African Career Interest Inventory (SACII) and to examine the structural validity of Holland’s circular/hexagonal model in the South African context.
Theoretical Background
Holland (1973, 1985, 1997) proposed six vocational personality types and six corresponding vocational environment types: Realistic, Investigative, Artistic, Social, Enterprising, and Conventional (RIASEC). According to Holland (1985, 1997) people seek out environments that allow them to enact their personality type. Furthermore, behavior is thought to be a product of people’s personality types and the environment types in which they operate (Holland, 1997). Research suggests that congruence between a person’s personality type and the environment leads to favorable outcomes such as job stability and job satisfaction (Holland, 1985, 1997; Nauta, 2010; Tranberg, Slane, & Ekeberg, 1993). In the context of career counseling, potential career choices can be provided to people based on their personality types and the characteristic environments of particular jobs (Holland, 1997; McDaniel & Snell, 1999; Reardon & Lenz, 1998). However, this is only possible if the structural validity of Holland’s circular/hexagonal model is established (Darcy & Tracey, 2007).
The Circumplex Model of Holland’s Personality Types
Holland (1985, 1997; Holland, Whitney, Cole, & Richards, 1969) posited that the six vocational personality types have a circular ordering, which yields a circular or equilateral hexagonal RIASEC shape (Tracey & Rounds, 1993). The circular ordering reflects the calculus assumption, which states that “the distances among the types or environments are inversely proportional to the theoretical relationship between them” (Holland, 1997, p. 5). Thus, adjacent types (such as Realistic and Investigative) are posited to be more similar than alternate types (such as Realistic and Artistic), which in turn are more similar than opposite types (such as Realistic and Social;Darcy & Tracey, 2007; Holland, 1997). The equal distances constraint of the six types implies a circumplex model (Hogan, 1983; Tracey & Rounds, 1993). It is also possible to view the model as a misshapen polygon (Holland, 1997; Holland & Gottfredson, 1992) because research suggests that the six types are not necessarily equidistant (Darcy & Tracey, 2007; Liu & Rounds, 2003; Tracey & Rounds, 1995).
The psychometric circumplex model was first proposed by Guttman (1954) as a model with a circular arrangement of relations between variables (Tracey, 2000). That is, the intercorrelations show a pattern of decreasing and increasing consistency with a cosine pattern of relations (Grassi, Luccio, & di Blas, 2010; Yik & Russell, 2004). Guttman (1954) distinguished between a quasi-circumplex model and a circulant model. The quasi-circumplex model refers to a loose circular ordering of the types where no equality constraints with respect to the distances between variables are imposed. In contrast, Guttman (1954) proposed that the circulant model has an equal spacing constraint, such that the distances between the types in the circular shape are equal (Tracey, 2000). Browne (1992, 1995; Fabrigar, Visser, & Browne, 1997) extended the circumplex model by differentiating between equal spacing and equal communality (radii) constraints. More specifically, Browne (1992, 1995) describes four types of circumplex models (three quasi-circumplex models and one circumplex model). These are the unconstrained or loose circular ordering quasi-circumplex, the equal spacing quasi-circumplex, the equal communality quasi-circumplex, and the circulant model (equal spacing and equal communality).
There are many analytic techniques that are used to investigate the validity of Holland’s postulated circular/hexagonal model, of which the most popular appear to be multidimensional scaling (MDS), the randomization test of hypothesized order relations (RTHOR; Hubert & Arabie, 1987), and covariance structure modeling 1 (CSM; cf. Fabrigar et al., 1997). While MDS was the most popular technique in the 1980s and 1990s, contemporary researchers mostly employ the RTHOR and CSM (cf. Darcy & Tracey, 2007). The latter two techniques are used in this study. The RTHOR is a nonparametric technique that is used to examine the fit of a tight circular ordering model to a correlation matrix (Hubert & Arabie, 1987; Rounds, Tracey, & Hubert, 1992). A tight circular ordering model is similar to a circumplex model except that the relative relations between variables are compared to each other rather than having actual equality constraints placed on the model (Darcy & Tracey, 2007; Tracey, 2000). The RTHOR is used as both a descriptive and an inferential technique of model fit. The correspondence index (CI) is a descriptive measure that indicates the extent to which the order predictions of a set of variables are met in a correlation matrix (Hubert & Arabie, 1987). The CI value ranges from −1, indicating no fit, to 1, indicating perfect fit (Hubert & Arabie, 1987; Rounds et al., 1992). It also produces an exact probability of observing the obtained CI value under the null hypothesis of random ordering. In the vocational psychology literature, a p value < .05 is usually taken as evidence that the correlation matrix is consistent with a circular ordering model (Hubert & Arabie, 1987).
Browne’s (1992) parametric CSM approach is used to evaluate the fit of a correlation matrix to increasingly stringent tests of circular ordering (Browne, 1992; Fabrigar et al., 1997). Within Browne’s framework three constraints define a circumplex model. First, the variables are circularly ordered; second, the distances between the variables are equal (equidistant or equal spacing constraint); and third, the communalities (i.e., the radii) of the variables are equal (equal communalities constraint). A model that satisfies these constraints is also referred to as a circulant model (Browne, 1992; Fabrigar et al., 1997; Tracey, 2000). By relaxing one or both of the equal spacing or equal communalities constraints, different variants of a so-called quasi-circumplex is obtained, namely (a) equal communalities but unequal spacing, (b) equal spacing but unequal communalities, and (c) unequal communalities and unequal spacing (this is also referred to as a loose circular structure). Applied to Holland’s model, a circumplex model would be characterized by a hexagonal RIASEC shape, where the six sides of the hexagon are equidistant and where the types have equal communalities.
Cross-Cultural Applicability of Holland’s Model
The circular/hexagonal model has been studied in many different countries. For the most part these studies tended to use adolescent and young adult samples (cf. Armstrong, Hubert, & Rounds, 2003; Darcy & Tracey, 2007; Soh & Leong, 2001; Tracey & Rounds, 1996). The focus on these age-groups may impact negatively on the cross-cultural generalizability of Holland’s model because interests in adolescence are generally less stable than that in adulthood (Iliescu, Ispas, Ilie, & Ion, 2013; Strong, 1955; Swanson, 1999). In addition, an adult is likely to have had more interaction with the work environment, which in turn may lead to a better self-understanding of his or her vocational interests (Holland, 1997).
Broadly, cross-cultural studies can adopt an emic or an etic approach (Cheung, van de Vijver, & Leong, 2011). The former focuses on using locally derived concepts and constructs, whereas the latter imports concepts and constructs from one context and applies them to another context without modification (Cheung et al., 2011; Einarsdóttir, Rounds, & Su, 2010). Cross-cultural studies of vocational interests have typically employed an etic approach, where Holland’s theory and the instruments used to measure the RIASEC types are imported from the United States. Such imported instruments may contain content that does not adequately represent a specific country’s work context (Day, Rounds, & Swaney, 1998; Einarsdóttir et al., 2010; Rounds & Day, 1999).
It is therefore unsurprising that mixed results for the structural validity of Holland’s model have been found with some studies providing evidence for cultural invariance (Nagy, Trautwein, & Lüdtke, 2010; Šverko & Babarović, 2006; Thorsteinsson, 2009) and others for cultural variance (Long & Tracey, 2006; Rounds & Tracey, 1996; Tang, 2009). Indeed, a large-scale structural meta-analysis conducted by Rounds and Tracey (1996) found limited support for the cross-cultural applicability of Holland’s tight circular ordering model (using the RTHOR) outside of the United States, with a mean CI value in of .48 in non-U.S. samples and .78 in the U.S. sample group (Rounds & Tracey, 1996).
In contrast to the aforementioned meta-analysis, recent research demonstrates that the application of his model across diverse contexts may not be as problematic as originally thought. For example, Tak (2004) investigated the fit of the tight circular order model in Korean university students and found that the model held (i.e., all p values were significant) with CI values of .82 for both men and women. Soh and Leong (2001) reported a CI value of .61 with Chinese students in Singapore, and Šverko and Babarović (2006) found that a tight circular ordering model held in Croatian adolescents with CI values of .31, .57, and .72 depending on the age of the participants. Iliescu et al. (2013) similarly found support for the tight circular ordering model in Romania, with CI values of .68 in university students and .82 in working adults. However, the fit of the tight circular ordering model with a high school students sample was marginal (p = .05, CI = .42). For the most part, these CI values exceed the international benchmark of .48 obtained by Rounds and Tracey (1996).
Investigation of the circumplex model of interests using covariance structure modeling has produced mixed results. Techniques such as the RTHOR and constrained MDS tend to produce better fit to a circumplex (i.e., tight circular ordering and circulant model) because they are nonparametric techniques and focus on relative fit rather than perfect fit (Darcy & Tracey, 2007; Tracey, 2000). Darcy and Tracey (2007) used Browne’s CSM approach in a U.S. sample and found that the model fit was generally poor across the different circumplex models and age-groups (Grades 8, 10, and 12). However, the RTHOR, constrained MDS, and circular unidimensional scaling indicated good fit across the different samples (Darcy & Tracey, 2007).
Iliescu et al. (2013) tested an equality constrained and inequality constrained model using confirmatory factor analysis from a structural equation modeling framework in three Romanian sample groups (high school students, university students, and working adults). The model fit for both the equality constrained and inequality constrained models with the high school students sample was marginally acceptable, while the fit of the university student and working adult sample groups was acceptable. Nagy et al. (2010) tested a circulant model using a variation in Browne’s (1992) CSM approach in German high school and university students. The fit of the unconstrained circumplex and equal scaling constants circumplex was acceptable with the high school students, and the fit of the equal spacing constants circumplex was reasonable with the university students.
The only study to investigate the circular order model in South Africa was conducted by du Toit and de Bruin (2002) among rural men and women of the Eastern Cape and North–West provinces. The results of an RTHOR analysis indicated poor fit with the Eastern Cape sample (CI = .49 for men and .48 for women, p > .05,) and the North West sample (CI = .35 for men and .32 for women, p < .05). MDS plots also showed disordering of the personality types. Potential reasons provided for the poor fit included cultural differences between the Western context and the South African context (individualism vs. collectivism), poverty, and language barriers between the test administration language and the participants’ spoken home language (du Toit & de Bruin, 2002).
Development of the SACII
The purpose for the development of the SACII was to operationalize Holland’s vocational personality theory in South Africa. The underlying construct domain of the SACII is Holland’s (1973, 1985, 1997) vocational personality theory, which postulates the existence of six vocational personality or interest types. The development of the SACII adopted a constrained emic approach (Einarsdóttir et al., 2010; Einarsdóttir, Eyjólfsdóttir, & Rounds, 2013). This approach consists of importing Holland’s circular/hexagonal model into a particular context while developing items with content that are unique to the context in which it is used. Thus, a theoretical framework (such as Holland’s vocational personality theory) that has strong empirical support and practical utility in one context is tailored to another context through the development of indigenous content (Einarsdóttir et al., 2010, 2013; Rounds & Day, 1999; van de Vijver & Tanzer, 2004). It was deemed necessary to adopt this approach because the South African labor market is an emerging market and is therefore not directly comparable to the U.S. labor market.
Initially, items were written for 12 scales in order to provide a more fine-grained analysis of the interest domain (Rounds & Tracey, 1993; Tracey & Rounds, 1995), where there were 6 primary RIASEC scales and 6 secondary scales. The secondary scales were defined as the interpoint distances between the primary scales. For example, the secondary scale between the primary scales of Realistic and Investigative is the Realistic–Investigative scale. The slicing of the underlying interest domain is arbitrary, and it is therefore possible to create any number of types at different levels of measurement abstraction (Tracey & Rounds, 1995).
Items were written by the first author that reflect Holland’s RIASEC typology and that were relevant to South Africa, taking into consideration the South African labor context, language barriers, and access to different occupations (such as the emergence of new occupations due to technological developments). Job profiles and descriptions obtained from various online databases (such as the O*Net database, which classifies occupations according to Holland’s RIASEC types) and that were relevant to the South African context were used as a point of departure. Items are presented as statements to which respondents indicate their agreement or disagreement on a 5-point Likert-type scale ranging from strongly disagree (1) to strongly agree (5). The initial item pool consisted of 425 items. The items were subjected to review by psychologists who had expert knowledge of Holland’s theory.
The reviewers were provided with definitions of each of the 12 types and then asked to sort each item into the type that it best represented. For each review, items were scored from zero to six depending on how close the reviewer’s placement of the item was to the a priori specified type of the item. For example, if the item was intended for the Realistic type and a reviewer correctly placed the item in the Realistic type, a score of six was given to the item. Placement of the Realistic item in the Realistic–Conventional or Realistic–Investigative categories received a score of 5, placement in the Conventional or Investigative categories received a score of 4, and so on. The scores obtained for each item were then averaged across the reviewers to obtain a value out of a maximum of 6 (where 6 was equal to perfect agreement between the item and its theoretical type). The decision to eliminate an item was based on whether the type it came from had a sufficient number of items to warrant deletion of items and whether the item obtained a particularly low score in comparison to other items from the same type.
The review identified 71 unsatisfactory items, which were removed from the item pool, leaving a total of 354 items. A pilot study with 404 students indicated that the 12 scales failed to demonstrate discriminant validity. More specifically, MDS and CSM indicated that it was difficult to separate the secondary types from the primary types. Scale intercorrelations also revealed that some of the primary types and secondary types were too highly correlated. For example, the correlation between the Enterprising and Enterprising–Conventional scales was .91. Because of these findings it was decided to collapse the 12 scales into the six standard RIASEC scales.
The angular placement of the items in two-dimensional space (Tracey, 1997a, 2002; Tracey & Rounds, 1996) was used to select approximately 40 items for each of the RIASEC scales using the same data on which the 12 scales were investigated (i.e., 404 students). This process consists of obtaining the angular location of each item and plotting them on the circumference of a circle. Hereafter items are selected that fall into an arbitrarily prespecified angular range and that have content theoretically consistent with their respective type. After the item selection, a total of 237 items remained across the six scales.
Aim of the Present Study
In summary, questions remain about the validity of Holland’s theory and measures of the vocational personality types in non-Western contexts in general (Rounds & Tracey, 1996), and the South African context in particular (du Toit & de Bruin, 2002). Against this background, the aims of this study are to document the operationalization of Holland’s vocational personality theory through the development of the SACII using a constrained emic approach and to examine the structural validity of the SACII for South African adolescents, young adults, and adults. In particular, we report on two studies where we test variations in the hypothesis that the SACII scales have a circular RIASEC structure using Hubert and Arabie’s (1987) RTHOR and Browne’s (1992) CSM approach.
Study 1
Method
Participants
Participants were 985 adolescents and young adults (students) from three higher education institutions in the Gauteng and KwaZulu-Natal Provinces (men = 435, 44.30%; women = 547, 55.70%). The mean age was 21.31 years (SD = 3.69 years, median = 20 years) with a range of 17–60 years. The majority of the participants were Black (n = 787, 80.06%). The remaining participants were composed of mixed ethnicity (n = 57, 5.80%), Indian/Asian (n = 85, 8.65%), and White (n = 54, 5.50%) ethnic groups. The spoken home languages of the participants included an indigenous South African language (n = 767, 78.75%), English (n = 175, 17.97%), and Afrikaans (n = 32, 3.29%). The majority of the participants were registered in a faculty of engineering (n = 443, 46%). The remainder were registered in faculties of humanities (n = 131, 14%), art, design and architecture (n = 20, 2%), economic and financial sciences (n = 37, 4%), education (n = 110, 11%), health sciences (n = 22, 2%), law (n = 17, 2%), natural science (n = 32, 3%), and management (n = 152, 16%).
Analysis
The validity of the circular/hexagonal model was investigated using Hubert and Arabie’s (1987) RTHOR and Browne’s (1992) CSM approach. The RTHOR was also used to determine whether the fit of the tight circular ordering model in one group was better than that in another group (cf. Hubert & Arabie, 1987; Ryan, Tracey, & Rounds, 1996). The RANDALL software (Tracey, 1997b) was used to calculate the RTHOR, and the RANDMF software (Tracey, 1997b) was used to compare the fit of the tight circular ordering structure across the different ethnic groups.
The CircE (version 1) package (Grassi et al., 2010) in R (R Core Team, 2013) was employed to compare the fit of the four competing models of the circumplex structure: (a) a loose ordering circular model (no constraints), (b) a quasi-circumplex model with equal communality constraints, (c) a quasi-circumplex with equal spacing constraints, and (d) a circulant model with equal communality and equal spacing constraints (Browne, 1992, 1995; Fabrigar et al., 1997). The CircE package is equivalent to the CIRCUM software (Browne, 1995), which has commonly been used in studies of circumplex structure. In addition to testing the fit of the model, the CircE (and CIRCUM) software provides the angular locations and communalities (radii) of the scales on a circular arrangement (Browne, 1992; Grassi et al., 2010; Tracey, 2000). CircE provides various fit statistics: likelihood χ2, root mean square error of approximation (RMSEA; Steiger & Lind, 1980), standardized root mean square residual (SRMR), Tucker–Lewis index (TLI; Tucker & Lewis, 1973), comparative fit index (CFI; Bentler, 1990), the goodness-of-fit index (GFI; Jöreskog & Sörbom, 1989), and the expected cross-validation index (ECVI; Browne & Cudek, 1992). Acceptable fit is indicated by RMSEA and SRMR values ≤ .08 (Browne & Cudek, 1992; Hu & Bentler, 1999) and TLI, CFI, and GFI values ≥ .90 (Bentler, 1990; Brown, 2006; Jöreskog & Sörbom, 1989). The ECVI is used to identify models that are most likely to successfully replicate in future samples, with smaller values indicating better fit (Browne & Cudeck, 1992).
Results
Reliability
The Cronbach’s α coefficients of the six scales for the total sample ranged from .96 to .98 (see Table 1). The reliabilities were ≥ .94 across all four ethnic groups.
Cronbach’s α Coefficients of the Six SACII Scales.

Note. R = Realistic; I = Investigative; A = Artistic; S = Social; E = Enterprising; C = Conventional; SACII = South African Career Interest Inventory. Total, N = 985; Black, n = 787; mixed ethnicity, n = 57; Indian/Asian, n = 85; White, n = 54.
Table 2 presents descriptive statistics and intercorrelations of the six scales. The correlations show a pattern of rising and falling as expected in a circular ordering model (Guttman, 1954). The correlations between the Social and Artistic (0.81) and Enterprising and Conventional (0.86) scales were large, indicating that there may be more similarity between the respective types than expected in the model.
Descriptive Statistics and Correlations of the SACII Scales (Study 1).
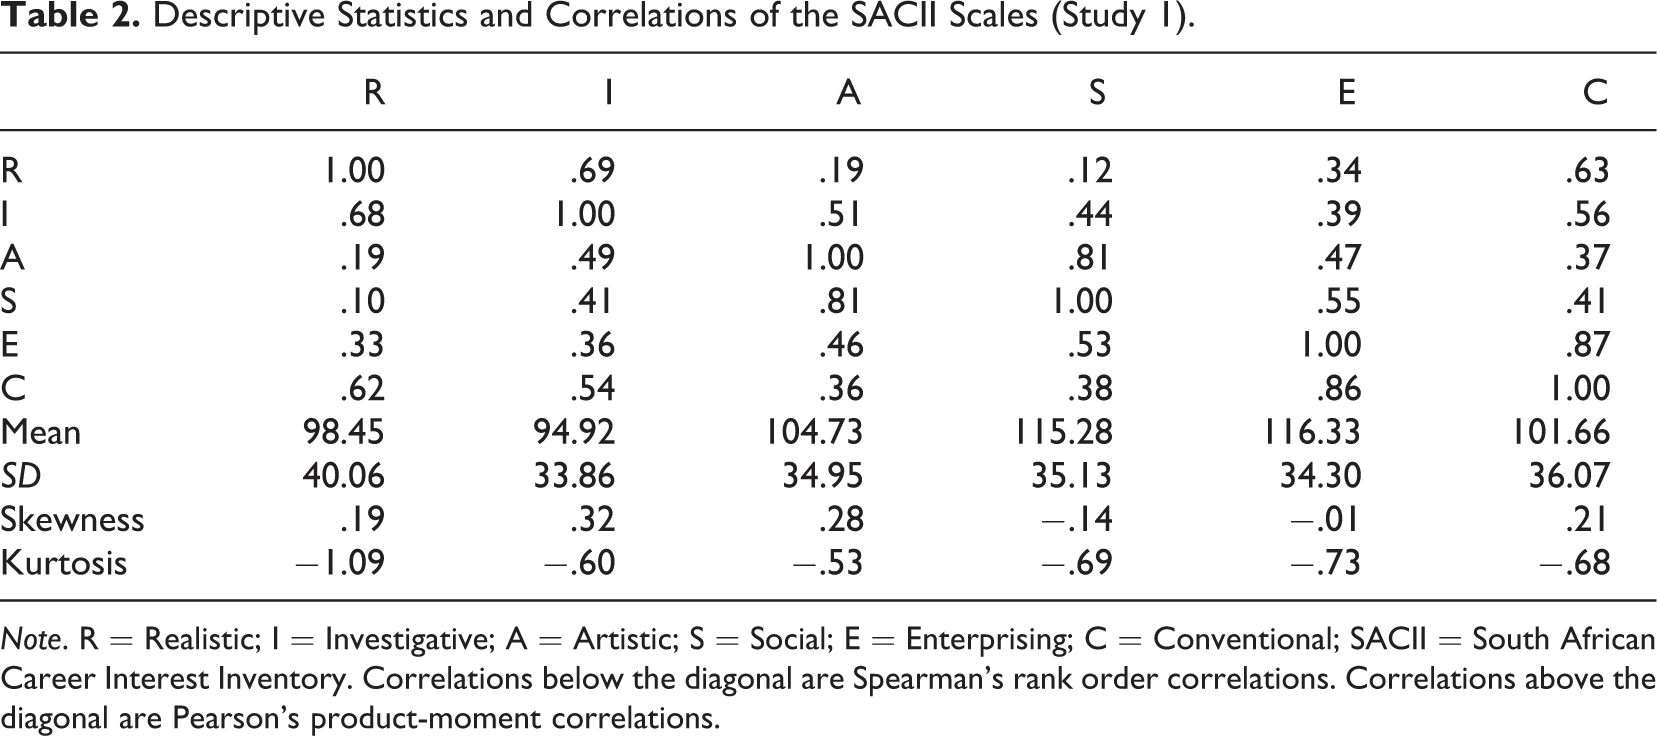
Note. R = Realistic; I = Investigative; A = Artistic; S = Social; E = Enterprising; C = Conventional; SACII = South African Career Interest Inventory. Correlations below the diagonal are Spearman’s rank order correlations. Correlations above the diagonal are Pearson’s product-moment correlations.
Good fit was found for the total sample and across the four ethnic groups using the RTHOR (see Table 3). In the total sample, 66 of the 72 order predictions were met (CI = .83, p = .017). The Indian/Asian sample had the lowest CI (.74, p = .017), but this value still indicated statistically significant and good fit (62 of the 72 order predictions were met). The randomization test of differences found that there were no statistically significant (p < .05) differences in the fit of the tight circular order model across the four ethnic groups. However, the differences in sample sizes of the four groups necessitate caution in interpretation of the results.
Randomization Test of Hypothesized Order Relations (Study 1).
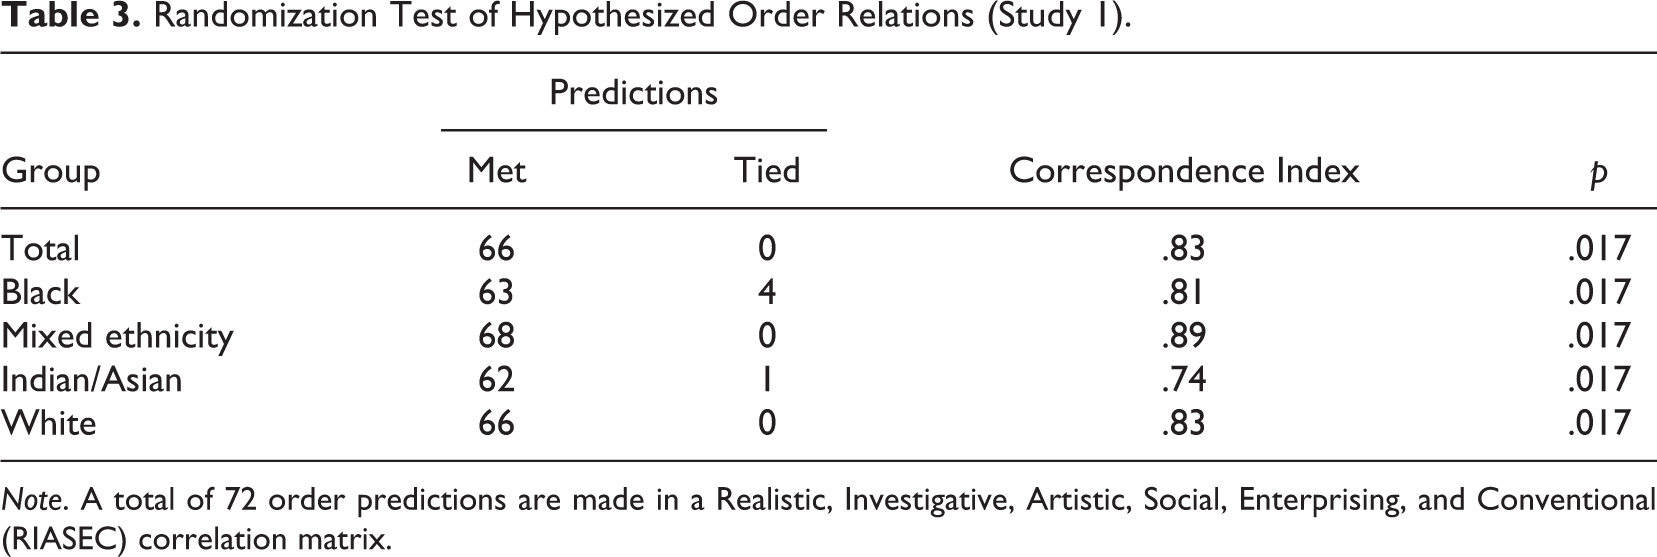
Note. A total of 72 order predictions are made in a Realistic, Investigative, Artistic, Social, Enterprising, and Conventional (RIASEC) correlation matrix.
The fit of the data to four circumplex models (unconstrained, equal communality, equal spacing, and circulant) to the total sample group was investigated with the CircE package using a two-parameter specification (m = 2; see Table 4). The RMSEA of each of the four models was unsatisfactory (RMSEA > .20). However, the RMSEA is positively biased in models with small degrees of freedom, which may lead to the rejection of models that fit the data well (Kenny, Kaniskan, & McCoach, 2011; Kenny & McCoach, 2003). The degrees of freedom of the four circumplex models ranged from 2 (for the unconstrained model) to 12 (for the circulant model) and therefore the fit of the RMSEA must be interpreted with caution. By contrast, the fit of the unconstrained model (loose circular ordering) was acceptable based on the SRMR (.05), CFI (.98), and GFI (.97). The other three models (equal spacing, equal communality, and circulant) had unsatisfactory overall fit. The ECVI value (0.13) indicated that the unconstrained model was the most likely model to be replicated in future samples.
Fit Statistics of Four Circumplex RIASEC Models (Study 1).
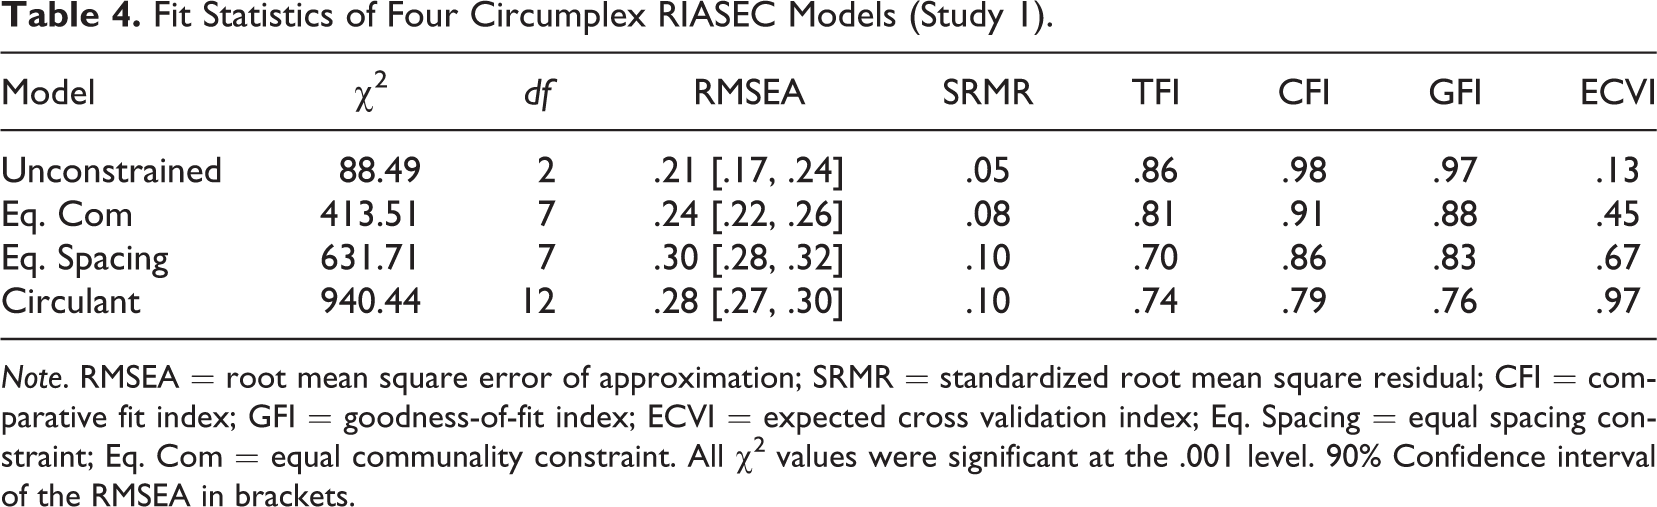
Note. RMSEA = root mean square error of approximation; SRMR = standardized root mean square residual; CFI = comparative fit index; GFI = goodness-of-fit index; ECVI = expected cross validation index; Eq. Spacing = equal spacing constraint; Eq. Com = equal communality constraint. All χ2 values were significant at the .001 level. 90% Confidence interval of the RMSEA in brackets.
The angular placements of the RIASEC scales obtained in the CircE unconstrained model are presented in Table 5 (the angle of Realistic was set to 0° to serve as a reference point). These angles were contrasted to the equal spacing target of 60° as expected in a hexagonal model. There was a relatively large angular distance between the Investigative and Artistic scales (94°) and the Social and Enterprising Scales (103°), respectively. In contrast, the distance between the Social and Artistic scales was small (12°), indicating that the participants may have made little differentiation between the two types (Figure 1).
Angular Locations and Communalities of the RIASEC Scales (Study 1).
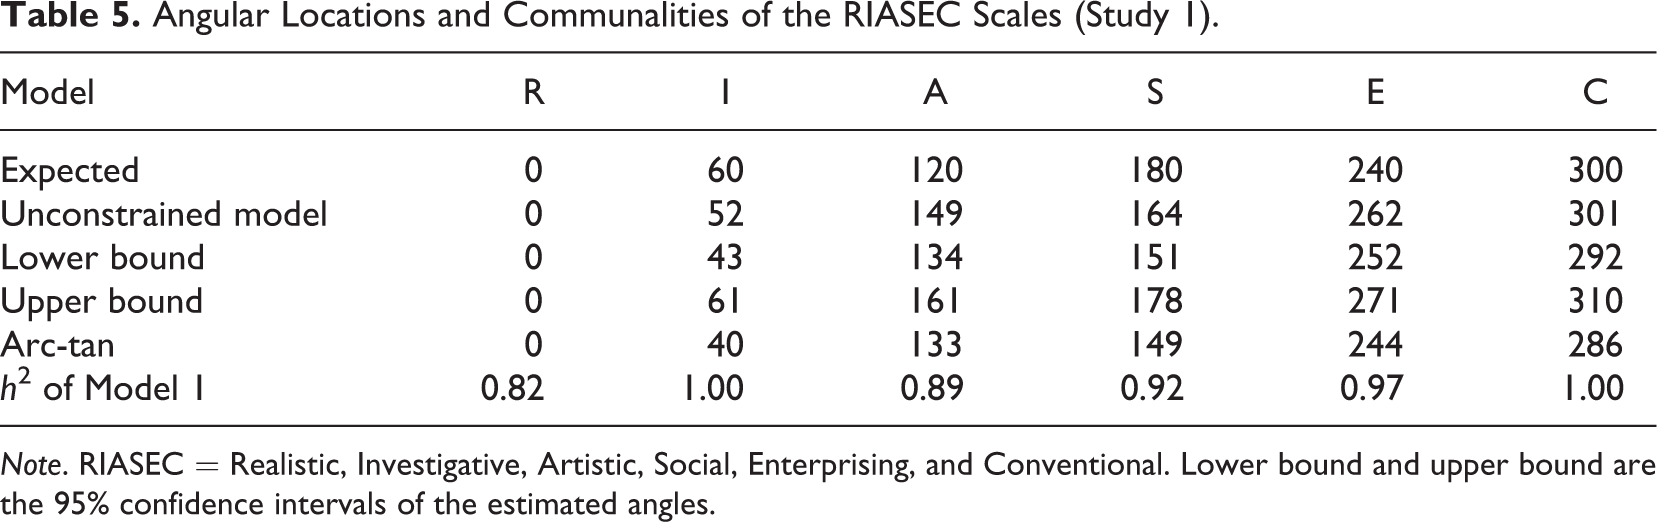
Note. RIASEC = Realistic, Investigative, Artistic, Social, Enterprising, and Conventional. Lower bound and upper bound are the 95% confidence intervals of the estimated angles.

Angular and communality placement of the Realistic, Investigative, Artistic, Social, Enterprising, and Conventional (RIASEC) scales from the unconstrained CIRCUM model for the total sample of Study 1 (n = 985).
Reduction of Items
The 237 items of the SACII were further reduced after investigating their psychometric properties in the above-mentioned sample group. The interest space was divided into six slices and the angular locations of items within these slices inspected. Items with unexpected angular placements were flagged for removal (Tracey, 1997a, 2002; Tracey & Rounds, 1996). An item had an unexpected angular location if its location deviated from other items that were of the same type. For example, if the Realistic items had angles that ranged from 60° to 90°, a Realistic item with an angle of 140° would be unexpected.
Hereafter, item analysis from a classical test theory and item response theory approach (Rasch analysis) was employed to identify items that did not fit the data well. Both theoretical considerations and statistical information (i.e., item fit and item parameters) were taken into account before removing any particular item. Sixty-eight items were removed leaving 169 items across the six scales. After the removal of these items the Artistic scale consisted of 30 items, the Realistic, Social, and Enterprising scales of 28 items each, the Investigate scale of 26 items, and the Conventional scale of 29 items. Sample items of each domain are available in the Appendix.
Study 2
Method
Participants
Participants were 175 adolescents, young adults (students), and adults. There were 98 (66.67%) women and 49 (33.33%) men. The mean age was 31.73 years (SD = 9.12 years, median = 29 years) with a range of 16–63 years. The majority of the participants were White (n = 144, 83.24%). The remaining participants were mixed ethnicity (n = 4, 2.31%), Indian/Asian (n = 16, 9.25%), and Black (n = 9, 5.20%). The spoken home languages of the participants included an indigenous South African language (n = 10, 5.92%), English (n = 116, 68.64%), and Afrikaans (n = 43, 25.44%). Sixty-three (36.41%) of the participants were registered as university students. The majority of the students were registered in the faculty of humanities (n = 24) and management (n = 24).
Results
Reliability
The Cronbach’s α coefficients of the six scales for the total sample were all >.90. Table 6 presents the descriptive statistics, intercorrelations, and α coefficients (on the diagonal of the correlation matrix) of the six scales. As was seen in Study 1, the correlations show a pattern of rising and falling expected in a circular ordering model (Guttman, 1954).
Descriptive Statistics and Correlations of the SACII Scales (Study 2).
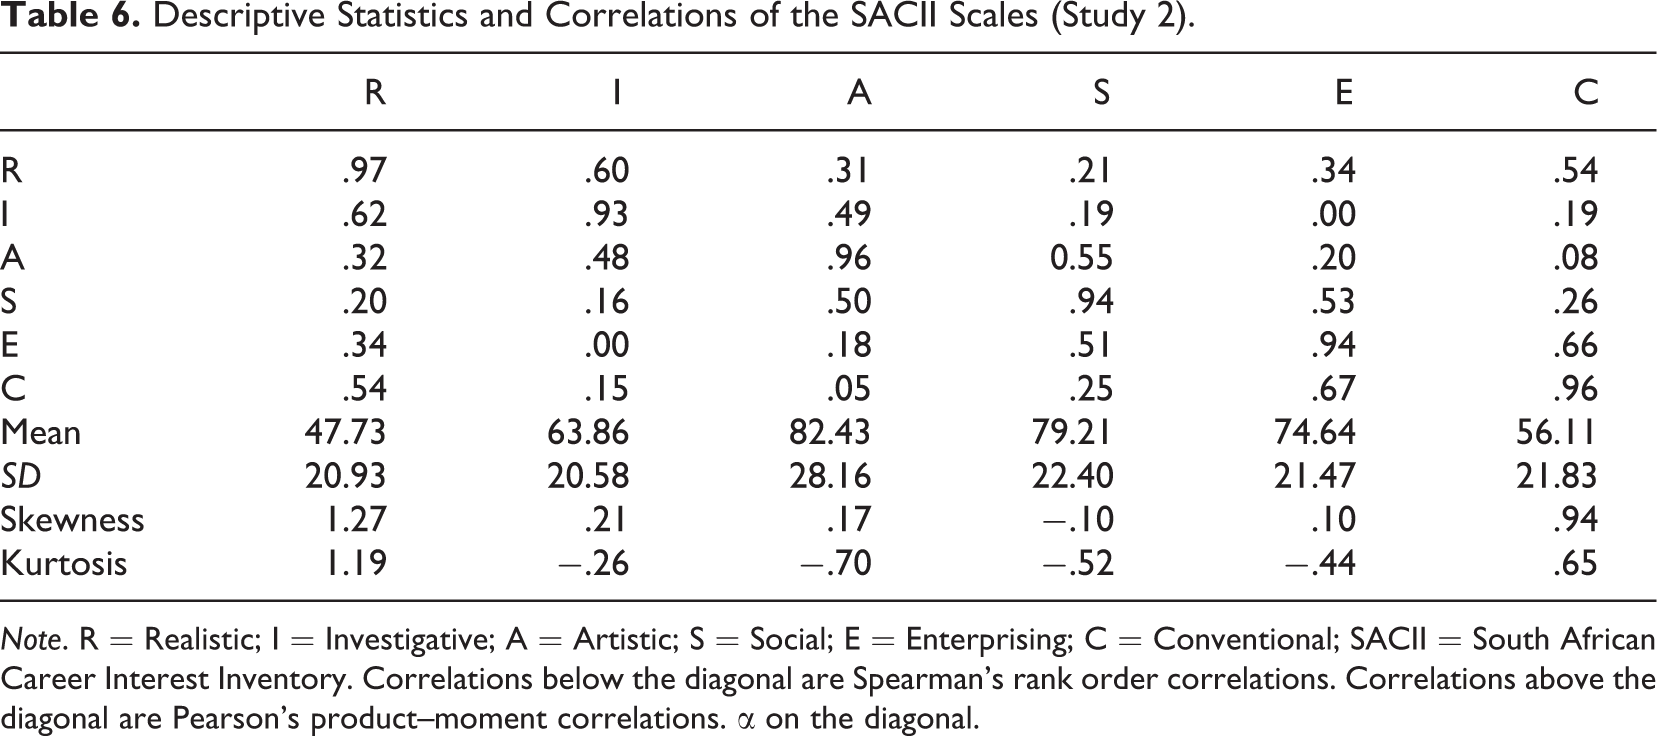
Note. R = Realistic; I = Investigative; A = Artistic; S = Social; E = Enterprising; C = Conventional; SACII = South African Career Interest Inventory. Correlations below the diagonal are Spearman’s rank order correlations. Correlations above the diagonal are Pearson’s product–moment correlations. α on the diagonal.
Good fit was found for the total sample using the RTHOR with 69 of the 72 order predictions met (CI = .92, p = .017). The fit of the data to four circumplex models (unconstrained, equal communality, equal spacing and circulant) for the total sample group was investigated with the CircE software using a two-parameter specification (m = 2; see Table 7). The RMSEA of the unconstrained model was the most unsatisfactory of all the models. However, the 90% confidence intervals indicate that the unconstrained model does not necessarily have unsatisfactory fit. As a whole the equal spacing model demonstrated the lowest ECVI value (.25) and the best overall fit (RMSEA = .08, SRMR = .05, TFI = .96, CFI = .98, GFI = .99).
Fit Statistics of Four Circumplex RIASEC Models (Study 2).
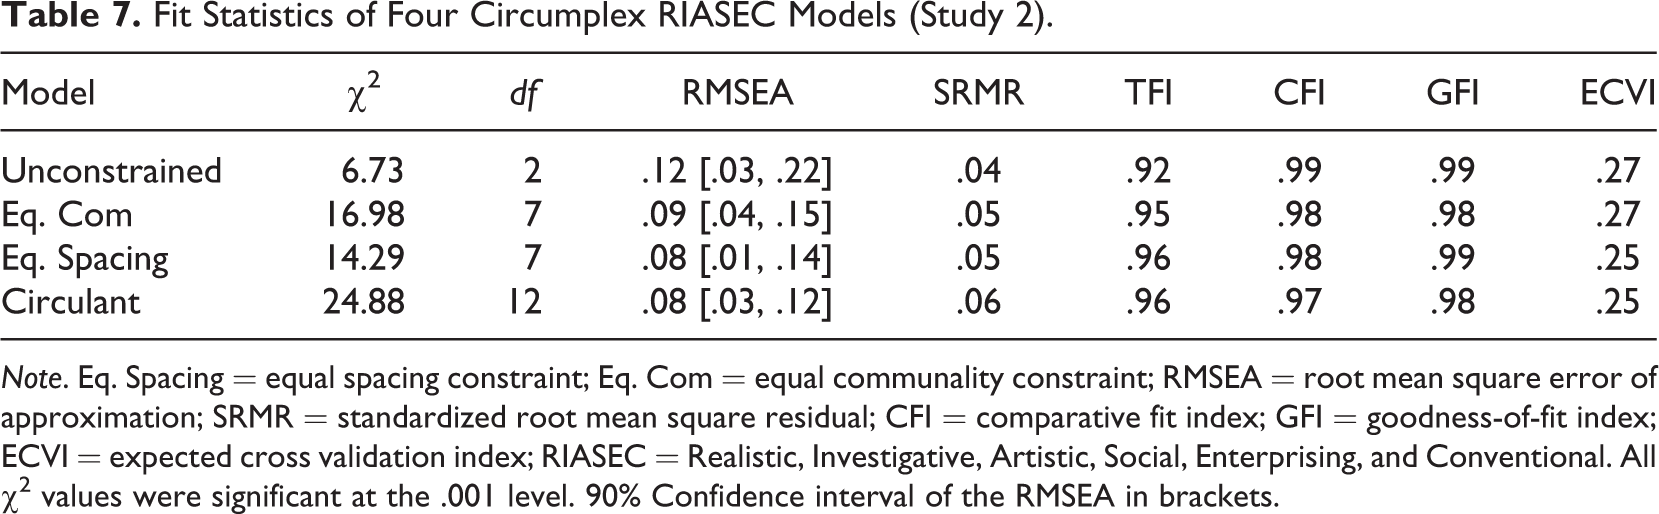
Note. Eq. Spacing = equal spacing constraint; Eq. Com = equal communality constraint; RMSEA = root mean square error of approximation; SRMR = standardized root mean square residual; CFI = comparative fit index; GFI = goodness-of-fit index; ECVI = expected cross validation index; RIASEC = Realistic, Investigative, Artistic, Social, Enterprising, and Conventional. All χ2 values were significant at the .001 level. 90% Confidence interval of the RMSEA in brackets.
The angular placements of the RIASEC scales obtained in the CircE unconstrained model are presented in Table 8 (the angle of Realistic was set to 0° to serve as a reference point). These angles were contrasted to the equal spacing target of 60° as expected in a hexagonal model. For the most part, the angular distances approximated a roughly 60° separation between each of the types (Figure 2).
Angular Locations and Communalities of the RIASEC Scales (Study 2).
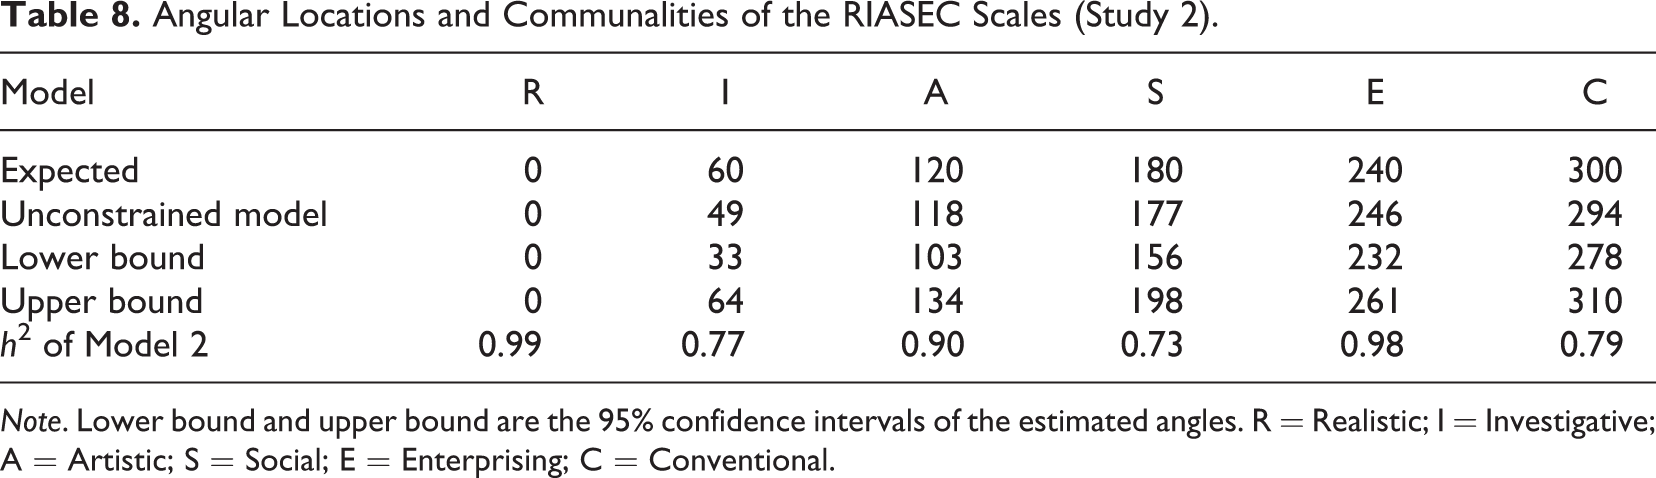
Note. Lower bound and upper bound are the 95% confidence intervals of the estimated angles. R = Realistic; I = Investigative; A = Artistic; S = Social; E = Enterprising; C = Conventional.
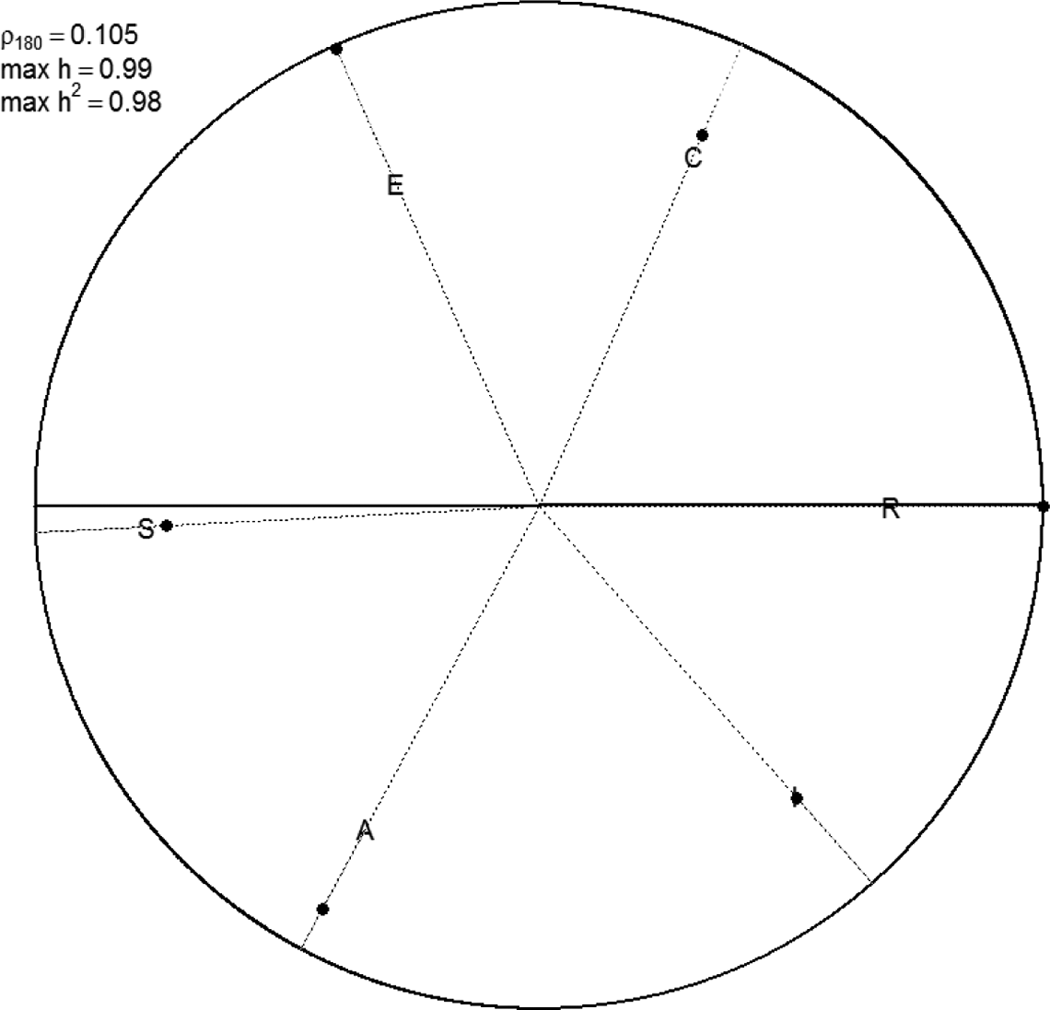
Angular and communality placement of the Realistic, Investigative, Artistic, Social, Enterprising, and Conventional (RIASEC) scales from the unconstrained CIRCUM model for the total sample of Study 2 (n = 175).
Discussion
This article outlines the development of the SACII using a constrained-emic approach and reports on the structural validity of Holland’s (1973, 1985, 1997) circular/hexagonal model of vocational personality types in the South African context. While previous work has cast doubt on the validity of Holland’s hexagon for Black South Africans (du Toit & de Bruin, 2002), the results of the two studies reported here support the proposed circular/hexagonal structure and demonstrate that the six vocational personality types can be measured with high reliability.
Determining the fit of a tight circular ordering model was the a starting point in investigating the circular/hexagonal model. The RTHOR supported the hypothesis of a tight circular ordering RIASEC model in the total sample and in each of the four ethnic groups for Study 1, and for the total sample in Study 2. In addition, there were no significant differences in the fit of the model across the four different ethnic groups in Study 1. The CI values were high and comfortably exceed the average U.S. and non-U.S. sample CI values of .78 and .48 reported by Rounds and Tracey (1996) and compared favorably to other cross-cultural studies on the applicability of the tight circular ordering model (Iliescu et al., 2013; Soh & Leong, 2001; Šverko and Babarović, 2006; Tak, 2004). More importantly, the results contradict the negative results reported by du Toit and de Bruin (2002). Hence, it appears that Holland’s circular RIASEC model may indeed be valid in the South African context.
The covariance structure modeling tests of circumplex structure in Study 1 revealed satisfactory fit for the unconstrained (loose circular ordering) model but unsatisfactory fit for the remaining models (equal communality, equal spacing, and circulant). The fit of the four models must be seen against the background of previous studies, which have also found unsatisfactory fit for covariance structure modeling tests of circumplex structure (Darcy & Tracey, 2007; Gupta, 2008). It must also be kept in mind that covariance structure modeling examines perfect fit rather than relative fit and is therefore more likely to produce worse fitting solutions (Darcy & Tracey, 2007). Alternatively, because the fit was good with the RTHOR, it may be possible—as suggested by Darcy and Tracey (2007)—that the data are best explained by a misshapen polygon (Holland, 1997; Holland & Gottfredson, 1992) rather than by an equilateral hexagon. However, in Study 2, the fit of all four models was mostly satisfactory. This result implies that the RIASEC ordering may be consistent with a circulant model in the South African context, within the boundaries of the sample group used for the second study.
We offer three potential reasons for the better fit obtained in Study 2. First, Study 2 used a more refined set of items than Study 1 in that they were selected to reproduce the hexagon. Second, Study 2 examined the vocational interests of working adults, whose interests are likely more stable and clearly defined than those of the university students examined in Study 1 (Strong, 1955; Swanson, 1999). It is to be expected that adults will have better self-understanding of their interests and a clearer picture of what types of job activities they would prefer (Holland, 1997), which in turn should lead to more reliable and valid responses to the items. Third, given that the sample consisted primarily of White participants, and that previous research has shown that Holland’s model generally fits better in Western contexts (Rounds & Tracey, 1996), we cannot exclude the possibility that the improved fit observed in Study 2 was due to the composition of the sample.
Although the RIASEC ordering was observed in the data in Study 1, the angular locations of the six RIASEC interests show that the Artistic scale was spaced relatively closely to the Social scale and too far from the Investigative scale. The Enterprising and Conventional scales were also more closely distanced than would be expected. These results mirror those of Darcy and Tracey (2007; in their Grade 8 sample) and Nagy et al. (2010) who found that the Social and Artistic interests are relatively closely spaced to each other. However, in Study 2, the angular locations of the six RIASEC scales approximated a roughly 60° separation with the relatively close distance between the Social and Artistic and Enterprising and Conventional scales in Study 1 disappearing.
Although previous research has tended to find poor cross-cultural applicability of Holland’s model, it is possible that these poor results can be attributed to the adoption of a pure etic approach, where Holland’s theoretical model and the test items are imported to a particular cultural group. In the development of the SACII, a constrained emic (Einarsdóttir et al., 2010) approach was used to develop items that reflect Holland’s six types and the South African labor context (Day et al., 1998). It is therefore possible that the results of the Study 2 were particularly promising because the items were developed for the South African context taking the South African work context into account.
Implications for Theory and Practice
Holland’s structural model, often used as a starting point in career counseling, is often assumed to be invariant across individuals and cultures (du Toit & de Bruin, 2002) without any such evidence. Erroneously making such an assumption can lead to improper career counseling because the primary and secondary assumptions of Holland’s theory are dependent on the structural model (Darcy & Tracey, 2007). The results of the two studies presented in this article suggest that, contrary to prior research (du Toit & de Bruin, 2002), Holland’s circular/hexagonal model may be applicable to the South African context and that career assessment and counseling based on the model may proceed if valid interest inventories are used. With the development of the SACII, an initial step has been taken to produce a psychometric instrument developed for South Africans, hereby attempting to address the call for the development of high-quality and psychometrically sound instruments in the South African context (Foxcroft et al., 2004; Paterson & Uys, 2005; Pretorius, 2008).
The results further show the value of using a constrained emic approach to the development of interest inventories that reflect a particular country’s world of work (Day et al., 1998). It is therefore possible that cross-cultural research that fails to establish the validity of Holland’s structural model can benefit from having items developed that are particular to that country rather than importing inventories and standardizing them (Einarsdóttir et al., 2010). Such an approach may assist in extending Holland’s theory into Africa and addresses the need for current and cross culturally valid measures of career interests that are based on solid theory.
Limitations and Recommendations
The development and initial validation of the SACII is subject to several limitations. The characteristics of the participants are considered a limitation because in Study 1 they mainly consisted of higher education students, unequal ethnic group sizes, unequal representations of different university or college faculties and because they were only obtained from two different provinces and three higher education institutions. In Study 2, the composition of the participants was limited in ethnicity, language group, age, and sample size, and therefore caution must be used in generalizing the results. Future research should address these limitations by exploring the psychometric properties of the SACII with larger and more diverse sample groups in terms of ethnic background, age, socioeconomic status, home language, and job/field of study across South Africa. Furthermore, it needs to be demonstrated that the improved fit obtained in Study 2 also occurs across non-White ethnic groups.
At present, the SACII scales are populated with a fair number of good quality items. Future research on the SACII should continue to conduct item analyses on the scale items to further reduce the scale lengths and ensure that the validity of Holland’s structural model holds across different sample groups. In addition, differences in the structural model must be investigated across gender, ethnicity, and language to investigate whether there are any differences in model fit. Finally, the angular locations of the types should be examined using circular unidimensional scaling in addition to CSM because this technique is well suited to investigate spacing of the types on a circular distribution (Armstrong et al., 2003; Darcy & Tracey, 2007).
Conclusion
The purpose of this article was to describe the development of the SACII and provide evidence of the structural validity of Holland’s circular/hexagonal model in the South African context. The results showed, contrary to previous findings, that Holland’s structural model may be valid in the South African context, which implies that career counseling using his model is tenable. Although the initial evidence is promising, it is recognized that much research is still required to make the SACII a viable instrument for the measurement of vocational interests in South Africa.
Footnotes
Appendix
Sample SACII Items.
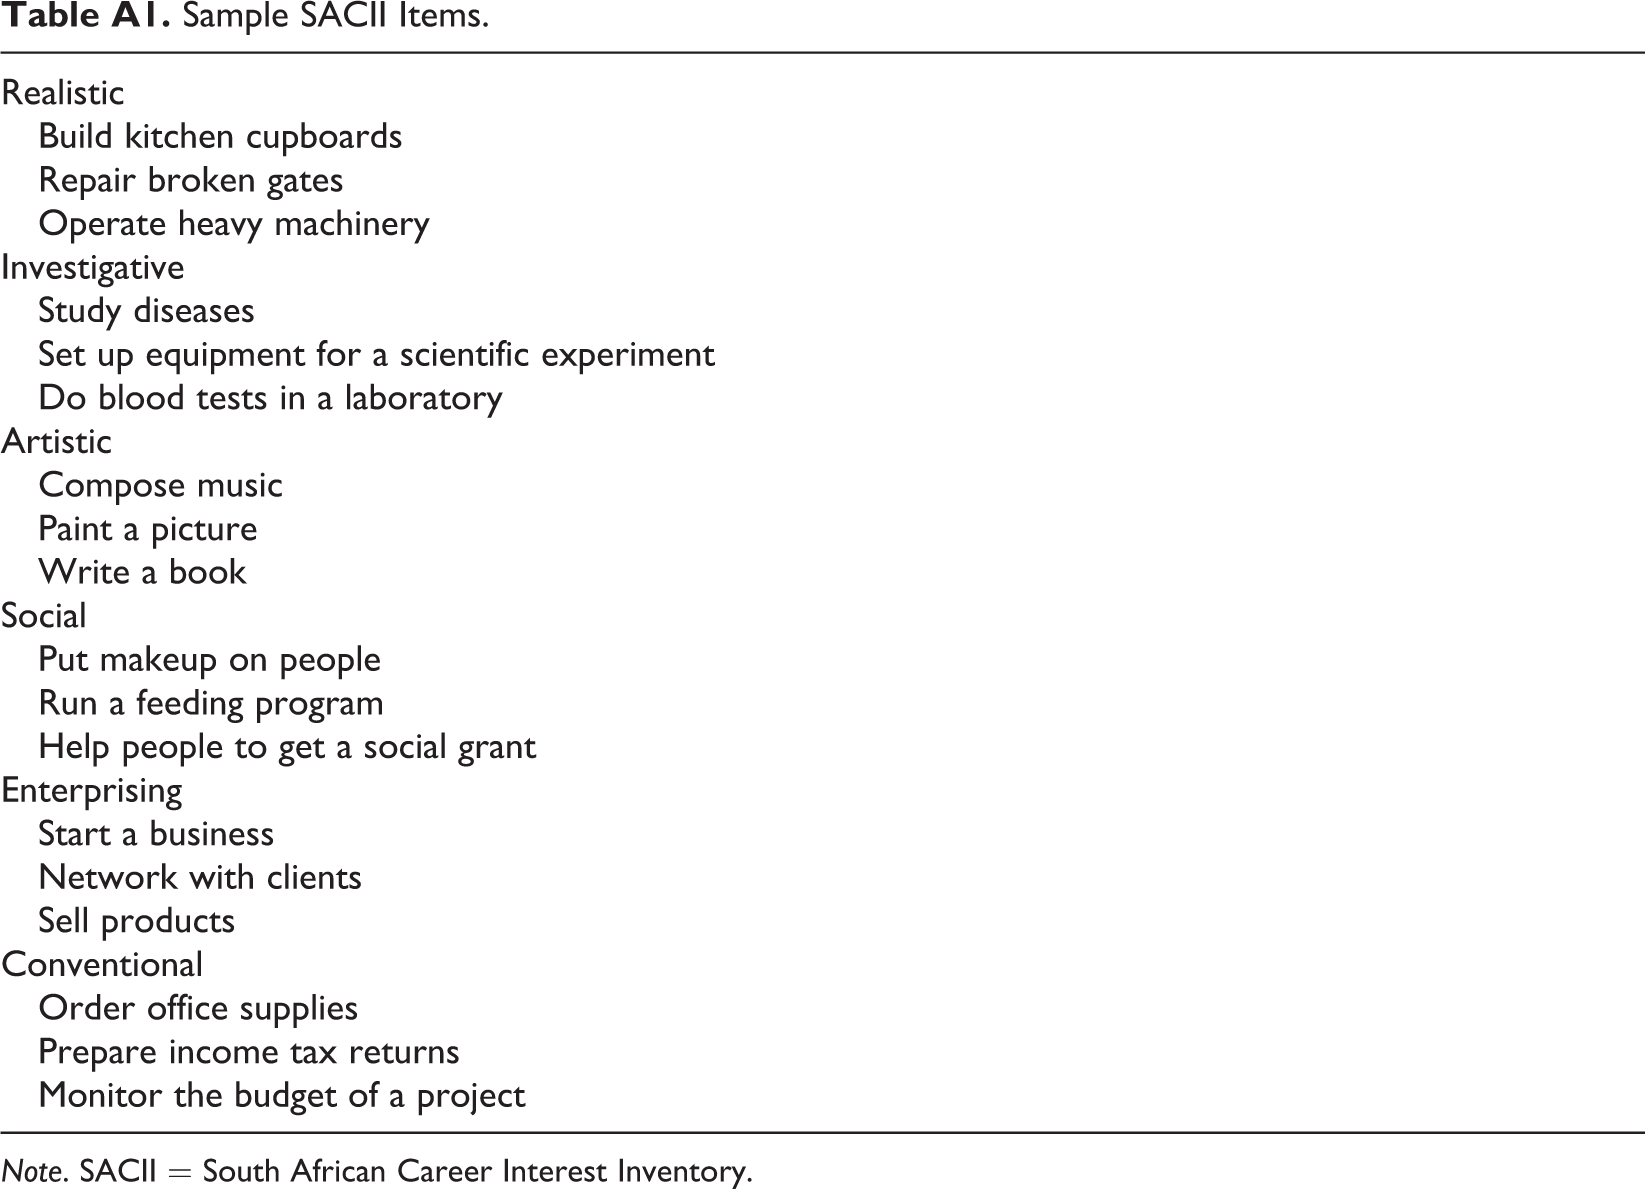
| Realistic |
| Build kitchen cupboards |
| Repair broken gates |
| Operate heavy machinery |
| Investigative |
| Study diseases |
| Set up equipment for a scientific experiment |
| Do blood tests in a laboratory |
| Artistic |
| Compose music |
| Paint a picture |
| Write a book |
| Social |
| Put makeup on people |
| Run a feeding program |
| Help people to get a social grant |
| Enterprising |
| Start a business |
| Network with clients |
| Sell products |
| Conventional |
| Order office supplies |
| Prepare income tax returns |
| Monitor the budget of a project |
Note. SACII = South African Career Interest Inventory.
Acknowledgments
The authors thank Professors T. J. G. Tracey and J. Rounds for their assistance with analyzing circumplex models and suggestions on analytic techniques to do so.
Declaration of Conflicting Interests
The author(s) declared no potential conflicts of interest with respect to the research, authorship, and/or publication of this article.
Funding
The author(s) received no financial support for the research, authorship, and/or publication of this article.