
Abstract
This research investigated the latent structure and full measurement invariance of the Career Adapt-Abilities Scale (CAAS) in three independent samples of social occupations for the first time, namely, preservice teachers (n = 344), retail workers (n = 394), and mothers (n = 160). Convergent and divergent validity of the CAAS data was tested against scores on the Career Adaptability Scale of the Career Futures Inventory (CA-CFI) using a multitrait-multimethod (MTMM) framework. The criterion validity of the CAAS scores with respect to data on self-efficacy and satisfaction with life was also investigated. The results support the multidimensional, hierarchical latent structure of the CAAS data. The invariance of the retained structure across the distinct samples as well as support for convergent, divergent, and test-criterion validity further attests the suitability and wide applicability of the CAAS as a measure of career adaptability.
The Career Adapt-Abilities Scale (CAAS; Savickas & Porfeli, 2012) is the most widely used measure of career adaptability. A recent meta-analytic study of the CAAS attests to its popularity and wide applicability for research and practice (Rudolph, Lavigne, & Zacher, 2016). Yet, there are issues about the psychometric properties of the CAAS that require examination. The majority of research that uses the CAAS involves student and professional samples, but less is known about its applicability to nonprofessional samples. The higher order factor solution retained in studies of the CAAS latent structure purport a higher order factor and four lower order factors (i.e., concern, control, curiosity, and confidence) and assumes a factor model for continuous data. However, it is not known if its factor structure and invariance holds for ordered categorical data, given that the requirements for measurement invariance are different for polytomous and continuous outcomes (Lubke & Muthén, 2004). Finally, little is known about the CAAS’s converge with other measures of career adaptability present in the literature.
The present three studies respond to these issues and provide new findings about career adaptability’s latent structure using a factor model and estimation routine appropriate for ordinal categorical data, tests of full measurement invariance suitable for polytomous data, multitrait-multimethod (MTMM) analyses of convergent and divergent validity, analyses of test-criterion associations, and analyses across three different samples with distinctive occupational qualities.
Measurement Issues
Critical scholarship argues that vocational psychology neglects the needs and interests of individuals who are outside the normative conceptualizations of career and mainstream occupations (e.g., Blustein, 2013). With few exceptions (e.g., unemployed workers; Duarte et al., 2012; Maggiori, Johnston, Krings, Massoudi, & Rossier, 2013), the CAAS has not been used for research involving marginalized and understudied populations. To partially close that gap in the literature, the present research recruited two samples of social occupations (Holland, 1997) minimally represented in the vocational psychology literature: retail workers in relatively low paid work (e.g., shop assistants) and mothers transitioning from full-time unpaid care work to paid work. Given the CAAS is used frequently with student and professional samples, we used a sample of preservice teachers as the referent measurement model for the studies. We selected these three social occupations because they indicate a qualification spectrum ranging from formal qualifications and training through to no formal qualification requirements, yet all are directly focused on the persons who define their work (i.e., students, customers, and children).
Savickas and Porfeli (2012) initially found support for the invariance of the CAAS item factor loadings across distinct countries. However, the invariance of item intercepts (or thresholds) was not systematically tested, as the researchers argued that scalar invariance is not expected for the CAAS, because career adapt abilities are psychosocial variables that are not independent of context. Nonetheless, establishing scalar invariance is an important prerequisite for valid between-group comparisons on latent variables. Intercept noninvariance suggests that items are functioning differently across the discrete groups, holding constant the levels of the latent adapt abilities, which represents a key source of measurement bias.
Since the CAAS’s publication in 2012, a few studies have examined measurement equivalence of the CAAS, including tests of scalar invariance (e.g., Di Maggio, Ginevra, Laura, Ferrari, & Soresi, 2015; Johnston, Luciano, Maggiori, Ruch, & Rossier, 2013). A limitation of these studies is that they are based on procedures for testing measurement equivalence assuming factor models for continuous data. When polytomous data are treated as continuous, thresholds between categories of response are not estimated. Yet, thresholds provide crucial information about group-specific response patterns that may be concealed when using multiple-group continuous factor models, which may obscure meaningful between-group comparisons (Lubke & Muthén, 2004). In the present research, we redress this issue by examining the equivalence of the multidimensional, hierarchical structure of the CAAS using tests of invariance that are adapted for polytomous data (Millsap & Yun-Tein, 2004).
As a self-regulatory resource, career adaptability’s positive effects are evident in the CAAS’s associations with adapting (e.g., career planning, exploration, occupational self-efficacy, and career decision-making self-efficacy) and adaptation outcomes (e.g., life satisfaction, job satisfaction, and turnover intentions), as demonstrated in a recent meta-analytic study (Rudolph et al., 2016). However, there are no studies in the literature that report on the convergence of the CAAS with other established measures career adaptability. In the present research, we use the Career Adaptability subscale of the Career Futures Inventory (CA-CFI) to test convergence between CAAS and CA-CFI (Rottinghaus, Day & Borgen, 2005) because that scale’s conceptualization emanated from Savickas’s (1997) reformulation of career adaptability drawn from Super and Knasel (1981), which ultimately became the conceptual underpinnings of the CAAS. Thus, the CA-CFI is the closest measure to the CAAS in conceptual terms.
The Present Study
In Study 1, the latent structure underlying CAAS responses is examined in a sample of college students undertaking education to enter the profession of teacher. The study uses an estimation routine that is appropriate for the ordered categorical nature of the test items. We also investigate the convergence of CAAS scores, based on the retained model, with responses from the CA-CFI in an MTMM framework. Within this framework, we also examine evidence for construct discrimination among the four adaptability subdimensions of the CAAS. In addition, we examine test-criterion associations of career adaptability with self-efficacy. In Studies 2 and 3, the replicability of the retained factor structure is examined in independent samples of retail workers and mothers returning to work, respectively. We extend these tests of invariance to include an examination of latent mean differences across the samples and test-criterion associations of career adaptability with life satisfaction as a reflection of adaptation. The human research ethics committee of University of Southern Queensland approved all three studies separately.
Study 1: Latent Structure, Convergent and Divergent Validity Evidence in a Student Professional Population
The profession of schoolteacher has high levels of burnout and career attrition in the early years (Skaalvik & Skaalvik, 2010). Fortunately, teachers’ self-efficacy is associated with positive outcomes for their students and job satisfaction and lower levels of burnout (Zee & Koomen, 2016). The relation between other occupations’ self-efficacy and career adaptability (Rudolph et al., 2016) is reason to investigate whether career adaptability is associated with teachers’ self-efficacy because both may interact with one another to affect teachers’ professional effectiveness and engagement—which are topics of serious international concern for governments seeking to stem the flow of attrition from the profession (Organization for Economic Cooperation & Development [OECD], 2014).
Method
Participants and Procedure
Participants were 344 preservice teachers enrolled in a bachelor of education degree at a medium-sized regional university in Australia and undertaking a senior-level course in classroom management. The M age = 31.84 years (SD = 9.45) and 85.5% (n = 294) was female, which is consistent with the university’s demographic profile. Participants were invited to complete an online survey for which they were eligible to enter a prize draw.
Measures
CAAS
The international version of the CAAS (Savickas & Porfeli, 2012) includes 24 items that measure concern (e.g., “Thinking about what my future will be like”), control (e.g., “Keeping upbeat”), curiosity (e.g., “Exploring my surroundings”), and confidence (e.g., “Performing tasks efficiently”), measured as ratings of agreement on a 5-point Likert-type scale ranging from 1 (not strong) to 5 (strongest). The CAAS was designed to yield a global index of career adaptability as well as scores on the four adaptability resources. In the present sample, internal consistencies for the total scale score (α = .93), Concern (α = .85), Control (α = .83), Curiosity (α = .88), and Confidence (α = .88) subscales were acceptable.
CFI
The CFI (Rottinghaus et al., 2005) comprises 25 items designed to measure Career Adaptability, Career Optimism, and Knowledge of the world of work. We used the 11-item Career Adaptability subscale (CA-CFI). The inventory uses a 5-point Likert-type scale, ranging from 1 (strongly disagree) to 5 (strongly agree) as responses to agreement with items, such as “I am good at adapting to new work settings.” The internal consistency (α = .86) was acceptable.
Teachers’ Sense of Efficacy Scale (TSES)
The 24-item TSES (Tschannen-Moran & Anita Woolfolk Hoy, 2001) measures (a) efficacy for using effective instructional strategies (e.g., “How well can you respond to difficult questions from your students?”), (b) efficacy for managing student conduct and behaviors (e.g., “How much can you do to control disruptive behavior in the classroom?”), and (c) efficacy for engaging students in learning (e.g., How much can you do to get through to the most difficult students?”). Responses are rating of agreement on a 9-point Likert-type scale, ranging from 1 (nothing) to 9 (a great deal). In the present study, internal consistencies for the Instructional Strategies (α = .904), Classroom Management (α = .96), and Student Engagement (α = .94) subscale scores were acceptable.
Statistical Analysis
Analyses were conducted in three phases. First, confirmatory factor analysis (CFA) was conducted to test the expected hierarchical, multidimensional structure of the CAAS data. CAAS items were specified to load on the concern, control, curiosity, or confidence first-order factors, as per the a priori scoring key, and these first-order factors, in turn, were specified to load onto a second-order adaptability factor. Disturbance covariances of the first-order factors were fixed at 0.
The second phase of the analyses involved tests of convergence and divergence of the CAAS and CA-CFI scores. These tests were conducted using an abridged version of Widaman’s (1985) taxonomy of hierarchically nested covariance structure models for MTMM data. Four nested models were specified as follows: (a) a null model with no trait or method factors (MTMM-1); (b) a model with two orthogonal methods factors only (MTMM-2), representing the distinct scoring instruments; (c) a model with one general trait factor and two orthogonal method factors (MTMM-3); and (d) a model with the a priori higher order career adaptability structure and two orthogonal method factors (MTMM-4). For MTMM-3, items that were drawn from the CAAS and the CA-CFI defined the general factor. For MTMM-4, the second-order career adaptability factor was indicated by the first-order CAAS factors as per the espoused factor structure, and the CA-CFI items indicated the higher order adaptability factor. For the CA-CFI items, three sets of correlated uniquenesses (θ10,11, θ11,8, θ7,2) were specified to account for intradimensional local dependence generated by item wording effects (e.g., Item 10: “I am rarely in control of my career”; Item 11: “I am not in control of my career success”). All method factors were specified as independent clusters CFA factors with null relations with trait factors. From these nested model tests, evidence of convergent validity is obtained if the best fitting model provides an appreciably better fit to the data than the model positing no trait factors. Divergent evidence is obtained if the best fitting model shows an appreciable improvement in fit relative to the model positing the presence of only one general trait factor.
The final phase of the analyses involved an examination of the test-criterion associations of the CAAS scores with TSES scores. A General Latent Variable Model (GLVM) was specified, comprising the retained CAAS measurement structure and the instructional strategies, classroom management, and student engagement teacher self-efficacy factors indicated by the TSES items. In this model, the teacher self-efficacy factors were regressed on career adaptability, with freely estimated disturbance covariances for the efficacy factors (Kline, 2012).
Statistical analyses were performed using Mplus 7.4 (Muthén & Muthén, 1998–2012). All solutions were estimated using robust diagonal weighted least squares with a mean- and variance-adjusted test statistic, operationalized as the weighted least squares means and variance adjusted (WLSMV) estimator in Mplus. This estimation routine is better suited to the ordered categorical nature of the sample data than maximum likelihood estimation assuming a continuous factor model. As the χ2 can be oversensitive to even minor model misspecifications given moderately large samples and contains a restrictive hypothesis test (i.e., exact fit), three approximate fit indices were considered: comparative fit index (CFI) and Tucker–Lewis index (TLI), >.900 and >.950 for acceptable and excellent fit, respectively; and root mean square error of approximation (RMSEA), <.050 and <.080 for close and reasonable fit, respectively (Marsh, Hau, & Wen, 2004). For nested model comparisons, changes in the CFI (ΔCFI) and RMSEA (ΔRMSEA) were primarily used because the adjusted χ2 difference (MD χ2) test appropriate for the WLSMV estimator also tends to be sensitive to even trivial differences in moderately large samples. A decrease in the CFI and increase in the RMSEA of less than .01 and .015, respectively, are suggestive of support for a more restrictive model (Chen, 2007; Cheung & Rensvold, 2002).
Results and Discussion
Latent Structure
The test of the expected higher order model provided an acceptable to excellent fit to the data, χ2(248) = 582.908, p < .001, CFI = .966, TLI = .962, RMSEA = .063 (.056, .069). Parameter estimates from this model are shown in Table 1. The first-order concern (l = .447–.889, M = .771), control (l = .602–.853, M = .747), curiosity (l = .760–.877, M = .806), and confidence (l = .726–.892, M = .820) factors were well defined with uniformly moderate to strong item loadings. Similarly, the higher order adaptability factor (l = .639–.853, M = .799) was well defined with strong factor loadings. This model was retained for further analyses.
First- and Second-Order Factor Loadings From the Retained Hierarchical Solution in the Sample of Preservice Teachers.
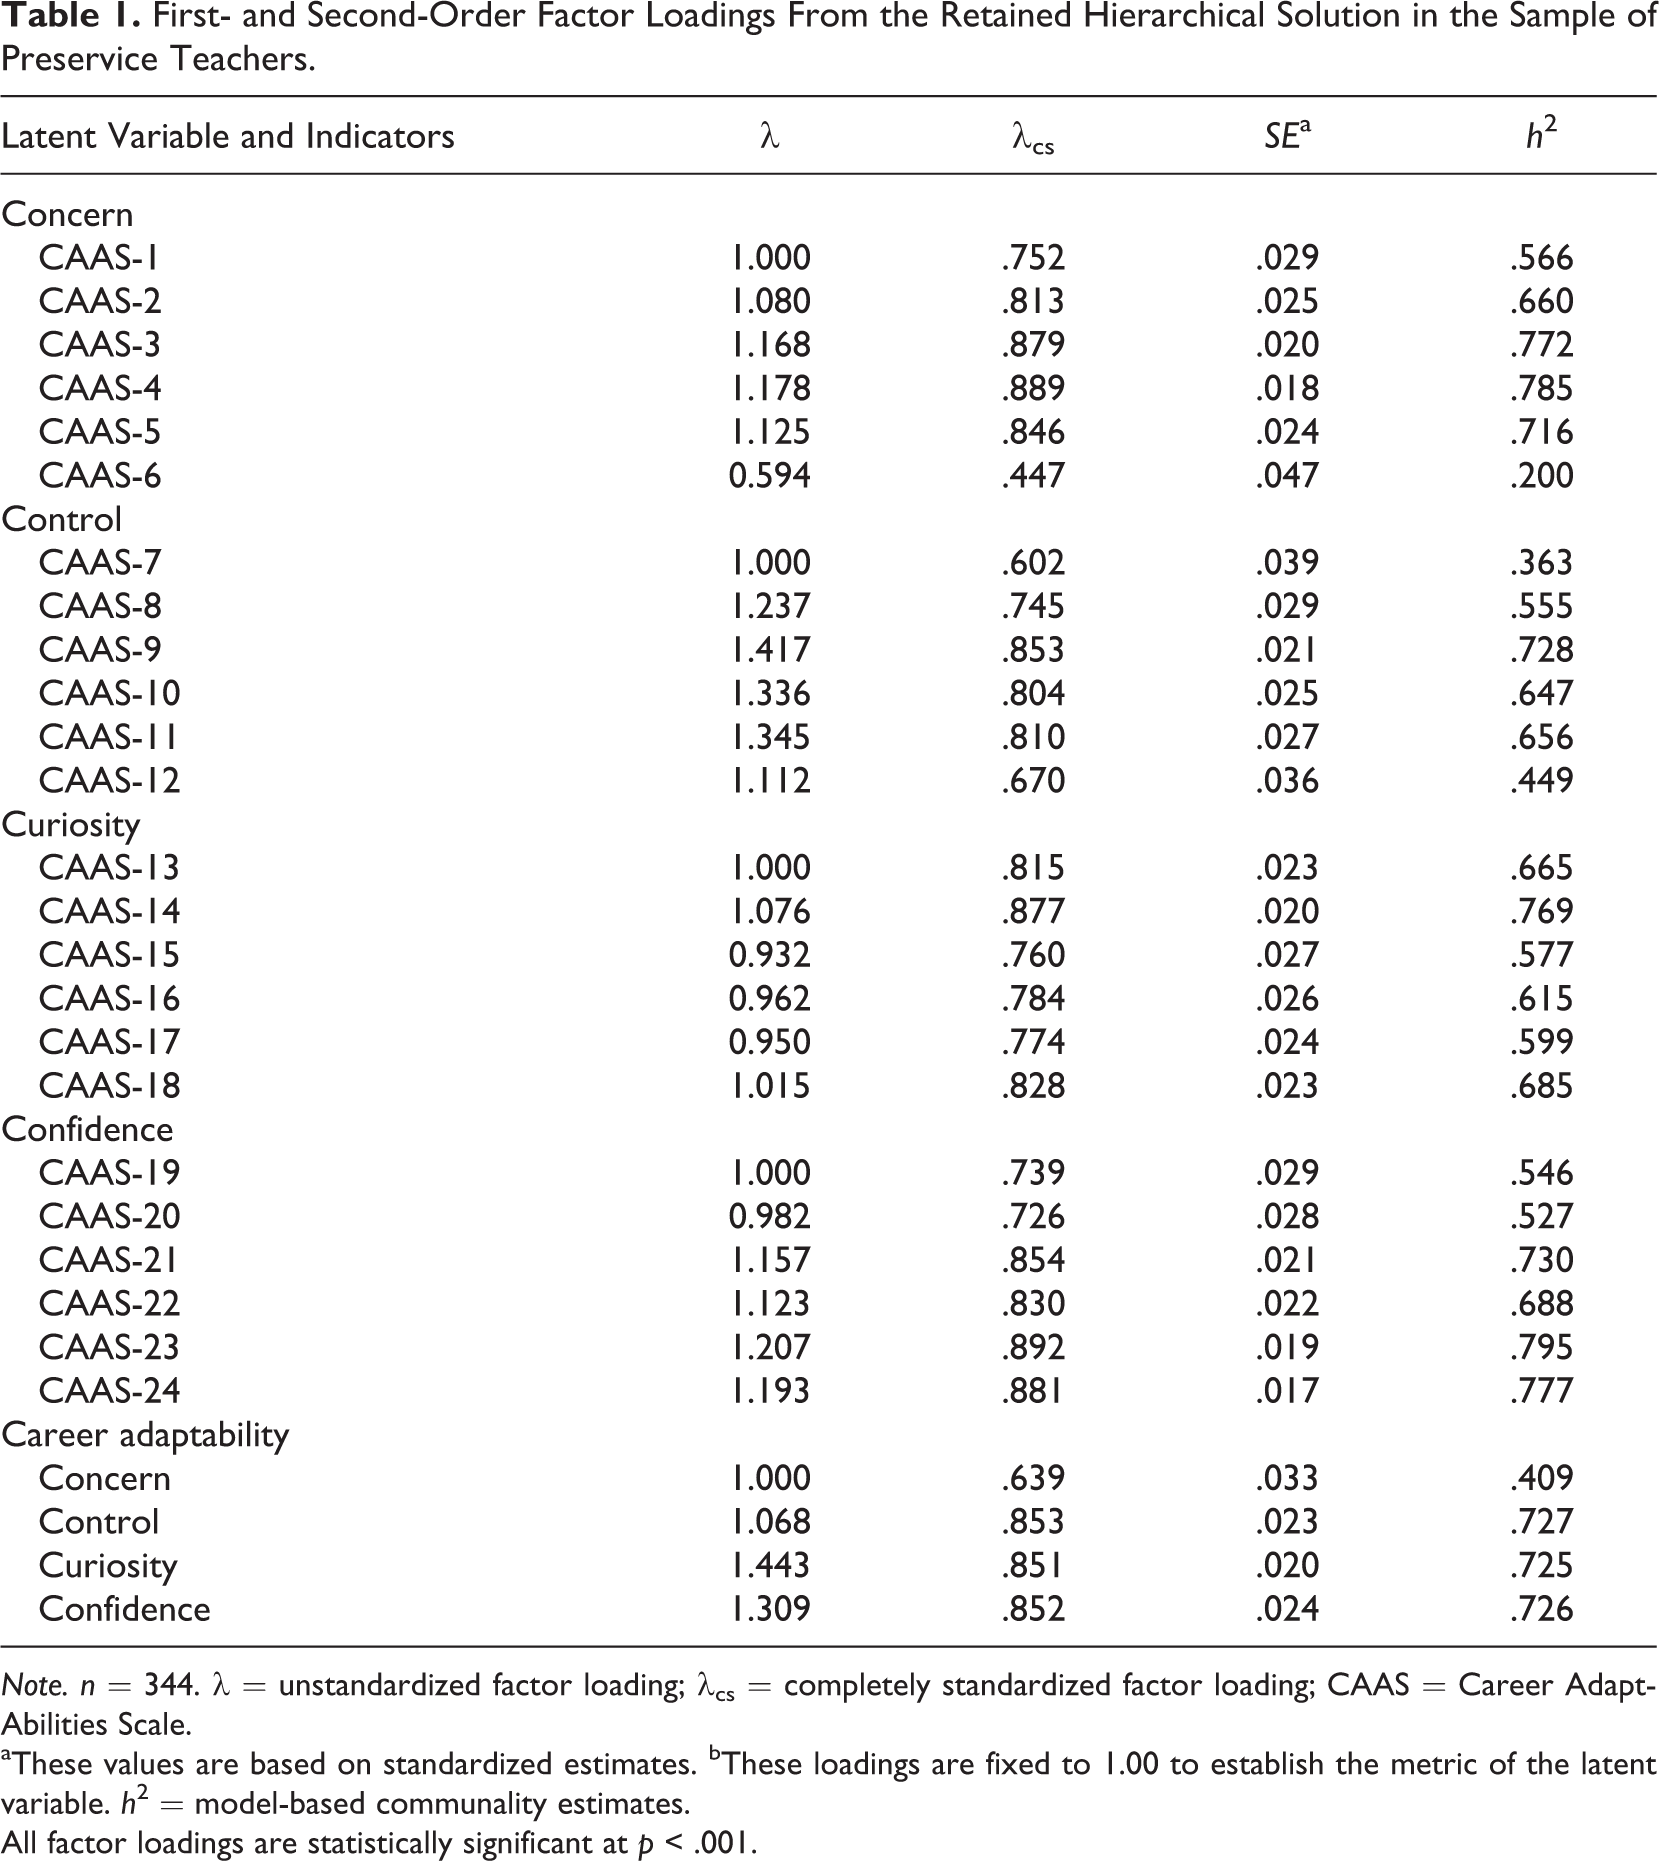
Note. n = 344. λ = unstandardized factor loading; λcs = completely standardized factor loading; CAAS = Career Adapt-Abilities Scale.
aThese values are based on standardized estimates. bThese loadings are fixed to 1.00 to establish the metric of the latent variable. h 2 = model-based communality estimates.
All factor loadings are statistically significant at p < .001.
Convergent and Divergent Validity Evidence
Fit indices for the four hierarchically nested MTMM models are shown in Table 2. Notably, all four models converged to admissible solutions. Of these models, MTMM-4, positing a hierarchical, multidimensional structure of career adaptability and two orthogonal method factors, provided the best fit to the data. Table 3 shows the parameter estimates from this model. The higher order adaptability trait factor was well defined with all loadings of the first-order CAAS factors and CA-CFI items statistically significant and largely moderate to strong, controlling for the effects of distinct measurement tools. The loadings of the CAAS first-order factors (λ = .639–.867, M = .795) on the higher order factor were larger than the loadings of the CA-CFI items (λ = .281–.644, M = .530). However, the CA-CFI loadings were sufficiently strong to suggest convergence of CAAS responses with the CA-CFI scores. A direct examination of convergence is the comparative test of MTMM-4 against MTMM-1. The latter posits the presence of two method factors and no trait factors. MTMM-4 provided an appreciably better fit to the data than MTMM-1, providing convergent evidence of validity.
Fit Statistics for the MTMM Model.

Note. n = 344. MTMM = multitrait-multimethod; df = degrees of freedom; CFI = comparative fit index; TLI = Tucker–Lewis index; RMSEA = root mean square error of approximation; CI = confidence interval; MD χ2 = chi-square different test for the WLSMV estimator operationalized via the DIFFTEST function in Mplus.
***p < .001.
Factor Loading Estimates From the Retained Multitrait-Multimethod Solution.

Note. CAAS = Career Adapt-Abilities Scale.
All trait loadings were statistically significant at p < .001. Statistically significant (at p < .05) method factor loadings estimates are shown in bold.
The key comparison for inferring divergence is the comparison of MTMM-4 with MTMM-3, noting that the latter posits one general trait factor and two orthogonal method factors. MTMM-4 provided an appreciably better fit to the data than MTMM-3, indicating discrimination among the concern, control, curiosity, and confidence constructs. These findings also support the multidimensional perspective inherent in the hierarchical, multidimensional model of career adaptability.
A GLVM was specified to examine the relations between career adaptability, as per the retained hierarchical, multidimensional CFA model, and the teacher self-efficacy dimensions. The test of this model resulted in a good fit to the data, χ2(1,070) = 1,713.320, p < .001, CFI = .980, TLI = .979, RMSEA = .040 (.037, .044). As show in Figure 1, career adaptability was strongly and significantly associated with efficacy for instructional strategies, classroom management, and student engagement.
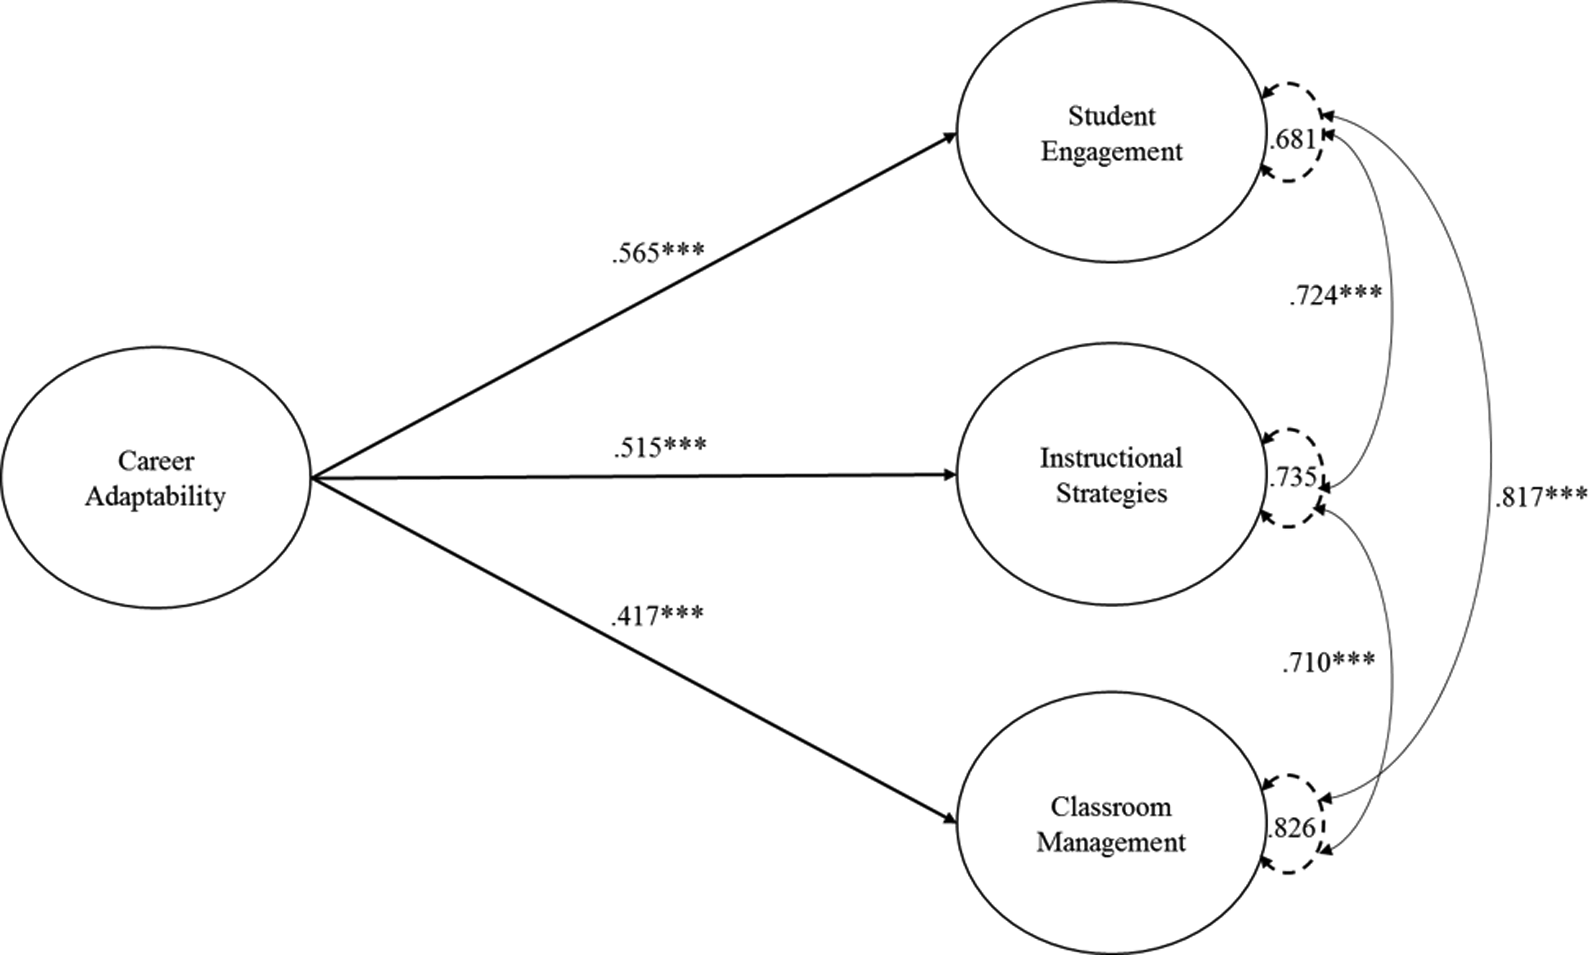
Standardized coefficients for the regression of the latent teacher self-efficacy dimensions on career adaptability. ***p < .001.
These results are the first to affirm the factorial validity of the CAAS in a sample of preservice teachers. The finding of an association between the measure of teacher self-efficacy and CAAS accords with literature about the validity of CAAS responses associated with occupational self-efficacy (Maggiori, Rossier, & Savickas, 2017). Having established this baseline of the CAAS in this student/professional sample, we now turn to the CAAS in understudied populations, which is a crucial for determining the applicability of the CAAS to the broader workforce.
Study 2: Factor Structure and Relations With Adaptation in Retail Employees
Dealing with unfriendly customers is stressful on retail workers (Johnson, Holdsworth, Hoel, & Zapf, 2013), yet research into meaningfulness of work for white-, pink- (which includes retail employees), and blue-collar employees found that, “regardless of their occupational status, workers want their work to matter to their inner selves, even while the extent to which people actually experience their work as meaningful varies across occupations” (Lips-Wiersma, Wright, & Dik, 2016, p. 544). Discerning the measurement of career adaptability in retail workers’ will enable further research into understanding how they understand their work and life satisfaction.
Participants and Procedure
The present sample comprised 394 retail workers. The M age = 25.87 (SD = 9.51) and 72.1% (n = 284) of the sample was female. One participant did not report age. A range of retail categories was represented in the sample: supermarket and grocery outlets (n = 84, 21.3%); specialized food stores (n = 84, 21.3%); department stores (n = 62, 15.7%); clothing, footwear, or fabric specialty outlets (n = 51, 12.9%); furniture, floor covering, hardware, domestic appliance, or music stores (n = 25, 6.3%); pharmaceuticals, cosmetics, antiques, used goods, garden equipment, or watch/jewelry stores (n = 73, 18.5%); household equipment repair services (n = 5, 1.3%); motor vehicle dealerships (n = 2, 0.5%); and motor vehicle services (n = 8, 2.0%). The number of hours worked per week ranged from 1 to 50 (M = 17.13, Mdn = 15.00, SD = 11.09). Ten participants entered inadmissible values for the average number of hours worked per week. These values were omitted from the data set and treated as missing data. Graduate students attended local shopping malls to invite participants to complete an online survey that included eligibility to enter a prize draw.
Measures
CAAS
A description of the CAAS can be found in the report of measures for Study 1. The coefficient α reliabilities for this sample of retail workers were total scale score (α = .940) and concern (α = .848), control (α = .842), curiosity (α = .884), and confidence (α = .903).
Satisfaction With Life Scale (SWLS)
We used the SWLS (Diener, Emmons, Larsen, & Griffin, 1985) that is designed to measure individuals’ cognitive-evaluative judgment of satisfaction with life as a whole. The scale consists of 5 items (e.g., “In most ways my life is close to my ideal”), responded to on a 7-point Likert-type scale, ranging from 1 (strongly disagree) to 7 (strongly agree). In the present sample, the internal consistency for the total SWLS score (α = .909) was acceptable.
Statistical Analyses
Analyses were conducted in three phases. First, the hierarchical, multidimensional structure retained in Study 1 was tested separately with the sample of retail workers. Second, and subject to the acceptable fit of the higher order structure, the model was subjected to multigroup (MG) tests of full measurement and structural invariance across the Study 1 and Study 2 samples to examine the cross-sample replicability of the structure and any plausible latent means differences in career adaptability across the samples. These MG tests were conducted using a sequential testing strategy based on Millsap and Yun-Tein’s (2004) taxonomy of invariance tests for models estimated from ordered categorical data adapted for higher order models (Cheung, 2008). This involved an initial test of the invariance of the first-order model, without the specification of a second-order structure, including, sequentially, tests of (a) first-order configural invariance and the invariance of (b) first-order factor loadings (i.e., weak invariance), (c) thresholds (i.e., strong invariance), (d) uniquenesses (i.e., strict invariance), (e) first-order variance/covariance matrix, and (f) first-order latent means. Next, the invariance of the second-order model was tested with the baseline model specified according to the first-order strictly invariant model. This sequence included an examination of (g) second-order configural invariance and, sequentially, equivalence of the (h) second-order loadings, (i) second-order intercepts, (j) factor disturbances, (k) second-order variance, and (l) second-order factor mean. For the MG invariance tests, the preservice teacher sample from Study 1 served as the reference group. In the final phase of the analyses, the test-criterion association of career adaptability with life satisfaction was examined. This model comprised career adaptability, as per the supported CAAS structure, as well as a unidimensional life satisfaction factor indexed by items from the SWLS. Life satisfaction was regressed on career adaptability.
Results and Discussion
Latent Structure
The test of the higher order model resulted in an acceptable fit to the data, χ2(248) = 868.964, p < .001, CFI = .951, TLI = .945, RMSEA = .080 (.074, .086). Parameter estimates are shown in Table 4. The concern (l = .507–.842, M = .739), control (l = .614–.836, M = .738), curiosity (l = .751–.851, M = .806), and confidence (l = .775–.900, M = .837) first-order factors were well defined with uniformly moderate to strong standardized loadings. Likewise, the higher order adaptability factor was well defined (l = .619–.894, M = .818).
First- and Second-Order Factor Loadings From the Retained Hierarchical Solution in the Samples of Retail Workers.

Note. n = 394. λ = unstandardized factor loading; λcs = completely standardized factor loading; CAAS = Career Adapt-Abilities Scale.
aThese values are based on standardized estimates. bThese loadings were fixed to 1.00 to establish the metric of the latent variable. h 2 = model-based communality estimates.
All factor loadings are statistically significant at p < .001.
Replicability and Latent Mean Differences
Next, we examined the invariance of the CAAS responses as per the retained higher order model across the Study 1 and Study 2 samples. The preservice teacher sample served as the reference group.
Table 5 shows the fit statistics for the invariance models. The first-order configural invariance model (multiple-group model [MGM1]) provided an acceptable fit to the data. This baseline model was compared to the more parsimonious first-order weak invariance model in which the factor loadings were constrained to equality across groups. The test of the weak invariance model (MGM2) resulted in an acceptable fit to the data and no decrement in fit relative to the configural model. Indeed, the TLI and RMSEA increased and decreased, respectively, suggesting that the gain in parsimony with imposing equality constraints outweighs any loss in fit (Perera, McIlveen, Burton, & Corser, 2015). It is important to note that increases in the CFI should be interpreted as haphazard because, under WLSMV, which yields an adjusted χ2 test statistic to obtain appropriate p values, the CFI (and χ2) can be nonmonotonic with model complexity (Morin, Arens, Tran, & Caci, 2015). Support was also found for the equivalence of item thresholds (MGM3), uniquenesses (MGM4), and the factor variance–covariance matrix (MGM5; see Table 5).
Fit Statistics for the Invariance Tests Across the Preservice Teacher and Retail Worker Samples.
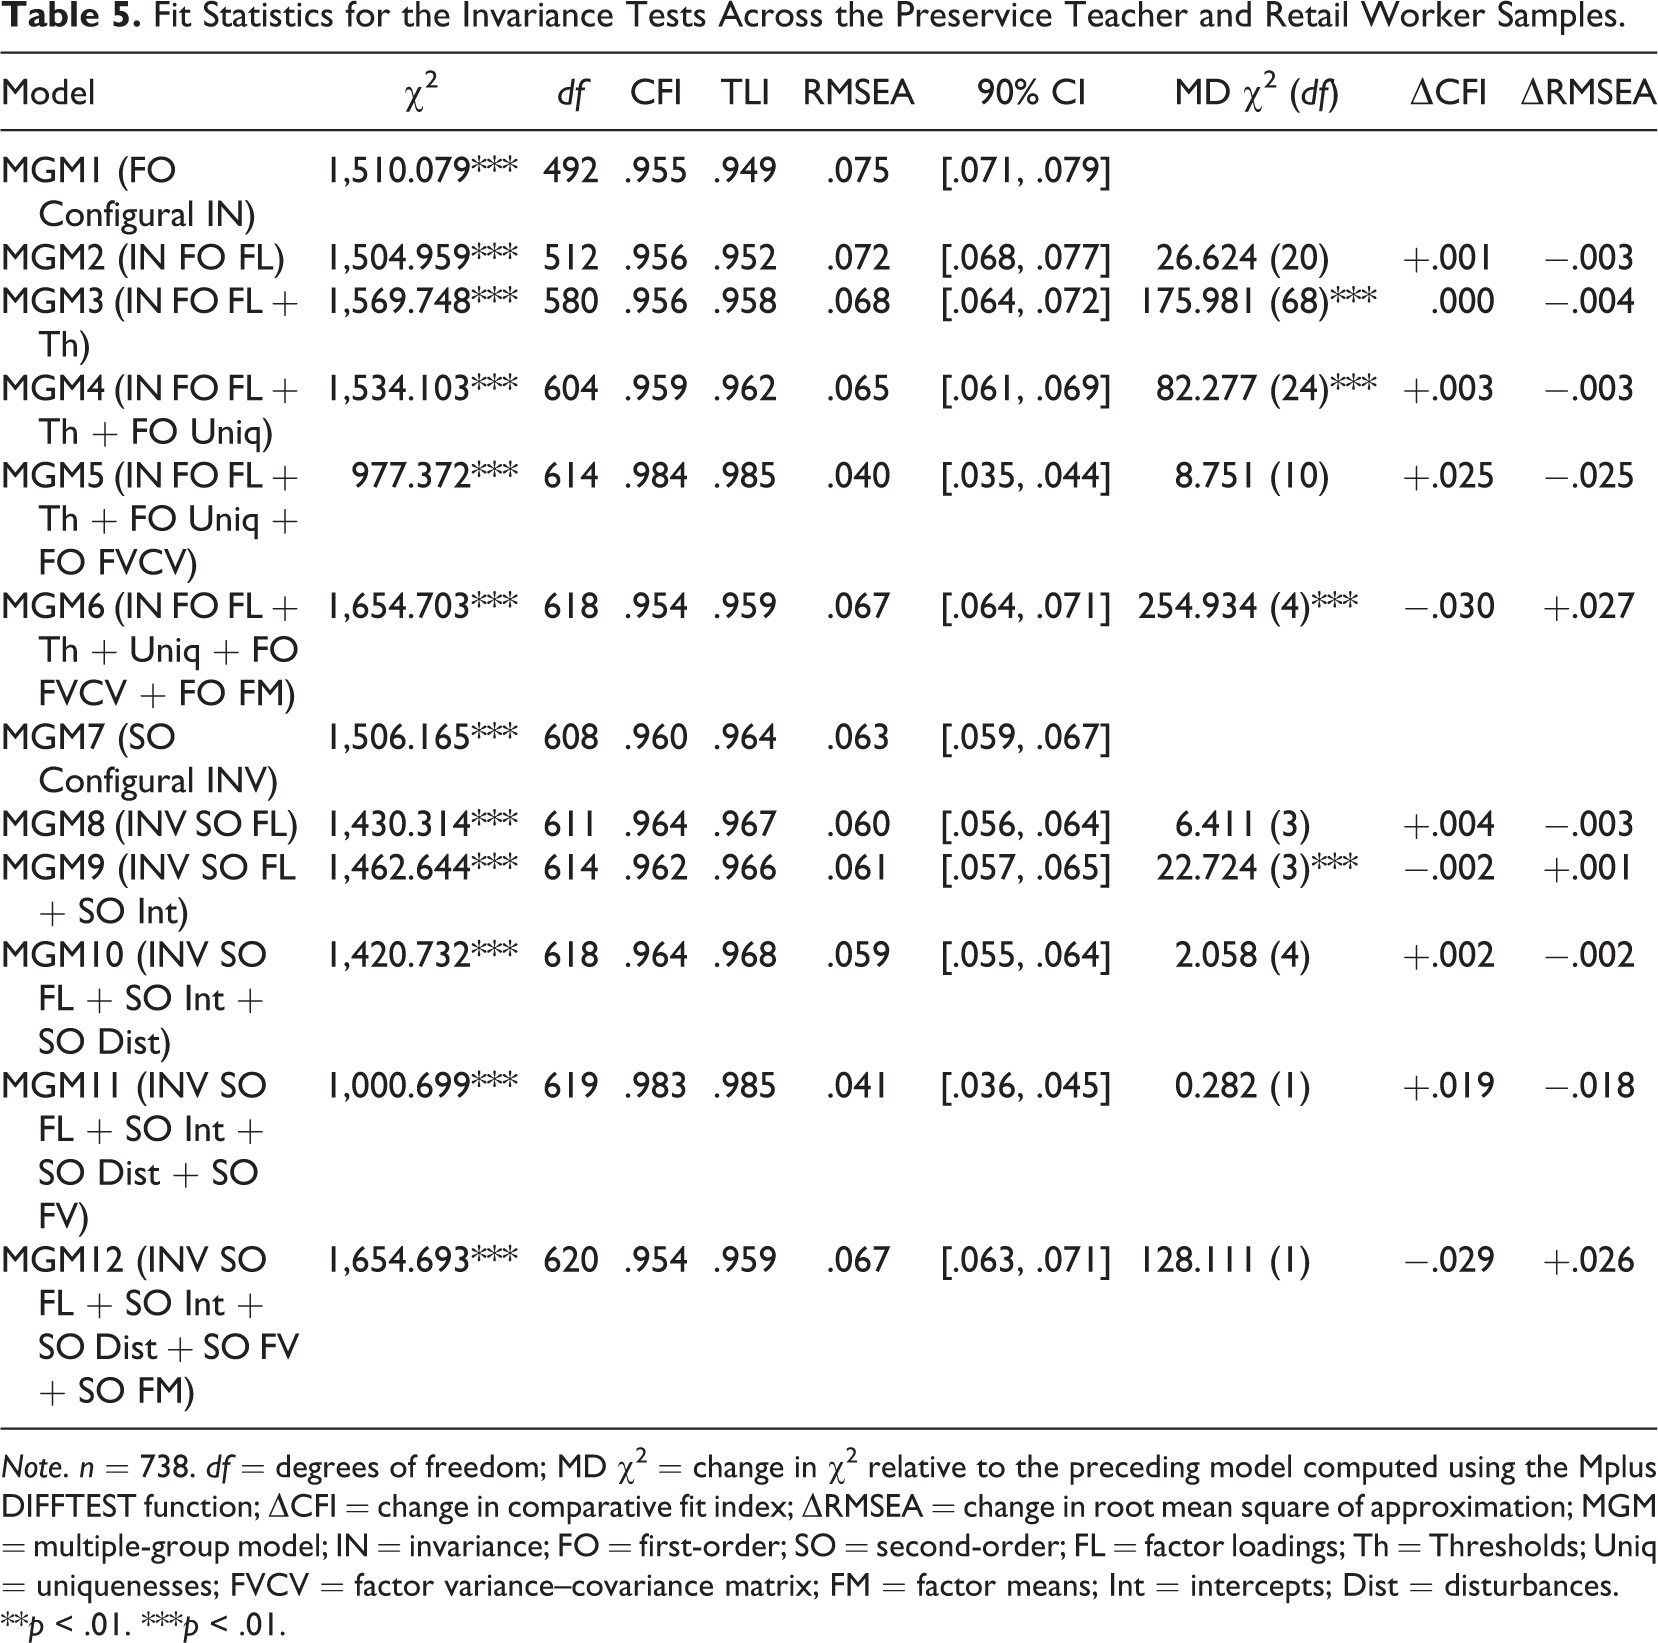
Note. n = 738. df = degrees of freedom; MD χ2 = change in χ2 relative to the preceding model computed using the Mplus DIFFTEST function; ΔCFI = change in comparative fit index; ΔRMSEA = change in root mean square of approximation; MGM = multiple-group model; IN = invariance; FO = first-order; SO = second-order; FL = factor loadings; Th = Thresholds; Uniq = uniquenesses; FVCV = factor variance–covariance matrix; FM = factor means; Int = intercepts; Dist = disturbances.
**p < .01. ***p < .01.
The test of the model positing the equality of first-order latent means (MGM6) resulted in a substantial decrement in fit relative to the less restrictive MGM5. Furthermore, modification indices for the factor mean equality constraints were considerable; thus, indicating that freeing the constraints would substantially improve model fit. Accordingly, we inspected the factor means in MGM5, in which they were freely estimated in the comparison group. Latent means in the retail worker sample, expressed as SD units from the preservice teacher means (i.e., M = .00), were significantly lower for the concern (M = −.841, p <. 001), control (M = −.740, p <. 001), curiosity (M = −.757, p < .001), and confidence (M = −.734, p < .001) factors.
We then examined the invariance of the higher order structure, with the first-order strictly invariant model (MGM7) serving as the baseline model from which the second-order configurally invariant model (MGM8) was specified. As shown in Table 5, the second-order configurally invariant model provided a good fit to the data. In addition, support was found for the invariance of second-order factor loadings (MGM9), second-order intercepts (MGM10), factor disturbances (MGM11), and the second-order factor variance (MGM12). However, the test of MGM12, positing the invariance of the second-order factor mean, resulted in an appreciable degradation in fit relative to MGM11 in which the factor means in the comparison groups were freely estimated. Thus, MGM11 was retained and examined for latent mean differences. The latent mean for the second-order career adaptability factor was substantially lower in the retail workers (M = −.925, p < .001) than in the reference preservice teacher group.
Test-Criterion Associations
Finally, a GLVM was specified to test the criterion-related validity of the CAAS scores, based on the retained multidimensional, hierarchical model, with respect to life satisfaction. The test of the structural model resulted in an acceptable fit to the data, χ2(372) = 878.704, p < .001, CFI = .969, TLI = .966, RMSEA = .059 (.054, .064). In line with predictions, CAAS was positively and significantly associated with SWLS (γus = .184, p < .05; γcs = .099). 1
Study 3: Factor Structure and Relations With Adaptation in Mothers
The work of mothering, of being a mother, should be valued just as any other form of work is valued (Schultheiss, 2009). Decisions about balancing commitment and resources to care work and paid work are complex (Powell & Greenhaus, 2012), and mothers’ decision-making is distributed across several domains of responsibility (Gross-Spector & Cinamon, 2016). Some mothers provide unpaid care work for the duration of their children’s development, whereas some mothers combine their care work with part-time or full-time paid, market work. A successful return to paid work requires the psychological resources of career adaptability (Fouad & Bynner, 2008), particularly given unfair discriminatory bias against mothers (Hebl, King, Glick, Singletary, & Kazama, 2007). Although aspects of career adaptability (e.g., confidence) influence job seekers’ approaches to searching for and securing work (Koen, Klehe, Van Vianen, Zikic, & Nauta, 2010), there are no studies that use the CAAS to investigate the career adaptability of mothers who are not in the paid workforce because of their concomitant unpaid care work and who aim to transition from full-time, unpaid care work to paid work. For the present study, we sought to determine whether career adaptability could be measured in this understudied occupation.
Participants and Procedure
The present sample of 160 individuals who, having worked as mothers to raise their children, were aiming to enter or reenter the workforce. A range of age categories was reported in the sample, with 5.0% (n = 8) 18–24 years, 40.6% (n = 65) 25–34 years, 38.1% (n = 61) 35–44 years, 12.5% (n = 20) 45–54 years, and 3.1% (n = 5) 55 and over. One participant did not report her age range from the available categories. All participants reported at least one dependent child, and 75% (n = 120) reported the presence of a partner. Participants responded to an invitation to participate that was distributed at locations where mothers met (e.g., play centers) and were provided an opportunity to enter a prize draw.
Measures
CAAS
A description of the CAAS can be found in the report of Measures for Study 1. In the present sample, internal consistencies were acceptable for the total CAAS score (α = .919) and the concern (α = .856), control (α = .801), curiosity (α = .861), and confidence (α = .870) subscale scores.
SWLS
A description of the SWLS can be found in the report of Measures for Study 2. The internal consistency of the total SWLS score (α = .873) was acceptable in the current sample.
Statistical Analyses
Analyses were conducted in three phases. First, the hierarchical, multidimensional model of CAAS responses retained in Study 1 and Study 2 was tested separately with the present sample of mothers. Subject to the acceptable fit of the expected structure in the sample, we tested the complete invariance of scores implied by the structure across all three samples. These MG invariance tests were conducted in line with protocol outlined in Study 2 with the preservice teacher sample serving as the reference group, the retail worker sample serving as the first comparison group, and the current sample of mothers serving as a second comparison group, in a three-group solution. Finally, the test-criterion association of career adaptability with life satisfaction was examined. As in Study 2, a GLVM was specified with career adaptability, as per the retained structures, and a unidimensional life satisfaction factor indexed by the SWLS items. Life satisfaction was regressed on career adaptability. In addition, we examined the invariance of the adaptability-satisfaction relation across the retail and mother samples using formal MG tests of the equivalence of causal structures. For these analyses, the retail sample served as the reference group and the mothers served as the comparison group. Analyses were conducted using Mplus 7.4. Model estimation, fit evaluation, and nested model comparisons were conducted in accordance with the protocol outlined in Study 1.
Results and Discussion
Latent Structure
The hierarchical, multidimensional model provided a largely acceptable fit to the data, χ2(248) = 512.961, p < .001, CFI = .931, TLI = .923, RMSEA = .082 (.072, .092). As shown in Table 6, the first-order concern (l= .618–.878, M = .760), control (l = .633–.777, M = .694), curiosity (l = .702–.820, M = .765), and confidence (l = .724–.836, M = .791) factors were well defined with uniformly moderate to strong standardized loadings. Similarly, the second-order adaptability factor was well defined (l = .584–.871, M = .765).
First- and Second-Order Factor Loadings From the Retained Hierarchical Solution in the Sample of Mothers.
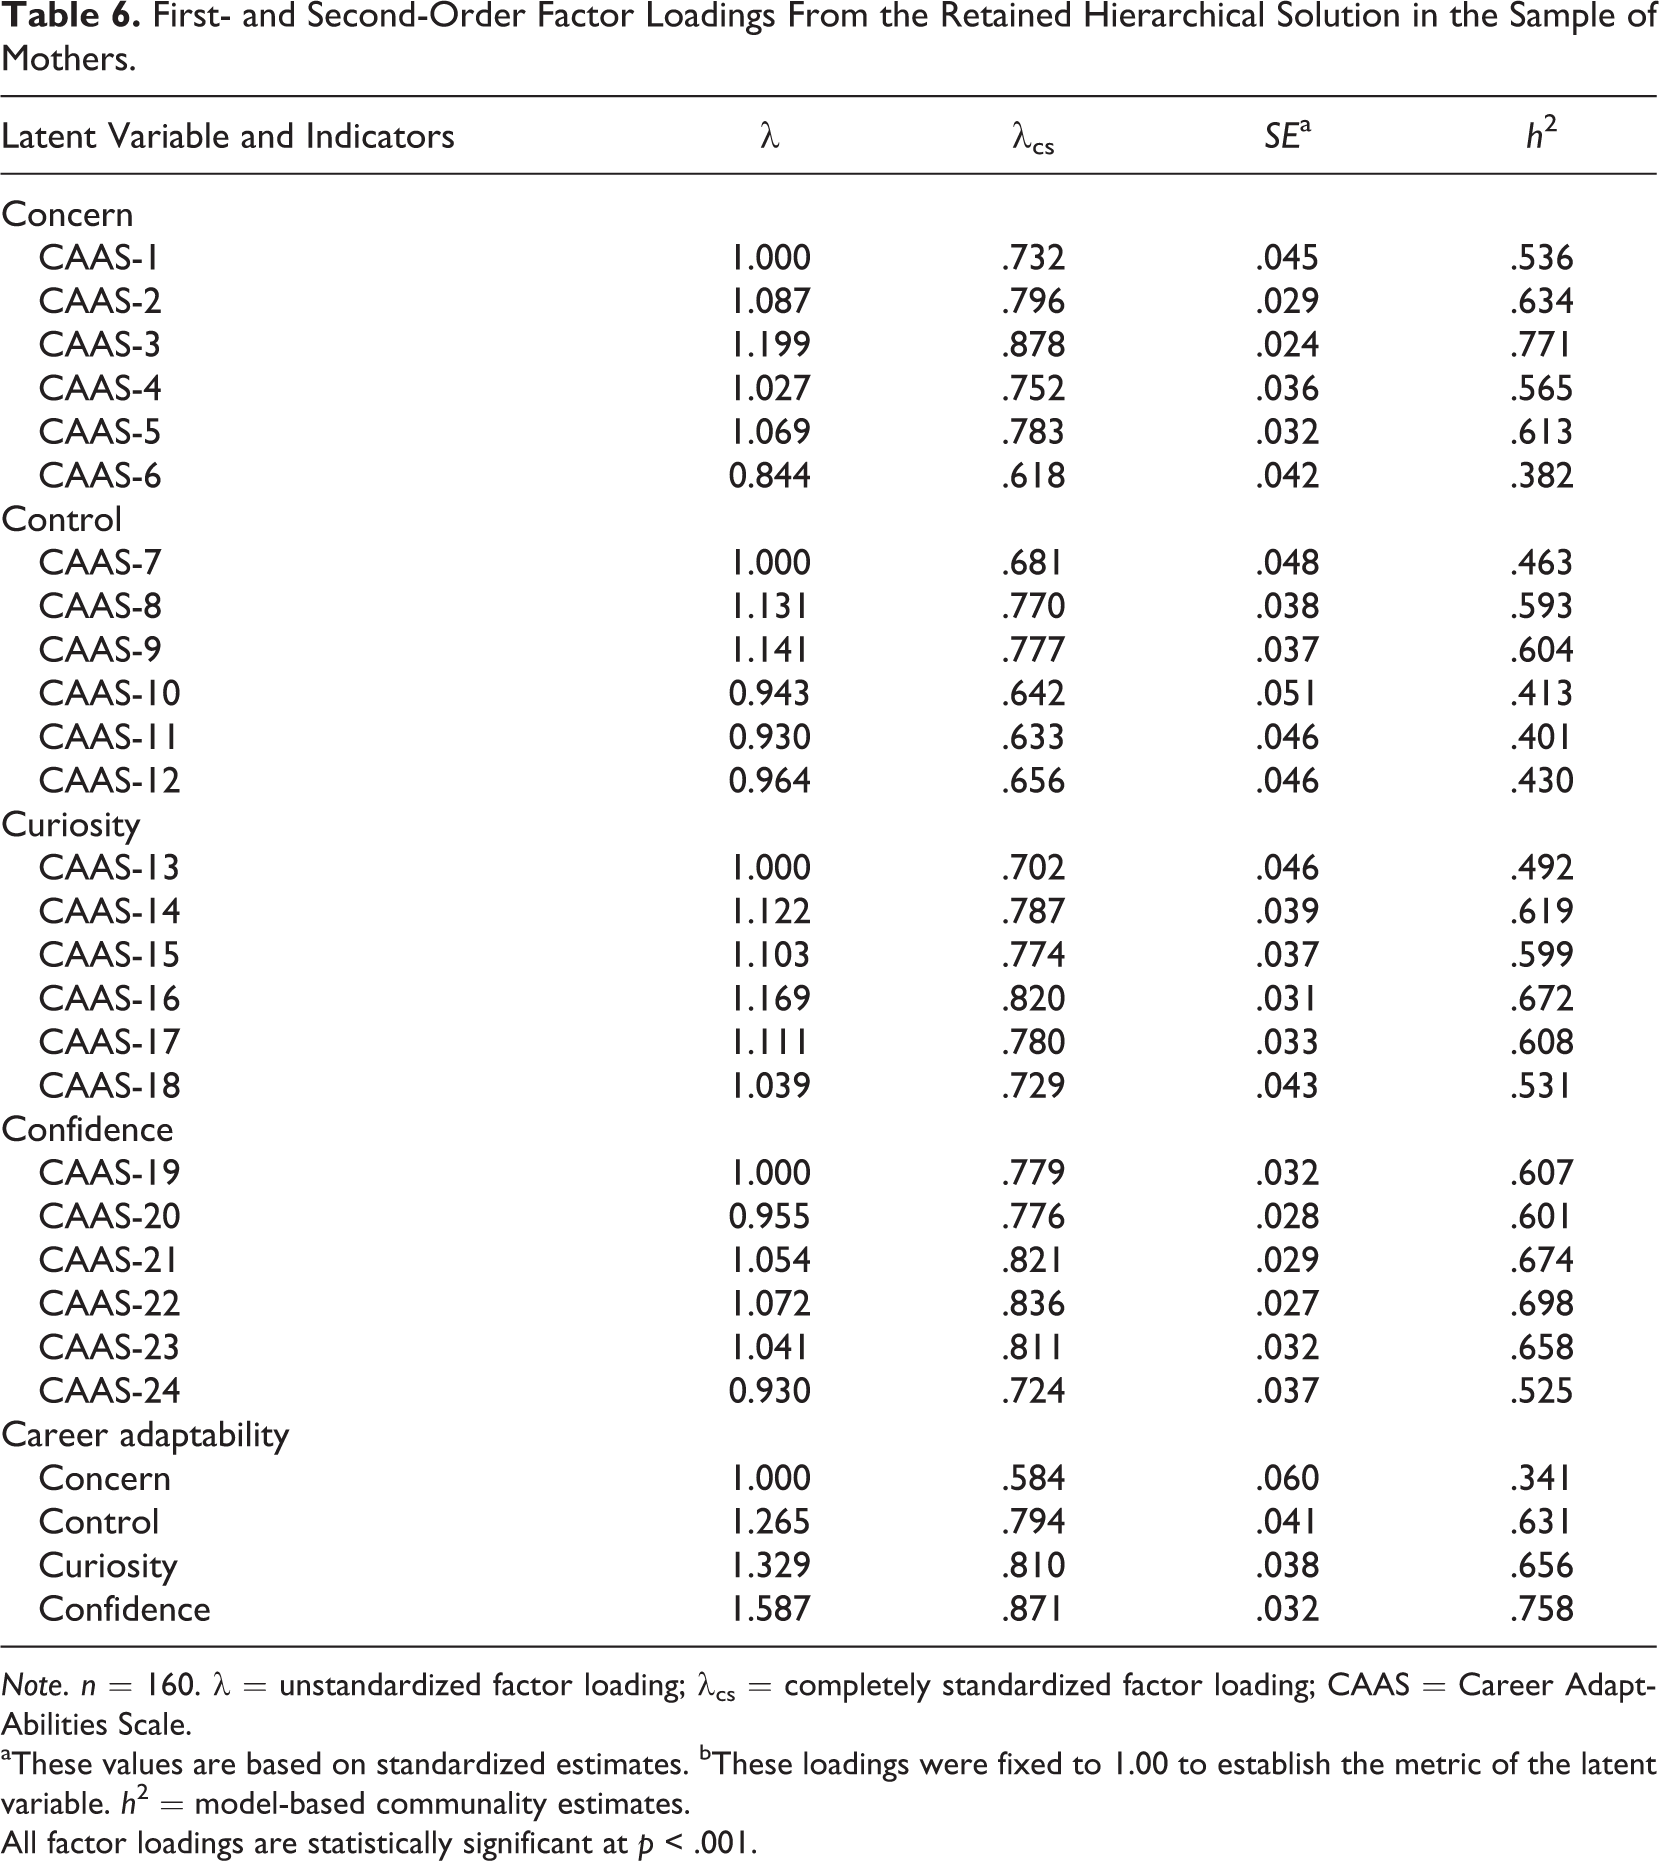
Note. n = 160. λ = unstandardized factor loading; λcs = completely standardized factor loading; CAAS = Career Adapt-Abilities Scale.
aThese values are based on standardized estimates. bThese loadings were fixed to 1.00 to establish the metric of the latent variable. h 2 = model-based communality estimates.
All factor loadings are statistically significant at p < .001.
Replicability and Latent Mean Differences
We next examined the invariance of the CAAS responses across the preservice teacher, retail worker, and mother samples. For the conduct of these invariance tests, responses to Item 9 of the CAAS had to be collapsed from its original five-category response scale into four categories, as there was an empty cell for this item involving the lowest category of response (Reise, Morizot, & Hays, 2007). An important assumption of models based on polytomous data, estimated with WLSMV, is that the same number of response categories is used across all groups. Violation of this assumption can lead to difficulties computing polychoric correlations. To ensure that no results were biased as a result of this recoding, we replicated all results with the Item 9 collapsed. However, only the MG invariance tests are based on the recoded items as reported here. Specifically, there were no observations on the “strongly disagree” response option in the sample of mothers. Table 7 shows fit statistics for the invariance models. The first-order configural invariance model (MGM1) provided an acceptable fit to the data. This baseline model was compared to the more restrictive first-order weak invariance model (MGM2) in which the factor loadings were constrained to equality across groups. The test of the weak invariance model resulted in an acceptable fit to the data and, notably, no decrement in fit relative to the configural model. There was support for invariance of item thresholds (MGM3), uniquenesses (MGM4), and the factor variance–covariance matrix (MGM5; see Table 7).
Fit Statistics for the Invariance Tests Across the Samples of Preservice Teachers, Retail Workers, and Mothers Returning to Work.

Note. n = 898. df = degrees of freedom; MD χ2 = change in χ2 relative to the preceding model computed using the Mplus DIFFTEST function; ΔCFI = change in comparative fit index; ΔRMSEA = change in root mean square of approximation; MGM = multiple-group model; IN = invariance; FO = first-order; SO = second-order; FL = factor loadings; Th = thresholds; Uniq = uniquenesses; FVCV = factor variance–covariance matrix; FM = factor means; Int = intercepts; Dist = disturbances.
**p < .01. ***p < .01.
The test of the model positing the equality of first-order latent means (MGM6) resulted in an appreciable decrement in fit relative to the less restrictive MGM5. In addition, modification indices pertaining to factor mean equality constraints were substantial, indicating that freeing the constraints would substantially improve model fit. Thus, we inspected the factor means in MGM5 in which they were freely estimated in the groups of retail workers and mothers. As in Study 2, latent means in the retail worker sample were significantly lower for the concern, control, curiosity, and confidence factors. Likewise, latent means in the sample of mothers were significantly lower than those in the reference preservice teacher group for the concern (M = −.619, p <. 001), control (M = −.646, p < . 001), curiosity (M = −.814, p < .001), and confidence (M = −.712, p < .001) factors.
Next, we examined the invariance of the second-order structure, with the first-order strictly invariant model serving as the baseline model from which the second-order configurally invariant model (MGM7) was specified. As shown in Table 7, the second-order configurally invariant model provided an acceptable-to-good fit to the data. In addition, support was found for the invariance of second-order factor loadings (MGM8), second-order intercepts (MGM9), factor disturbances (MGM10), and the second-order factor variance (MGM11). However, the test of MGM12, positing the equivalence of the second-order factor mean, resulted in an appreciable decrement in fit relative to MGM11, in which the factor means in the comparison groups were freely estimated. Thus, MGM11 was retained and inspected for latent mean differences. As in Study 2, the latent mean for the second-order career adaptability factor was substantially lower in the retail worker sample than the preservice teacher sample. Likewise, the latent mean in the sample of mothers (M = −.868, p < .001) was significantly lower than in the reference preservice teacher group. A one degree of freedom Wald test also showed that there were no significant differences in the second-order career adaptability latent mean across the retail workers and mothers groups, ω(1) = .594, p > .05.
Taken together, these results demonstrate the full measurement invariance of CAAS scores across distinct samples of preservice teachers, retail workers, and mothers. The results also show for the first time that first-order latent mean differences in the CAAS factors are completely accounted for by differences in the second-order career adaptability factor and not to any differences in the origins of the scales across the independent samples.
Test-Criterion Associations
A GLVM was specified to test the criterion-related validity of the CAAS scores, as per the retained multidimensional, hierarchical structure, with respect to life satisfaction. The test of the structural model also resulted in an acceptable fit to the data, χ2(372) = 691.741, p < .001, CFI = .935, TLI = .929, RMSEA = .073 (.065, .082). Consistent with predictions, CAAS was a positive and significant predictor of SWLS (γus = .639, p < .001; γcs = .293).
Given the acceptable fit of the structural model in the samples of retail workers and mothers, we examined the invariance of the structural coefficient indexing the relation between career adaptability and life satisfaction using MG invariance tests. For these tests, the retail worker sample served as the reference group. As with the MG invariance tests reported above, we first tested the measurement invariance of the first-order factor model without a second-order structure (Cheung, 2008). Support was found for first-order configural invariance (MGM1) and invariance of the first-order factor loadings (MGM2), thresholds (MGM3), and uniquenesses (MGM4; see Table 8). We then tested the invariance of the second-order structure, specifying the direct path from career adaptability to life satisfaction. Support was found for second-order configural invariance (MGM5) as well as equivalence of the second-order loadings (MGM6), second-order intercepts (MGM7), and second-order factor disturbances (MGM8). We also tentatively retained MGM9 in which the endogenous factor intercept was specified to be equal across groups; however, we note that the decrement in fit of this model relative to MGM8 approached appreciable levels (e.g., ΔCFI = −.006). MGM10, specifying the equivalence of the endogenous factor disturbance term, resulted in appreciable degradation in fit relative to MGM9 (e.g., ΔCFI = −.031) and was rejected. However, support was found for the equality of the second-order exogenous factor variance (MGM11) and mean (MGM12). Finally, MGM13, in which the path from career adaptability to life satisfaction was constrained to equality, was supported, suggesting that the structural coefficient does not significantly differ between the samples. This is the first study to present evidence of career adaptability in mothers, specifically.
Fit Statistics for the Multiple-Group Structural Model.
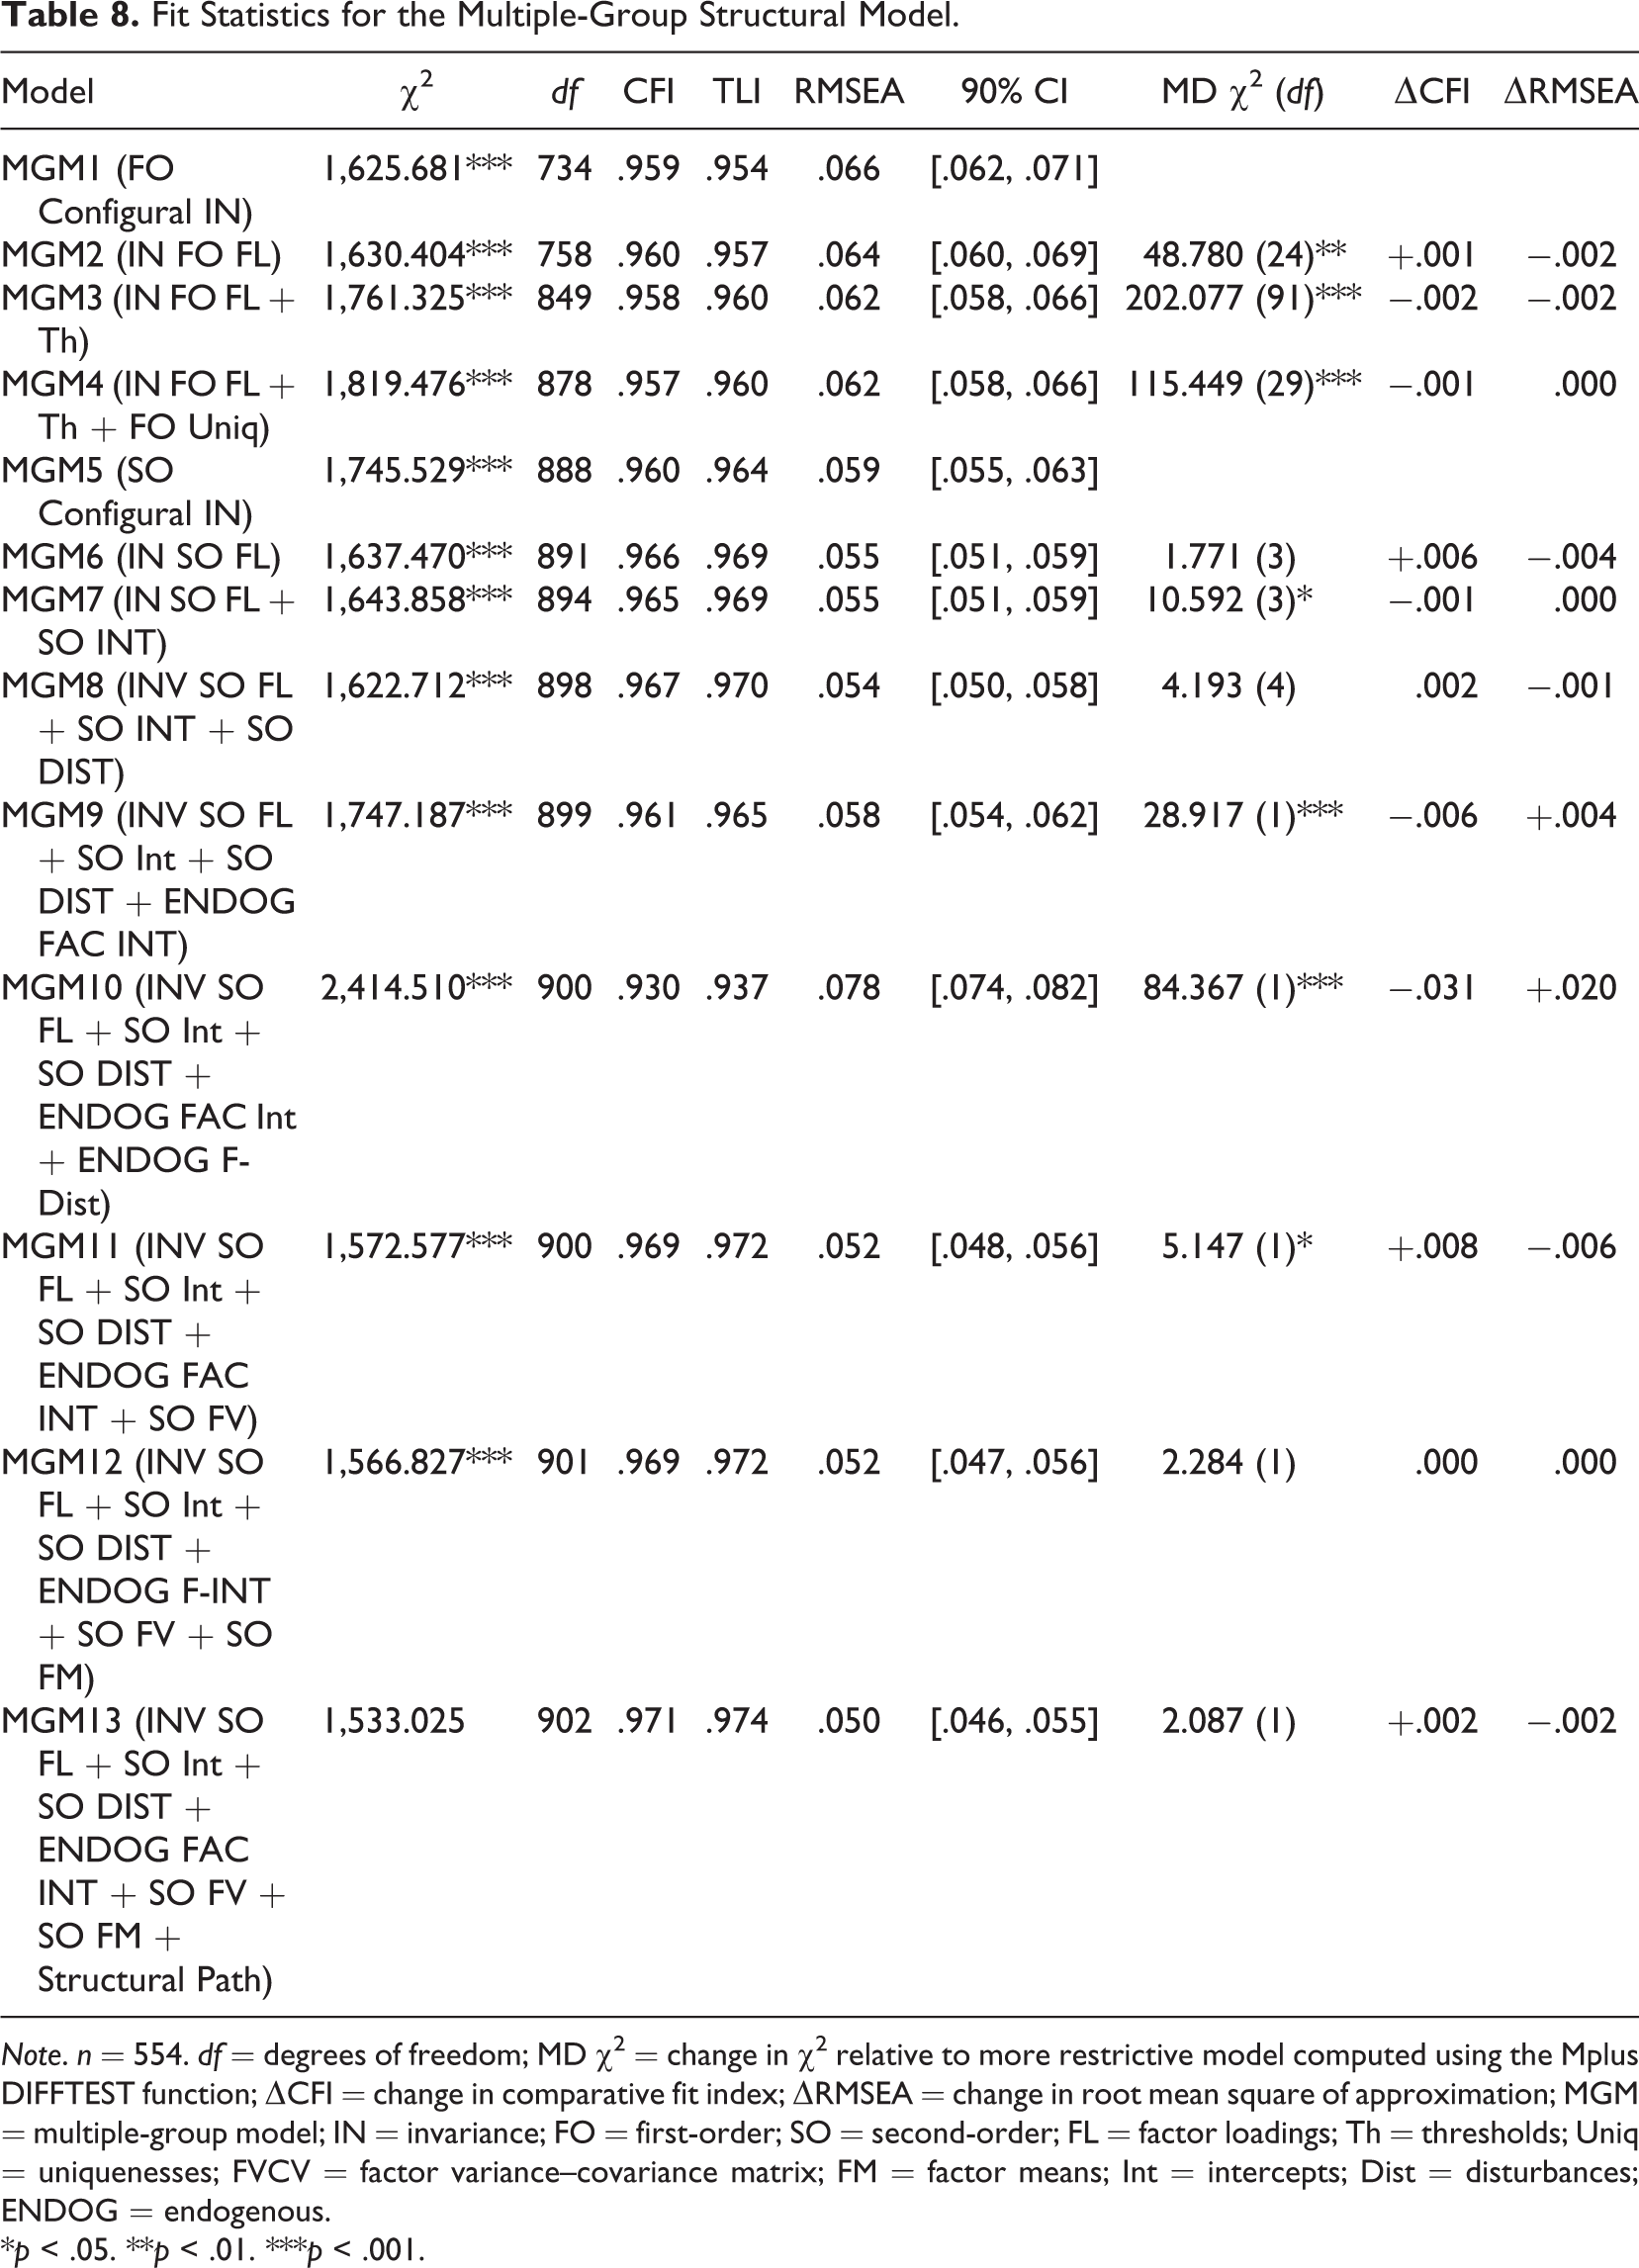
Note. n = 554. df = degrees of freedom; MD χ2 = change in χ2 relative to more restrictive model computed using the Mplus DIFFTEST function; ΔCFI = change in comparative fit index; ΔRMSEA = change in root mean square of approximation; MGM = multiple-group model; IN = invariance; FO = first-order; SO = second-order; FL = factor loadings; Th = thresholds; Uniq = uniquenesses; FVCV = factor variance–covariance matrix; FM = factor means; Int = intercepts; Dist = disturbances; ENDOG = endogenous.
*p < .05. **p < .01. ***p < .001.
General Discussion
The findings of this research affirm the multidimensional, hierarchical latent structure underlying responses to the CAAS in three divergent social occupations. Each CFA returned the expected first- and second-order loadings. Furthermore, using MTMM, Study 1 demonstrates the convergence of the CAAS scores with a similar measure of career adaptability, the CA-CFI. In addition, the CAAS scores were positively associated with teacher self-efficacy and satisfaction with life. Finally, evidence was obtained for the full measurement invariance of CAAS scores across three samples as well as meaningful latent mean differences in adaptability with the retail workers and mothers reporting lower career adaptability than the preservice teachers. Therefore, the CAAS is not only applicable to yet another student/professional sample (i.e., preservice teachers) but also it may be used with nonstudent/professional samples who are low paid (i.e., retail workers) and unpaid (i.e., mothers aiming to return to work).
The present finding of a positive association between teachers’ self-efficacy and career adaptability is consistent with its link to occupational self-efficacy (Maggiori et al., 2017). Just as self-efficacy is germane to teachers’ effectiveness and longevity in the profession (Zee & Koomen, 2016), it may be that career adaptability resources also contribute to teachers’ professional engagement and thereby enhance the likelihood of remaining in the profession. Evidence from studies of other occupations affirms that career adaptability is associated with retention and turnover intentions (Chan & Mai, 2015; Coetzee & Stoltz, 2015); therefore, future research should focus on career adaptability’s influence on teachers’ turnover.
The findings of the present research are a response to calls for focus on understudied segments of the workforce (Blustein, 2013; Casper & Swanberg, 2011). Despite their ubiquity in the stores and malls, and their centrality to commerce, retail workers hardly feature in the empirical literature of vocational psychology. Similarly, the dearth of research into mothers’ experiences of reentering the workforce suggests little has changed in response to earlier criticism of the field (Richardson, 1993). Finding that the measurement properties of the CAAS hold in these two understudied groups is an indication of the potential utility of the measure for research into their career management. Future research that combines the CAAS and other measures of self-regulation with the newly published measure of mothers’ vocational and material identity (Gross-Spector & Cinamon, 2016) may further elucidate the complexities of work for this occupational group. In summary, the current studies show that career adaptability in these low paid and unpaid workers is positively related to their life satisfaction, giving reason to consider the adapting mechanisms through which adaptability affects satisfaction.
The current MTMM revealed the CAAS and CFI-CA measures to be related but different; thus, it is reasonable to assume that both reflect in different ways a similar underlying latent construct. The convergence of scores from two distinct measures of the same construct, accounting for measurement effects, is evidence for convergence. We found discrimination of the first-order CAAS factors to the extent that an MTMM model with the hierarchical, multidimensional structure provided a better fit to the data than a model positing only a unidimensional adaptability factor. It would be pertinent for future research to investigate multiple measures of career adaptability to observe convergence and divergence, and differentiation among a range of criterion measures, and MTMT would suffice for this purpose.
Finding that the CAAS’s measurement qualities hold across quite diverse occupations raises the possibility of it being used within large workplaces with diverse staff profiles that range from professional to semi-skilled occupations. Human resources and career practitioners could have confidence that the CAAS’s measurement properties are invariant, thus enabling comparisons between groups of employees when a broad spectrum audit of staff career development is required.
There are some limitations with regard to the demographic diversity of the samples. Teachers and retail workers are formally representative of the social occupational type (Holland, 1997); however, it is not possible to assume the same typological similarity of the mothers who participated in the study, because the unpaid occupation “mother” has not been empirically discerned as an occupational type. Perhaps this oversight is because the unpaid care work (Richardson, 2012) of mothering is not valorized as work (Schultheiss, 2009) and that mothers continue to endure discrimination in the world of work (Hebl et al., 2007). Finally, Study 3 should be read in light of the relatively small sample size of mothers (n = 160); however, the CAAS factors, both first order and second order, were clearly defined with consistently moderate to strong standardized loadings, which affirms the interpretability of the findings. For the sake of consistency across the three studies, the criterion variable of life satisfaction should have been used in Study 1.
Conclusion
The findings of these three studies consistently recovered the measurement model of the CAAS (Savickas & Porfeli, 2012). The research provides evidence of the multidimensional, hierarchical structure and invariance of measurement structure across three distinct samples using factor model and estimation routine appropriate for polytomous data. Furthermore, the research provides evidence of convergence of CAAS scores with data from CA-CFI and divergence of CAAS dimensions within MTMM framework, test-criterion validity evidence of CAAS-self-efficacy relation in preservice teacher sample, and CAAS-life satisfaction relation in retail and mother samples. Together, these three studies affirm the international transferability of the CAAS as a measure of career adaptability and its utility for understudied occupational groups.
Footnotes
Acknowledgments
The authors thank Sally Carlile, Janelle Jones, Mary Salama, and Andrew Taylor for their contribution to data collection.
Declaration of Conflicting Interests
The author(s) declared no potential conflicts of interest with respect to the research, authorship, and/or publication of this article.
Funding
The author(s) received no financial support for the research, authorship, and/or publication of this article.