
Abstract
Based on career construction theory, we conducted a cross-cultural validation study of the Career Adapt-Abilities Scale–Short Form (CAAS-SF) proposed by Maggiori, Rossier, and Savickas across three sample groups (college students, civil servants, and enterprise employees) in the Chinese context. Results of the principal component analyses and confirmatory factor analyses suggested a four-factor solution and confirmed the hierarchical structure of the Chinese version of the CAAS-SF. In addition, this short form achieved satisfactory configural invariance, full metric invariance, and scalar invariance. These findings support the use of the CAAS-SF as a valid and reliable measure to assess career adaptability in China. Limitations and suggestions for future research are discussed.
Living in a dynamic global environment, nowadays employees are faced with more frequent transitions between different occupations and organizations than ever before (Rudolph & Baltes, 2017). Career adaptability is a psychosocial construct that denotes an individual’s resources for coping with current and anticipated tasks, transitions, and traumas in their occupational roles that, to a large or small degree, alter their social integration (Savickas, 1997). In order to better evaluate career adaptability, an international team of vocational psychologists from 13 countries developed the most widely used Career Adapt-Abilities Scale (CAAS; Mcilveen, Perera, Hoare, & Mclennan, 2018; Savickas & Porfeli, 2012). The CAAS consists of four subscales such as Career Concern, Control, Curiosity, and Confidence. It currently has more than 10 versions available in different languages and has demonstrated excellent reliability and appropriate cross-national measurement equivalence (Di Maggio, Ginevra, Laura, Ferrari, & Soresi, 2015; Maree, 2012; Öncel, 2014; Tien, Lin, Hsieh, & Jin, 2014).
With limited time and resources, scholars increasingly resort to short-form measures to enhance research efficiency (Stanton, Sinar, Balzer, & Smith, 2002). The CAAS–Short Form (CAAS-SF; Maggiori, Rossier, & Savickas, 2017), a shortened version of the CAAS, was thus created as an economical alternative in large surveys along with other instruments. The applicability of the CAAS-SF has been verified not only in European countries (Maggiori et al., 2017) but also in Asian countries such as Turkey in a recent study (Işık et al., 2018). These studies found that although the length of the instrument was decreased by 50%, the CAAS-SF demonstrated the same factor structure and very similar psychometric properties to those of the well-established full version (Işık et al., 2018; Maggiori et al., 2017). However, since cultural differences might affect the reliability and validity of the scale (Johnston, Luciano, Maggiori, Ruch, & Rossier, 2013; Savickas & Porfeli, 2012), further studies are needed to test the applicability of the CAAS-SF in diverse cultural contexts as well as the validity of its four-factor hierarchical structure (Işık et al., 2018; Maggiori et al., 2017).
Career Adaptability
Career adaptability is a central concept in career construction theory (CCT), which is one of the most well-established career theories in the past two decades (Savickas, 1997, 2002, 2005, 2013). CCT explains the interpretive and interpersonal processes through which individuals construct their personality, navigate their vocational behavior, and make meaning out of their careers. Designed in a multicultural society, this conceptual framework provides a contemporary explanation to career construction and guides the development of the career counseling model. More importantly, the theory provides a new, contextualist perspective for understanding career development. It conceptualizes development as driven by adaptation to the environment rather than by maturation of inner structures (Savickas & Porfeli, 2012).
CCT highlights the role of career adaptability as a key meta-competency in coping with vocational development tasks, occupational transitions, and work traumas (Mirvis & Hall, 1994). Adaptability equips individuals with the will and skill to navigate one’s own work. In order to illustrate the what, how, and why of vocational behaviors, CCT integrates vocational personality, career adaptability, and life themes within a single theoretical framework (Savickas, 2005), while career adaptability concerns “how” individuals build and develop their careers. Overall, career adaptability facilitates individuals’ adjustment to career-related changes, person–environment integration, and the successful transition to construct one’s career across the life span (Savickas, 2005).
The Chinese Context
As one of the largest developing economies, China has made tremendous changes in the past 40 years since its reform and opening up in 1978. These changes have reshaped people’s life courses, including their career choices and career development, affecting not only adults but also younger generations (Buchholz et al., 2009). As the pace of economic and social change has been unparalleled in modern times, career adaptability becomes especially important in Chinese context (Hou, Leung, Li, Li, & Xu, 2012).
Among people who are in need of evaluating and developing their career adaptability, college students, civil servants, and enterprise employees are three major populations. First, college students comprise the majority of the labor pool and future workforce. About 3.84 million students graduated from college in 2017 (National Bureau of Statistics of China, 2017), and most of them went into the job market. However, organizations frequently reported that college graduates lacked the necessary skills to adapt to their current jobs (Nye, Leong, Prasad, Gardner, & Tien, 2018). It is urgent for researchers to develop guidance for the career development of college students (Leung, Hou, Gati, & Li, 2011). Second, civil servants and enterprise employees are the two most representative occupational groups in China. Government agencies rely on a strict hierarchal and organizational system to ensure that every policy conforms to the interests of the majority of Chinese people. On the other hand, enterprises in China are more flexible in terms of organizational structure and are driven mainly by profits and market needs. Although the natures of governmental and enterprise occupations are very different, both civil servants and enterprise employees need to develop their adaptive abilities to achieve self-realization.
Previous studies have found that career adaptability was positively correlated with job search success, organizational success, and individual career success (Pan et al., 2018; Yu, Guan, Zheng, & Hou, 2018) in the Chinese context. Interestingly, males generally had higher scores on all four CAAS subscales than females (Hou et al., 2012; Yu, 2008). Although the CAAS full scale remains the most popular measurement among researchers interested in career adaptability, we argue that the CAAS-SF deserves more attention and further exploration. Considering that Chinese students and employees usually have tight study and work schedules as well as long working hours, shorter questionnaires would reduce the response burden and improve completion rates (Işık et al., 2018). In addition, a shorter scale allows researchers to examine the relation between career adaptability, its antecedents, and its consequences simultaneously (Maggiori et al., 2017), which is a major focus of recent studies in this area (Duffy, Douglass, & Autin, 2015; Johnston, 2018). In sum, a short and valid measurement is necessary not only for career development researchers but also for practitioners concerned with the career adaptability of both organizations and individuals in China.
Aims of the Current Study
To address the issues mentioned above, the current study aims to examine (a) the psychometric properties of the Chinese version of the CAAS-SF (CAAS-SF China) among college students, civil servants, and enterprise employees; (b) the measurement equivalence of the CAAS-SF China across different gender and social groups; (c) the differences between the subscales’ and the full short scale’s scores across different gender and social groups; and (d) the association between the CAAS-SF China and the Chinese version of the CAAS (CAAS China) as well as the criterion-related validity of career exploration, job search intensity, job performance, and career satisfaction.
Method
Data and Sample
In this study, we selected three sample groups—college students, civil servants, and enterprise employees—to test the validity and reliability of the CAAS-SF in China. These three sample groups were chosen because they represent the occupational structure in contemporary Chinese society, as mentioned earlier. All surveys were conducted in paper-and-pencil form. The time-lag technique was employed in this study to reduce common method bias (Podsakoff, MacKenzie, Podsakoff, & Lee, 2003).
College student participants were recruited from four universities in Beijing, the capital city of China. All four universities are nationally renowned schools with large student populations from all over the country. Students were asked to complete the survey after class under the supervision of a member of the research team and a teacher/professor. Using the time-lag technique, 1,000 students were asked to report their personal information and career adaptability at the first time point (Time 1), and 973 surveys were returned. After 2 weeks (Time 2), the same group of students was surveyed again about their career exploration attitudes, while their 286 classmates were asked to rate these students’ job search intensity. In the second time point, we received 961 completed surveys. After dropping cases with missing values in the key variables or invalid values throughout the survey (i.e., rating all of the items with the same number) as well as matching the data collected at Time 1 with those collected at Time 2, 926 student–classmate dyads were generated, with a response rate of 92.6%. The final analytic sample contained 7.6% (n = 70; numbers are rounded to the nearest tenth) freshmen, 19.1% (n = 177) sophomores, 33.6% (n = 311) juniors, and 39.7% (n = 368) seniors. In total, 55.6% (n = 515) of the analytic sample were females, and the age of students ranged from 18 to 25 years with an average age of 20.3.
Civil servant participants were recruited from nine Chinese government sectors in six different provinces including Fujian, Yunnan, Guangxi, Zhejiang, Henan, and Sichuan. These provinces were selected based on our researcher’s social network. The recruited civil servants worked for a variety of government sectors including departments of health, education, human resources and social security, culture and tourism, and so on. These organizations were chosen for the purpose of creating a diverse sample of participants who represented a broad range of public-sector occupations and localities. A total of 1,000 civil servants were recruited and surveyed about their demographic information as well as levels of career adaptability at the first time point (Time 1), and 957 surveys were returned. Two weeks later (Time 2), the same group of civil servants was surveyed again about their career satisfaction, while their 217 supervisors were asked to rate these civil servants’ job performance. In the second time point, we received 949 completed surveys. After dropping cases with missing values in the key variables or invalid values throughout the survey (i.e., rating all of the items with the same number) as well as matching the Time 1 data with the Time 2 data, a total of 905 employee–supervisor dyads were generated, with a response rate of 90.5%. The final analytic sample contained 46.6% (n = 422) females and 53.4% (n = 483) males. Most of the sampled civil servants (53.4%, n = 483) were between 25 and 35 years old; 8.2% (n = 74) of the sample was younger than 25, 21.8% (n = 197) was between 35 and 45, and 16.7% (n = 151) was older than 45. The majority of these civil servants (78.5%, n = 710) had bachelor’s or higher degrees.
Enterprise employee participants were recruited from 13 Chinese enterprises located in five provinces including Beijing, Jiangxi, Sichuan, Henan, and Hebei. Enterprises were selected based on our researcher’s social network. Altogether 1,800 employees were surveyed at the first time point (Time 1) about their demographic information and levels of career adaptability; 1,636 of them returned the surveys. After 2 weeks (Time 2), the same group of employees was surveyed again about their levels of career satisfaction, while their 331 supervisors were asked to rate these employees’ job performance. In the second time point, we received 1,474 completed surveys. After dropping cases with missing values in the key variables or invalid values throughout the survey (i.e., rating all of the items with the same number) as well as matching data collected at the two time points, 1,250 employee–supervisor dyads were generated, with a response rate of 69.40%. The final analytic sample consisted of employees from the manufacturing, information technology, and service industries; the majority of them (83.5%, n = 1,044) worked in nonmanagerial positions. Additionally, 27.5% (n = 344) of the employees worked in state-owned enterprises, while 35.1% (n = 439) worked for large firms with more than 500 employees. A total of 57.0% (n = 713) of this group of employees was female. Most of the employees were young or middle-aged adults, with 37.9% (n = 474) reported as being between 25 and 35 years and 34.1% (n = 426) between 35 and 45 years. Only 10.2% (n = 127) of them were younger than 25, while only 17.8% (n = 223) were older than 45. More than half (59.4%, n = 743) of these employees had 3 years or less of tenure, and 38.3% (n = 479) had bachelor’s or higher degrees.
Taking all three groups together, a total of 3,081 participants were included in the final analytic sample. All participants were informed about the confidentiality of their participation in oral and/or written form before they received the survey questionnaires; a clear introduction to the purposes and methods of the current research was also given to the participants beforehand. An incentive of ¥20 (approximately US$3) was given to participants who completed the surveys.
In order to examine the cross validation using the CAAS-SF China, participants in each sample group were randomly divided into two subsamples (i.e., college students, n 1 = 489 and n 2 = 437; civil servants, n 1 = 571 and n 2 = 334; enterprise employees, n 1= 521 and n 2 = 729). For each sample group, the two subsamples had the same sex ratio, college students, χ2(1) = 2.721, p > .05; civil servants, χ2(1) = 0.120, p > .05; enterprise employees, χ2(1) = 0.522, p > .05. In the current analyses, gender was coded as a binary variable with 1 for males and 2 for females.
Measurements
Career adaptability
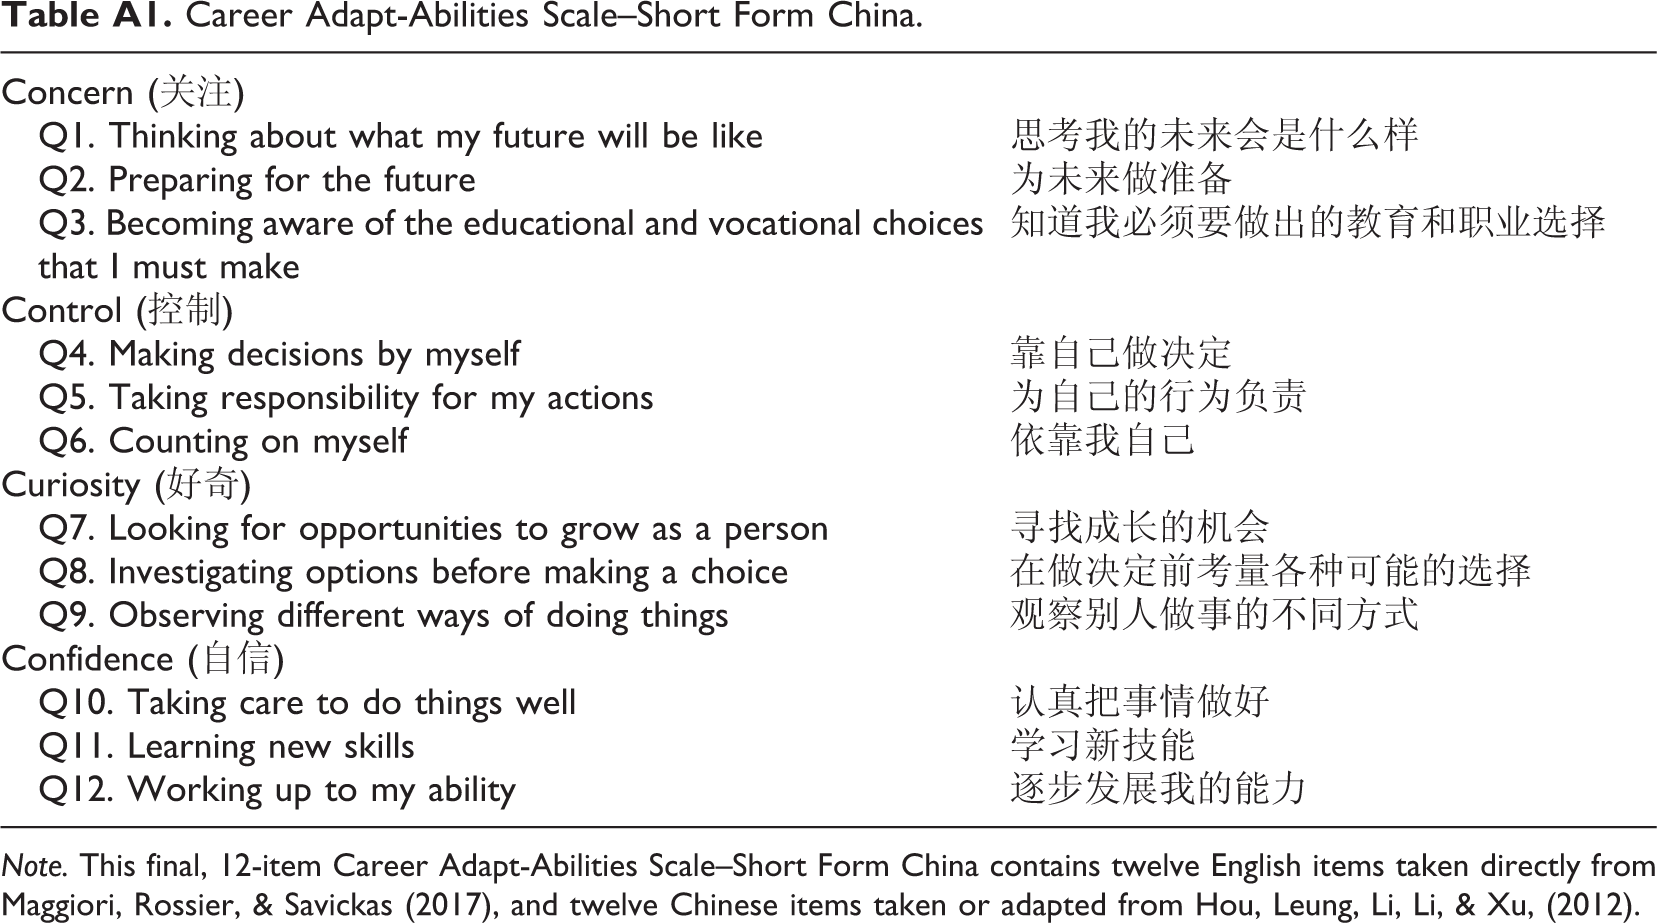
We developed a 12-item CAAS-SF China Scale (Table A1) based on the CAAS China (Hou et al., 2012) and the short scale proposed by Maggiori, Rossier, and Savickas (2017). Career adaptability is defined as an individual’s ability to adapt to new or changing work conditions (Duffy et al., 2019). It is measured using the CAAS China with 24 items developed by Hou, Leung, Li, Li, and Xu (2012). The scale contains four subscales—Career Concern, Career Control, Career Curiosity, and Career Confidence—with 6 items for each subscale. In the instrument development study, Hou and colleagues (2012) found that both the subscales and the full scale showed good to excellent internal consistency (ranging from 0.64 for control to 0.79 for concern, the adaptability total score was 0.89). The validity of the CAAS China has been proved by subsequent studies among Chinese students (ranging from 0.06 to 0.08 for root mean square error of approximation (RMSEA); 0.03 to 0.06 for standardized root mean square residual (SRMR); Guan et al., 2013; Hou et al., 2012; Tien et al., 2014; Tien, Wang, Chu, & Huang, 2012) and Chinese employees in work settings (Guan, Zhou, Ye, Jiang, & Zhou, 2015; Yu et al., 2018). Participants responded to each item using a 5-point Likert-type scale ranging from 1 = not strong to 5 = strongest. Example items for the four dimensions are as follows: “concerned about my career” (career concern, Cronbach’s α ranging from .77 to .88 across different samples), “sticking up for my beliefs” (career control, .79 ≤ α ≤ .86), “exploring my surroundings” (career curiosity, .77 ≤ α ≤ .82), and “solving problems” (career confidence, .78 ≤ α ≤ .88). The overall Cronbach’s α for the entire scale ranged from .91 to .94. The scale’s validity was good with χ2/df = 3.62/5.92/4.29, normed fit index (NFI) = .88/.87/.91, incremental fit index (IFI) = .91/.89/.93, Tucker–Lewis index (TLI) = .89/.87/.91, comparative fit index (CFI) = .91/.89/.93, and RMSEA = .05/.07/.05.
Career exploration
Career exploration was included as a criterion variable for college students. Career exploration is defined as an individual’s activities of collecting and analyzing information relevant to career development. It is measured using the 9-item scale developed by Werbel (2000), which contains 4 items for self-exploration and 5 items for environment exploration. In the instrument development study, Werbel (2000) found the subscales to have strong internal consistency reliability and demonstrated discriminant validity among self-exploration, environmental exploration, and job search intensity. It was also reported by other researchers that career exploration was strongly correlated with college students’ employability and subjective job-search performance (Yu, Zheng, Xu, & Yan, 2014). In this study, all items are scored on a 5-point Likert-type scale ranging from 1 = very little extent to 5 = very great extent. Participants were asked to indicate the extent to which they engaged in self-assessment activities and the methods and frequency of obtaining information about job opportunities in the past 3 months. One of the 5 original items (“initiated conversations with knowledgeable individuals in my career area”) demonstrated low factor loading and substantially decreased the psychometric qualities of the measure. The item was therefore deleted from the environment exploration subscale, leaving the remaining 4 items with good reliability (α = .80). Example items for the two dimensions include, “been retrospective in thinking about my career” (self-exploration; α = .73) and “went to various career orientation programs” (environment exploration). The α for the whole scale was .81.
Job search intensity
Job search intensity was included as another criterion variable for college students. Job search intensity is defined as an individual’s degree of job search effort. It is measured using the 6-item scale developed by Werbel (2000). This scale demonstrated acceptable internal consistency reliability and good discriminant validity in the development study (Werbel, 2000). Acceptable construct validity and discriminant validity among job search intensity, decisiveness, and Guanxi were also reported both by the U.S. sample (CFI = .97, TLI = .97, RMSEA = .086) and by the Chinese sample (CFI = .96, TLI = .95, RMSEA = .089; Lynda & Werbel, 2007). A sample question asks whether the participants had “mailed a resume.” All items were coded as binary variables with the answer yes as 2 and no as 1. The mean response of all items was used for analyses. The α for the whole scale was .75.
Job performance
Job performance was included as a criterion variable for civil servants and enterprise employees. Job performance is defined as an individual’s behavior that indirectly supports the organization’s development. It is measured using the 3-item scale developed by Motowidlo and van Scotter (1994). In the instrument development study, the scale demonstrated good internal consistency reliability (α = .96). Other researchers also reported that job performance showed strong correlation with career adaptability (Yu et al., 2018). In this study, managers were asked to rate their employees’ level of “contribution to unit effectiveness.” The managers answered these items on a 5-point Likert-type scale ranging from 1 = very low to 5 = excellent. The α values ranged from .75 to .88 across the two samples.
Career satisfaction
Career satisfaction was another criterion variable for civil servants and enterprise employees. Career satisfaction is defined as an individual’s subjective judgments about their satisfaction with career attainment. It is measured using the 5-item scale adapted from a study by Greenhaus, Parasuraman, and Wormley (1990). In the instrument development study, Greenhaus and colleagues found that the scale had strong internal consistency reliability and was associated with several organizational experience factors such as sponsorship, job discretion, and career strategy behaviors. This scale also demonstrated good psychometrical properties and construct validity from a dynamic perspective (Spurk, Abele, & Volmer, 2011; Wolff & Moser, 2009). An example item is “I am satisfied with the progress I have made toward meeting my goals for advancement.” Participants responded to the questions on a 5-point Likert-type scale ranging from 1 = strongly disagree to 5 = strongly agree. The α values ranged from .84 to .86 across the two samples.
We then conducted a set of confirmatory factor analyses (CFAs) to compare the measurement models and to test the discriminant validity of the five variables. For the student sample, we tested career adaptability, career exploration, and job search intensity; for the civil servant and the enterprise employee sample, we tested career adaptability, job performance, and career satisfaction (Table 1). The three-factor model fit the data better than the one-factor model, Δχ2(9)/df = 233.29, Δχ2(7)/df = 414.05, Δχ2(7)/df = 685.59, p < .01. In other words, the three-factor model better represented the factor structure, and these results provide evidence for the discriminant validity of our measures.
Comparisons of Measurement Models.
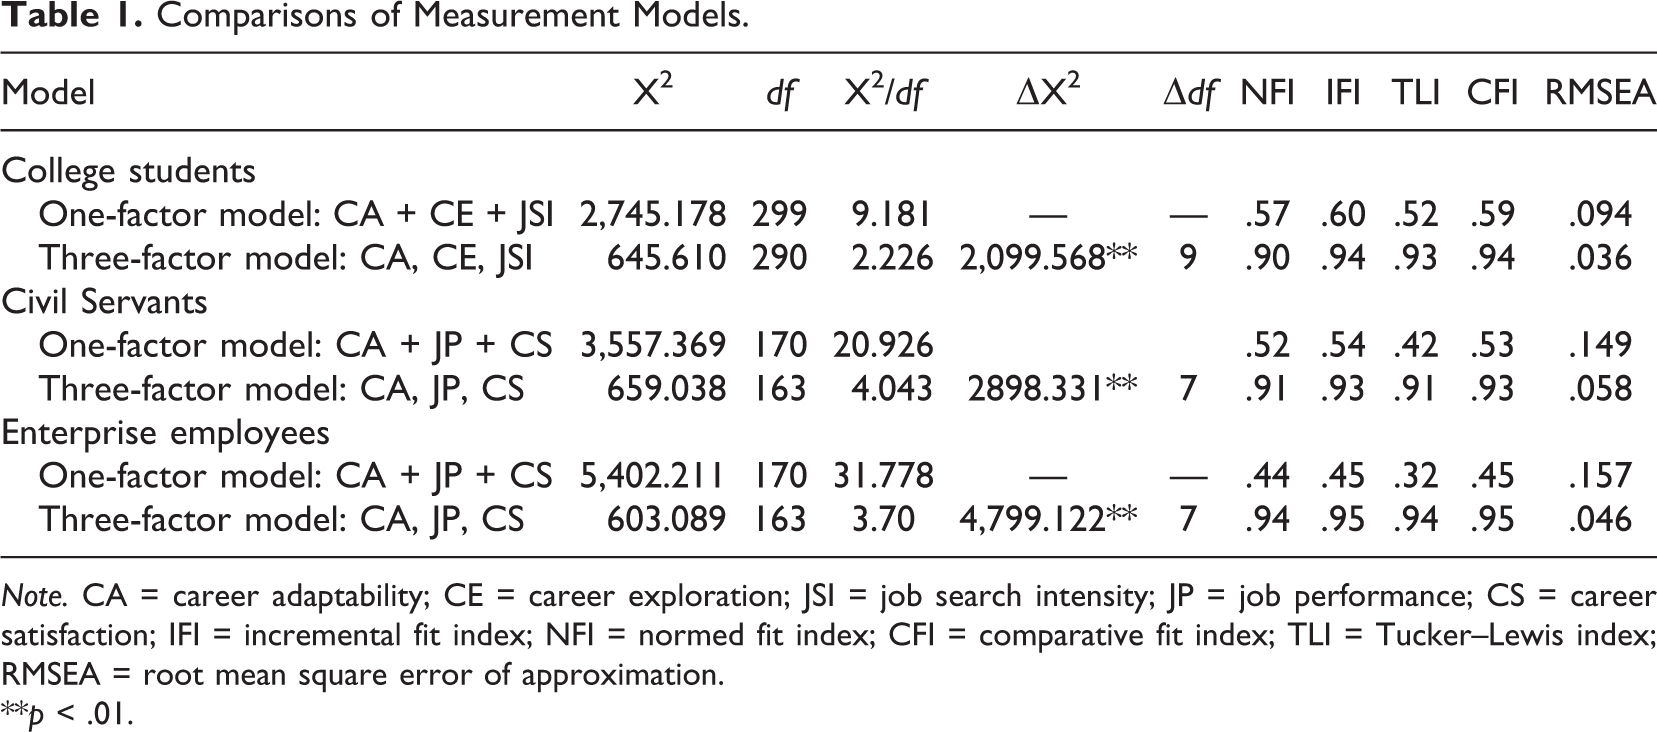
Note. CA = career adaptability; CE = career exploration; JSI = job search intensity; JP = job performance; CS = career satisfaction; IFI = incremental fit index; NFI = normed fit index; CFI = comparative fit index; TLI = Tucker–Lewis index; RMSEA = root mean square error of approximation.
**p < .01.
Analysis Techniques
In this study, exploratory principle component analyses (PCAs), descriptive statistics, correlations, and Cronbach’s α reliability estimates were calculated using SPSS Version 18.0. CFAs were conducted using AMOS Version 23.0. We evaluated the model fit using five indices: χ2 per degree of freedom (χ2/df), the NFI, the CFI, the TLI, and the RMSEA. Generally, a model is considered to have acceptable fit if χ2/df is equal to or lower than 5 (Bollen, 1989), CFI and TLI values are above .90, and the RMSEA is between .05 and .08 (Browne & Cudeck, 1992; Hu & Bentler, 1999). Multigroup CFA was conducted using Mplus Version 7.11 (Muthén & Muthén, 2010). In addition to the overall fit of each model, we used changes in the CFI and RMSEA fit indices (Cheung & Rensvold, 2002; Davidov, Schmidt, & Schwartz, 2008) to assess the differences among our models. The recommended cutoff criteria are CFI change (ΔCFI) ≤ .01 and RMSEA change (ΔRMSEA) ≤ .015 (Chen, 2007).
Results
Exploratory PCAs
The aim of the current study was to examine the reliability and validity of the CAAS-SF China. Therefore, we expected that the short-form measure could account for at least the same amount of variance as the full scale. In addition, considering the cultural differences among different societies, we conducted an exploratory factor analysis (EFA) for each group to assess whether its factor structures conform to the original measurements (Liao, Liu, & Loi, 2010).
Since the current study emphasized reducing the number of items in the scale rather than identifying latent dimensions (Robert, 2014), we performed a PCA using promax rotation on the CAAS-SF China using the first random subsample. As expected, a four-factor structure was found among the 12 items of the CAAS-SF China, with each factor consisting of 3 items. Table 2 reports the results of Kaiser-Meyer-Olkin (KMO, 0.847/0.875/0.891), total variance (61.5%/70.5%/66.3%), and the first five eigenvalues (4.106, 1.154, 1.080, 1.035, 0.817/5.097, 1.531, 1.004. 0.824, 0.613/4.874, 1.202, 0.995, 0.882, and 0.675), and Table 3 reports the results of PCA across the three different sample groups. As shown in Table 3, all the items loaded substantially on to the respective factor and none of them had secondary loading higher than 0.40.
Exploratory Factor Analysis Results.
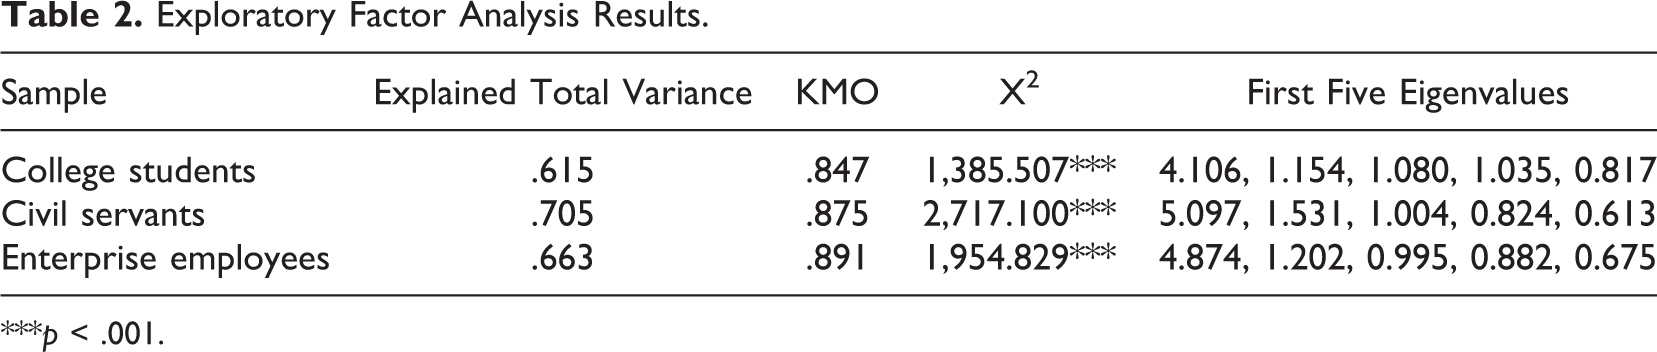
***p < .001.
Principal Components Analysis: College Students.

Note. N = 489. Loadings above 0.40 in value are in boldface; item labels are those of the CAAS-SF China. CAAS-SF = Career Adapt-Abilities Scale–Short Form.
Principal Components Analysis: Civil Servants.
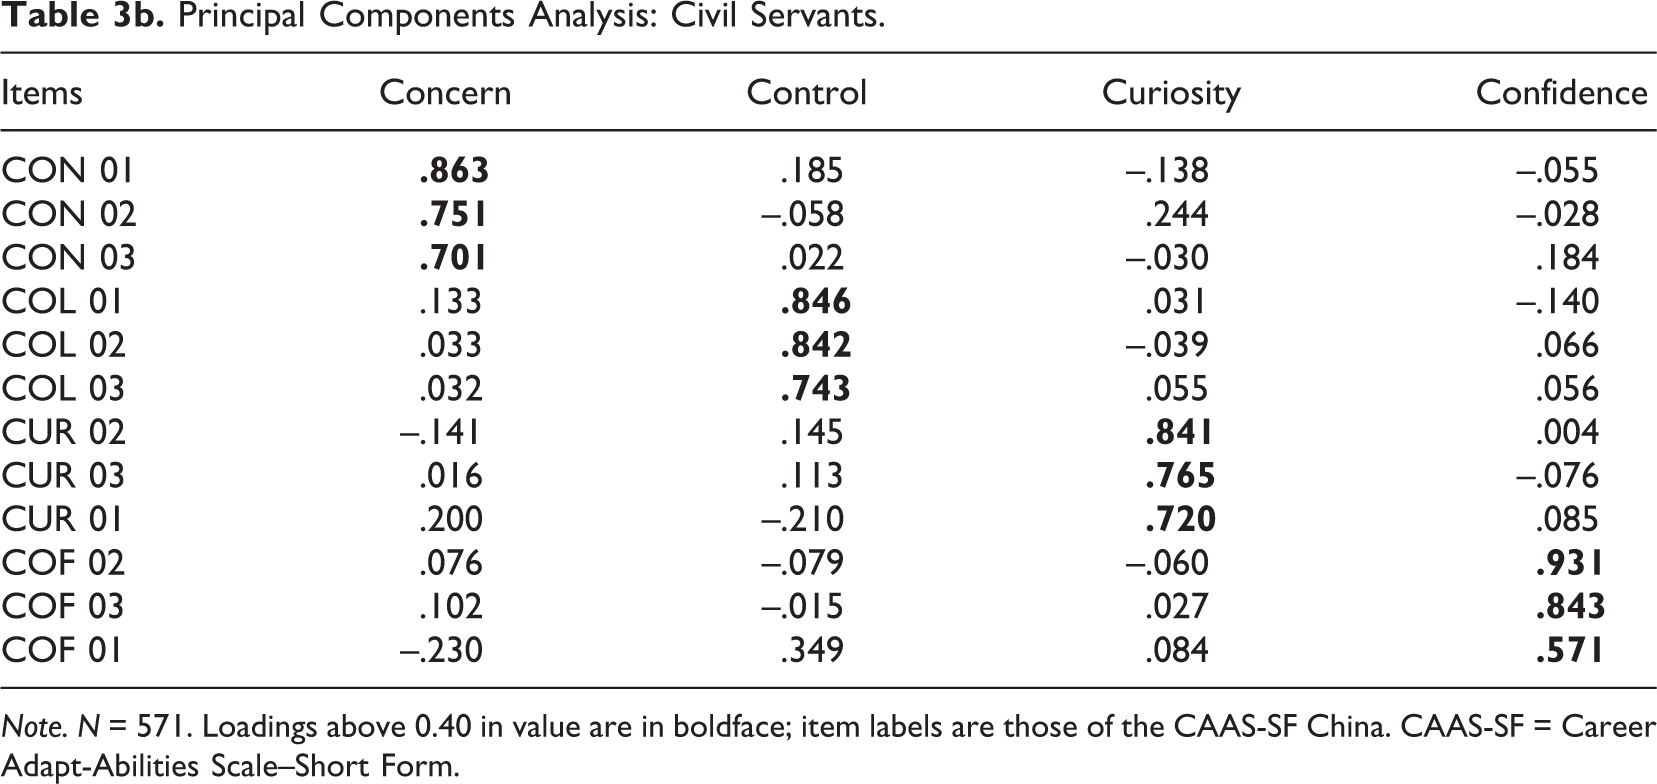
Note. N = 571. Loadings above 0.40 in value are in boldface; item labels are those of the CAAS-SF China. CAAS-SF = Career Adapt-Abilities Scale–Short Form.
Principal Components Analysis: Enterprise Employees.
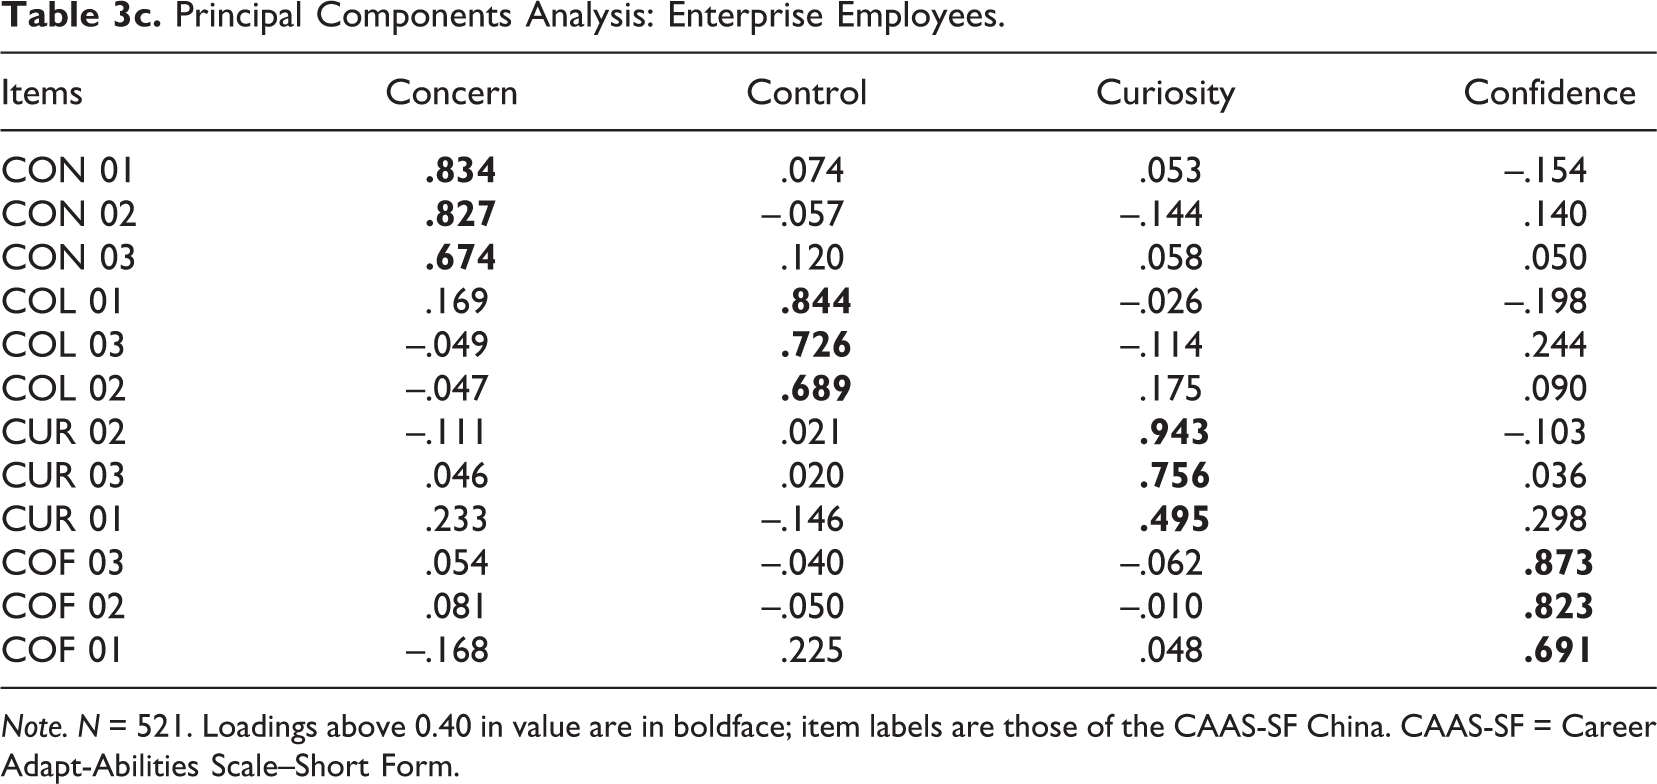
Note. N = 521. Loadings above 0.40 in value are in boldface; item labels are those of the CAAS-SF China. CAAS-SF = Career Adapt-Abilities Scale–Short Form.
Confirming the Structure of the CAAS-SF China Using CFA
As a multidimensional construct, the hierarchical structure of the CAAS-SF has been verified in Switzerland (Maggiori et al., 2017) and Turkey (Işık et al., 2018), while no research on CAAS short scale has been conducted in non-Western society, especially in developing countries in East Asia like China. Considering the cultural differences among different societies, we conducted a second-order CFA with maximum likelihood estimation for each group to assess whether its factor structures conformed to the findings in Western societies (Liao et al., 2010). In other words, our purpose is to examine the stability of the hypothesized hierarchical structure of the four-factor CAAS-SF in the Chinese context.
In addition, we compared the proposed model (Model 1 [M1]) with seven possible alternative models (Models 2–8) across three sample groups. M1 denotes that the 12 observable items load on the four first-order factors (career concern, control, curiosity, and confidence), which in turn load on the second-order factor (career adaptability). Model 2 (M2) refers to the merging of concern and control in M1 as one factor, Model 3 (M3) refers to the merging of concern and curiosity in M1 as one factor, Model 4 refers to the merging of concern and confidence in M1 as one factor, Model 5 refers to the merging of control and curiosity in M1 as one factor, Model 6 refers to the merging of control and confidence in M1 as one factor, Model 7 refers to the merging of curiosity and confidence in M1 as one factor, and Model 8 denotes that 12 items are accounted for by a single first-order factor, career adaptability.
Based on the second random subsample, the results showed that the other alternative models were significantly worse than the proposed model across the three samples. Specifically, M1 showed an acceptable model fit (χ2/df = 2.307/2.736/3.953, NFI = .930/.930/.926, IFI = .959/.954/.944, CFI = .958/.954/.943, TLI = .935/.928/.911, and RMSEA = .055/.072/.064), which was superior to the seven possible alternative models, M2: Δχ2(1)/df = 39.981/126.138/192.050, p < .01; M3: Δχ2(1)/df = 36.955/46.415/58.072, p < .01; Model 4: Δχ2(1)/df = 36.635/98.973/91.167, p < .01; Model 5: Δχ2(1)/df = 72.729/77.671/206.457, p < .01; Model 6: Δχ2 (1)/df = 58.107/73.122/203.509, p < .01; Model 7: Δχ2(1)/df = 38.270/42.782/45.610, p < .01; and Model 8: Δχ2(4)/df = 128.878/201.873/343.269, p < .01. Figures 1 –3 show that the standardized loadings from items to four first-order factors and from factors to second-order adaptability construct ranged from 0.50 to 0.95 across the three samples, suggesting that all items and factors are strong indicators of their respective constructs.
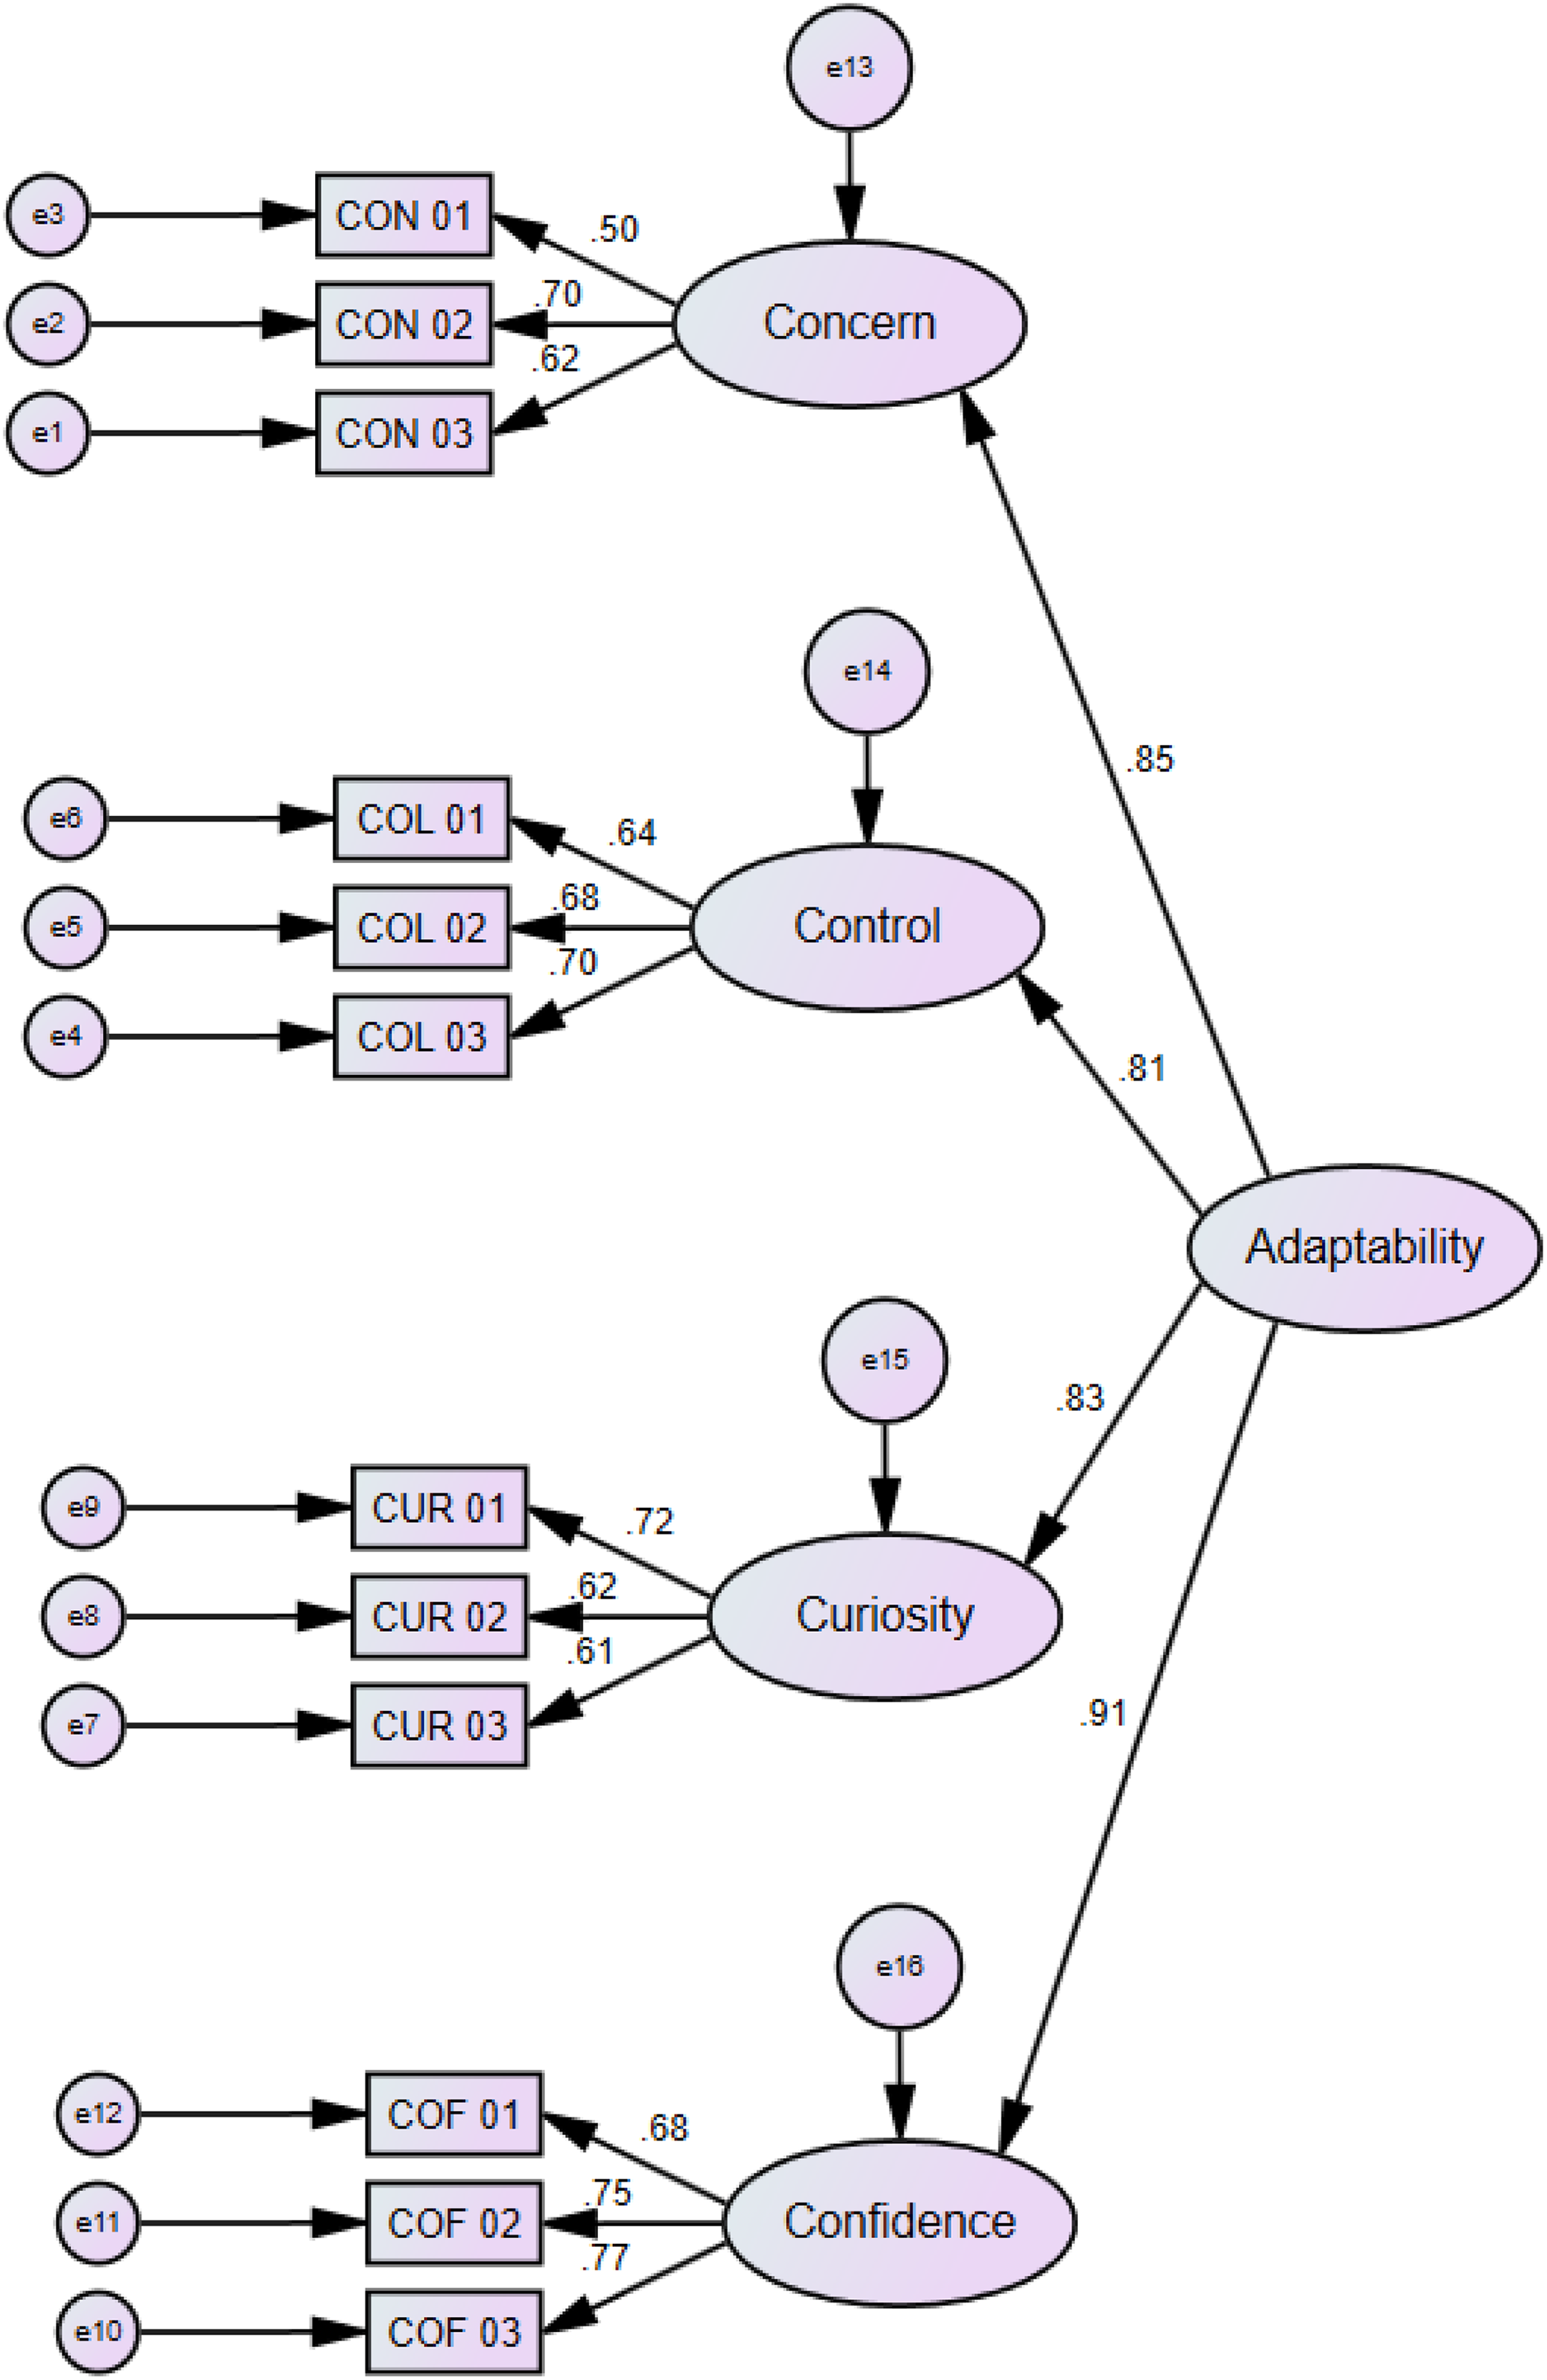
Hierarchical confirmatory factor model and standardized factor loadings for the college student sample (N = 437). All factor loadings are significant at p < .001.

Hierarchical confirmatory factor model and standardized factor loadings for the civil servant sample (N = 334). All factor loadings are significant at p < .001.
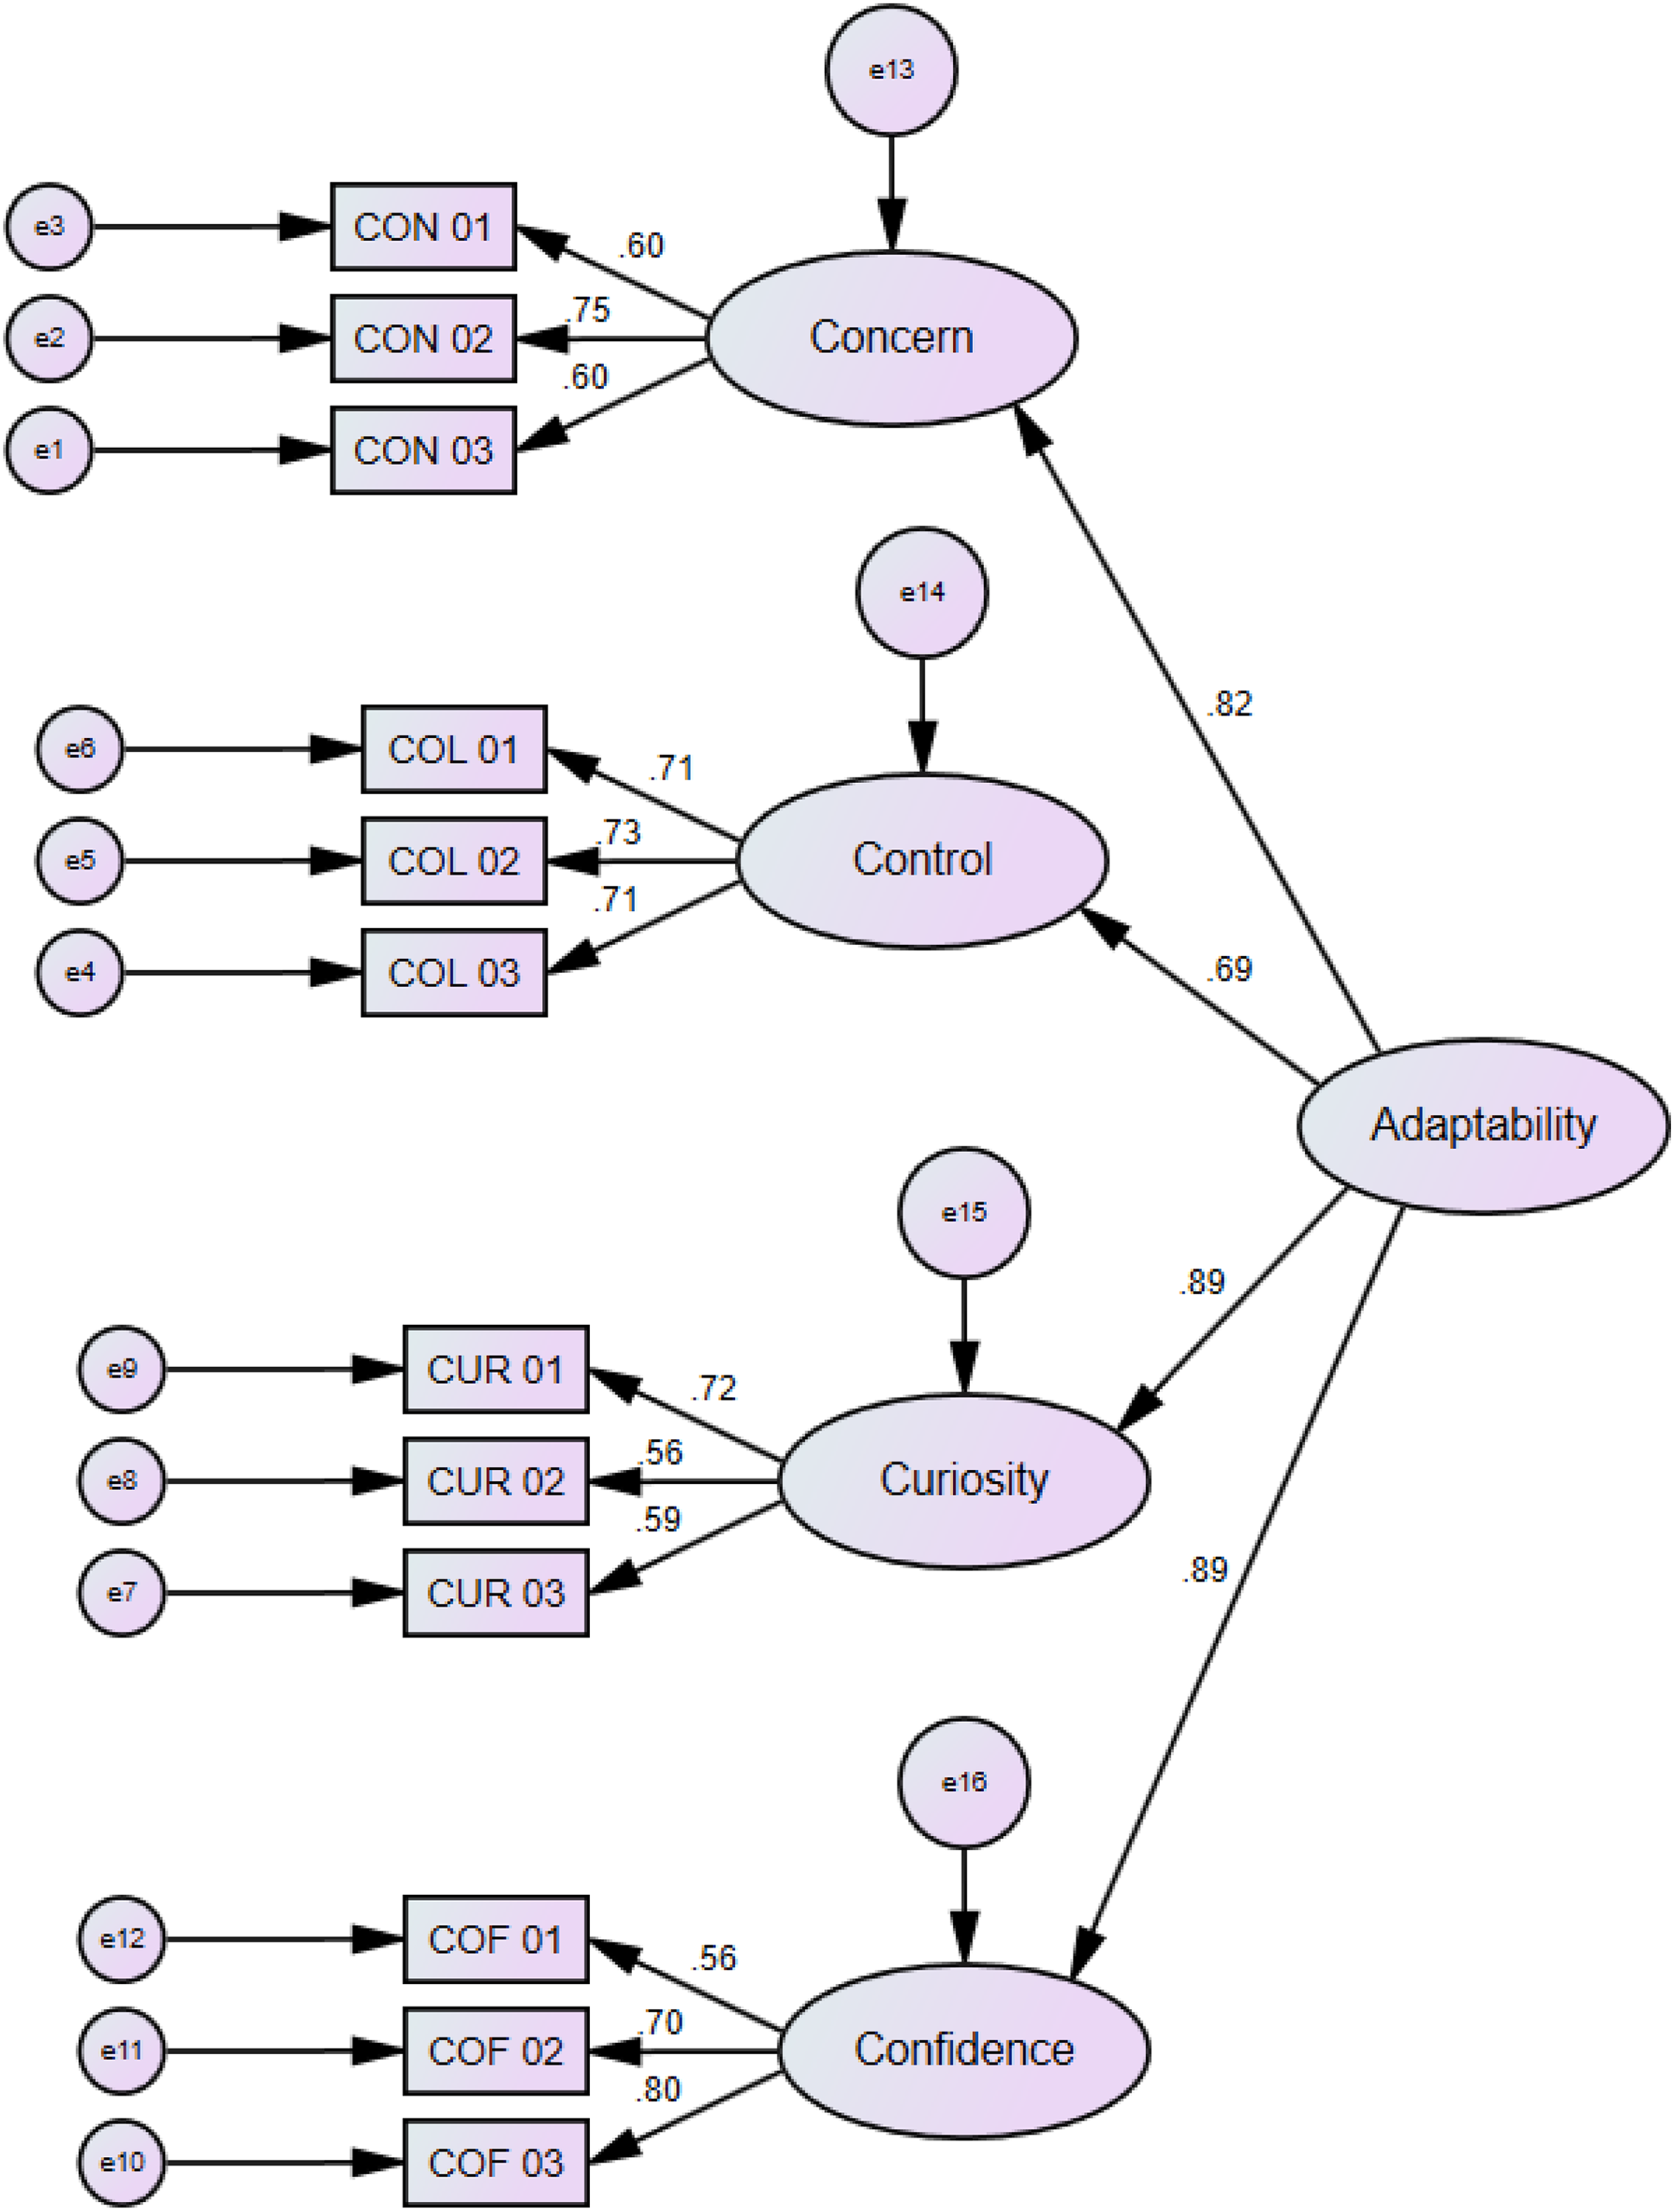
Hierarchical confirmatory factor model and standardized factor loadings for the enterprise employee sample (N = 729). All factor loadings are significant at p < .001.
Measurement Invariance of the CAAS-SF China Across Gender and Social Groups
Although the model fit the data well, measurement invariance—a key indicator of group comparisons (e.g., Byrne et al., 2009; Byrne & Watkins, 2006)—was not sufficiently guaranteed (Maggiori et al., 2017). Following the steps outlined by previous scholars (Byrne, 2012; Vandenberg & Lance, 2000), we examined the invariance of the CAAS-SF China across gender groups as well as across three social groups.
First, we conducted an analysis of configural equivalence across gender groups and specified the second-order hierarchical factor structure for the CAAS-SF China for the female and male samples (Byrne, 2008, 2012). The fitness indexes for both the female sample (χ2/df = 2.963, CFI = .983, TLI = .975, RMSEA = .035) and the male sample (χ2/df = 4.320, CFI = .971, TLI = .958, RMSEA = .049) showed satisfying results, indicating that the latent construct of the CAAS-SF China seemed to hold for both female and male groups.
We then conducted two-group CFAs to examine the measurement invariance. The results of the model fit for the two-group configural baseline (M1: configural model) are shown in Table 4 and were confirmed as an acceptable fit (χ2/df = 3.641, CFI = .977, TLI = .966, RMSEA = .042), meaning that the two gender groups shared the same factor structure. A second model (M2: metric model) was tested, and the results were compared to M1. In M2, factor loadings were constrained to be equal across groups. The results showed that the model fit of M2 was also good, and the critical values (ΔCFI = .001 and ΔRMSEA = .001) were well below the recommended cutoff values. This result suggests that different groups responded to the items in the same way. Lastly, we tested the third model (M3: scalar model) and compared it to M2. In this model, item intercepts were constrained to be equal across groups in order to establish metric invariance. The fit indices for the scalar invariance model showed a good fit, and the critical values (ΔCFI = .001 and ΔRMSEA = .001) were well below the cutoff values, suggesting that respondents who have the same score on the latent factor would obtain the same score on its indicator regardless of their group membership (Milfont & Fisher, 2010).
Verifying Measurement Invariance Across Gender and Groups.
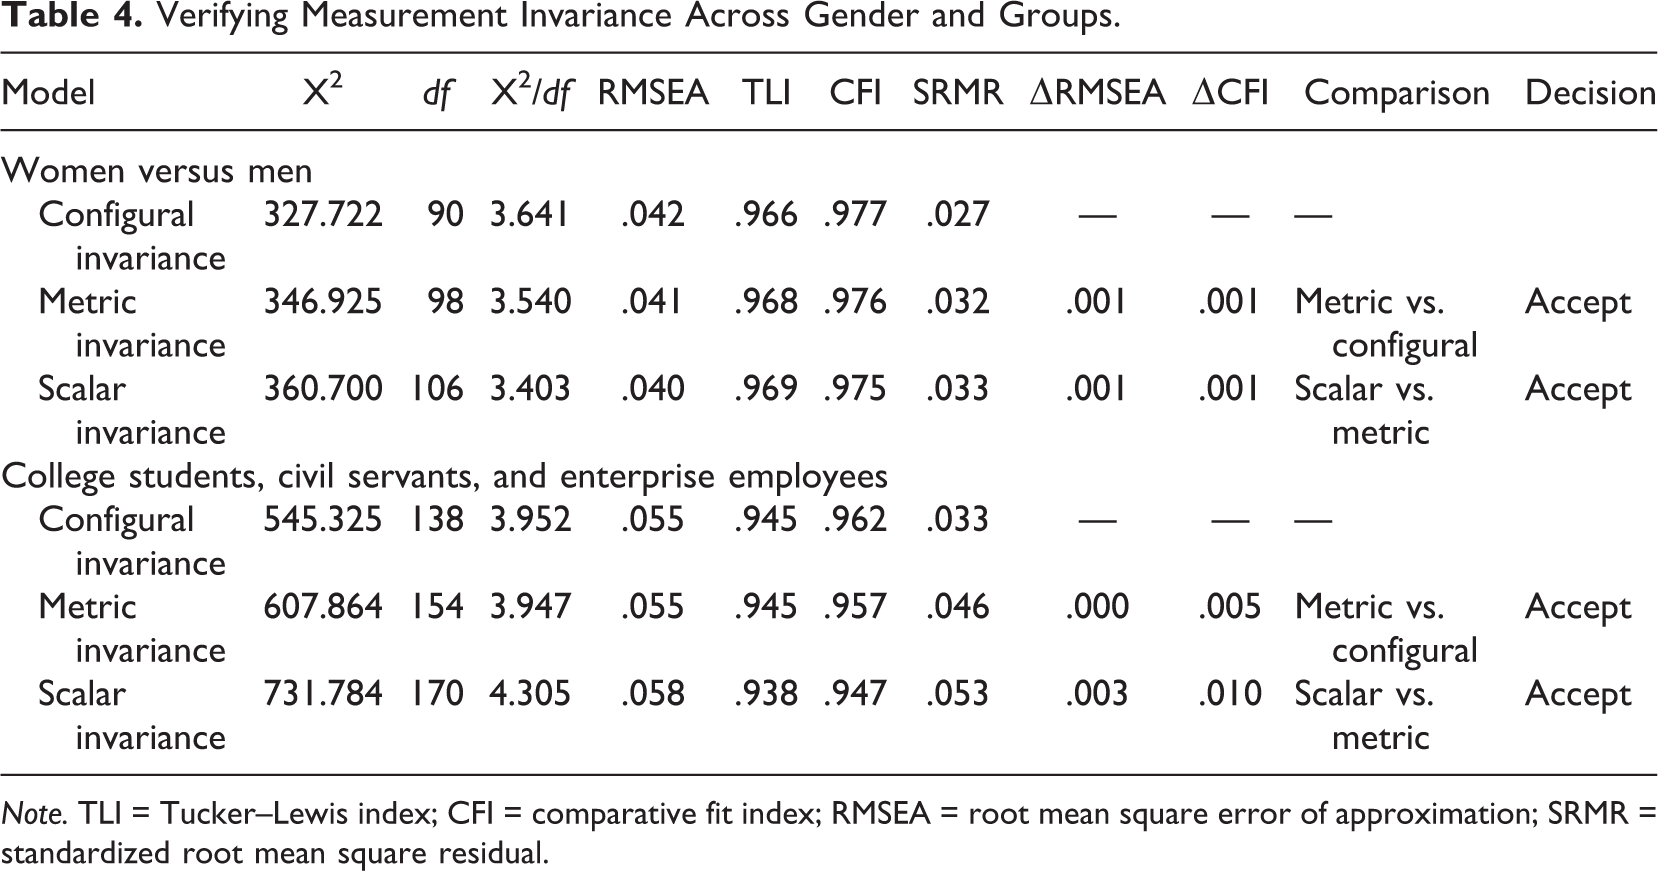
Note. TLI = Tucker–Lewis index; CFI = comparative fit index; RMSEA = root mean square error of approximation; SRMR = standardized root mean square residual.
Test of measurement invariance across the three sample groups also showed good results (χ2/df = 3.522/4.194/4.139, CFI = .959/.959/.966, TLI = .941/.941/.951, RMSEA = .053/.062/.051). As suggested by Table 4, the results showed that the configural model, metric model, and scalar model could all pass the test (ΔCFI = .005/.010 and ΔRMSEA = .000/.003).
Descriptive Statistics
Descriptive statistics, correlations, and reliability coefficients of the main variables in this study are displayed in Table 5. The results showed that career adaptability was positively correlated with career exploration (r = .435, p < .01), job search intensity (r = .210, p < .01), job performance (r civil servants = .251, r enterprise employees = .159, p < .01), and career satisfaction (r civil servants = .475, r enterprise employees = .257, p < .01). 1 We can conclude that the majority of the subscales showed acceptable reliability with α ≧ .70. 2 Correlational analyses showed that the corresponding dimensions in the 12-item and 24-item versions were strongly associated. The values of correlation were .930 for the concern dimension, .920 for the control dimension, .909 for the curiosity dimension, and .906 for the confidence dimension. The total adaptability scores of the two versions were also highly correlated (r = .964), suggesting that the CAAS-SF China can be considered as a refined and adequate alternative to the 24-item version.
Descriptive Statistics and Bivariate Analysis (CAAS-SF China).

Note. CAAS-SF = Career Adapt-Abilities Scale–Short Form. Reliability (Cronbach’s α) shown in bold along the diagonal of the table.
**p < .01.
We also tested the association between the two versions of the CAAS with some criterion variables across three different samples. For the CAAS China (total and dimensions scores), the correlation coefficient (r) ranged between .321 and .477 for career exploration, between .166 and .219 for job search intensity, between .199 and .499 for career satisfaction, and between .101 and .263 for job performance. For the CAAS-SF China (total and dimensions scores), the coefficients varied between .260 and .435 for career exploration, between .136 and .210 for job search intensity, between .168 and .475 for career satisfaction, and between .069 and .251 for job performance. Compared with the coefficients between the CAAS China and criterion variables, the CAAS-SF China had weaker associations with the variables. However, the differences between the two versions were not statistically significant (Table 6).
Correlation Coefficients of the CAAS-SF China and CAAS-China Subscales Across Three Samples.
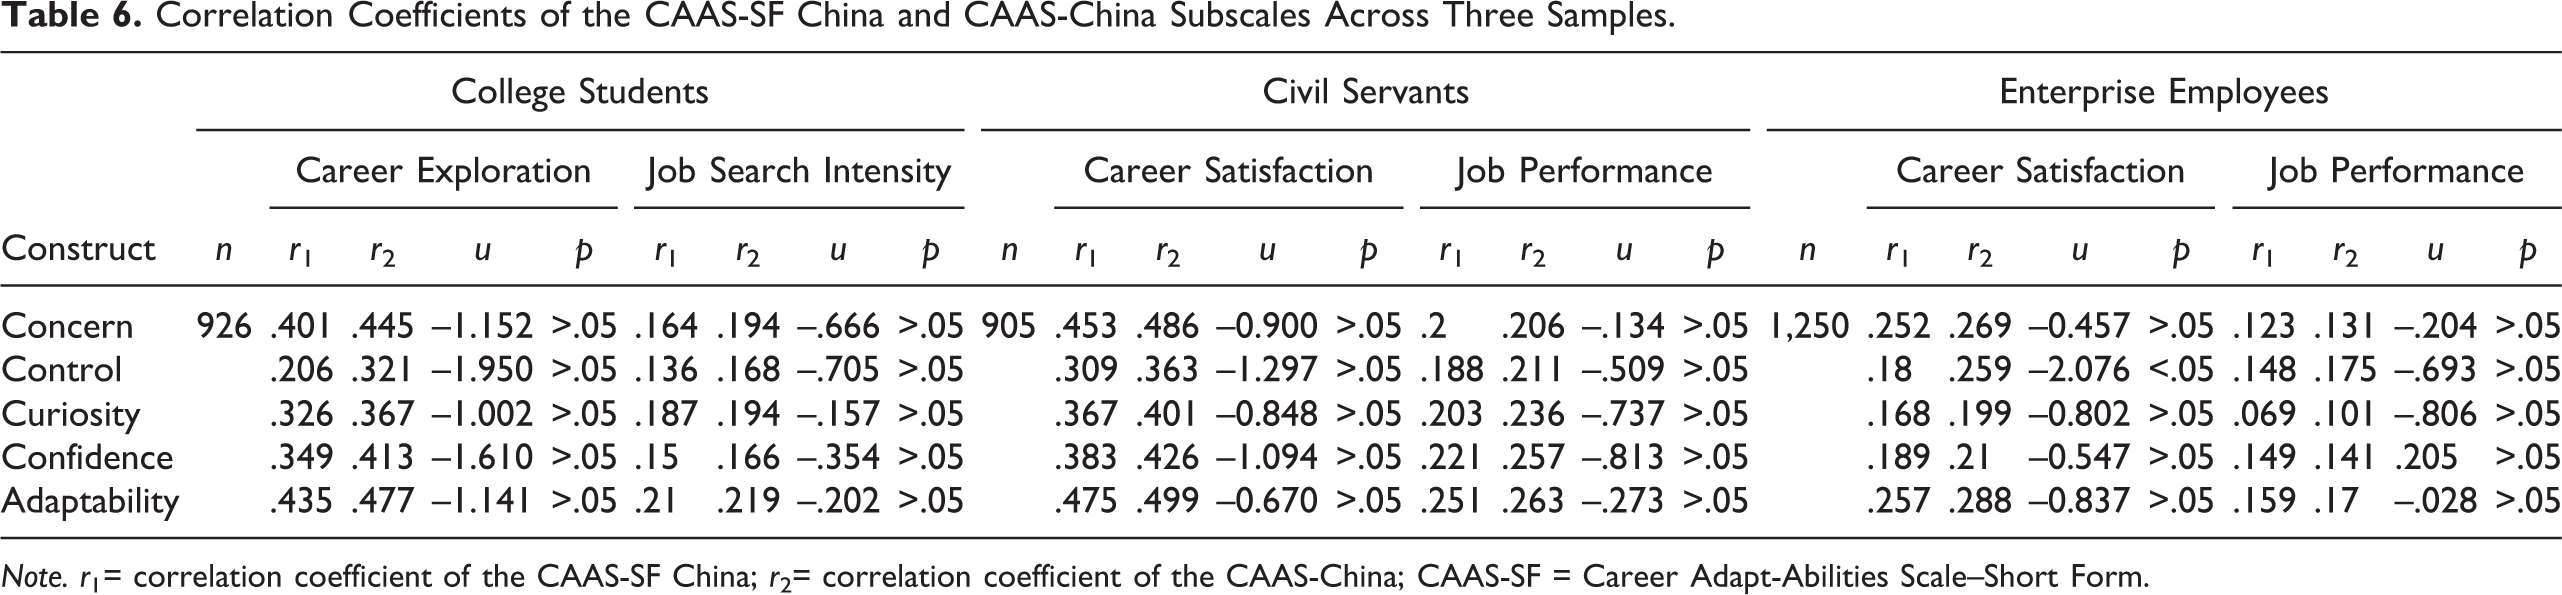
Note. r 1= correlation coefficient of the CAAS-SF China; r 2= correlation coefficient of the CAAS-China; CAAS-SF = Career Adapt-Abilities Scale–Short Form.
Career Adaptability Scores Across Gender and Social Groups
Based on the results of the measurement invariance test, we compared the differences in career adaptability among the three samples. Significant differences were found among all subscales, F(2, 3051) = 12.732, p < .01; F(2, 3053) = 30.305, p < .01; F(2, 3063) = 20.256, p < .01, except for the curiosity subscale (F = 1.324, p > .05). In particular, analysis of variance (ANOVA) tests suggested that enterprise employees reported the highest level of control, while college students reported the lowest level. Civil servants reported the lowest level of concern, but no significant difference in the scores was observed between college students and enterprise employees. College students reported the lowest level of confidence, but no significant difference in the scores was observed between civil servants and enterprise employees. In terms of gender, ANOVA tests highlighted significant gender differences regarding the curiosity and confidence dimensions. The result showed that males reported higher levels of curiosity and confidence, F(1, 3038) = 21.334, p < .01; F(1, 3051) = 6.324, p < .05, than females. We also examined whether there were significant differences between males and females among the three different groups (see Table 7). Compared with their female counterparts, male students reported higher levels of concern, F(1, 920) = 10.085, p = .002, and curiosity, F(1, 921) = 14.965, p < .01; male civil servants reported higher levels of confidence, F(1, 892) = 7.938, p < .01; and male enterprise employees reported higher levels of curiosity, F(1, 1222) = 7.935, p < .01.
Descriptive Statistics for the College Students, Civil Servants, and Enterprise Employees of the CAAS-SF China.
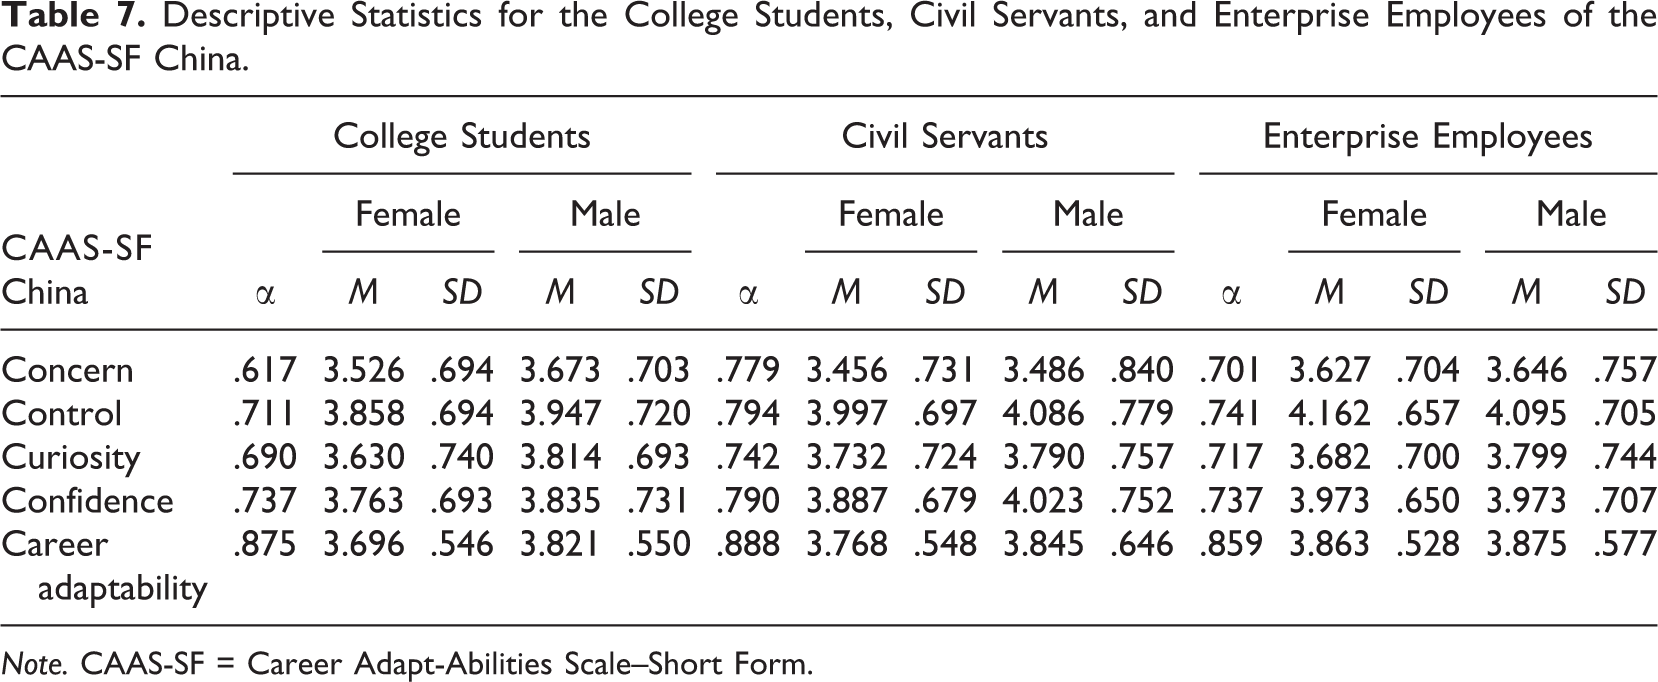
Note. CAAS-SF = Career Adapt-Abilities Scale–Short Form.
Discussion
The development of career adaptability is one of the most significant advancements in vocational psychology in the past two decades (Nye et al., 2018). This study aims to contribute to this growing literature through examining the reliability and validity of the CAAS-SF in China. Overall, the results are consistent with the findings of Maggiori et al. (2017). The CAAS-SF China demonstrates similar psychometric properties to the full form when applied to the Chinese context.
Specifically, the results of EFAs and CFAs supported the four-factor hierarchical structure of the 12-item version among all sample groups. The CAAS-SF China’s four-factor solution is not only coherent with the 24-item version but also consistent with the theoretical background of career adaptability (Savickas, 2005; Savickas & Porfeli, 2012). In addition, consistent with our expectation, the results showed that the CAAS-SF China accounted for even more variance (61.46%, 70.47%, and 66.28%) than the CAAS China (47.66%, 60.48%, and 53.50%) across the three different groups. This indicates that the CAAS-SF China captures the most critical items for developing career adaptability.
For the Cronbach’s α coefficient values, the total scale and four subscales all demonstrated good internal consistency. The results further indicated that the CAAS-SF China had lower consistencies for the subscales as well as the total scale. The Concern subscale (α = .62) and the Curiosity subscale (α = .69) for the student sample were slightly lower than the cutoff value of .70. The decrease in Cronbach’s α coefficients might be caused by the instability of students’ career expectations. The results from a large survey among Chinese college graduates (Mycos Institute, 2011) reported that only 27% of college graduates selected their major based on their interests, while 22% decided to change their major after entering university due to incongruent choices. These results suggest that college students’ understanding and expectation of a future career are not as clear as that of their employed counterparts and thus could be easily influenced by environmental factors. Therefore, the stability and consistency of the measurement among college students were lower than those of government and enterprise employees. Similar results have also been reported in other studies (Hou et al., 2012; Işık et al., 2018). Moreover, the adaptability total score and the respective dimensions of the CAAS-SF China and the CAAS China were strongly correlated, and the two versions had similar relations with other criterion variables such as career exploration, job search intensity, career satisfaction, and job performance. The results suggest that the shorter version can be used as a reliable alternative to the CAAS China.
In addition, invariance tests supported the use of the abridged 12-item version of the CAAS-SF China among diverse populations. Models proposed by the current study (i.e., configural, metric, and scalar invariances) showed acceptable to good fit to the data collected from different social as well as gender groups. This result is consistent with previous research (Işık et al., 2018; Maggiori et al., 2017).
Lastly, this study also revealed gender and occupational differences in career adaptability scores. Overall, college students had the lowest scores for all subscales, while enterprise employees reported the highest scores on all subscales except for the Curiosity subscale. Males had higher scores than females on all subscales. These results are in line with the social and cultural context in China. In an East Asian cultural setting, the idea of serving as government official could bring honor to one’s family (Elman, 2013), together with the stability of civil service jobs and the relatively fixed hierarchy of Chinese government departments, leave very limited space for employees’ career development. Considering that career adaptability reflects the motivation to change the nature of one’s career (Tolentino et al., 2014), it is reasonable for Chinese civil servants to have lower career adaptability scores than enterprise employees, whose jobs are more competitive and less secure and thus are more motivated to improve themselves. As college students generally have little familiarity with the job market, a higher level of career concern allows them to foresee the difficulties in job searching and to prepare themselves for these challenges (Guan et al., 2013). However, since college students have not yet entered the job market, their career adaptability may be slightly lower than that of their employed counterparts. In terms of gender, our results are consistent with previous studies (Hou et al., 2012; Yu, 2008). China is a country with a strong belief in traditional gender roles and gender division of labor. Males in Chinese society are usually believed to be breadwinners who devote most of their energy to career achievement, while females are expected to be housekeepers who care more about their families than their jobs. As a consequence, males in societies such as China are generally more “prepared” for careers and have stronger adaptability than females (Hou et al., 2012).
Theoretical and Practical Implications
This study extended the previous research by making three theoretical contributions. First, the CAAS-SF China and the CAAS China are similar in their psychometric strengths and construct validity. Moreover, the variables employed in the short form demonstrated a similar explanatory power to those in the CAAS China full scale. These results support the conclusion that the shorter version can be used as a reliable measure in the Chinese context, making it an efficient alternative to the full scale. Second, the semantic and structural equivalences between the original CAAS-SF and the CAAS-SF China have been confirmed. The proposed four-factor hierarchical model of career adaptability has been cross-validated in multiple Western and non-Western countries. In addition, the constructs and items of the CAAS-SF China were developed with close reference to Chinese culture as well as the international items. All of this evidence supports the recent emerging consensus of scholars from different countries on the cross-cultural relevance of the career adaptability short measure (CAAS-SF; Işık et al., 2018; Maggiori et al., 2017). The current study provides additional support for the global application of the CAAS-SF in the largest developing country. Third, the full scale and the four subscales of the CAAS-SF China displayed a high degree of internal consistency and a coherent multidimensional, hierarchical structure. These results are consistent with the theoretical model and linguistic explication of career adaptability resources. In addition, we examine the career adaptability theory across three different samples and particularly among civil servants, which has rarely been done in previous research. Our study confirms the applicability of the theoretical constructs of career adaptability in different social groups in China and enriches CCT.
The CAAS-SF China carries important implications for organizational and individual career management and counseling. This short, user-friendly yet still valid and reliable 12-item version of the original CAAS China might help individuals to regulate goal-pursuing processes in various career transitions (Savickas, 1997). First, from a developmental perspective, college students are in the stage of emerging adulthood, which allows for various exploratory activities to identify their future career possibilities and to develop relevant abilities to cope with diverse challenges in career development. The major components of the CAAS-SF China highlight different activities being used to develop students’ adaptability. Hence, the items in the scale could guide both college students and their instructors in preparing for future difficulties and uncertainties in career development. Second, career adaptability enables employees—both civil servants and enterprise employees—to thrive in a world with boundaryless careers. Employees should pay more attention to their career adaptability in order to attain greater success in their career development, while the CAAS-SF could be used as an effective tool for their self-reflection and improvement.
For organizations, career adaptability could predict future organizational success (Ito & Brotheridge, 2005; Jundt, Shoss, & Huang, 2015; Savickas & Porfeli, 2012). Employing psychometrically validated tools such as the CAAS-SF in their daily work would be a good starting point for organizations and enterprises to further enhance their employees’ career adaptability. Resource-based theory (Nordhaug & Grønhaug, 1994) proposed organizational adaptability as one of the key resources to achieve satisfactory organizational performance and sustainable development, while employees’ career adaptability is the key element of organizational adaptability. Moreover, enhancing employees’ career adaptability will equip employees with greater competences on the job market. It is important for today’s management teams to help improve employees’ career adaptability, which increases the possibility of their lifelong employment (Van der Heijden & De Vos, 2015).
Limitations and Future Research Directions
Despite the theoretical and practical implications discussed above, this study has several limitations that suggest directions for future research. First, although the data were collected at two time points, the study should not be considered as a longitudinal one due to the nature of the research design. Second, the internal consistency of the Concern and Curiosity subscales was below .70. Although .70 is also not an absolute cutoff value for measuring internal consistency (Hatcher & Stepanski, 1994; Hou et al., 2012; Van Der Heijden et al., 2018), the lower α values still reflected some unidentified issues in the analysis. Future studies are thus suggested to examine the subscales’ reliability and validity using high-quality data. Third, future research is needed to further examine the reliability and validity of the CAAS-SF in different cultural contexts as well as in various career counseling settings characterized by diverse demographic and occupational structures.
Footnotes
Appendix
Career Adapt-Abilities Scale–Short Form China.
| Concern (关注) | |
| Q1. Thinking about what my future will be like | 思考我的未来会是什么样 |
| Q2. Preparing for the future | 为未来做准备 |
| Q3. Becoming aware of the educational and vocational choices that I must make | 知道我必须要做出的教育和职业选择 |
| Control (控制) | |
| Q4. Making decisions by myself | 靠自己做决定 |
| Q5. Taking responsibility for my actions | 为自己的行为负责 |
| Q6. Counting on myself | 依靠我自己 |
| Curiosity (好奇) | |
| Q7. Looking for opportunities to grow as a person | 寻找成长的机会 |
| Q8. Investigating options before making a choice | 在做决定前考量各种可能的选择 |
| Q9. Observing different ways of doing things | 观察别人做事的不同方式 |
| Confidence (自信) | |
| Q10. Taking care to do things well | 认真把事情做好 |
| Q11. Learning new skills | 学习新技能 |
| Q12. Working up to my ability | 逐步发展我的能力 |
Note. This final, 12-item Career Adapt-Abilities Scale–Short Form China contains twelve English items taken directly from Maggiori, Rossier, & Savickas (2017), and twelve Chinese items taken or adapted from Hou, Leung, Li, Li, & Xu, (2012).
Declaration of Conflicting Interests
The author(s) declared no potential conflicts of interest with respect to the research, authorship, and/or publication of this article.
Funding
The author(s) disclosed receipt of the following financial support for the research, authorship, and/or publication of this article: This research was partially supported by grants from The National Natural Science Foundation of China (Project No. 71871025; 71802023).