
Abstract
The Negative Outcome Expectations Scale in Engineering (NOES-E) is a 21-item measure that was developed to assess anticipated negative outcomes related to pursuing engineering. Using two samples of engineering students, exploratory (n = 256) and confirmatory (n = 1,187) factor analyses supported a four-factor model of the NOES-E. The four factors included cultural-related stressors, personal life and work balance, job characteristics, and social costs. The results suggested that the 21-item NOES-E demonstrated strong internal consistency (Cronbach’s α = .94) and construct validity by a positive correlation with a measure of engineering environmental barriers and negative correlations with measures of engineering academic satisfaction, self-efficacy, environmental supports, intended persistence, and positive outcome expectations. There was nonsignificant relation between NOES-E scores and future family consideration. Also, we found that women and transgender students reported higher negative outcome expectations in engineering than men. However, there were no significant group differences across race/ethnicity. Implications for practice, theory, and future vocational research in engineering are discussed.
Keywords
Recently, the need for high-quality engineers has increased, given their critical role in supporting the United States’ competitiveness in the global economy, particularly over the next 10 years (U.S. Bureau of Labor Statistics, 2013). Unfortunately, the overall number of U.S. engineering students has flattened or decreased over the last several years and does not currently meet industry demands for filling these positions (Johnson & Jones, 2006), making the education and training of qualified engineering students a priority. Another considerable concern in the engineering field is the lack of diversity in educational and work settings. The low participation rates of women and ethnic minorities in engineering have been a critical issue (National Science Foundation, 2013). According to National Science Foundation (2012), White men (56.5%) make up the majority of all engineering majors and both White women (10.8%) and ethnic minorities (below 10%) are significantly underrepresented in engineering.
Derived from Bandura’s (1986) social cognitive theory as a means of integrating conceptually related constructs across well-established career development theories, social cognitive career theory (SCCT; Lent, Brown, & Hackett, 1994, 2000) has been widely used to understand factors influencing the persistence of undergraduate engineering majors (Byars-Winston, Estrada, Howard, Davis, & Zalapa, 2010; Flores et al., 2014; Inda, Rodríguez, & Peña, 2013; Lee, Flores, Navarro, & Kanagui- Muñoz, 2015; Lent et al., 2005, 2013; Navarro, Flores, Lee, & Gonzalez, 2014). SCCT is a domain-specific theory and provides a strong theoretical framework with which to assess the relationships among academic and career-related self-efficacy, outcome expectations, interests, and goals in understanding academic and career-related actions and performance, including academic persistence. Lent and Brown (2006) noted the importance of developing domain-specific measures to test SCCT hypotheses.
Most SCCT studies have focused on the role of self-efficacy (Lee et al., 2015; Nauta, 2004; Quimby & O’Brien, 2004), with outcome expectations receiving less attention compared to other core social cognitive variables (Fouad & Guillen, 2006). Additionally, though engineering self-efficacy has been a consistent predictor of engineering interests and goals (Flores et al., 2014, Lent, Brown, Schmidt, et al., 2003; Lent, Brown, Sheu, et al., 2005; Lent, Shue, Gloster, & Wilkins, 2010), inconsistent results on the role of engineering outcome expectations in the development or expression of interests and goals have been reported. For example, some studies found that outcome expectations were not significant predictors of interests, major choice, academic satisfaction, or goals (Lent et al., 2003; Lent, Lopez, Sheu, & Lopez, 2011; Lent, Singley, Sheu, Schmidt, & Schmidt, 2007; Navarro et al., 2014), whereas other studies reported that outcome expectations demonstrated significant relations among these variables (Byars-Winston et al., 2010; Flores et al., 2014; Lent et al., 2013). Recent research demonstrated the important role of engineering outcome expectations in persistence intentions beyond college. In a study of over 2,000 women engineers, findings indicated that outcome expectations, but not self-efficacy, had a positive, significant relation with job attitudes, suggesting that outcome expectations play a critical role in the persistence of women engineers in the workforce (Singh et al., 2013). These inconsistent findings regarding the role of outcome expectations in SCCT may be related to measurement issues as well as gender and ethnic differences across study samples. Thus, more research related to domain-specific outcome expectations measures is needed (Fouad & Guillen, 2006; Swanson & Gore, 2000) in an attempt to improve measurement of this central SCCT construct with diverse samples.
Improvements in measurement need to begin with a fuller conceptual understanding of outcome expectations. Bandura (1986) described outcome expectations as the anticipated positive and negative consequences of engaging in a particular behavior. Bandura (1997) explained that positive outcomes are perceived as incentives that facilitate a particular behavior, whereas negative outcomes are perceived as disincentives to continue a particular behavior. He introduced three forms of outcome expectations: (a) anticipated social (e.g., advantage to one’s family or social life), (b) material or physical (e.g., financial gain or feeling), and (c) self-evaluative (e.g., self-approval) outcomes. Outcome expectations are distinguished from environmental supports and barriers. The focus of outcome expectations is on future positive and negative outcomes that are anticipated, while environmental supports and barriers assess the perceived current resources, supports, and challenges.
Several critiques have addressed the limitations of existing measures of outcome expectations. First, although the construct of outcome expectations refers to both perceived positive and negative consequences of one’s actions, positive aspects of outcome expectations have received more of the spotlight (Fouad, Smith, & Enochs, 1997; Lent et al., 2001) than the negative aspects. So far, only two studies have included both positive and negative outcome expectations in the engineering field (Gibbons & Borders, 2010; Hackett, Betz, Casas, & Rocha-Singh, 1992). One (Gibbons & Borders, 2010) measured college-going outcome expectations among middle school students, and the other one (Hackett et al., 1992) measured positive outcome expectations using 9 items and negative outcome expectations using only 3 items with a sample of engineering students. More efforts need to measure negative outcome expectations in the engineering domain. Another critique is that existing measures do not accurately capture the multidimensional aspects of outcome expectations (Fouad & Guillen, 2006) identified by Bandura (1997). Fouad and Guillen (2006) highlighted the importance of developing outcome expectations measures that include multidimensional outcomes such as social, physical, and self-evaluative outcomes. The current study extends the literature by developing and validating a new scale that measures negative outcome expectations in engineering and that addresses these critiques.
Moreover, the existing measures do not reflect cultural factors on outcome expectations. Within engineering, it is important to understand the influence of cultural factors, given the underrepresentation of women and ethnic minorities in the field. Morrow, Gore, and Campbell (1996) highlighted that outcome expectations may play a more critical role than self-efficacy beliefs in the development of interests and goals among individuals from oppressed groups. Previous studies also suggested that gender and ethnic background might affect engineering students’ positive and negative experiences in engineering (Hackett et al., 1992), and that stereotype threat in Science, Technology, Engineering and Math (STEM) fields impacts persistence in STEM careers (Deemer, Lin, Graham, & Soto, 2016). Such research may aid in efforts to increase the recruitment and retention of diverse individuals. Accordingly, we designed a measure of negative outcome expectations with items that capture gender- and ethnic-related cultural factors in engineering.
The Present Study
Given the central role of outcome expectations in the SCCT model and the lack of existing measures that capture negative expectancies in engineering, our main purpose was to develop a valid and reliable multidimensional Negative Outcome Expectations Scale in the domain of engineering that is relevant to a diverse group of engineering majors. We present the development of the Negative Outcome Expectations Scale in Engineering (NOES-E) as well as report related validity and reliability estimates via two separate studies.
Study 1: Item Generation, Exploratory Factory Analysis, and Initial Estimates of Validity and Reliability
The purpose of this study was to generate a set of items that capture both Bandura’s multiple dimensions of negative outcome expectations (i.e., social, physical, and self-evaluative outcomes) and gender- and ethnic-related cultural factors in engineering. After the items were generated and data collected from a diverse sample of engineering students, items were subjected to exploratory factor analysis (EFA) procedures. Upon establishing the factor structure of the NOES-E, initial reliability estimates were obtained.
Method
Participants
The sample consisted of 256 engineering students (166 men, 90 women) from a large public university in the Southwest. Among the participants, 160 (63%) identified as Latino/as, 93 (36%) identified as White, and 3 (1%) did not report their race/ethnicity. In terms of academic classification, 200 (78%) were undergraduate students and 56 (21%) were graduate students. Engineering majors included 45 (18%) mechanical, 43 (17%) electrical and computer, 41 (16%) aerospace, 28 (11%) civil, 27 (11%) chemical, 17 (7%) technology, 11 (4%) industrial, and 11 (4%) engineering physics. Six (2%) were in “other” engineering, majors, and 27 (11%) did not report a specific major area.
Item Generation
To properly contextualize the content-specific negative outcome expectations in engineering and to develop items, we used multiple approaches. First, we reviewed the literature on outcome expectations and stereotypes of engineering majors, especially ethnic- and gender-related experiences in engineering. In this process, the literature review included conceptual papers related to outcome expectations (e.g., Bandura, 1997; Fouad & Guillen, 2006; Lent et al., 1994, 2000), empirical studies related to engineering outcome expectations in SCCT (e.g., Flores et al., 2014; Lent et al., 2013; Navarro et al., 2014), and negative stereotypes or hindrances on engineering majors (e.g., Buse, Bilimoria, & Perelli, 2013; Cech, Rubineau, Sibey, & Seron, 2011; Deemer et al., 2016; Wyer, 2003). Second, an informal interview was conducted with three women engineering students to gather information on their experiences. Based on the literature reviews and informal interviews, an initial pool of 43 items was generated by a team of two faculty and four graduate students. In addition, two vocational psychologists with expertise in SCCT and the career development of women and/or ethnic minorities reviewed the content of the 43 items. Through the experts’ feedback and intensive team discussion, we arrived at a list of 41 initial items.
Procedure and Measure
Data for this specific study were collected through on online survey using Qualtrics during the last wave of a larger, 3-year longitudinal study of satisfaction and intended persistence in engineering majors and careers at a Hispanic-serving institution in the U.S. Southwest. Engineering students were recruited through e-mail announcements, class presentations, and flyers. To increase women engineering students’ participation, follow-up postcards, text messages, and phone calls were utilized. Along with a series of other engineering-related scales and a demographic questionnaire, participants completed the 41-item NOES-E by responding to a variety of possible negative outcomes related to completing an undergraduate degree in engineering, such as “Graduating with a BS degree in engineering will likely result in experiencing high levels of stress due to a demanding work environment that affects my home life” or “Graduating with a BS degree in engineering will likely result in feeling isolated from others outside of engineering.” Participants responded to each statement using a 10-point rating scale that ranged from 0 (strongly disagree) to 9 (strongly agree). Thus, higher ratings related to more negative expectancies about engineering outcomes.
Results
Preliminary Analysis
Before proceeding to item-level analysis and EFA, item-level data screening was performed. Seven cases that included random responses were removed, which resulted with a total of 256. Little’s Missing Completely at Random (MCAR) test with the remaining cases indicated that data were missing completely at random (χ2 = 101.30, p = .42). Normality tests showed none of the items violated the assumption (|kurtosis, skewness| < 2; George & Mallery, 2010).
Item-Level Analysis
In the item-level analysis, we found that each of the 41 items had appropriate levels of central tendency and dispersion, indicating little concern for floor or ceiling effects. Items showed good variability (SD > 1.0; Zhang, Jin, Ngorsuraches, & Li, 2009) and item-total correlations above .30 (Hinton, Brownlow, McMurray, & Cozens, 2004), indicating that all items shared a significant amount of variance with the total scale.
EFA
An EFA using maximum likelihood extraction with promax rotation was performed on the 41 items: 52.76% of variance, Kaiser–Meyer–Olkin (KMO) = .93, Bartlett’s test = 6,862.45 (df = 820, p < .001). Based on the scree plot and eigenvalues-greater-than-one rule, we explored factor structures ranging from 1 to 7. After a careful review of the seven solutions, the four-factor structure was deemed most appropriate in terms of statistical results (i.e., factor loadings), theoretical understanding, and interpretation. Based on a variety of criteria (i.e., minimum loading of .32 and no cross-loading on multiple factors determined by at least .15 difference between the highest and next highest loading factors; communality; content of the item), a four-factor scale with 21 items was selected. To confirm, an additional EFA was performed with these 21 items: KMO = .91, Bartlett’s test = 3,073.64 (df = 210, p < .001). Based on the scree plot, eigenvalues-greater-than-one rule, and theoretical relevance of item membership, the four-factor structure was deemed appropriate (64.13% of variance), where all items had a factor loading above .40 on one factor with no cross-loadings (see Table 1). This final factor structure also supported optimal interpretation and theoretical agreement on the concept of outcome expectations.
Exploratory Factor Structure With Factor Loadings, Item Content, Descriptive Statistics, Percentage of Variance, and Cronbach’s α Level of the Negative Outcome Expectations Scale in Engineering.

Note. CRS = culture-related stressors; PLWB = personal life and work balance; JC = job characteristics; SC = social costs; r = item-total correlation. The shaded areas indicate the factor to which each item loaded.
**p < .01.
Factor 1 was named cultural-related stressors because the items reflect expected negative consequences related to an unfriendly working culture for women or ethnic minorities or high, demanding workloads. The highest loading items were “receiving a lower salary than my peers for equal work and qualifications” and “worrying about being perceived negatively because of plans to have family or already having a family.” A high score indicates that participants anticipate a high level of cultural-related stressors in engineering.
Factor 2 was named personal life and work balance because items reflect expected negative outcomes and concerns related to potential difficulties for balancing the demands and/or aspects of work and personal lives. The highest loading items were “not having time to maintain current friendships or begin new ones,” “having difficulty finding time a date,” and “not having a personal life.” A high score indicates that participants have strong negative expectations about effectively balancing work and personal life in future engineering pursuits.
Factor 3 was named job characteristics because items reflect negative perceptions or feeling related to the tasks they expect to perform in engineering. The highest loading items were “doing boring work,” “having a tedious job,” and “having a job that is uninspiring.” A high score indicates that participants have negative perceptions of engineering job characteristics.
Factor 4 was named social costs because items reflect anticipated concerns related to social relations with family, friends, or romantic partners. The highest loading items were “feeling like an outcast among potential romantic partners,” “being less attractive to my partner,” and “feeling like an outcast among family and friends.” A high score indicates an expectation of being less attractive and being more isolated in social settings as a result of pursuing engineering.
Internal Consistency and Factor Correlations
Cronbach’s αs were calculated to determine the internal consistency of the four NOES-E subscales and total scale. Cronbach’s αs were .89, .83, .84, and .84 for cultural-related stressors, personal life and work balance, job characteristics, and social costs, respectively. The Cronbach’s α of total scale items was .93. The interfactor correlations were significant and ranged from .52 to .62 (p < .001).
Study 2: Confirming the Factor Structure, Validity, and Reliability of the Negative Outcome Experiences in Engineering Scale
The purpose of this study was to investigate the factor stability of the NOES-E using confirmatory factor analytic (CFA) procedures. We hypothesized that the data from Study 2 would be a good fit to the factor model established in Study 1. Additionally, we investigated the convergent and discriminant validity of the NOES-E by correlating NOES-E scores with constructs hypothesized to be conceptually related via SCCT (i.e., engineering academic satisfaction, supports, barriers, and intended persistence) and a construct that is not conceptually related (i.e., future family consideration). It was hypothesized that SCCT-related constructs would be negatively correlated with the NOES-E scores, except for engineering barriers, which would be positively correlated with the NOES-E scores. However, future family considerations would not be significantly correlated with the NOES-E scores. Related to demographic variables (i.e., gender and race/ethnicity), we hypothesized that women and Latinos would have higher negative outcome expectations than their counterparts. Finally, estimates of internal consistency were obtained to provide evidence of the reliability of the NOES-E Scale.
Method
Participants
The sample consisted of 1,187 (626 men, 558 women, 3 transgender) engineering students attending eleven 4-year universities in the United States. The mean age of the participants was 21.26 years (SD = 3.73), and 90% were between the ages of 18 and 25. Among them, 649 (54.7%) identified as Latino/a, 518 (43.6%) identified as White, 19 (1.6%) identified as multiracial/multiethnic, and 1 (0.1%) identified as other. In terms of academic classification, 274 (23.1%) were first-year students, 289 (24.3%) were sophomores, 342 (28.8%) were juniors, 270 (22.7%) were seniors, and 12 (1%) were other. Engineering majors included 258 (21.7%) mechanical, 203 (17.1%) computer, 181 (15.2%) civil, 154 (13%) electrical, 127 (10.7%) biomedical, 82 (6.9%) chemical, 43 (3.6%) aerospace, and 139 (11.7%) were other engineering majors.
Procedure and Measures
Data for this specific study were collected through on online survey using Qualtrics during the first wave of a 5-year longitudinal study of academic engagement, satisfaction, and intended persistence in engineering majors and careers. Participants were engineering students enrolled at 11 universities across the United States who identified as White, Latina/o, or multiracial Latina/o. They were recruited through e-mail announcements that were sent through the College of Engineering listserv at each participating institution. Participants completed the 21-item NOES-E along with engineering domain measures of academic satisfaction, perceived supports, perceived barriers, intended persistence, positive outcome expectations, and self-efficacy. Participants also completed a measure of future family considerations and a demographic form.
Engineering academic satisfaction was measured with 7 items (Lent et al., 2007) that were adapted from a general academic satisfaction scale (Lent, Singley, et al., 2005). Example items include “I am generally satisfied with my academic life in engineering” and “I enjoy the level of intellectual stimulation in my engineering courses.” Items are rated from 1 (strongly disagree) to 5 (strongly agree). High scores indicate the high academic satisfaction level in engineering major. Internal consistency reliability ranged from .91 to .94 (Flores et al., 2014; Lent, Singley, et al., 2005). The coefficient α for the current study was .92. Academic satisfaction scores were positively correlated with positive outcome expectations (r = .52) and goal progress (r = .67; Lent et al., 2007).
Engineering perceived supports and barriers were measured with 14 items (Lent et al., 2001, 2005) related to engineering students’ perceptions of environmental supports (9 items) and barriers (5 items) using a 5-point Likert-type scale ranging from 1 (strongly disagree) to 5 (strongly agree). High scores of engineering supports scale are reflective of high perceived resources or supports from family or friends or environments. Sample items of engineering supports are: “have access to a ‘role model’ in this field” and “feel that close friends or relatives would be proud of for making this decision.” High scores of engineering barriers indicate the high level of perceived environmental barriers to pursue engineering major. Sample items of engineering barriers are: “receive negative comments or discouragement about your major from your family members” and “feel pressure from parents or other important people to change your major to some other field.” The internal consistency was .86 for both environmental supports and barriers in a previous study (Lent et al., 2005). Engineering perceived supports scores were positively related to measures of self-efficacy, positive outcome expectations, and goals, and engineering perceived barrier scores were negatively related to these measures (Lent et al., 2003). The coefficient α for the current study was .86 for both scales.
Engineering-intended persistence was measured with Lent et al.’s (2003) 4-item engineering goal scale, which assessed students’ intentions to persist in engineering majors using a 5-point Likert-type scale ranging from 1 (strongly disagree) to 5 (strongly agree). High scores reflect the strong intention to pursue or maintain engineering major. Sample items are: “I intend to major in an engineering field” and “I plan to remain enrolled in an engineering major over the next semester.” A previous study reported adequate coefficient α levels of .92 for Time 1 data and .93 for Time 2 data (Navarro et al., 2014). Also, engineering-intended persistence had positive correlations with self-efficacy, positive outcome expectations, interest, and academic satisfaction in engineering (Navarro et al., 2014). The coefficient α with the current sample was .92.
Engineering positive outcome expectations was assessed with Lent et al.’s (2003) 10-item scale that measures anticipated positive outcomes from receiving a bachelor’s degree in engineering. Sample items include: “I would receive a good job offer” and “I would do exciting work.” Items are rated on a 10-point Likert-type scale ranging from 0 (strongly disagree) to 9 (strongly agree). High scores indicate strong expectations of positive consequences after graduating a college with engineering degree. In prior studies, internal consistency ranged from .89 to .91 (Flores et al., 2014; Lent et al., 2003; Lent, Brown, et al., 2005). Engineering positive outcome expectations positively correlated with self-efficacy, interest, and goal (Flores et al., 2014; Lent et al., 2003) and academic satisfaction in engineering domain (Flores et al., 2014; Lent et al., 2007). The coefficient α for the current study was .92.
Engineering self-efficacy was measured with Lent, Brown, et al.’s (2005) 4-item measure that assessed students’ confidence in their academic ability in engineering majors. High scores indicate the high level of confidence in completing academic tasks in engineering. Sample items include: “excel in your engineering major over the next semester” and “completed the upper level required courses in your engineering major with an overall grade point average of B or better.” Participants respond to items using a 10-point Likert-type scale ranging from 1 (completely unsure) to 10 (completely sure). High scores indicate high level of self-efficacy in engineering. The range of internal consistency was from .90 to .92 (Flores et al., 2014; Lent, Brown, et al., 2005; Lent et al., 2007). Engineering self-efficacy scores positively related to engineering outcome expectations (Flores et al., 2014; Lent, Brown, et al., 2005; Lent et al., 2007), engineering interests and goals (Lent, Brown, et al., 2005), and engineering academic satisfaction (Flores et al., 2014; Lent et al., 2007; Navarro et al., 2014). The coefficient α for the current study was .90.
Future family considerations were measured with a 24-item Planning for Career and Family Scale (Ganginis Del Pino, O’Brien, Mereish, & Miller, 2013). This scale includes two subscales that assess how much individuals consider the needs of future children and partners when they are making career plans or decisions. Sample items are: “I will find a career where I do not have to work full-time after I have children” and “The wishes of my partner will not figure into my career plans.” High scores indicate a strong degree of willingness to prioritize the needs of their children and partners in their career decision-making process. Items are rated using a 4-point Likert-type scale ranging from 1 (strongly disagree) to 4 (strongly agree). The range of internal consistency was from .89 to .95 for the Children subscale and from .86 to .90 for the Partner subscale (Gangginis Del Pino et al., 2013; Gregor & O’Brien, 2015). The coefficient α from the current sample was .89 for total scale (.91 for a Children subscale and .85 for a Partner subscale). In terms of validity, future family orientation scores were negatively correlated with career orientation (Gangginis Del Pino et al., 2013) and achievement motivation (Gregor & O’Brien, 2015).
Results
Preliminary Analysis
The original sample of 1,719 engineering students was examined for missing values, normality of distribution, univariate and multivariate outliers. Cases with more than 20% of missing values were deleted (n = 342); no cases had missing data. After that, univariate outliers were deleted for environmental supports (n = 11), engineering academic satisfaction (n = 42), engineering persistence intentions (n = 57), engineering self-efficacy (n = 12), and engineering positive outcome expectations (n = 47). Also, we tested multivariate outliers with Mahalanobis distance. Among the 1,208 cases remaining after deleting univariate outliers, 21 multivariate outliers were eliminated. The final sample for the CFA and validity tests was 1,187.
Confirmatory Factor Analysis
Using AMOS 21 version (Arbuckle, 2012), a confirmatory factor analysis was conducted to test the stability of the four-factor oblique structure of the 21-item NOES-E. Items were constrained to the respective factor based on the EFA results reported earlier. According to Hu and Bentler’s (1999) recommendation, we evaluated our model fit with the comparative fit index (CFI), normed fit index (NFI), standardized root mean square residual (SRMR), root mean square error of approximation residual (RMSEA), and RMSEA 90% confidence interval (CI). According to guidelines, NFI and CFI values greater than .90 and SRMR values of .05 or less indicate good fit. In addition, RMSEA less than .05 indicates good fit, .08–.10 indicates acceptable fit, and greater than .10 indicates poor fit (Browne & Cudeck, 1993). Results of our model fit indicated an adequate to good fit of the data: CFI = .93, NFI = .92, SRMR = .04, RMSEA = .07, and RMSEA 90% CI [.07, .08]. Also, all standardized factor loading ranged from .43 to .83 (p < .001). These results supported that the 21 items are represented by four factors of negative outcome expectations among an independent sample of diverse engineering students (see Figure 1).
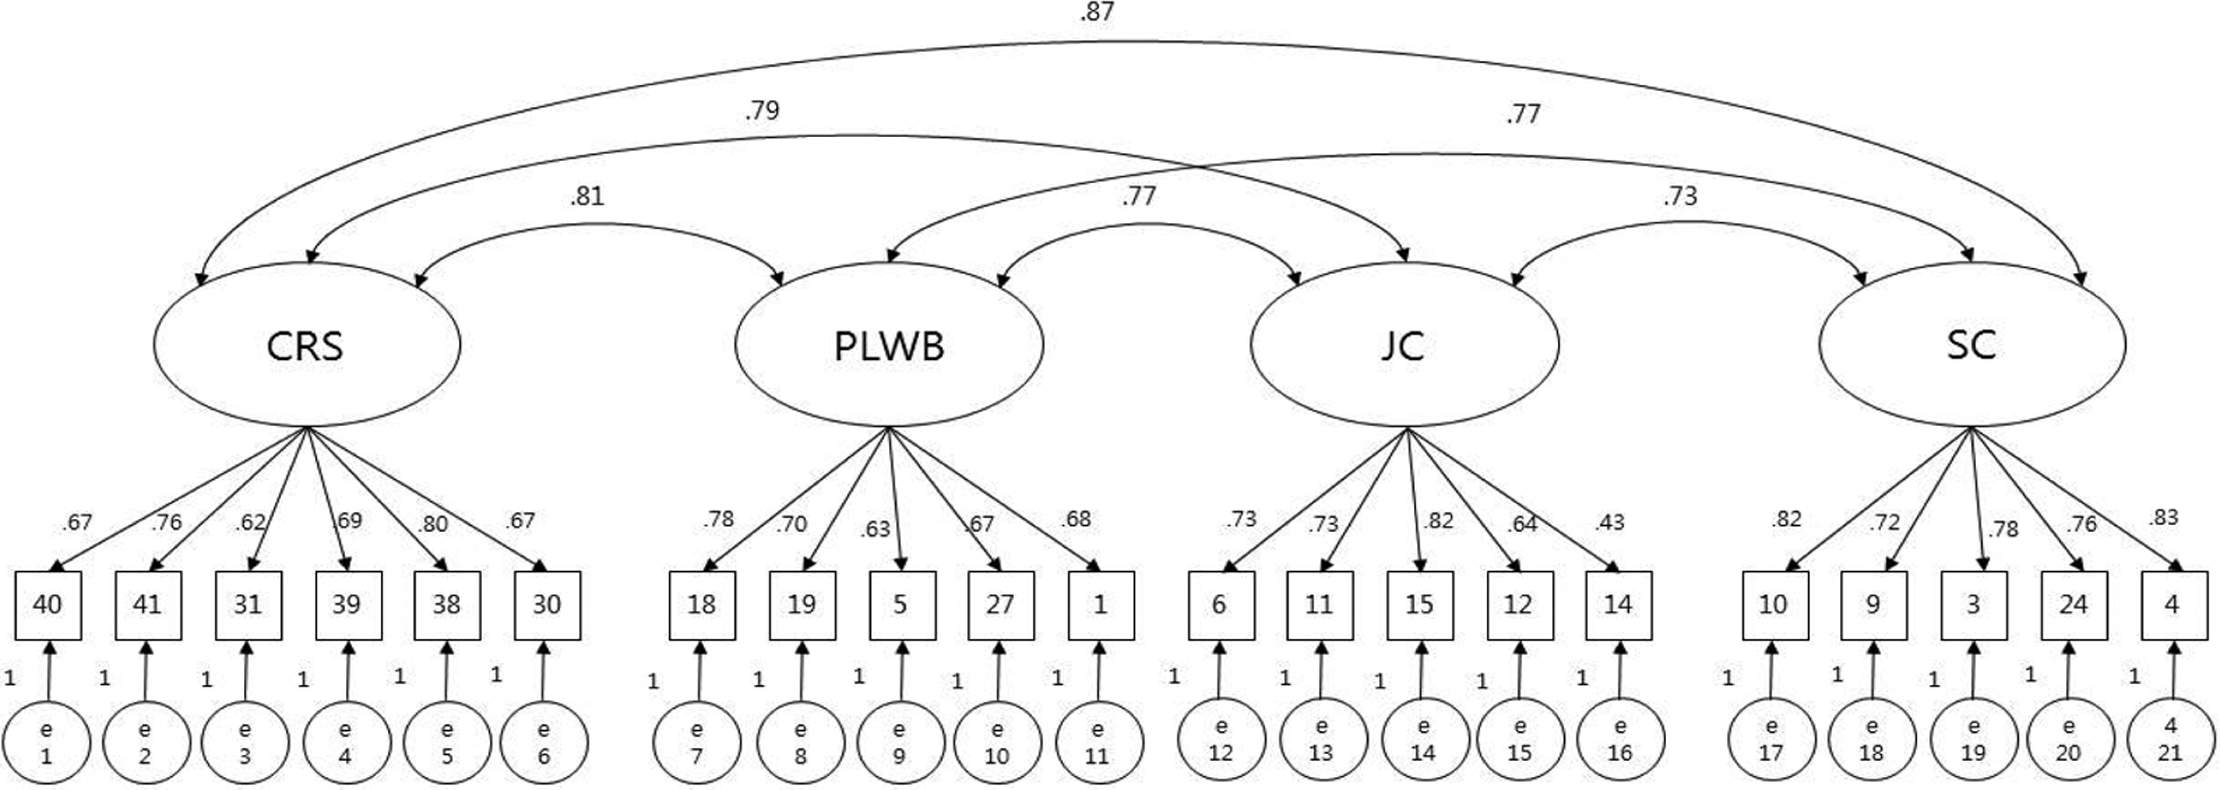
The correlated four-factor model. The large circles designate the latent four constructs, the rectangles with number indicate the measured variables for each number of NOES-E items, and e1–e21 are residual variance. Factor loadings are standardized (all ps < .001). CRS = cultural related stressor; PLWB = personal life and work balance; JC = job characteristics; SC = social cost.
To examine a general construct (i.e., General Negative Outcome Expectations in Engineering) beyond the four factors (i.e., cultural-related stressors, personal life and work balance, and social costs), we conducted the second-order hierarchical confirmatory factor analysis using maximum likelihood method. Results of a higher order factor model fit indicated an adequate to good fit of the data: CFI = .93, NFI = .92, SRMR = .05, RMSEA = .07, and RMSEA 90% CI [.07, .08]. All standardized factor loadings were significant at the p < .01 level. These results support that general negative outcome expectations construct exists beyond the four factors and this higher order factor has direct effects on each first-order factor (see Figure 2).
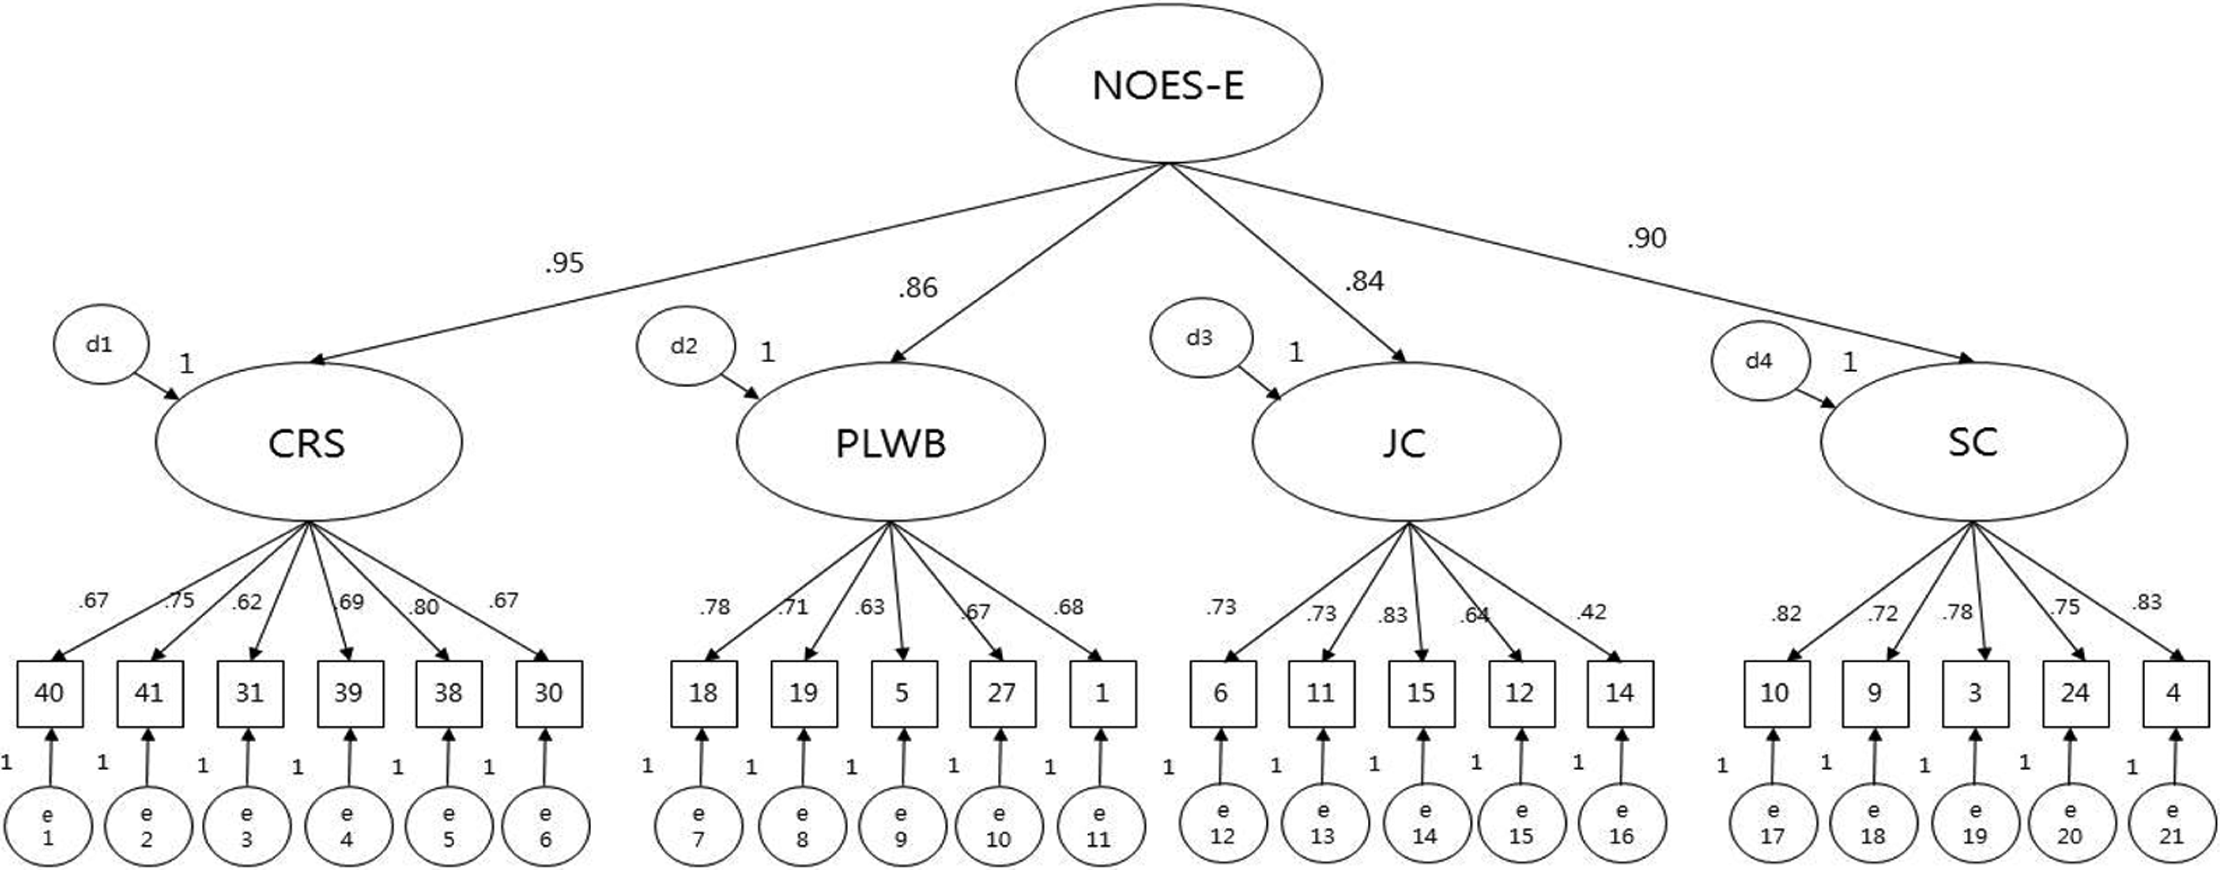
The second-order hierarchical model. The large circles designate the latent constructs, the rectangles with number indicate the measured variables for each number of NOES-E items, and the small circles are residual variance. Factor loadings are standardized (all ps < .001). NOES-E = Negative Outcome expectations Scale in Engineering; CRS = cultural related stressor; PLWB = personal life and work balance; JC = job characteristics; SC = social cost.
Construct Validity
We examined the correlations between total scores of the NOES-E and other conceptually relevant or discriminant scales. NOES-E total scores were negatively correlated with engineering satisfaction (r = −.31, p < .01), engineering environmental supports (r = −.32, p < .01), engineering-intended persistence (r = −.30, p < .01), engineering self-efficacy (r = −.30, p < .01), and engineering positive outcome expectations (r = −.30, p < .01) and positively correlated with engineering barriers (r = .40, p < .01). The results support the convergent validity for the NOES-E total scale scores by indicating that NOES-E scores do not measure the same construct as engineering-related measures of barriers, academic satisfaction, perceived supports, perceived barriers, persistence intentions, and positive outcome expectations. Additionally, NOES-E scores had nonsignificant correlation with future family considerations (r = .05), providing evidence of discriminant validity of the NOES-E scores (see Table 2). We tested group differences by race/ethnicity and gender, and results showed that there was not a significant group difference by race/ethnicity with our sample. However, there was a significant gender difference on NOES-E, F(2, 1184) = 7.70, p < .001, indicating that women and gender minority (e.g., transgender) engineering students reported higher negative outcome expectations than men engineering students.
Intercorrelations Between Total Scores of NOES-E and Validity Instruments.

Note. NOES-E = Negative Outcome Expectations Scale in Engineering; POES-E = Positive Outcome Expectations Scale in Engineering.
*p < .01.
Reliability Estimates
Cronbach’s α coefficient was .94 for the 21-item NOES-E, .86 for culture-related stressors, .82 for personal life and work balance, .80 for job characteristics, and .90 for social costs. These results indicate that NOES-E total and factor scores demonstrated good internal consistency reliability.
Discussion
Our aim was to develop and validate a multidimensional outcome expectancy measure to assess perceived negative outcomes to pursuing an engineering degree. The findings with an initial sample of engineering students resulted in a 21-item NOES-E that consists of four factors: cultural-related stressors (6 items), personal life and work balance (5 items), job characteristics (5 items), and social costs (5 items). This factor structure was validated with a second, larger sample collected from 11 different universities. The NOES-E total scale and factor scores demonstrated good internal consistency reliability across the two samples, and evidence of convergent and discriminant validity was provided. Specifically, convergent validity was supported when NOES-E scores demonstrated moderate correlations with engineering-related measures of self-efficacy, interests, intended persistence, satisfaction, positive outcome expectations, perceived supports, and perceived barriers. NOES-E scores were not related to ethnicity or a measure of future family considerations; however, women and transgender students anticipated higher negative outcome expectations in engineering than men.
The addition of a psychometrically sound negative outcome expectations measure in engineering can advance vocational psychology research and SCCT research in particular. Future research can explore the independent effects of both positive and negative outcome expectations on engineering-related interests, goals, and actions. We are aware of only two studies that have assessed positive and negative outcome expectations, and this research produced mixed findings. One indicated that both negative and positive outcome expectations added unique variance to the college-going intentions among a sample of middle school students whose parents did not attend college (Gibbons & Borders, 2010), and another reported that negative outcome expectations were inversely related to college GPA and academic self-efficacy for a sample of engineering students, but positive outcome expectations were not significantly related (Hackett et al., 1992). More research is needed to tease out the contributions of both positive and negative outcome expectations on academic and career outcomes in engineering. Researchers can also examine the effects of engineering learning experiences (i.e., performance accomplishments, vicarious learning, verbal persuasion, and emotional arousal) on the development of negative outcome expectations at the full scale or factor levels. Such findings can be used to inform the development or refinement of curriculum and training practices to promote positive outcome expectations and decrease negative outcome expectancies.
Two empirical studies have found differences in positive and negative outcome expectations across ethnic minorities (Gibbons & Borders, 2010) and gender (Hackett et al., 1992). Although our study found no differences in negative outcome expectations across racial groups, gender differences were found. Specifically, consistent with prior findings (Hackett et al.), women reported higher levels of negative expectations in engineering than men, likely driven by environmental barriers (i.e., few women in profession, discrimination, stereotype threat; Dasgupta, Scircle, & Hunsinger, 2015; Hill, Borbett, & St. Rose, 2010) and reports about negative experiences in the workplace that create an unwelcome climate for women (Fouad, Singh, Fitzpatrick, & Liu, 2012). More efforts are needed to change this climate in both educational settings and the workplace for women students and professionals in engineering. A fruitful direction of future study should examine the differences of positive and negative outcome expectations across different cultural groups including gender, ethnicity, and institutional types. The findings of these future studies can be utilized to develop the cultural responsive interventions or mentoring program to different cultural groups in engineering. Future research can examine the utility of the scale with engineers in the workplace by modifying the instructions and item stem, thus assessing the presence of these negative outcome expectations among employees. Studies with employed engineers can explore the generalizability of the four-factor structure of the NOES-E and, more importantly, investigate the relation of NOES-E scores to employee persistence and turnover.
The development of the NOES-E also has applications for practice and training. Career counselors and academic advisors can administer the NOES-E along with Lent and his colleagues’ (2003) positive outcome expectations scale to gather information related to students’ anticipations for receiving an engineering degree. This information can lead to discussion into the relative weight that a student attributes to each set of outcome expectations and provide insight into the role that each plays in the student’s persistence (or nonpersistence) decisions and actions in engineering. In particular, career counselors and academic advisors might explore the origins of the strongest negative outcome expectations in engineering held by students and address ways to buffer their effects if they do indeed experience it. For engineering educators, information about incoming cohorts’ outcome expectancies (both positive and negative) can help to identify areas in the curriculum that can be addressed by faculty, advanced students, and program alumni.
Prior research has found that ethnic minority studies reported higher negative outcome expectations for attending college than their White counterparts (Gibbons & Borders, 2010). Thus, exploring differences in negative outcome expectations across students from underrepresented groups in engineering (i.e., women, ethnic minorities) may inform retention practices in engineering and ways that these students can be supported in their engineering academic pursuits. For example, engineering faculty and staff may examine aspects in their learning environment that might contribute to negative expectations for all students, and particularly students from underrepresented groups, and when possible, find ways to counteract them or reduce them from the academic environment. Engineering educators can also serve as advocates for students by addressing these negative outcome expectancies with others in the industry and encouraging them to examine how workplace policies and practices may perpetuate these negative expectancies among engineering students.
This study has some limitations that should be considered. First, because this study was an outgrowth of two larger projects, our sample consisted of mostly Latino/a and White engineering students. Future research should broaden the sample to explore negative expectations among engineering students representing other racial/ethnic backgrounds. The stability of the factor structure across a diverse sample is recommended, and with engineering students from underrepresented groups (i.e., first-generation college students, students of color, women). Another limitation is that we only assessed internal consistency reliability. Future research should assess the temporal stability of NOES-E scores with other samples.
To summarize, the current study introduced the NOES-E, a negative outcome expectations measure that is specific to engineering, and provided initial support for the internal consistency, content validity, factorial validity, and convergent and discriminant validity of the scale scores. Despite the limitations that we identified, the NOES-E can be a useful instrument for studying a broader set of expectancies among engineering students and may provide stronger explanatory power of the SCCT model (or of the effect of outcome expectations on interests, goals, and actions) and can add important information in career counseling settings when used in conjunction with a positive outcome expectations scale.
Footnotes
Authors’ Note
Hang-Shim Lee is now at Konkuk University.
Declaration of Conflicting Interests
The author(s) declared no potential conflicts of interest with respect to the research, authorship, and/or publication of this article.
Funding
The author(s) disclosed receipt of the following financial support for the research, authorship, and/or publication of this article: This article was based on work supported by the National Science Foundation under Grant HRD-1036713 and NSF’s EHR Core Research Grant 1430614/1430640.