
Abstract
The 127-item Science, Technology, Engineering, Mathematics (STEM) Interest Complexity Inventory and 15-item General STEM Interests Scale, each of which were previously developed to assess interests toward increasingly complex tasks, were shortened to 37-item and 12-item measures. Item response theory analyses employed on the data of 930 students in STEM majors indicated items with higher discrimination parameters and equivalent functioning across genders. The short form (SF) supported a four-factor structure of interests toward interacting with numerical data, symbolic data, spatial data, and STEM-related ideas. Concurrent criterion–related validation was supported with relevant vocational fit criteria. Hierarchical regression analysis revealed that STEM interest complexity added incremental variance over achievement motivation and test anxiety in predicting fit. Measurement invariance was demonstrated across samples from Turkey and the United States. The STEM Interest Complexity Inventory SF is a valid measure of vocational interests for research at the college level. Validities with high school and working samples are yet to be demonstrated.
Keywords
Vocational interest assessment is an area that is continually improving. Researchers are introducing new models (e.g., Armstrong & Rounds, 2010; Toker & Ackerman, 2012; Tracey, 2002) and are working on improving existing assessment methods through psychometric theory (e.g., Einarsdottir & Rounds, 2009; Tay, Drasgow, Rounds, & Williams, 2009) to enhance prediction and reduce measurement bias. Our aim with the present study was to contribute to this growing body of literature by introducing a practically useful version of a vocational interest assessment that was developed by taking account of differing levels of occupational complexity, pertaining to investigative and realistic work environments (Holland, 1997). The measure was developed and initially validated as a 127-item instrument (Toker & Ackerman, 2012). In the present study, item response theory (IRT) was applied to obtain a shorter and valid instrument that could be easily utilized in research and application.
The Science, Technology, Engineering, Mathematics (STEM) Interest Complexity Inventory was developed to fill a gap in the literature that has to do with assessing interests toward work that differ in their complexity levels. STEM occupations differ in their level of task complexity and are included in the realistic and investigative work environments together with very low-complexity occupations in the current vocational assessment inventories. Thus, identifying an individual’s direction of vocational interest does not tell us anything about potential fit for occupational work with varying levels of complexity.
The development of the STEM Interest Complexity Inventory is described in Toker and Ackerman (2012) in detail. Items were formed based on occupational databases including the occupational aptitudes map (Gottfredson, 1986), the Dictionary of Occupational Titles (DOT; U.S. Department of Labor, 1991), and the Occupational Information Network (O*NET, 2007). Four content factors of numeric, symbolic, and spatial interests and interests toward STEM-related ideas were formed as such content was shared across relevant occupations. Data complexity levels, as described in the DOT, were used to identify low-, moderate-, and high-complexity level items. Accordingly, within realistic and investigative environments, low-complexity occupations (e.g., machine operator) included work tasks to do with “copying,” “comparing,” and “computing”; moderate-complexity occupations (e.g., quality-control technician) included work tasks to do with “compiling data” and “analyzing”; and high-complexity occupations (e.g., engineering) included tasks to do with “synthesizing” and “generating new ideas or products.” Scale validation included two consecutive studies with students at a technical college in the Southeast region of the United States (total N = 691, Toker & Ackerman, 2012). Construct validity was shown based on converging associations with the relevant Holland interests, self-concept variables, and cognitive abilities. Factorial structure was supported with bifactor confirmatory factor analysis (CFA), modeling both the general factor and four content factors and another CFA model in which each indicator scale (e.g., numeric moderate-complexity interests) loaded on its respective content and complexity factors. Criterion-related validity was shown with positive moderate associations with vocational fit criteria, ranging from .31 to .39 and based on incremental variance over traditional interest assessments.
A shorter version of the inventory was in order for practical use of it. With large samples, IRT offers a psychometrically sound method to refine a scale through identifying items that do not discriminate well enough between latent trait levels and items that function differentially across groups. Differential item functioning (DIF) across genders have been shown to exist in some interest inventories that are currently in use (e.g., Einarsdottir & Rounds, 2009). Since men and women have consistent mean differences across STEM-related vocational interests (Inda, Rodriguez, & Peňa, 2013; Su, Rounds, & Armstrong, 2009), it is imperative that we have an instrument without measurement bias across genders.
IRT and DIF Use in Scale Refinement
Researchers have utilized IRT techniques to produce shorter versions of measures (e.g., Betancourt, Yang, Bolton, & Normand, 2014; Gültas, 2014; Hays, Morales, & Reise, 2000). Scale refinement based on retaining items according to their discrimination parameters does not necessarily increase the validity of the measure nevertheless; a shorter scale can be produced by preserving validities (e.g., Gültas, 2014).
In the present study, a two-parameter graded response model (GRM; Samejima, 1997) is used to identify discrimination parameters. Higher discrimination indicates that the item can better differentiate across the trait range. DIF was applied using the R lordif package version 0.3-3 (Choi, Gibbons, & Crane, 2011) based on GRM within the R statistical environment (R Core Team, 2016). The package employs ordinal logistic regressions for polytomous items (Miller & Spray, 1993; Zumbo, 1999). DIF detection is based on model comparisons. In identifying the ordinal logistic regression probabilities of responding to a scale point, Model 1 includes trait estimates as the predictor. A grouping variable (gender in this case) is added to the predictors of the regression equation in Model 2, and whether or not there is a difference across groups along the trait continuum (in this case STEM interests) is evaluated. For each item of the scale, a statistically significant χ2 difference between Model 2 and Model 1 at the .01 level indicates probable differential functioning. In other words, even though men and women have the same true trait levels, their estimated trait scores appear different. In Model 3, an interaction, that is the product of the trait estimate and grouping variable, is added. A significant χ2 difference between Model 3 and Model 2 indicates that the direction of the difference observed between groups changes as the trait estimates change.
Validation of the STEM Interest Complexity Inventory Short Form (SF)
Once the SF of the Inventory was produced, construct validation was studied based on factor analyses. Criterion-related validation was studied concurrently with variables typically employed in the validation of interest inventories such as vocational area satisfaction, persistence intentions, and performance. In addition, motivational variables other than vocational interests were included in the test of validation in order to see the additional contribution of vocational interests as individual differences in different domains have been shown to jointly contribute to vocational outcomes (e.g., Ackerman, 1997; Kanfer, Wolf, Kantrowitz, & Ackerman, 2010; Lubinski, 2000). The personality variable of achievement motivation and the affective state of test anxiety are motivational variables that have been repeatedly shown to be related to academic and career success (e.g., James, 1998; Kanfer et al., 2010). Accordingly, the study hypotheses were as follows:
Method
Sample and Procedure
The study was announced on bulletin boards of five university campuses in Ankara and Istanbul, Turkey. In identifying the universities for data collection, those that have numerous STEM departments and were easily accessible by the researchers were given priority. In addition, attention was paid to the University Entrance Examination minimum scores necessary to be admitted into these universities, such that the minimum scores would span a wide range. Approvals of the institutional review boards of the universities were obtained prior to data collection.
Participants responded to questionnaires through the most up to date version of Qualtrics in 2015, which included demographic information questions, scales of interest complexity, achievement motivation, test anxiety, academic domain satisfaction, and intentions to persist in STEM. Participants provided written permission that allowed the researchers to reach their course grades over the online database of the University Registrar. Upon completion of the study, participants were reimbursed either with extra course credit or with monetary compensation.
Undergraduate students enrolled in STEM departments formed the sample. Data from the online survey system showed that participants had responded to the informed consent 2,484 times either accepting or declining participation. Of that sum, 1,319 completed the survey fully or partially. Raw data of the remaining participants were examined carefully, and responses that did not meet predetermined criteria were removed. For a participant’s data to be included in any further analysis, she or he must have responded to 70% or more of the survey questions (to ensure that all sections of the focal STEM Interest Complexity Measure Scales were answered), must not have completed the survey in less than 10 min, must have correctly answered at least three of the six control questions (e.g., answer this question as 4 = is somewhat true of me), and should not have consistently selected the same values in a Likert-type question sequence that also contains several reverse-coded items (i.e., answering 20 or more questions as 5 = is very true of me). In addition, the responses of participants who completed the survey twice or more were removed from the data set.
Data of 930 students remained for IRT analyses. Of this final total, 595 (64%) were men, and 335 (36%) were women. The ratio of women in the data set was higher than the percentage of women (i.e., 28%) reported to be enrolled in engineering departments according to the 2005 statistics of the Higher Education Council (HEC) of Turkey (Smith & Dengiz, 2009). The representation of men in engineering departments was higher compared to women, and the representation of women in science departments was higher compared to men.
Of the participating students, 638 (68.6%) of them were enrolled in a public technical university in Ankara, 224 (24.1%) of them were enrolled in a private university in Istanbul, 43 (4.6%) of them were enrolled in another public university in Ankara, and 25 (2.7%) of them were enrolled in two other private universities in Ankara. In terms of duration of education, 168 (18.1%) were freshman, 276 (29.7%) were sophomore, 210 (22.6%) were junior, 176 (18.9%) were senior, 62 (6.7%) of them were in their fifth year, and 28 (2.8%) of them were in their sixth or higher years of education. CGPA of STEM courses were calculated for 311 participants.
Measures
Demographic information form
Participants responded to questions related to their gender, department, scores on a nationwide quantitative reasoning test, and CGPA. In addition, to be able to calculate CGPA of STEM-related courses, participants’ consent to reach their transcripts from the registrar’s online system was taken. Academic transcripts were obtained only from the technical university students in Ankara; thus, grade conversion across universities was not an issue.
STEM Interest Complexity Inventory
The measure was developed (Toker, 2010; Toker & Ackerman, 2012) based on activities relating to occupations with varying levels of complexity under Holland’s (1997) realistic and investigative work environments. Items were designed to assess interests toward work activities in STEM occupations that necessitate interacting with numerical (25 items), symbolic (30 items), and spatial data (22 items) and with STEM-related ideas (30 items). The inventory has 127 items. In each one of the subscales, there are items assessing low-, medium-, and high-level complexity in its respective domain. Additionally, a general STEM Interest Complexity Scale with 15 items was used, which in order of increased complexity measures (1) getting the general idea, without going into technical jargon or detail; (2) acquiring specialized knowledge, without learning about the empirical studies that form the basis for the knowledge; (3) following the empirical literature; (4) critically evaluating the empirical literature; and (5) formulating ideas to investigate. Items were rated on a 6-point Likert-type scale ranging from 1 = not at all true of me to 6 = very true of me. Reliability and validity evidence with U.S. college students are presented in Toker and Ackerman (2012). Internal consistency reliabilities ranged from .93 to .97. Translation of the measure to Turkish was undertaken by the developer of the scale who is a bilingual in Turkish and English and an industrial/organizational psychologist. Back-translation was undertaken by another bilingual with a degree in business administration. The two translators compared the original English items with back-translated items for conceptual equivalence. Necessary revisions were undertaken to maintain conceptual equivalence of the Turkish form.
International Personality Item Pool (IPIP) Achievement Motivation Scale
The scale, a conscientiousness facet in the IPIP (Goldberg et al., 2006), has 10 items, rated on a 6-point scale ranging from 1 = not at all true of me to 6 = very true of me. Reliability and validity information are provided by Goldberg et al. (2006). Translation to Turkish, back-translation, and evaluation of the translation were undertaken by the bilingual individuals.
Test Anxiety Inventory
The scale includes 20 items from Mandler and Sarason’s (1952) original inventory translated and adapted to Turkish by Öner (1990). Cronbach’s α coefficient was reported to be .89. In its validity study, correlations as high as .43 were reported between the inventory and mathematics grades and also CGPA. Items were rated on a 4-point Likert-type scale ranging from 1 = almost never to 4 = almost always.
STEM persistence intentions
The scale, developed by Toker (Toker, 2010; Toker & Ackerman, 2012), measures intentions to obtain an STEM bachelor’s degree and to pursue a graduate education and career in an STEM field. Ten items are rated on a 6-point scale ranging from 1 = not at all true of me to 6 = very true of me. Internal consistency reliabilities of the three dimensions ranged from .79 to .88. Construct validity was demonstrated with STEM interest complexity, realistic and investigative interests, self-concept in mathematics and sciences, and STEM-course CGPA, with correlations ranging from .20 to .34 (Toker, 2010).
Academic Domain Satisfaction Scale
This Likert-type scale, developed by Lent et al. (2005), measures the level of satisfaction students get from the experiences in their departments and area of specialization (i.e., classes they are enrolled in, the level of intellectual stimulation). Lent et al. reported an internal consistency reliability of .86 and showed moderate-to-high associations with engineering self-efficacy, self-efficacy in overcoming obstacles in an engineering major, and outcome expectancy in engineering.
Vertical career intentions measure
Developed by Toker (Toker, 2010; Toker & Ackerman, 2012), the measure lists three of the most complex STEM clusters based on the ordering of occupations from highly complex ones to less complex ones (Gottfredson, 1986). The highest complexity cluster includes engineering occupations, the moderate-to-high complexity cluster includes occupations such as that of a quality-control technician, and the low-to-moderate complexity cluster includes occupations such as that of a machine operator. In each of the clusters presented to participants, names of occupations were listed along with the required tasks, activities, skills, and abilities. Participants were asked whether they would want to work in one of the jobs listed in the presented clusters. They were instructed to assume that these occupational clusters were equivalent in terms of status and pay. In order to check whether or not participants perceived the clusters to indeed vary in their level of complexity, they were asked the question “in your opinion, how cognitively demanding are the tasks involved in the occupations of this cluster?” to be rated on a 6-point Likert-type scale ranging from 1 = not cognitively demanding at all to 6 = very cognitively demanding. It was previously observed that perceptions of the level of cognitive demand required by the clusters increased as the complexity of the occupational clusters increased (Toker & Ackerman, 2012). The same results were observed in the current data set.
Results
IRT analyses were performed with the two-parameter GRM using EQSIRT. Unidimensional models provide more reliable parameter estimates (e.g., Edelen & Reeve, 2007; Embretson & Reise, 2000), and we wanted to show that we satisfy the basic unidimensionality assumption. Before conducting the unidimensional IRT analyses, each content area was analyzed for its factor structure to see if the data would yield a multifactor structure based on complexity levels. The numeric, symbolic, spatial, and the general interest scales each had one eigenvalue surpassing 1 based on the calculation of principal axis eigenvalues. Parallel analysis supported that one factor clearly surpassed random data generated eigenvalues. Only the STEM-Ideas Scale yielded a two-factor structure; however, the factors did not lend themselves well to a distinction based on complexity levels. Moreover, the first factor explained a much greater portion of variance in the data, with eigenvalues of 13.8 and 1.5, respectively. Thus, in the following IRT analyses, all three-complexity level items were included together under each content factor in order to identify which complexity level had better discrimination parameters.
One noteworthy finding was that the discrimination parameters and factor loadings of the reverse-coded items were much lower than those of nonreverse-coded items. Discrimination parameters ranged from .26 to .98 for the reverse-coded items (median = 0.81) and they ranged from .48 to 3.27 (median = 2.02) for the nonreverse-coded items. Factor loadings ranged from .15 to .50 for the reverse-coded items (median = 0.43), whereas they ranged from .27 to .90 for the nonreverse-coded items (median = 0.72). Mean, median, and ranges for the discrimination parameters and factor loadings are presented in Table 1 based on content and complexity factors. Reverse-coded items were not included in the calculation of these descriptive statistics; they are presented separately. Reverse-coded items were eliminated from the measure.
Item Discrimination and Threshold Parameters and Factor Loadings Based on Content/Complexity Scales.

Note. Low = low-complexity scale; moderate = moderate-complexity scale; high = high-complexity scale.
aDescriptive statistics for the reverse-coded items are given separately and are not included in the low-, moderate-, and high-complexity categories.
All low-complexity items, with the exception of one STEM-ideas factor item, have relatively lower discrimination parameters (ranging from .48 to 2.02) and lower factor loadings (ranging from .27 to .76). Discrimination parameters are observed to increase as the complexity level of factors increases; means of the discrimination parameter medians for the low-complexity factors were 1.22, for the moderate-complexity factors, it was 2.15, and for the high-complexity factors, it was 2.43.
Item discrimination parameters and factor loadings were taken into consideration while determining which items would be retained in the SF of the STEM Interest Complexity measure. Most items had discrimination parameters higher than 2.00 as determined with the logistic metric. Most items had factor loadings higher than .80. To come up with a shorter version of the measure, cutoff values of 2.00 and .80 for discrimination and factor loadings, respectively, were set. Following these criteria, all low-complexity items were dropped from the measure, except for one STEM-ideas factor item (i.e., “I enjoy comparing and contrasting two perspectives on a topic related to STEM areas”). Several moderate- and high-complexity items were also dropped. In addition, dropping items that displayed DIF across men and women were considered.
For each of the scales, DIF was tested using the R lordif package (Choi et al., 2011). According to model comparison χ2 difference tests, only 1 item (of 25) in the numerical interests scale, 14 items (of 30) in the symbolic interests scale, 7 items (of 22) in the spatial interests scale, 3 items (of 30) in the STEM-Ideas Scale, and finally, 2 items (of 15) in the general STEM interests scale were found to display DIF across genders. Effect sizes of model comparison results were also considered (see Choi et al., 2011) while taking out items from the measure since the probability of committing Type 1 error increases when performing χ2 tests with large samples. For instance, 3 items with statistically significant DIF were retained, as adding the gender grouping variable to the model over the interest complexity trait estimate did not explain even over 1% additional variance. The symbolic high complexity item “I enjoy thinking in terms of abstractions and formulas while trying to develop new ideas” had a significant χ2 difference when Model 2 was compared with Model 1. Nevertheless, the effect sizes of the difference in terms of ▵R2 and ▵β were below .01. Such items were retained also because gender did not interact with interest complexity trait estimates and because the discrimination parameters and factor loadings were above the criteria.
Items with significant interaction effects, indicating that different trait estimates are required across men and women for choosing a given response category, were dropped (e.g., “I would enjoy thinking about how several three-dimensional systems could be combined in the most optimal way for a better working system”). In this example, the item function changes across trait levels as indicated with a significant difference between Model 2 and Model 3, P(
As a result of IRT and DIF analyses, 6 items (3 moderate and 3 high complexity) were retained in the numerical scale, 13 items (10 moderate and 3 high complexity) were retained in the symbolic scale, 7 items (3 moderate and 4 high complexity) were retained in the spatial scale, 11 items (1 low-later categorized as moderate, 3 moderate, and 7 high complexity) were retained in the STEM-Ideas Scale, and finally 12 items (8 moderate and 4 high complexity) were retained in the general STEM interests scale. All further analyses were based on this shortened form.
SF Construct Validation
We subjected the 37 items to a four-factor CFA using EQS6.2, by freely correlating the latent factors of numerical interests, symbolic interests, spatial interests, and ideas. Robust statistics (Satorra & Bentler, 1988) were evaluated as the data had multivariate kurtosis (Mardia’s Z = 188). With the addition of five correlated errors on symbolic items, the four-factor model fits the data well, S-Bχ2(618) = 1,784.63, p < .001, confirmatory fit index (CFI) = .94, root mean square error of approximation (RMSEA) = .045, 95% confidence interval (CI) = [.043, .047], ρ = .97. Average off-diagonal standardized residuals were small (.04), and 91% of residuals were distributed normally between −0.1 and +0.1. Factor loadings ranged from .77 to .86 on numeric interests, from .74 to .81 on symbolic interests, from .78 to .89 on spatial interests, and from .70 to .78 on the STEM-ideas factor. Items and their loadings are presented in Table 2. Thus, Hypothesis 1 pertaining to the four-factor construct validity of the SF found support. CFA factor loadings of the 12-item General STEM Interests Scale for the moderate- and high-complexity items (see Table 3) ranged from .73 to .83, S-Bχ2(52) = 320.27, p < .001 CFI = .95, RMSEA = .075, 95% CI [.067, .082], ρ = .97. A separate analysis including the two low-complexity items yielded loadings of .48 and .59. Internal consistency reliabilities were .96 (6 items) for numeric interests, .96 (13 items) for symbolic interests, .93 (7 items) for spatial interests, .93 (11 items) for STEM ideas, and .95 (12 items) for general STEM interests. Reliabilities ranged from .82 to .93 for the scales formed based on their complexity levels.
STEM Interest Complexity Inventory Short Form Items and CFA Factor Loadings.
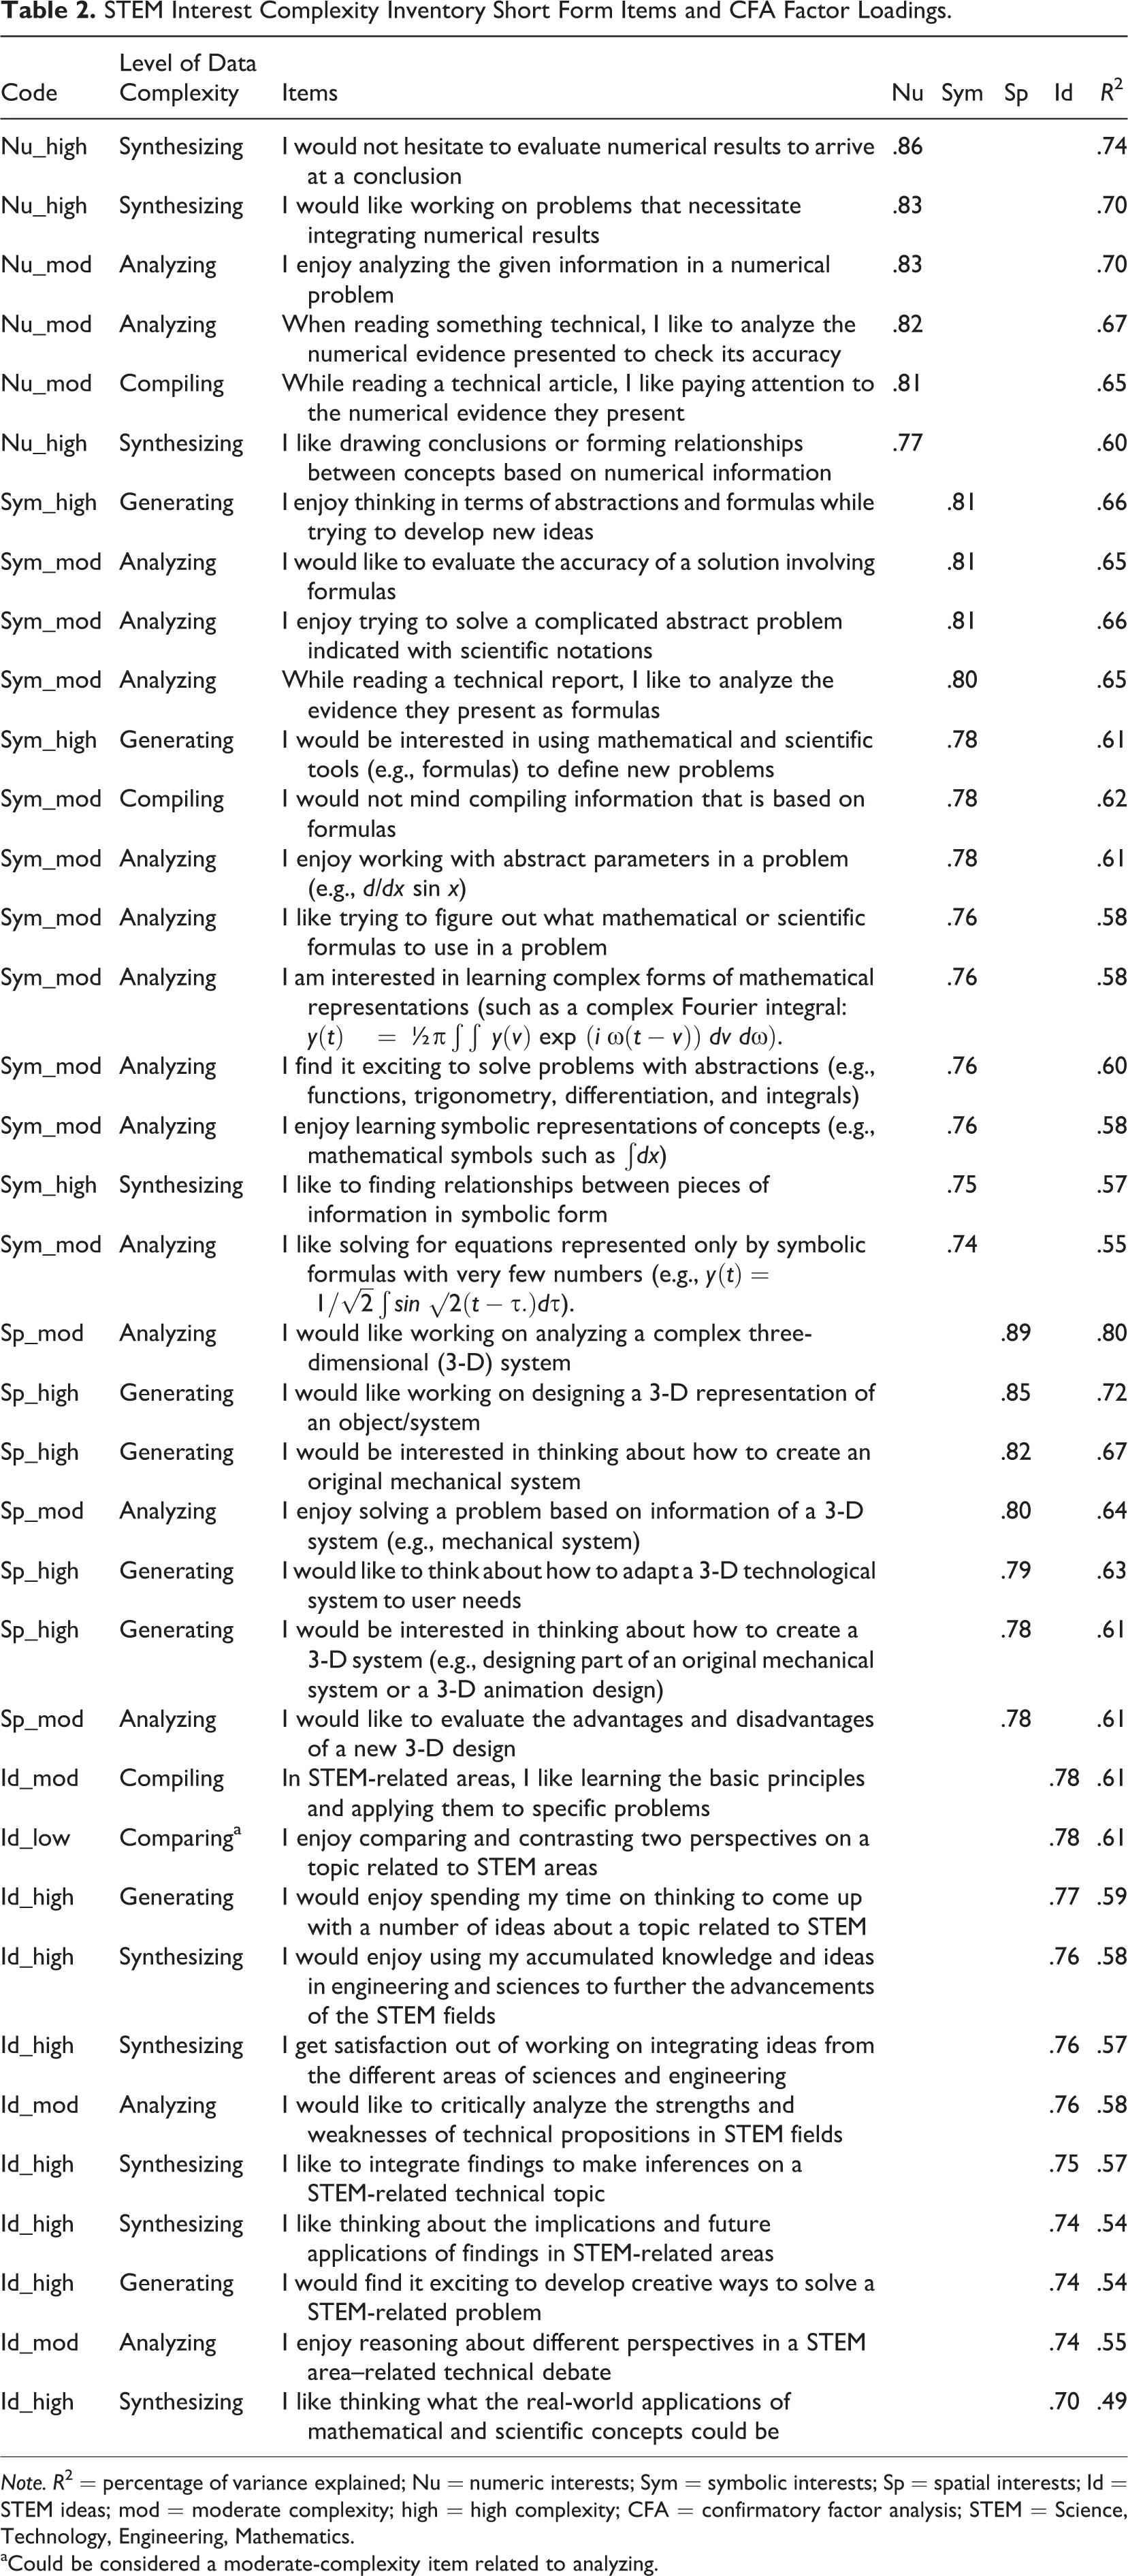
Note. R2 = percentage of variance explained; Nu = numeric interests; Sym = symbolic interests; Sp = spatial interests; Id = STEM ideas; mod = moderate complexity; high = high complexity; CFA = confirmatory factor analysis; STEM = Science, Technology, Engineering, Mathematics.
aCould be considered a moderate-complexity item related to analyzing.
STEM Interest Complexity Inventory—General Interests Scale Items and CFA Factor Loadings.

Note. R2 = percentage of variance explained; Gen = general STEM interests scale; low = low complexity; mod = moderate complexity; high = high complexity; CFA = confirmatory factor analysis; STEM = Science, Technology, Engineering, Mathematics; 1 = getting the general idea without going into technical jargon or detail; 2 = acquiring specialized knowledge without learning about the empirical studies that form the basis for the knowledge; 3 = following the empirical literature; 4 = critically evaluating the empirical literature; 5 = formulating ideas to investigate.
A bifactor CFA model (e.g., Chen, West, & Sousa, 2006; Reise, Morizot, & Hays, 2007) was also tested in order to support that the eight content-complexity variables would be represented both by a global factor in addition to the four content factors. Here, item parceling was used to form two indicators for each content factor: a composite of the moderate-complexity items and another composite of the high-complexity items. Four latent content factors and one latent global factor were modeled in which each manifest indicator (e.g., numerical moderate complexity) loaded on its respective content factor and also the global factor. The bifactor model was built as described by Toker and Ackerman (2012, p. 538) for testing the long version of the scale. Accordingly, the model had uncorrelated content factors and uncorrelated errors. Robust statistics were evaluated as the data had multivariate kurtosis (Mardia’s Z = 49.2). The bifactor model fits the data very well, S-Bχ2(12) = 11.41, p = .494, CFI = 1.00, RMSEA = .000, 95% CI [.00, .03], ρ = .98. All loadings were significant. The numeric and symbolic scales loaded more heavily on the global factor (from .84 to .90) than their respective content factors (from .20 to .50). Spatial interests loaded slightly higher on the global factor (.66 for moderate complexity and .84 for high complexity) than the content factor (.62 and .60, respectively). The ideas scales loaded equivalently on the global and content factors (from .63 to .68). Such a pattern of loadings on the global and content factors was consistent with the scale’s long version studied in the United States (Toker & Ackerman, 2012).
SF Concurrent Criterion-Related Validation
The criterion-related validity of the STEM Interest Complexity Inventory SF was studied concurrently based on associations with vocational fit criteria including STEM academic major satisfaction; intentions to pursue an STEM bachelor’s degree, graduate degree, and career; and intentions to work in an STEM occupational group characterized by high levels of complexity and also CGPA calculated based on STEM courses. Descriptive statistics of STEM content scales, vocational criteria, achievement motivation, and test anxiety are presented in Table 4. It was observed that the moderate- and high-complexity scales did not differ in their magnitude of associations with the relevant criteria; thus, the results are given for the content domains (e.g., numeric) each of which is a composite of moderate- and high-complexity items. The general STEM interests scale is presented based on its low-, moderate-, and high-complexity scales as they display somewhat differential descriptive statistics and associations.
Descriptive Statistics of Study Variables.
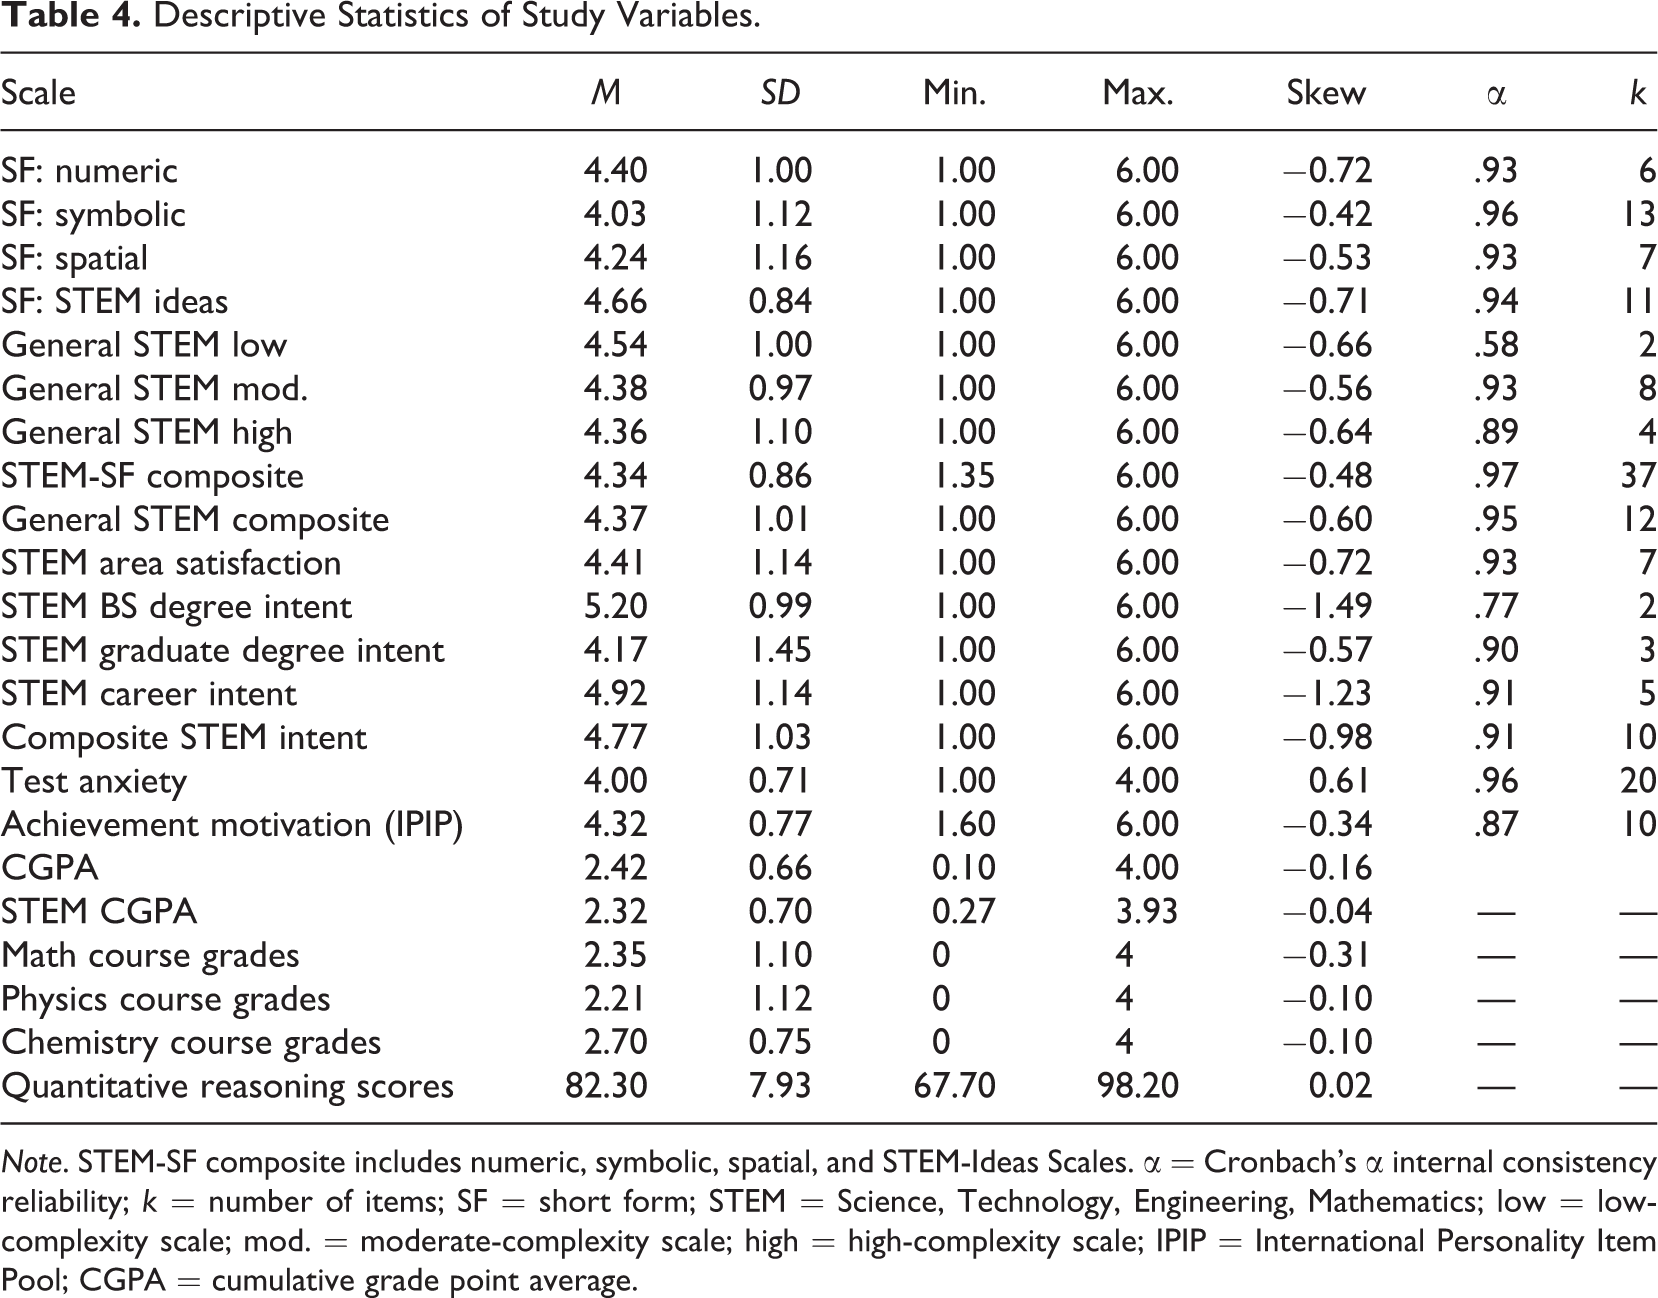
Note. STEM-SF composite includes numeric, symbolic, spatial, and STEM-Ideas Scales. α = Cronbach’s α internal consistency reliability; k = number of items; SF = short form; STEM = Science, Technology, Engineering, Mathematics; low = low-complexity scale; mod. = moderate-complexity scale; high = high-complexity scale; IPIP = International Personality Item Pool; CGPA = cumulative grade point average.
Correlations between STEM interest complexity scales and vocational fit criteria are presented in Table 5, together with correlations among vocational criteria. Statistically significant correlations that ranged from .19 to .50, mostly in the moderate range, are observed between the SF scales and vocational fit criteria. Lowest of the associations are observed with the spatial interests scales (r range = .19 and .29). Highest of them were observed with the STEM ideas and general STEM interests scales (r range = .27 and .50). Numerical and symbolic interest scales displayed moderate correlations as expected (r range = .22 and .34). A composite score based on all four content factors yielded correlations with vocational fit criteria that ranged from .30 to .41. Associations for the composite score based on the moderate- and high-complexity general STEM interests scales ranged from .29 to .51. A noteworthy finding was that the composite interest scale correlations were moderate (r = .30) for the dichotomously scored intentions toward working in a high-complexity STEM occupation, small (r = .16) for intentions toward working in a moderately complex STEM occupation, and negligible (r = .05) for intentions toward working in an STEM occupation with lower levels of complexity. Hypothesis 2 pertaining to observing moderate associations between interest complexity scales and fit criteria received support.
STEM Interest Complexity Inventory—Short Form Correlations With Vocational Fit Criteria.
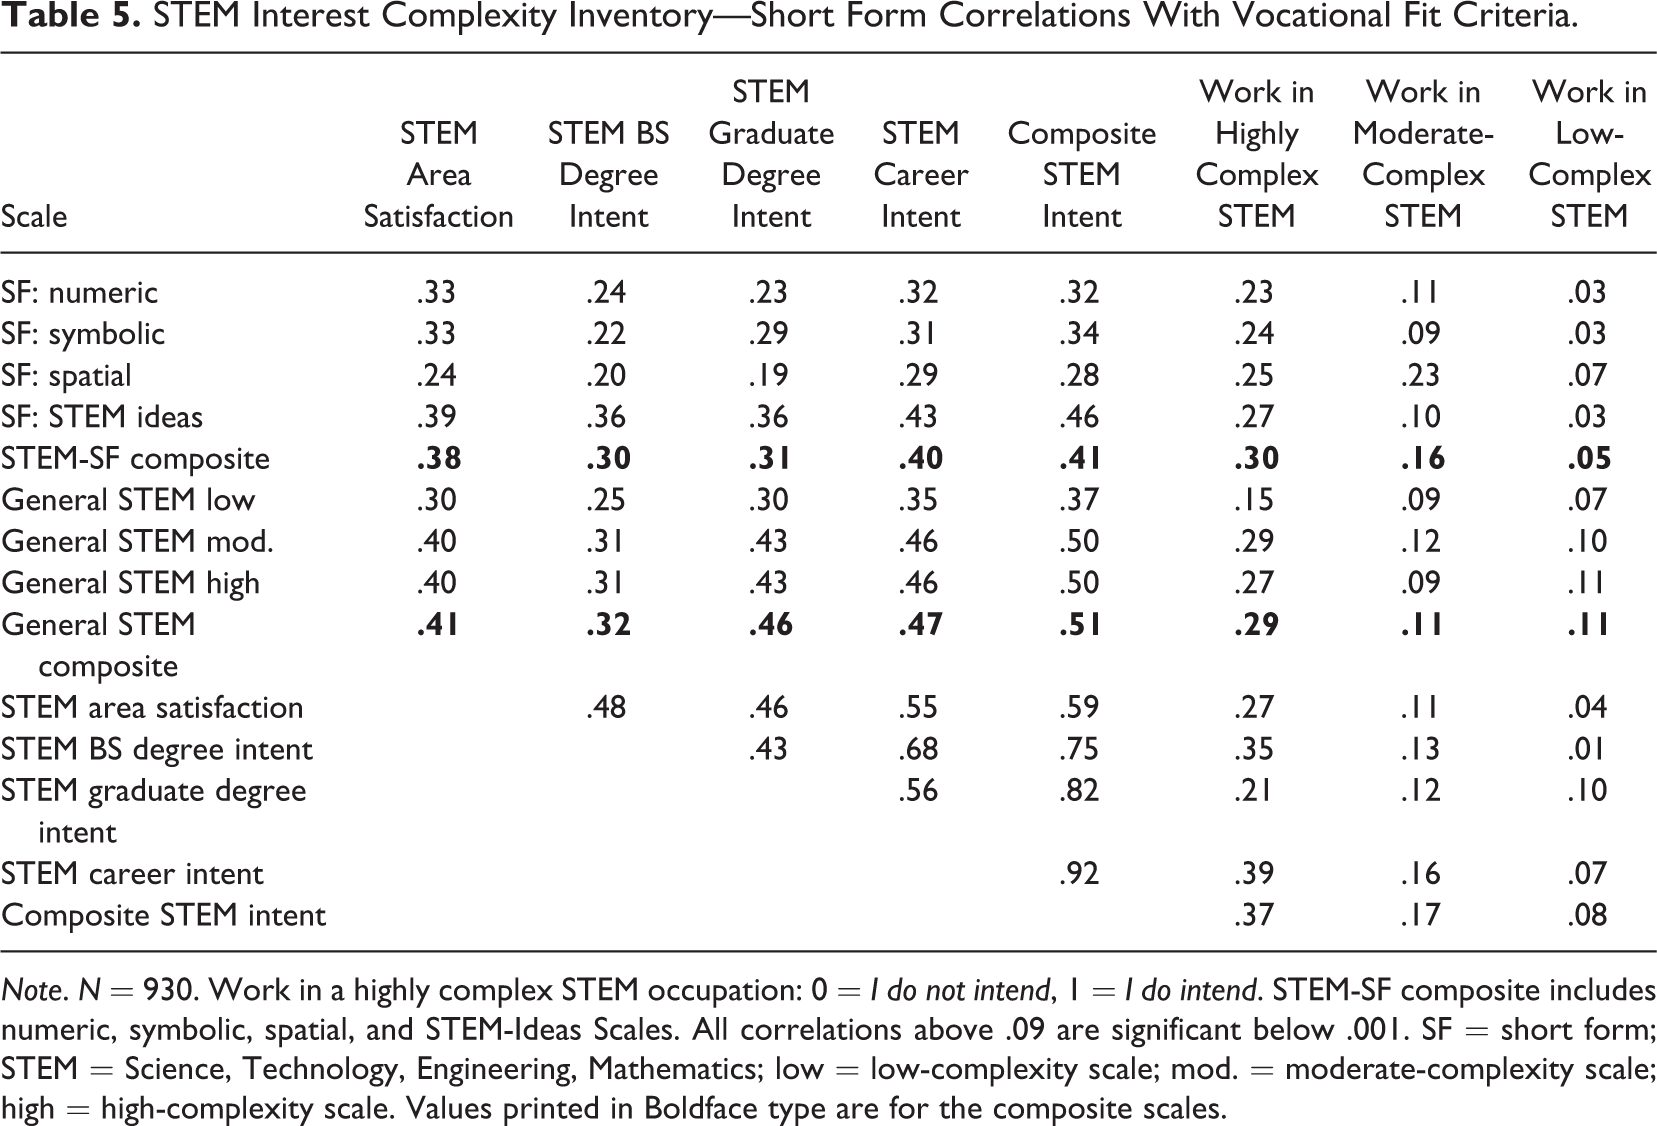
Note. N = 930. Work in a highly complex STEM occupation: 0 = I do not intend, 1 = I do intend. STEM-SF composite includes numeric, symbolic, spatial, and STEM-Ideas Scales. All correlations above .09 are significant below .001. SF = short form; STEM = Science, Technology, Engineering, Mathematics; low = low-complexity scale; mod. = moderate-complexity scale; high = high-complexity scale. Values printed in Boldface type are for the composite scales.
STEM Interest Complexity Scales were also found to have statistically significant associations with STEM academic success criteria (see Table 6). Correlations with STEM CGPA ranged from .15 to .18, except for spatial interests. Relatively higher significant correlations were observed with mathematics course grades that ranged from .25 and .34. Significant correlations with physics and chemistry course grades ranged from .15 to .21. A smaller sample (N = 63) reported scores on a nationwide quantitative reasoning test, which yielded correlations from .23 to .31 with the interest complexity scales. Associations with such STEM academic success criteria also supported Hypothesis 2.
STEM Interest Complexity Inventory—Short Form Correlations With Academic Success Criteria.
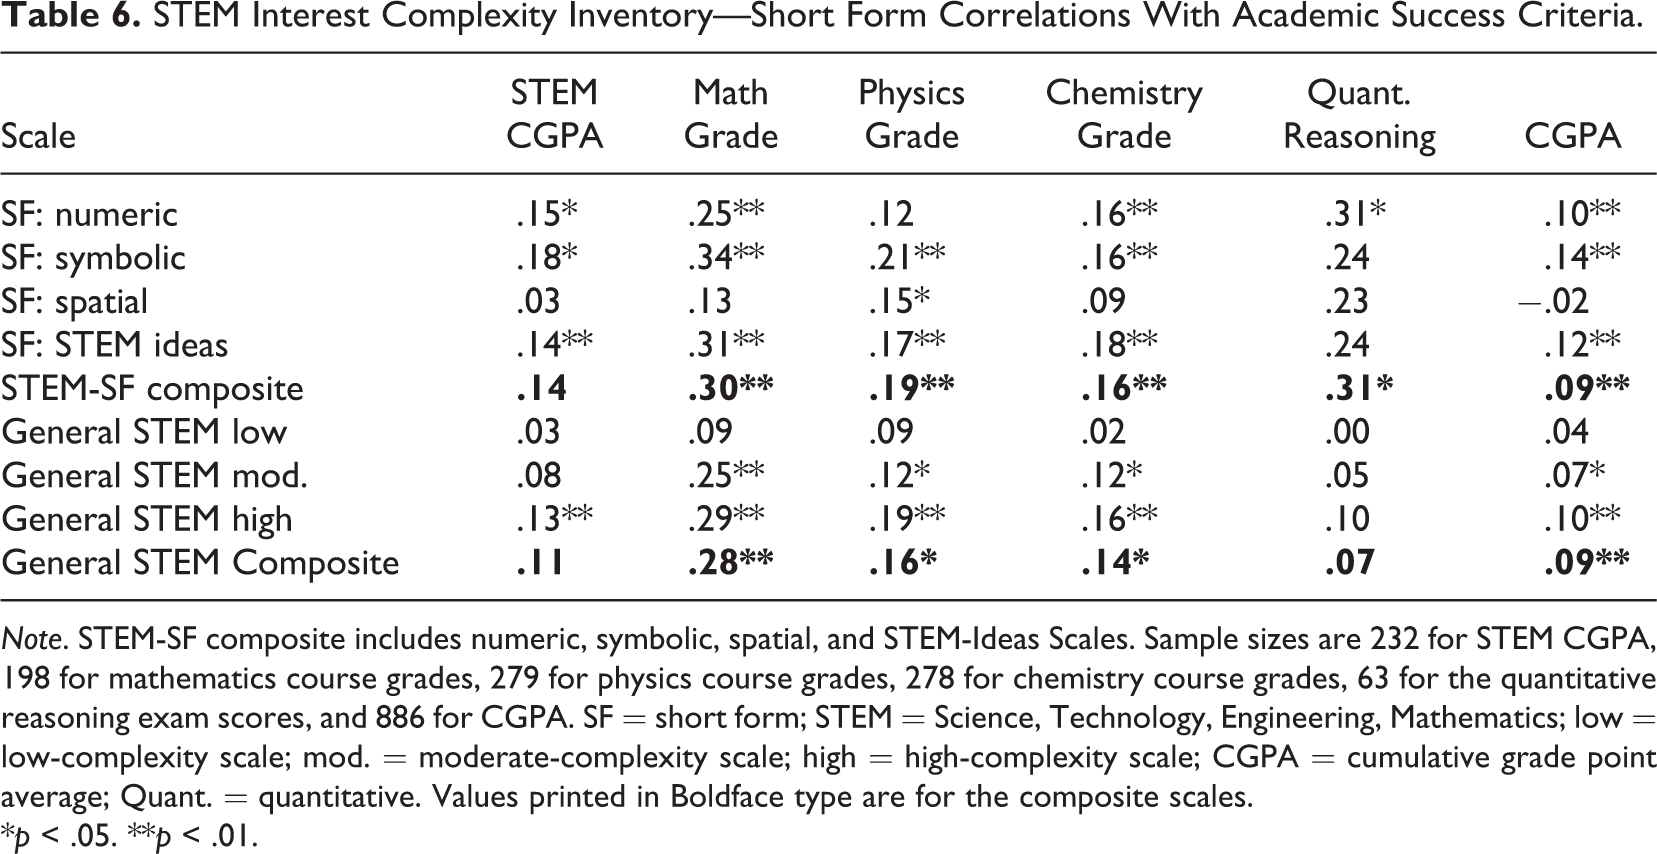
Note. STEM-SF composite includes numeric, symbolic, spatial, and STEM-Ideas Scales. Sample sizes are 232 for STEM CGPA, 198 for mathematics course grades, 279 for physics course grades, 278 for chemistry course grades, 63 for the quantitative reasoning exam scores, and 886 for CGPA. SF = short form; STEM = Science, Technology, Engineering, Mathematics; low = low-complexity scale; mod. = moderate-complexity scale; high = high-complexity scale; CGPA = cumulative grade point average; Quant. = quantitative. Values printed in Boldface type are for the composite scales.
*p < .05. **p < .01.
To test Hypothesis 3 that STEM interest complexity would predict attitudinal vocational outcomes about further pursuing STEM areas, over the personality variable relating to achievement motivation, a series of hierarchical regression analyses were performed. The SF composite score of the four content domains was used for interest complexity. According to regression results, achievement motivation was a significant predictor of STEM area satisfaction (β = .40, p < .001), of composite intentions to further pursue STEM areas (β = .34, p < .001), and of intentions to choose a highly complex STEM occupation (β = .13, p < .001). STEM interest complexity added significant incremental variance from 5% to 9% and offered moderate effect sizes in the prediction of intentions to further pursue STEM areas (β = .33, p < .001), of intentions to choose a highly complex STEM occupation (β = .28, p < .001), and of STEM area satisfaction (β = .25, p < .001). Hypothesis 3 found support.
To test Hypothesis 4 that expected that STEM interest complexity would still be an important predictor of STEM CGPA, and math and physics grades, in the presence of achievement motivation and an affective state variable relating to test anxiety, again hierarchical regression analyses were performed. Achievement motivation and test anxiety were significant predictors and together explained from 5% to 8% of variance. STEM interest complexity added a small amount of incremental variance in the prediction of mathematics (β = .22, p = .005) and physics grades (β = .13, p = .045) but not in predicting overall STEM CGPA (β = .05, ns). Hypothesis 4 was only partially supported.
Measurement Invariance Across Turkish and U.S. Samples
The STEM Interest Complexity measure was originally developed and validated in the Unites States. The measure was translated into Turkish and was shortened through IRT techniques using a large sample in Turkey. In order to ascertain that the SF could be used across both Turkey (TR) and the United States, a test of measurement equivalence was in order. The SF was subjected to measurement invariance across university student samples obtained from TR and the United States.
Sample and procedure
The TR sample used for invariance analysis was the same as described in the main study (N = 930). The U.S. sample had 274 STEM major participants (55% men) from a technical university in the Southeast region. This sample is part of the one that was used for the initial validation of the measure (Toker & Ackerman, 2012). Of the sample, 65% was enrolled in engineering majors, and the rest was enrolled in biology, mathematics, and computer science, with 23.7% freshmen, 32.1% junior, 17.5% sophomore, 15% senior, and 10.2% at their fifth grade. Demographic characteristics of the samples were deemed comparable. Measurement invariance with an emphasis on metric and structural invariances was undertaken based on the covariances approach. First, baseline models for the two samples were identified, followed by tests for configural, metric, and structural invariance. Thirty-five items could be utilized in the analysis of the four-factor model, as one symbolic and one spatial interest items were used as reverse coded in the U.S. sample but not in the TR sample. The 12-item General STEM Interests Scale was also tested as a separate one-factor model.
All model fit results are presented in Table 7. The four-factor model had configural, metric, and structural invariance across the TR and U.S. samples. Only 1 item in the symbolic factor (“I find it exciting to solve problems with abstractions such as functions, trigonometry, differentiation, and integrals.”) had metric noninvariance at an α level of .001. The one-factor General STEM Interests Scale also displayed configural and metric invariance, with no items displaying metric noninvariance.
Measurement Invariance Results Across Turkish and U.S. Student Samples.
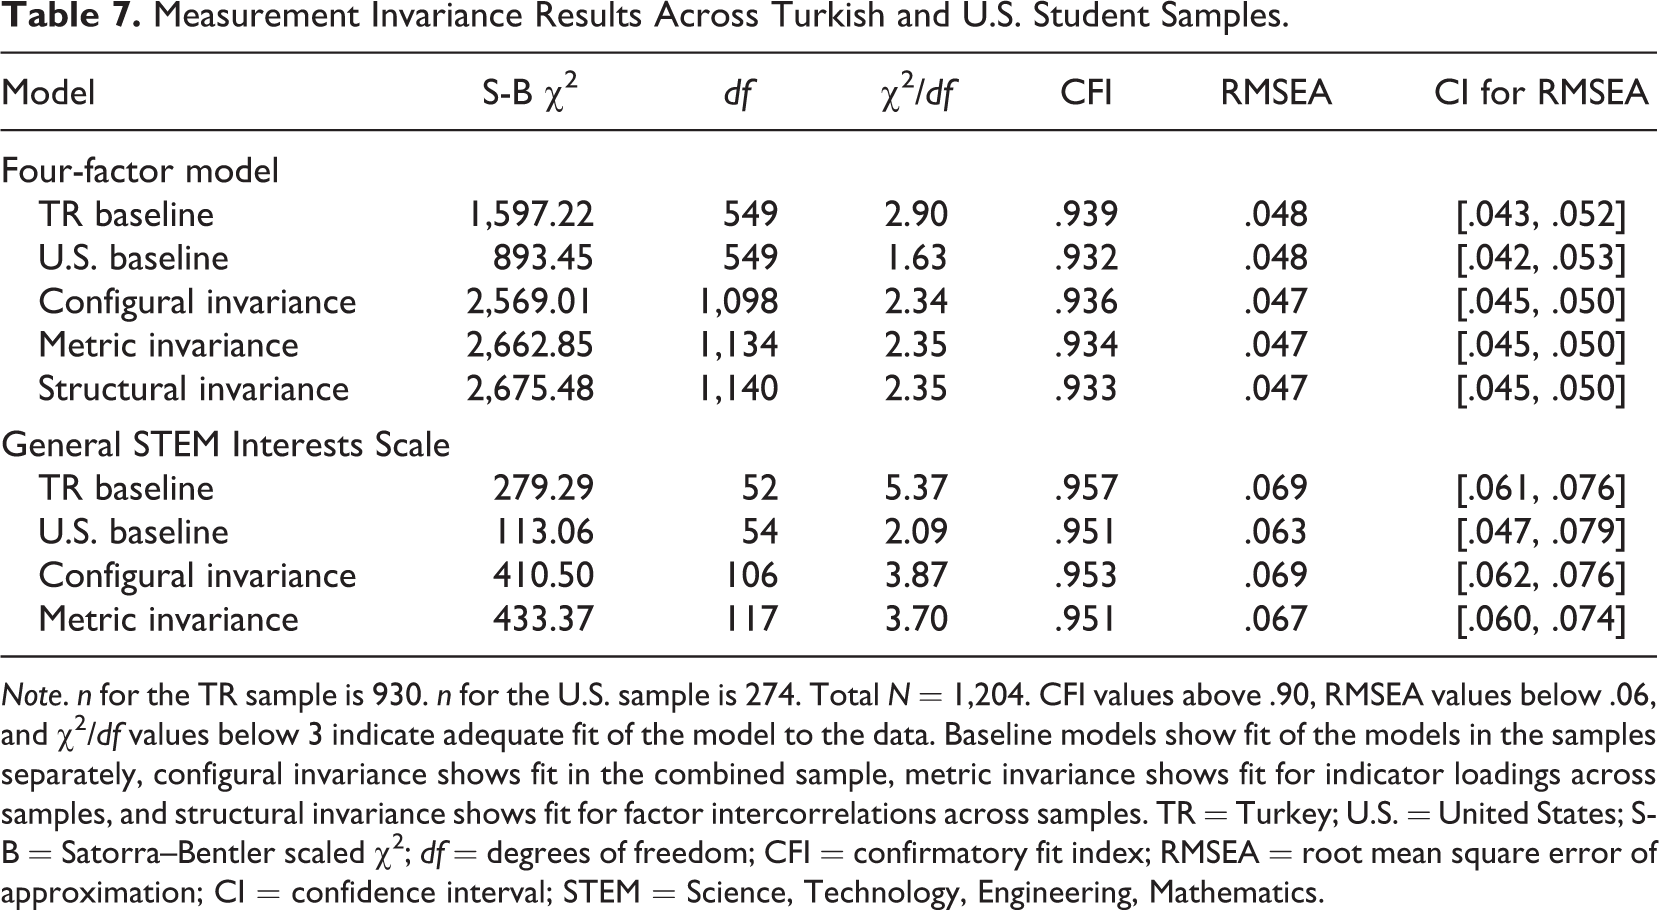
Note. n for the TR sample is 930. n for the U.S. sample is 274. Total N = 1,204. CFI values above .90, RMSEA values below .06, and χ2/df values below 3 indicate adequate fit of the model to the data. Baseline models show fit of the models in the samples separately, configural invariance shows fit in the combined sample, metric invariance shows fit for indicator loadings across samples, and structural invariance shows fit for factor intercorrelations across samples. TR = Turkey; U.S. = United States; S-B = Satorra–Bentler scaled χ2; df = degrees of freedom; CFI = confirmatory fit index; RMSEA = root mean square error of approximation; CI = confidence interval; STEM = Science, Technology, Engineering, Mathematics.
Discussion
The main purpose of the present investigation was to construct the STEM Interest Complexity Inventory SF and demonstrate that it is valid in predicting vocational fit criteria. Sound psychometric procedures based on IRT and DIF applications were employed in the identification of items to be retained. The resulting SF displayed equivalent validity to that of the original long form, which was shown in Toker and Ackerman (2012). Analyses rest on a sample of 930 participants with 36% women and 64% men; thus, the results are deemed reliable since sample size was adequate and surpassed 500 to perform IRT (Reise & Yu, 1990) and was again adequate and passed the required minimum of 250 per group to perform DIF (Herrera & Gomez, 2008). The gender ratio is almost equivalent to the gender ratio observed in college STEM majors in Turkey according to the 2005 statistics reported by the HEC (Smith & Dengiz, 2009). Actually, the HEC reported that 28% STEM majors are women in Turkey. Our study sample surpasses that with 36%, which was an advantage to utilize IRT analyses. Our main aim of producing a shorter and valid STEM Interest Complexity measure was fulfilled, which added to the scarce literature demonstrating the validity of instruments shortened with IRT applications (e.g., Gültas, 2014). The original 127-item measure was reduced to a 37-item valid measure.
Measurement invariance of the SF across the TR and U.S. samples was demonstrated. Historically, several studies in the vocational interest literature have shown cross-cultural noninvariance of measurement instruments or their underlying construct structure (e.g., Einarsdottir & Rounds, 2009; Tracey, Watanabe, & Schneider, 1997). It is imperative to show that what an instrument is measuring is the same across different groups. We were able to show conceptual equivalence based on metric invariance and to show construct equivalence based on structural invariance and based on factor analysis results. CFA results supported the four content factors based on the shortened form. Furthermore, bifactor modeling yielded a pattern of content- and global-factor associations that mirrored those obtained in the United States with the long form (Toker & Ackerman, 2012). We can safely conclude that the SF is equivalent across the U.S. and TR samples. One could argue that integrating complexity levels into an interest assessment increases the fidelity, reducing ambiguity in item content. As also argued by Toker and Ackerman (2012, p. 526), interest assessments based on Holland’s themes include items that are ambiguous in terms of complexity and the level of required cognitive ability. Individuals from different cultures might have a different anchor point in mind with regard to the level of complexity the item is displaying, hence might be yielding different responses. Differential perception of item content does not seem to be the case with the STEM Interest Complexity Measure SF.
In addition to producing a valid shorter instrument, the IRT analyses on the items of the STEM Interest Complexity Inventory supported the theoretical basis of the measure pertaining to varying levels of difficulty. Specifically, the long-form item groups originally designed to express low-, moderate-, and high-complexity levels could be differentiated from each other based on item discrimination parameters. The observed trend was that as the level of complexity expressed in an item increased, that item better discriminated across the latent STEM interest complexity trait continuum. The explanation for this trend most probably is related to participants perceiving items as more difficult as the level of complexity an item was designed to express increased. When participants were shown three clusters of STEM occupations based on the work of Gottfredson (1986) together with their work tasks and required skills and abilities that varied across the clusters, and asked how difficult they perceived each cluster in terms of the cognitive effort required to perform in each, they indeed reported on average that the highest complexity-cluster occupations were the most difficult followed by the moderate-to-high-complexity cluster. The low-to-moderate complexity cluster was perceived to be the easiest among all three. This finding supports that having integrated levels of complexity led to a better discriminating measure.
The IRT applications of the present investigation served to justify the theoretical and conceptual basis of occupational complexity (see Gottfredson, 1986; Gottfredson & Holland, 1996; Spaeth, 1979; U.S. Department of Labor, 1991), which formed the basis of developing the STEM Interest Complexity measure in the first place and served to save testing time in the application of a valid instrument. Furthermore, items retained based on good discrimination values still span moderate- and high-complexity levels, rendering the SF parallel to its theoretical grounds.
Using the R lordif package (Choi et al., 2011) in DIF detection can be considered a strength of the present study. This method rests on IRT procedures, rather than non-IRT-based DIF applications such as the Mantel–Haenszel procedure. It simultaneously takes account of item discrimination and location parameters, estimates trait levels, and compares models to see the effects of the grouping variable. Following the logic of model comparisons, items that display group and trait-level interactions can also be identified. Such items, most of which were reverse-coded items, were eliminated.
Following IRT and DIF analyses, the SF was subjected to concurrent criterion-related validation. Associations with vocational fit criteria were as expected, and small-to-moderate statistically significant correlations were also obtained with STEM academic success criteria. These results are consistent with those reported in Toker and Ackerman (2012) and provide further support for the use of the measure. Associations on the spatial interest scale were lower, which is a finding again consistent with those reported by Toker and Ackerman (2012, p. 531). STEM interest complexity added incremental variance over achievement motivation in the prediction of attitudinal variables related to satisfaction and further persisting in STEM areas. The motivational influence of vocational interests giving direction to career choices was shown once more, supporting the motivational theories (e.g., Ackerman, 1996; Holland, 1997) and findings related to vocational interests (Tracey & Robbins, 2006; Van Iddekinge, Putka & Campbell, 2011), but with higher associations with criteria.
STEM interest complexity content scales had small-to-moderate associations with STEM academic performance indices. Effects were comparable or better than the meta-analytic corrected effects between various interest inventories and academic performance (Nye, Rong, James, & Fritz, 2012). The composite score added incremental variance over test anxiety and achievement motivation, in the prediction of mathematics and physics grades, albeit with small effects, but not in the prediction of overall STEM CGPA. Spatial interests were not associated with overall STEM success, but we did observe a small significant association with physics grades, which makes theoretical sense considering the spatial nature of the course content. Only numeric interests’ association with quantitative reasoning abilities was significant in the small sample we used to investigate this relationship. Consistent with the educational and work psychology literatures, achievement motivation and test anxiety were found to play a role in academic performance (e.g., James, 1998). It can be argued that cognitive abilities (Guion, 2011) and grit (Duckworth & Quinn, 2009) are potential predictors that would increase explained variance.
At this point, a discussion on the cultural context with regard to criterion associations is in order. Even though there are no studies located that have investigated differential interest criterion associations based on culture, one can still argue that culture can shape the degree to which interests can shape vocational decisions. The social cognitive career theory (Lent, Brown, & Hackett, 1994) takes account of environmental variables that can affect one’s career choices. Societal and family values are one of these potential influences, and in-group collectivism at the societal level has been shown to be a moderator of the developmental association between personality traits (e.g., extroversion) and vocational interests (e.g., enterprising interests; Ott-Holland, Huang, Ryan, Elizondo, & Wadlington, 2013). Nevertheless, the magnitudes of associations with fit criteria that we obtained in the current study were consistent with those obtained in the U.S. samples. This is perhaps due to the fact that we assessed intentions rather than actual behavior and that we assessed these intentions in the samples of college students who attained enrollment in highly ranked departments through passing a rigorous university selection system, restricting them in terms of their cognitive abilities and perhaps STEM interests (see Ackerman, 1996; Cattell, 1987, for a discussion on the role of cognitive abilities in shaping vocational interests). Future studies that would include more diverse university samples across the country could expect differential associations between interests and fit.
Conclusion, Limitations, and Future Research
The 37-item STEM Interest Complexity Inventory SF spanning the numerical, symbolic, spatial, and STEM-related ideas domains, and the 12-item General STEM Interest Scale, prove to be valid measures of interest complexity. The two low-complexity items are also provided to readers should one wish to use them in assessment to observe the complexity level one is at.
The SF can be used confidently in research to measure STEM interests in samples of men and women. Even though sound psychometric procedures were applied in shortening the measure, its validation was studied concurrently which poses a limitation. Furthermore, data were collected from college students, which again pose a limitation to the generalizability of complexity levels and associations with criteria to different ages and levels.
Currently, the SF can be used in research with college students or to assess interests of entry-level college students to aid them in declaring a major. It would be possible to identify the level of occupational complexity one is interested in once interest in Holland’s realistic and investigative domains has been indicated. Nevertheless, we currently do not know whether or not item content would apply to aiding students at the high-school level. Even though item content in the SF is not far from the content students are exposed to at the high-school level, scale validation still needs to be investigated. The best strategy would be to undertake a longitudinal investigation of STEM interest complexity starting at the high-school level and to follow students through college for at least 2 years.
Vocational interest inventories exist to aid individuals in making healthy career choices. Thus, it follows that interest inventory validation ought to include validation with working samples. One such attempt was undertaken by Van Iddekinge, Putka et al. (2011) in terms of studying the validity of vocational interest inventories against job knowledge, job performance, and continuance intentions at work, which yielded moderate associations. A meta-analysis of associations of vocational interests with job performance, training performance, turnover intentions, and actual turnover produced small effect sizes (Van Iddekinge, Roth, Putka, & Lanivich, 2011), and another study (Nye et al., 2012) also produced small corrected effects with job performance indices and persistence. Similarly, the STEM Interest Complexity Inventory would benefit from an investigation among working samples across varying levels of work complexity.
Footnotes
Declaration of Conflicting Interests
The author(s) declared no potential conflicts of interest with respect to the research, authorship, and/or publication of this article.
Funding
The author(s) disclosed receipt of the following financial support for the research, authorship, and/or publication of this article: This work was supported by The Scientific and Technological Research Council of Turkey (grant number 114K034).