



Abstract
With the goal of improving assessment of interests toward social and enterprising areas, we developed the Vertical Social Interest Scale (VSIS) by incorporating vertical differentiation between occupations in terms of authority and communication. Social and enterprising occupations, their complexity levels, and work activities were identified using the information in the Dictionary of Occupational Titles and Occupational Information Network. Three studies (N = 515 total), two of which utilized students and one a working adult sample, were conducted to assess the factor structure and validity of VSIS. Construct validity was demonstrated using factor analyses and based on associations with traditional interest assessments and extraversion. Criterion-related validity was demonstrated based on associations with satisfaction with academic domain for the student sample and affective occupational commitment for the adult sample. Results support the validity of VSIS in predicting relevant vocational outcomes.
Keywords
The literature regarding interest–occupation fit has traditionally been considered a subtopic of counseling psychology. Despite early claims that vocational interests could be used to predict job performance, interest assessments have generally been ignored in the industrial and organizational psychology literature (Nye, Su, Rounds, & Drasgow, 2012). Accordingly, the applications based on this literature generally involve assessment of interests followed by recommendations as to the best-fitting occupations for the individual. The evidence regarding the validity of this approach in terms of the relationship between person–occupation congruence and job performance is mixed (Spokane, Meir, & Catalano, 2000). Moreover, studies offering significant associations between congruence and various work outcomes offer small-to-moderate correlations at best, explaining 3–6% of variance in criteria (e.g., Nauta, 2010; Spokane et al., 2000; Tracey & Robbins, 2006). According to scholars (e.g., Armstrong, Allison, & Rounds, 2008; Nauta, 2010; Toker & Ackerman, 2012; Tracey, 2002), The Holland Occupational Themes - Realistic, Investigative, Artistic, Social, Enterprising, & Conventional (RIASEC)-based assessments of direction of interests are not sufficient to explain more variance in criteria, and there is a need for alternative assessments.
Available evidence in the literature regarding the predictive validity of interests indicates that methodological advances are in order if we want to observe the theoretically expected strong relationship between person–occupation fit and work outcomes. While generating methodologically advanced interest scales, one line of research that could be followed examines incorporating the level of vertical differentiation involved in occupations. Vertical differentiation is defined as the extent to which a job involves repetitive simple tasks versus highly complex and narrowly defined tasks (Spaeth, 1979). There have been a few attempts to incorporate levels of vertical differentiation in occupational classifications (e.g., Gottfredson, 1986; Toker & Ackerman, 2012; Tracey, 2002). For example, Toker and Ackerman (2012) developed a measure of interest complexity for Science, Technology, Engineering, & Mathematics (STEM) areas. Toker and Ackerman argued that just as occupations vary in terms of their complexity levels, interests would also vary along the vertical dimension of complexity. Accordingly, aside from the direction of interests, the level of complexity the individual would be interested in dealing with could also be examined. For example, being interested in star formations could mean being interested in learning the materials that make up a star or being interested in the complex chemical processes that lead to the creation of a star. Clearly, there is a difference between two interests in terms of complexity. Based on this rationale, Toker and Ackerman developed a measure of interest complexity for occupations that would be characterized as STEM areas.
As important as the scale for STEM areas is, it does not cover the full range of occupations. For other occupations that mainly include interests in dealing with people, another complexity measure is needed. This is potentially very important because as the technology develops, the number of people working in service jobs tends to increase. In addition, a great number of people work in sales jobs which involve enterprising skills such as persuading and manipulating people. Accordingly, the purpose of this study is to develop a measure of interests reflecting vertical differentiation for occupations involving social and enterprising interests. Our attempt is a continuation of incorporating occupational complexity levels into interest assessments (see Toker & Ackerman, 2012), and we utilize three separate samples including both students and employed adults.
Dimensions of Vertical Differentiation for Social and Enterprising Interests
According to Spaeth (1979), vertical differentiation across occupations can be represented along three dimensions: complexity, authority, and prestige. In terms of occupations that involve dealing with people, one characteristic of each job that determines the level of complexity is the level of communication required to carry out the tasks involved in the job. In other words, based on Spaeth’s definition of complexity, jobs closer to the lower end of the continuum in terms of complexity are those jobs that only require simple repetitive communication patterns, whereas jobs that are closer to the higher end require complex and nonrepetitive forms of interaction with others. The authority dimension taps into the extent to which there is a need to coordinate efforts among workers. Although not very relevant in STEM areas and thus not represented in Toker and Ackerman’s (2012) measure of interest complexity, level of authority is an integral dimension of occupational vertical differentiation for jobs that involve dealing with people. In many modern-day organizations, there are positions down at the bottom of the hierarchical structure with no authority as well as positions at the top with substantial authority. Accordingly, the vertical dimension of authority can be used as another dimension by which occupations vary.
The third dimension of vertical differentiation is prestige (Spaeth, 1979). However, this vertical differentiation is different from complexity and authority in that it generally is not determined by the nature and characteristics of the tasks involved in the job but is determined by the importance the society ascribes to the tasks. As explained by Adams (2009), prestige ascribed to an occupation is an aspect of values but not interests. These two concepts are different such that values represent the importance given to concepts by people, while interests represent the degree of liking some activity. Accordingly, the prestige dimension of vertical differentiation does not align with complexity and authority for the purposes of this research.
Prediger’s people–things and data–ideas dimensions (Prediger, 1976) provide one indicator of occupational vertical differentiation for social and enterprising areas. Based on Holland’s hexagon model (Holland, 1959), which posits that there are six interest types including realistic, investigative, artistic, social, enterprising, and conventional, Prediger (1982) argued that occupational interests can be represented on a two-dimensional space consisting of a people–things axis and a data–ideas axis. Depending on the extent to which an occupation involves dealing with these dimensions, each occupation is represented by a data point on the two-dimensional space (Tracey & Hopkins, 2001). “People tasks” are interpersonal tasks such as caring for, instructing, or entertaining others; “things tasks” involve using machines, materials, and tools; “data tasks” include impersonal tasks involving numbers and systematic processes; and “ideas tasks” involve theories, knowledge, or novel ways of expressing ideas. In Prediger’s taxonomy, each dimension includes tasks that vary by their levels of vertical differentiation. For example, from low to high, the people dimension includes taking instructions—helping, serving, speaking-signaling, persuading, diverting, supervising, instructing, negotiating, and mentoring. Similarly, the data dimension includes comparing, copying, computing, compiling, analyzing, coordinating, and synthesizing. This classification of involvement with data, people, or things has also been used in the Dictionary of Occupational Titles (DOT) and is represented by the fourth, fifth, and sixth digits of the DOT codes, respectively.
Development of the Vertical Social Interest Scales (VSIS)
Based on the need explained in the preceding sections, in this study, we aimed to develop a measure of interests for social and enterprising occupations with an emphasis on vertical differentiation. The DOT (Gottfredson & Holland, 1996) guided the development of the scale. First, by using the three-letter Holland classification codes in the DOT, occupations that began by S or E codes were identified. Next, representative occupations from each level were found by examining the numbers representing vertical differentiation levels of dealing with people (i.e., fifth digit of the DOT codes). Specifically, occupations with fifth digits between 6 and 8 were labeled as low-level occupations, 3−5 were labeled as moderate-level occupations, and 0−2 were labeled as high-level occupations in terms of dealing with people. After identifying the occupations from the DOT, the Occupational Information Network (O*NET) was used to see how the occupations from different complexity levels varied in terms of the tasks involved. Finally, this information was used to develop items measuring interests in dealing with people for occupations varying in the continuum of vertical differentiation. Specifically, content of the tasks performed in occupations from varying levels of complexity was used as items.
After a close examination of the typical work activities in each occupation, it was found that work activities performed in occupations closer to the lower end of the vertical differentiation (in terms of Prediger’s classification) mainly involved serving others. Similarly, work activities performed in occupations around the middle of the continuum mostly involved supervising, and activities in occupations at the higher end of the continuum mostly involved leading, suggesting that the vertical dimension of authority was dominant in determining Prediger’s vertical levels. In terms of the communication dimension, it was found that there was not a clear pattern as was observed for authority. Instead, there were occupations in each level which involved low as well as high levels of communication with other individuals. For example, low-level occupations included waiter, bartender, and registered nurse, all of which require a great deal of communication with others. Accordingly, it was determined that communication would be a separate dimension of vertical differentiation with high levels of communication representing high complexity and low levels of communication representing low complexity.
In sum, it was found that work activities that involved dealing with people could be classified into four facets at different levels of vertical differentiation: serving (low complexity on the authority dimension), supervising (moderate complexity), leading (high complexity), and communication (higher scores representing high complexity and lower scores representing low complexity). Next, this information was used for developing items for each dimension of vertical differentiation. Specifically, representative tasks in O*NET from occupations that involve serving were used as items that measure interest in serving, and the same procedure was used to generate items for the supervising and leading dimensions. For the communication dimension, which cuts across all occupations that involve dealing with people, expert opinion by the authors was used to pull tasks from various occupations that represent an interest in more complex forms of communicating. This was accomplished by pulling tasks from a variety of occupations that describe communicating with others at a high level in a variety of contexts, with the expectation that stronger endorsement of these items would indicate an interest in more complex forms of communication. Thus, 43 items were developed, clustering under four factors: serving, supervising, leading, and communication.
Study 1
Study Overview
The purpose of the first study was testing the factor structure of the items and evaluating the scale’s construct validity. Construct validation included exploring the factorial structure of the measure together with internal consistency reliabilities of its factors. In addition, VSIS’s associations with Holland’s social and enterprising interests (as measured by RIASEC-S and E subscales) and self-confidence in social and enterprising skills (as measured by Expanded Skills Confidence Inventory [ESCI]-S and ESCI-E subscales) were examined. However, given the differences between personality correlates of social and enterprising interests, we expected that there would be differences in the pattern of relationships. Specifically, Costa, McCrae, and Holland (1984) found that social interests had the strongest associations with warmth and gregariousness, while enterprising interests were most closely associated with assertiveness. Accordingly, we expected that the Leadership subscale would be more strongly related to enterprising interests, while the Serving subscale would be more strongly associated with social interests. We also included extraversion to determine convergent validity, as extraversion is primarily associated with vocational interests in social and enterprising work environments. However, given the aforementioned evidence (Costa, McCrae, & Holland, 1984), we expected the relationship to be stronger for more complex subscales.
Hypotheses of Study 1 were as follows:
Participants and Procedure
Students at a large Turkish technical university participated in the study (N = 272). The questionnaire was put online using the University’s data collection software, and students enrolled in relevant courses were e-mailed with the link to the survey. Approval was granted by the University Human Subjects Ethics Committee, and all participants took part on a voluntary basis in exchange for extra course credit. The sample was 58% women, and the mean age was 21.1. The sample included 39% freshmen, 14% sophomores, 34% juniors, and 13% seniors. Social majors constituted 67% of the sample. The sample of social majors (n = 178) was 62% women, with 50% in their freshman year, 40% sophomores, 7% juniors, and 3% seniors. The sample of nonsocial majors (n = 86) was 49% women, with 16% in their freshman year, 23% sophomores, 27% juniors, and 34% seniors. Eight participants did not specify their majors. The major that had the highest representation in the sample was management (33%), followed by engineering (17%), psychology (15%), educational sciences (7%), and economy (7%).
Measures
VSIS
Forty-three Likert-type items were developed to measure the extent to which the participants enjoyed various activities involving interactions with people. Of the items, 11 measured the “serving” dimension, 10 measured the “supervising” dimension, 11 measured the “leadership” dimension, and 11 measured the “communication” dimension. Instructions for the scale were as follows: “Several activities are listed below. Please indicate the extent to which you find each activity enjoyable.” The response options ranged from 1 = not enjoyable at all to 6 = very enjoyable. Sample items included “assigning tasks to people” (leadership), “discussing a subject with the people I work with” (communication), “helping strangers on difficult tasks” (serving), and “making sure the rules are enforced” (supervising).
RIASEC
Brief Public Domain RIASEC Markers Scale (Armstrong et al., 2008) was translated into Turkish for this study. The scale included 8 items for the Social subscale and 8 items for the Enterprising subscale, rated on a 6-point scale (1 = not interested at all, 6 = very much interested). Sample items include “teach children how to read” (social) and “manage a clothing store” (enterprising). Armstrong, Allison, and Rounds (2008) report validity coefficients of .67 for Social and .56 for Enterprising Scales in predicting Strong Interest Inventory scores (Harmon, Hansen, Borgen, & Hammer, 1994) and reliabilities over .90 for both scales.
ESCI
Social (9 items) and Enterprising (10 items) subscales of the (ESCI, developed by Betz et al. (2003), were translated into Turkish for this study. The items were used to measure the extent to which the participants felt confident in conducting work activities relating to social and enterprising occupations, rated on a 6-point scale (1 = I do not feel confident at all, 6 = I feel very confident). Sample items include “comfort a patient experiencing severe pain” (social) and “sell a product to a customer” (enterprising). Betz et al. (2003) report a mean internal consistency reliability of .88 for all ESCI subscales and concurrent validity coefficients ranging from .66 to .94 for social and .62 to .86 for Enterprising scales. In addition, Robinson and Betz (2004) report a mean internal consistency reliability of .88 for all ESCI subscales and provide validity evidence in predicting major choices in a sample of college students.
Extraversion
The 8-item Extraversion subscale of the 44-item BFI Personality Scale, translated to Turkish by Sumer and Sumer (2002) and validated by Sumer, Lajunen, and Ozkan (2005), was used to measure extraversion. Items were rated on a 5-point scale (1 = strongly disagree, 5 = strongly agree). The Extraversion Scale yielded an internal consistency reliability of .83 in the current study.
Demographics
Participants were asked to report their gender, age, year in school, and major area of study.
Results
An exploratory factor analysis was conducted in order to examine the factor structure of the measure. The number of factors to be extracted was determined through parallel analysis, which indicated that four factors would best explain the data. Principal axis factoring with oblique rotation, in which the factorial structure was forced into four, confirmed the hypothesized factor structure with items mostly loading under their designated factors. Thus, Hypothesis 1 received support. In order to determine which items to include in the factors, a factor-loading threshold of .40 was used. This resulted in the elimination of 7 items, leaving 36 items in the scale including 11 in the leadership factor (α = .92) explaining 31.96% of variance, 7 in the supervising factor (α = .81) explaining 11.66% of the variance, 10 in the serving factor (α = .90) explaining 6.56% of the variance, and 8 in the communication factor (α = .85) explaining 4.03% of the variance. The means and standard deviations of the VSIS factor scores and their correlations with each other together with other study variables are presented in Table 1.
Means, Standard Deviations, and Correlations for Study 1.

Note. Extraversion was rated on a 5-point scale; all others were rated on 6-point scales, with higher scores indicating higher levels on the construct. Values on the diagonal are internal consistency reliabilities. VSIS = Vertical Social Interest Scale; RIASEC = brief public domain markers for the RIASEC typology; ESCI = Expanded Skills Confident Inventory; SwAD = satisfaction with academic domain.
*p < .05. **p < .0025. ***p < .001.
An examination of Table 1 reveals mostly moderate-to-strong correlations (significant correlations ranging from .19 to.64) between the factor scores and other established measures of interests, providing initial support for the convergent validity of the measure. We evaluated 20 correlations between the VSIS factors and the established measures of interests and also extraversion. Accordingly, we undertook a Bonferroni family-wise correction with an αlevel of .0025. Actually, all hypothesized correlations were significant at the corrected p < .0025 level. As expected, using Fisher’s r-to-z transformation, the high-complexity leadership factor was more strongly associated with enterprising interests (r = .48) than social interest (r = .24, z = 3.29, p < .001) and enterprising self-confidence (r = .59) than social self-confidence (r = .33, z = 3.79, p < .001). Similarly, higher scores on the Communication Scale indicating higher complexity interests were more strongly associated with enterprising self-confidence (r = .64) than social self-confidence (r = .41, z = 3.74, p < .001), but the difference was not significant for enterprising and social interests (z = 1.8, p = .072). The moderate-complexity Supervising Scale had a stronger association with enterprising (r = .44) than social interests (r = 29, z = 1.98, p < .05), but the difference between enterprising and social self-confidence was nonsignificant (z = 1.25, p = .211). The low-complexity Serving Scale was more strongly associated with social interests (r = .66) than enterprising interests (r = .23, z = 6.54, p < .001) and with social self-confidence (r = .37) than enterprising self-confidence (r = .19, z = 2.31, p < .05). Thus, Hypothesis 2 also received support.
Associations with extraversion indicated partial support for Hypothesis 3 based on a range of VSIS–extraversion correlations from .16 to .43. With the more stringent corrected p value of .0025, Leading and Communication Scales had significant associations with extraversion while Supervising and Serving Scales were not significantly related. In fact, as hypothesized, scores indicating a higher preference for more complex people tasks such as leading (r = .36) and high-levels of communication (r = .43) were more highly associated with extraversion than the moderate-complexity interests indicated with the Supervising Scale (r = .16, zLead = 2.56, pLead < .05, zCom = 3.48, pCom < .001) and interests indicated toward the low-complexity Serving Scale (r = .17, zLead = 2.43, pLead < .05, zCom = 3.35, pCom < .001).
Finally, Hypothesis 4 was tested through a series of independent samples t-tests. Since we conducted four tests, a more stringent p value of .0125 was used to test for statistical significance. A significant difference was observed between social and STEM majors in their scores on the leadership factor (t = 2.58, p < .01). However, differences between the supervising (t = .66, p = .507), serving (t = .12, p = .904), and communication (t = 1.64, p = .102) factors were not significant. Accordingly, Hypothesis 4 was partially supported.
Discussion
Study 1 served us in understanding the factor structure of the new VSIS and provided initial support for its construct validity in a student sample. Specifically, the data confirmed the four-factor structure including leadership, supervising, serving, and communication factors. The new measure, especially the communication and leadership factors, demonstrated good convergent validity with both Social and Enterprising subscales of the RIASEC and ESCI as well as extraversion. Interests indicated for the more complex scales had higher associations with enterprising self-confidence, enterprising interests, and extraversion, while lower complexity scales had higher associations with social interests and social self-confidence, providing evidence for discriminant validity.
Study 2
In order to confirm the factor structure of the scale and provide additional evidence for construct validity, a second study was conducted. In Study 2, only the 36 items that were found to load onto one of the four factors in the first study were used to assess vertical social interests. Construct validation included exploring the factorial structure of the measure together with internal consistency reliabilities of its factors on a different sample. Just like in Study 1, VSIS’s associations with Holland’s social and enterprising interests (as measured by RIASEC-S and RIASEC-E subscales), self-confidence in social and enterprising skills (as measured by ESCI-S and ESCI-E subscales), and extraversion were examined to determine convergent validity. Criterion-related validity was examined using students’ levels of satisfaction with their academic majors. Given the conceptual similarity between subjects of social majors and content of VSIS, social majors were expected to yield higher associations between VSIS subscales and academic domain satisfaction when compared to nonsocial majors. In other words, we expected VSIS to predict academic domain satisfaction for social majors because those who were satisfied with their majors in the social fields were expected to enjoy tasks that involve interaction with people, but no such relationship was expected for being satisfied with a nonsocial major and VSIS scores. Accordingly, we hypothesized the following:
Participants and Procedure
Participants (N = 173) were 57.1% women, and the mean age was 21.4. The sample included 23% freshmen, 24% sophomores, 27% juniors, and 26% seniors. Social majors constituted 45% of the sample. The sample of social majors (n = 77) was 89% women, with 48% in their freshman year, 16% sophomores, 16% juniors, and 20% seniors. The sample of nonsocial majors (n = 96) was 32% women, with 3% in their freshman year, 30% sophomores, 35% juniors, and 32% seniors. The major that had the highest representation in the sample was engineering (43%), followed by educational sciences (30%) and public administration (5%).
Measures
In addition to using the scales reported in Study 1, we also measured for academic domain satisfaction in this study.
Satisfaction with academic domain
Seven items developed by Lent et al. (2005), rated on a 6-point scale (1 = does not describe me at all, 6 = describes me very well), were used to measure students’ satisfaction with their academic domain. One sample item was “I feel satisfied with the decision to major in my intended field.” Lent et al. (2005) found internal consistency reliability of .87 for the scale and provided validity evidence in predicting life satisfaction (.40) and goal progress (.61). The scale was adapted to Turkish by Toker and Gültaş (2016).
Results
A confirmatory factor analysis was conducted in order to examine the factor structure of the measure. Principal axis factoring with oblique rotation, in which the factorial structure was forced into four, supported the hypothesized factor structure with items mostly loading under their designated factors. The leadership factor explained 26.2%, the serving factor explained 13.3%, the supervising factor explained 7.9%, and the communication factor explained 6.7% of the variance. Accordingly, the first hypothesis found support.
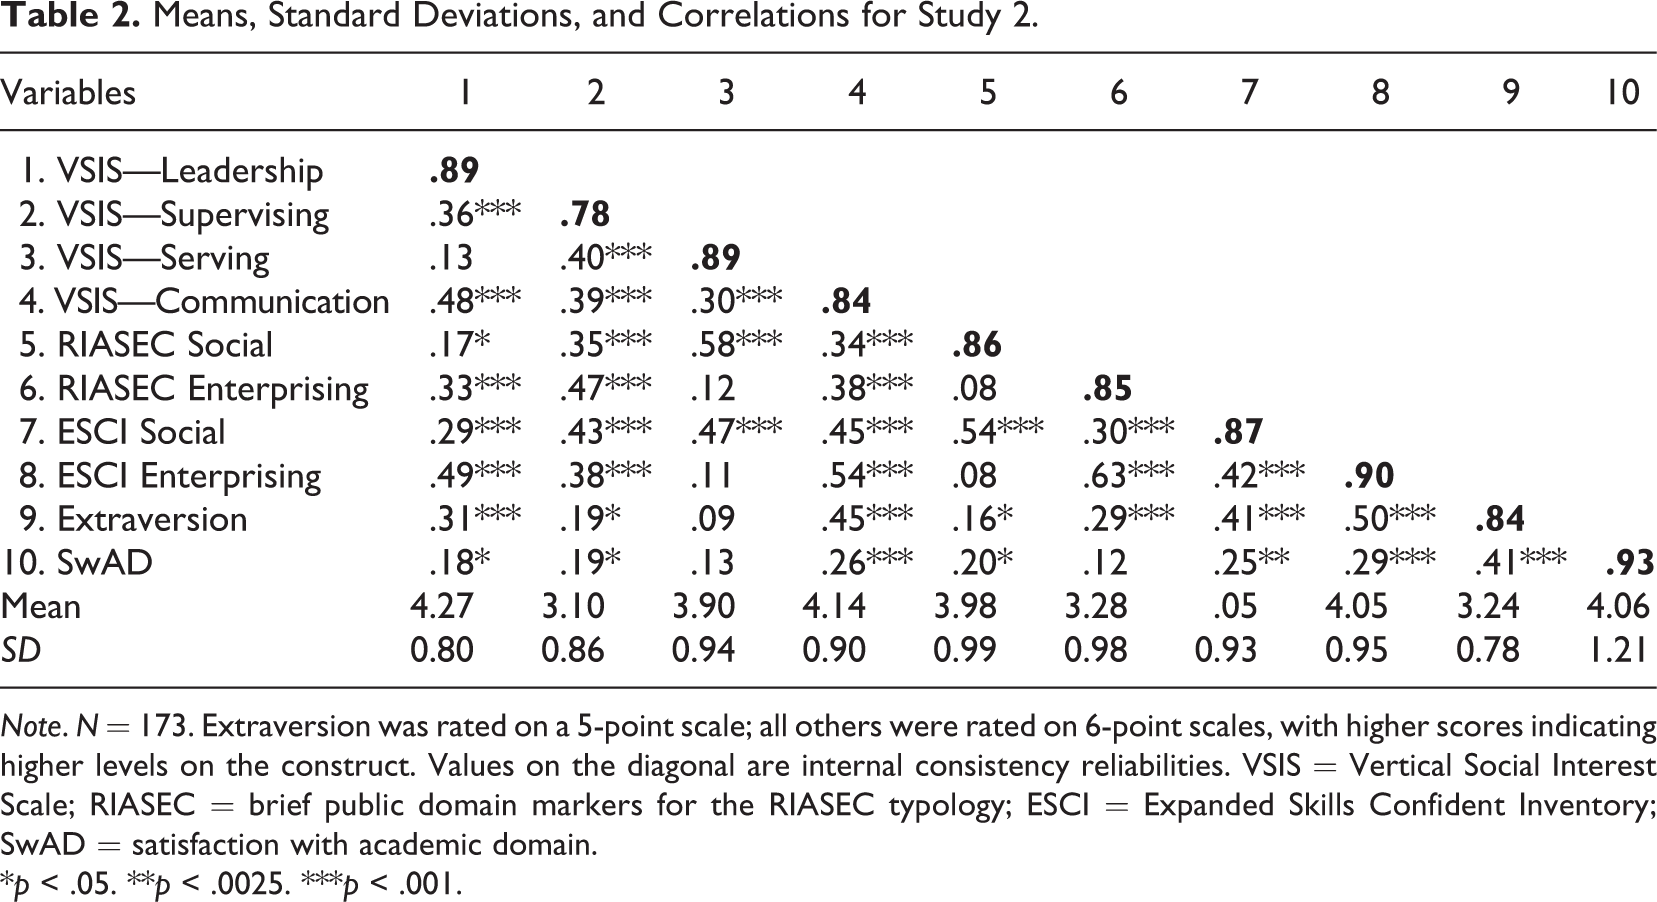
The means and standard deviations of the resulting factor scores and their correlations with each other together with other study variables are presented in Table 2. An examination of Table 2 reveals that at the more stringent corrected p value of .0025, the VSIS generally had significant associations with both the traditional interest measures and the self-confidence measures, providing partial support for construct validity. The one exception was the Supervising Scale, which had significant associations with social interests and self-efficacy but not with enterprising measures. As in Study 1, for higher complexity scales, the relationship was stronger for enterprising interests and self-efficacy than for social, whereas the reverse pattern was observed for lower complexity scales. Specifically, the relationship between the Leading Scale and enterprising self-confidence (r = .49) was stronger than social self-confidence (r = .29, z = 2.17, p < .05), although the difference was not significant for interests. On the other hand, the relationship between the Serving Scale and social interests (r = .58) was stronger than enterprising interests (r = .12, z = 5.03, p < .001), and the relationship between the Serving Scale and social self-confidence (r = .47) was stronger than enterprising self-confidence (r = .11, z = 3.74, p < .001). This pattern of relationships provides evidence for the convergent and discriminant validity of the VSIS.
Means, Standard Deviations, and Correlations for Study 2.
Note. N = 173. Extraversion was rated on a 5-point scale; all others were rated on 6-point scales, with higher scores indicating higher levels on the construct. Values on the diagonal are internal consistency reliabilities. VSIS = Vertical Social Interest Scale; RIASEC = brief public domain markers for the RIASEC typology; ESCI = Expanded Skills Confident Inventory; SwAD = satisfaction with academic domain.
*p < .05. **p < .0025. ***p < .001.
As in Study 1, scores indicating a higher preference for more complex people tasks such as leading (r = .31) and high levels of communication (r = .45) were more highly associated with extraversion than the moderate-complexity interests indicated with the Supervising Scale (r = .19, zLead = 1.18, pLead = .238, zCom = 2.71, pCom < .01), although the difference between leading and supervising was not significant. In addition, interests indicated toward the low-complexity Serving Scale was less strongly associated with extraversion (r = .09) than more complex interests (zLead = 2.17, pLead < .05, zCom = 3.70, pCom < .001). All in all, these results provide partial support for Hypothesis 2.
In order to test Hypothesis 3, bivariate correlations between the VSIS factor scores and satisfaction with academic domain were calculated independently for social and STEM majors and examined using a corrected p value of .006 (see Table 3). An examination of the table reveals that none of the correlations is significant for STEM majors at this more stringent level. However, the communication factor had a strong positive correlation (r = .38, p < .001) for social majors. Accordingly, the third hypothesis was supported only for the communication factor. Correlations between the traditional assessments and academic domain satisfaction between major area samples did not differ.
Means, Standard Deviations, and Correlations for Study 2—Separated for Social and STEM Majors.
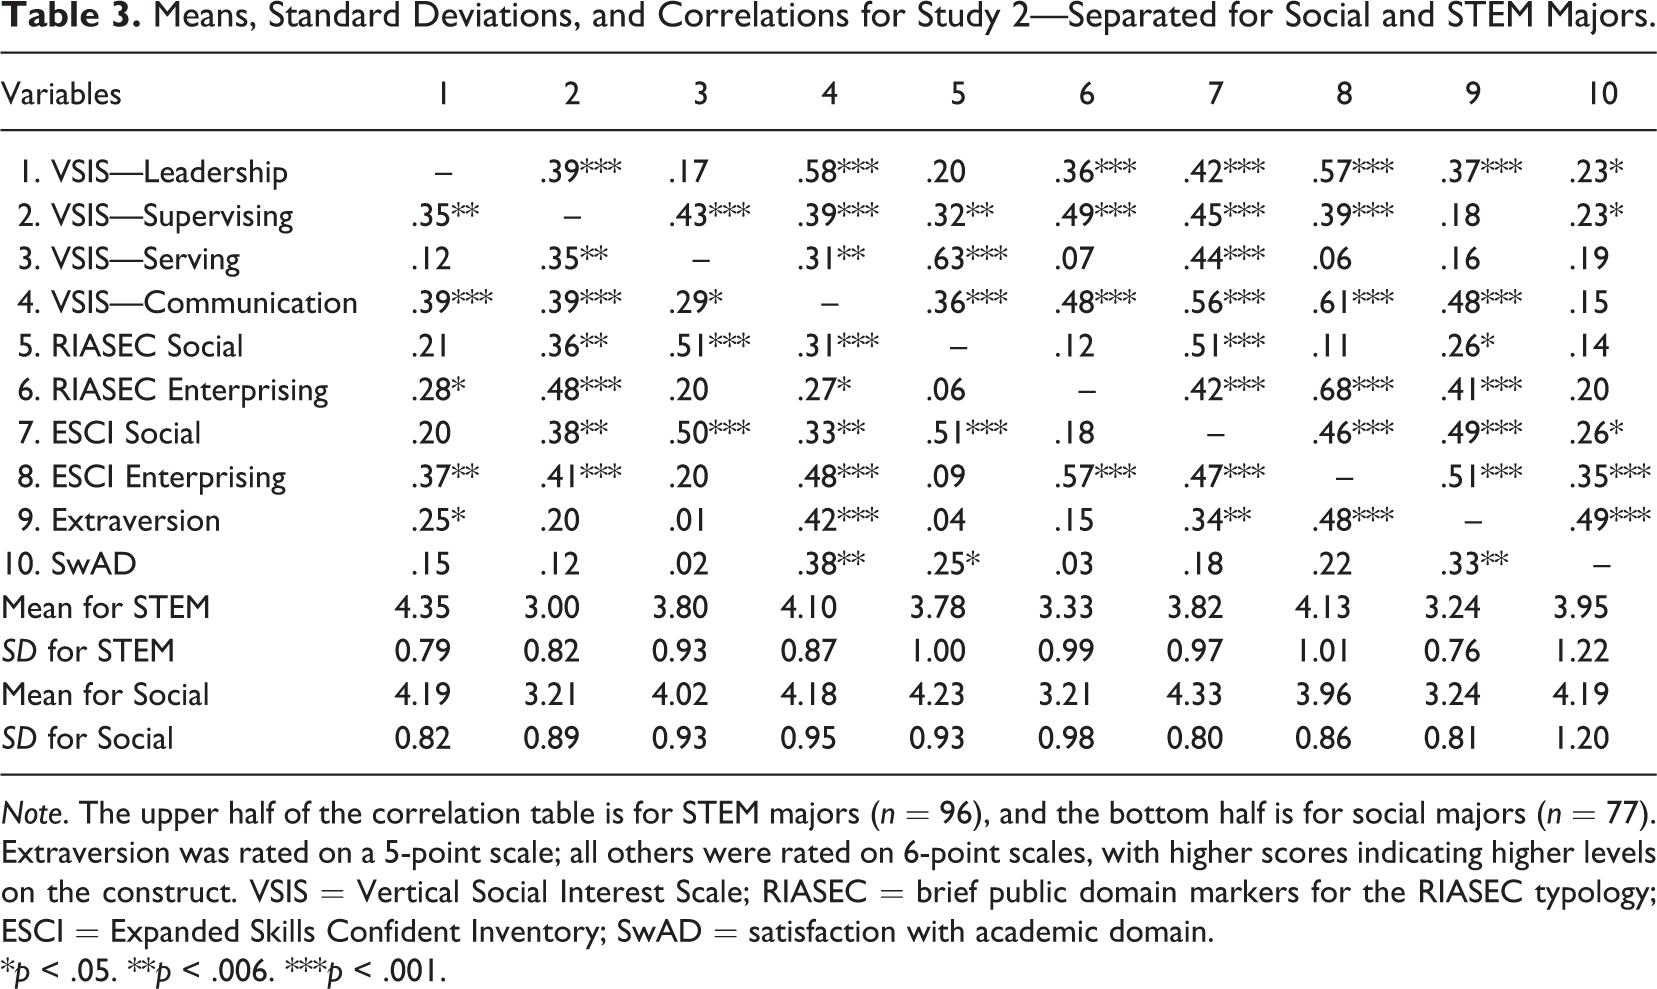
Note. The upper half of the correlation table is for STEM majors (n = 96), and the bottom half is for social majors (n = 77). Extraversion was rated on a 5-point scale; all others were rated on 6-point scales, with higher scores indicating higher levels on the construct. VSIS = Vertical Social Interest Scale; RIASEC = brief public domain markers for the RIASEC typology; ESCI = Expanded Skills Confident Inventory; SwAD = satisfaction with academic domain.
*p < .05. **p < .006. ***p < .001.
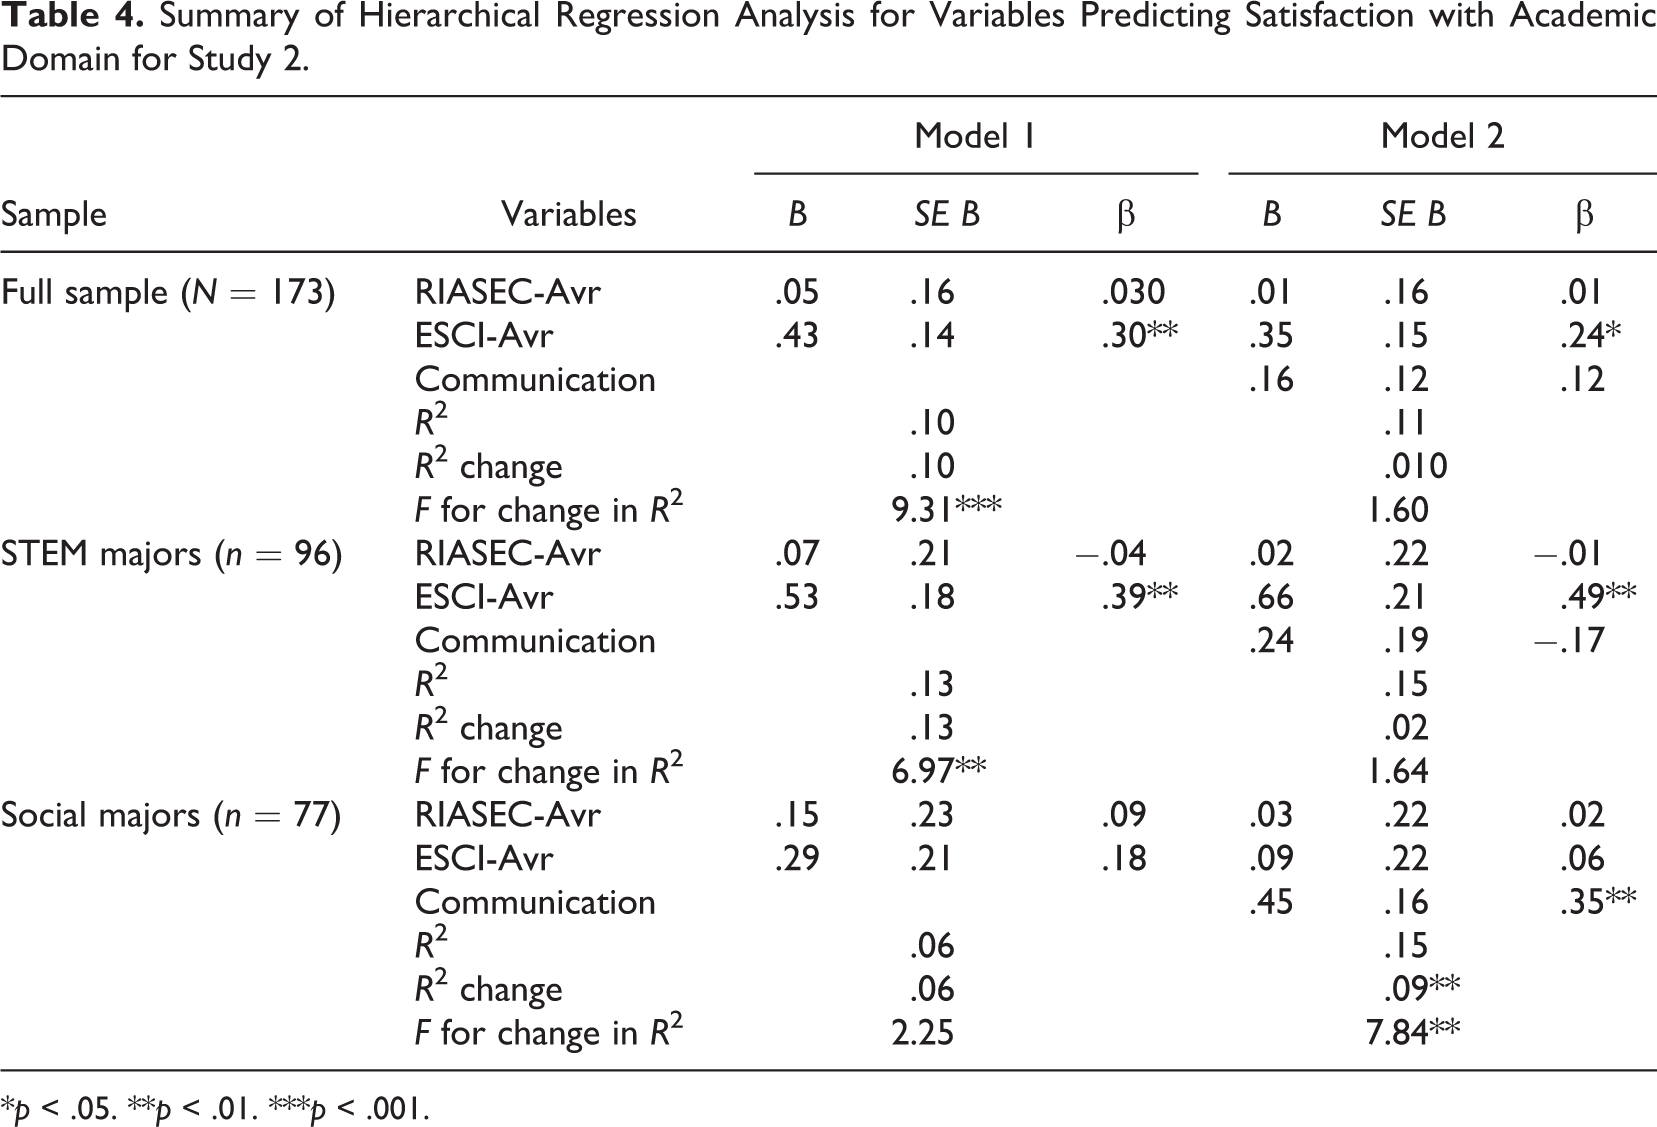
As variables were moderately intercorrelated, before testing for the fourth hypothesis, a dominance analysis was conducted to see the relative contributions of traditional interest and self-confidence scales and the high-complexity scales of communication and leadership on the outcome of academic major satisfaction. The results indicated that the four predictors altogether explained 15% of the variance in social major satisfaction. Communication scores explained the most variance across all subsets and on average explained 11% of variance. This was 73% of the total explained variance. The second best predictor in all subset regressions was the combination of self-confidence scales, followed by interest scales. Following dominance analysis, a hierarchical regression with only communication scores in the second step was run. RIASEC and ESCI factors were transformed to z-scores and combined into composite interest scores. As can be seen in Table 4, for social majors, the communication factor explains 9% more variance over RIASEC and ESCI Scales combined. Accordingly, Hypothesis 4 was partially supported.
Summary of Hierarchical Regression Analysis for Variables Predicting Satisfaction with Academic Domain for Study 2.
*p < .05. **p < .01. ***p < .001.
Discussion
In this study, a separate sample was utilized to confirm the factor structure of the scale and provide further evidence of convergent and discriminant validity. Most of the hypotheses were supported, providing further evidence for construct and criterion-related validity of the VSIS factors. Evidence for validity and overlapping factor structures in a separate sample indicates that the scale has generalizability to a sample other than the one it was initially constructed.
Examining the associations between VSIS and other measures of interest reveals that the new measure, especially the communication factor, demonstrates good convergent validity with both Social and Enterprising subscales of RIASEC and ESCI, as well as extraversion. Still, the communication factor adds incremental variance over each of the traditional interest measures in predicting satisfaction with academic domain. This indicates that the items in the communication factor cover some untapped area in the construct space of academic domain satisfaction for social majors, in addition to those measured by traditional interest or personality measures.
The high-complexity measures of communication and leadership were discriminated from the moderate- and low-complexity scales of supervising and serving in both studies, based on their higher associations with an inclination toward enterprising areas and extraversion. Supervising and serving interests generally mapped onto social interests and social confidence. In other words, we can say that enterprising pursuits require more complex activities in terms of authority and communication while having a social inclination corresponds to low-complexity pursuits.
Serving, supervising, and leadership factors failed to add incremental variance in explaining academic domain satisfaction over RIASEC and ESCI Scales. This is in fact not surprising, given the fact that we utilized a student sample that would have little to do with serving, supervising, or leading others. These are dimensions specific to each occupation, with some social occupations involving higher levels of serving while others requiring higher levels of leadership. Accordingly, it is possible that some students in social majors are interested in activities that involve serving others, while others are more interested in leadership activities; but both groups of students can still be satisfied with their academic domains.
Next, in order to provide some evidence for generalizability of the scale to different populations, a third study was conducted using data from a sample of working adults.
Study 3
In the third study, the convergent and discriminant validity of the scale were examined using an adult sample working in jobs that require interaction with others (N = 70). Sample was 43% female with a mean age of 35.8. The jobs represented in the sample included teachers (49%), secretaries (%16), nurses (%13), managers (%9), security (%6), lawyers (%3), waiter/bartender (%3), and psychologists (%1). The participants were employees of multiple organizations and were contacted through personal connections of the authors using a snowball sampling method. In addition, Facebook posts in relevant occupational groups and pages were utilized to invite interested parties to participate in the study. Convergent and discriminant validity of the scale were assessed using the same measures as in the first two studies. However, given the characteristics of the sample, criterion-related validity of the scale was assessed using measures of work withdrawal, turnover intentions, job satisfaction, and occupational commitment.
We categorized available occupations in our sample as low (n = 10) and high complexity (n = 60) and compared them in terms of daily communication patterns on the job, including the number of people they have to interact with (less than 5, between 5 and 15, between 15 and 30, between 30 and 50, more than 50), the amount of time they interact with people (less than an hour, 1–3 hr, 3–5 hr, 5–7 hr, more than 7 hr), and the average amount of time devoted to one person while interacting (less than 5 min, 5–15 min, 15–30 min, 30–50 min, more than 50 min). None of these differences were significant.
Measures
Job satisfaction
Satisfaction with current job was measured using a 9-item version of the Job Descriptive Index (JDI; Roznowski, 1989; Smith, Kendall, & Hulin, 1969), adapted to Turkish by Ergin (1997). The Job Satisfaction Scale included nine evaluations regarding the job and included phrases such as “fascinating,” “boring,” and “interesting.” Participants were asked whether each adjective defined their current jobs with response options being “yes,” “no,” or “?”. Higher scores indicate higher job satisfaction. Roznowski reported an internal consistency reliability of .87 for the scale, and Kinicki, McKee-Ryan, Schriesheim, and Carson (2002) provided extensive evidence for reliability and validity of the scale.
Affective occupational commitment (AOC)
Occupational commitment was measured using a 6-item measure, which was a revised version of the affective Organizational Commitment Scale developed by Meyer, Allen, and Smith (1993), adapted to Turkish by Wasti (2000). Original items that were tailored toward organizational commitment were rewritten to express occupational commitment such as “I really feel as if this occupation’s problems are my own” and “This occupation has a great deal of personal meaning for me.” Response options ranged from 1—I don’t agree at all to 6—I completely agree.
Withdrawal behaviors
Behavioral withdrawal from work was assessed using the 9-item work Withdrawal Scale of Hanisch and Hulin (1990), adapted to Turkish by Wasti (2001). Items examined the frequency with which certain behaviors that indicate withdrawal from work occur with response options ranging from “more than once a week” to “maybe once a year.” Sample behaviors included not going to work and taking long breaks. Hanisch and Hulin (1991) provide evidence for the construct validity of the scale.
Turnover intentions
Turnover intentions were measured with 3 items related to intentions to quit one’s job from the 6-item scale of Hanisch and Hulin (1990), adapted to Turkish by Wasti (2001). Questions that were not used were about extraneous factors that would affect such intentions.
Results
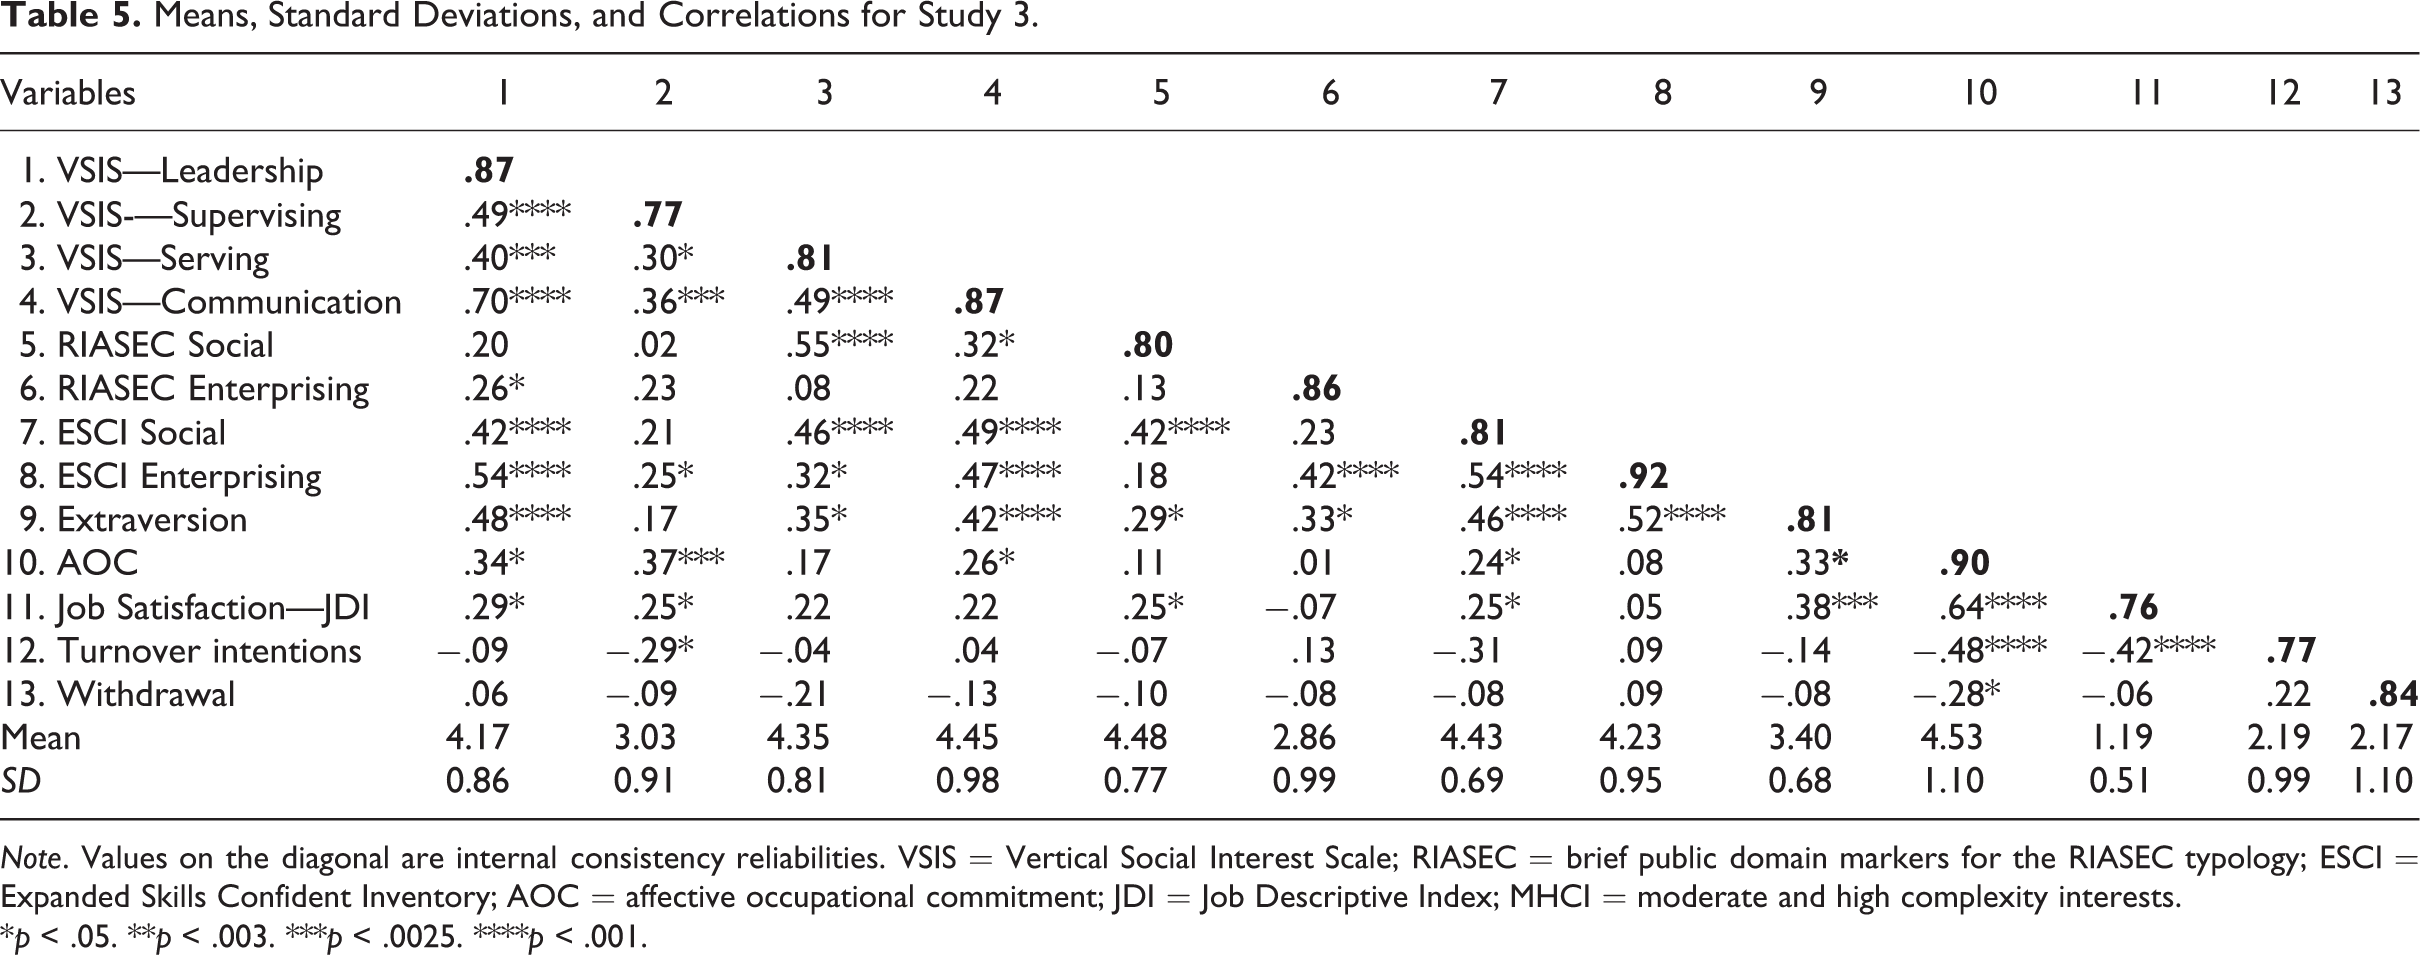
Given the relatively small sample size obtained, this study was regarded as a pilot testing for a working adult sample. Descriptive statistics and correlations between the study variables are presented in Table 5. While examining correlations between VSIS factors and traditional interest measures, we considered the family-wise error rate and used p < .0025 to test our hypotheses. Similarly, while examining correlations between VSIS factors and work criteria, we used p < .003 as our threshold for significance. An examination of the table reveals that VSIS factors of leadership and communication show good convergent validity with ESCI self-confidence measures as well as extraversion with moderate effect sizes. The Supervising Scale did not have significant associations with any of the traditional measures, while serving was significantly related with social interests and self-efficacy. As was the case in the previous studies, the low-complexity Serving Scale had a lower correlation (r = .08) with the Enterprising Scale of RIASEC than social (r = .55, z = 3.07, p < .01), but the difference was not significant for self-confidence, providing partial evidence for discriminant validity across the complexity levels. The high-complexity scales again had high correlations with enterprising self-confidence (r = .54 for leadership and r = .47 for communication).
Means, Standard Deviations, and Correlations for Study 3.
Note. Values on the diagonal are internal consistency reliabilities. VSIS = Vertical Social Interest Scale; RIASEC = brief public domain markers for the RIASEC typology; ESCI = Expanded Skills Confident Inventory; AOC = affective occupational commitment; JDI = Job Descriptive Index; MHCI = moderate and high complexity interests.
*p < .05. **p < .003. ***p < .0025. ****p < .001.
In terms of criterion-related validity, the only significant association we observed using the corrected significance level was between supervising and AOC (r = .37, p = .002). Leadership (r = .34, p = .004) and Communication (r = .26, p = .028) Scales also had positive associations with commitment, but the effect size failed to be significant under the more stringent corrected level in a sample of 70. Similarly, leadership (r = .29, p = .016) and supervising (r = .25, p = .040) had positive associations with job satisfaction at the traditional p level of .05, but these were not significant at the corrected level. Serving (r = .22, p = .070) and communication (r = .22, p = .073) did not have significant relationships with job satisfaction. Although not statistically significant in a sample of 70 participants, there appeared a consistent trend of positive associations. However, none of the VSIS factors was useful in predicting withdrawal behaviors. Finally, the supervising factor had a negative relationship with turnover intentions (r = –.29), but this also failed to reach significance at the corrected level.
Discussion
This study was an attempt to provide some initial evidence regarding the generalizability of the scale to adult working populations. The results suggest that the scale has potential in predicting occupational commitment and job satisfaction. The associations between VSIS factors and criteria were generally stronger for AOC than other criteria. AOC and job satisfaction were typically the most highly associated outcomes with the moderate- and high-complexity scales, but not with the low-complexity scale of serving, further supporting the distinction across complexity levels.
General Discussion, Limitations, and Future Research
A vocational interest measurement geared toward the social and enterprising occupations was formed, following through with the approach of incorporating occupational complexity levels into interest assessments as first described in Toker and Ackerman (2012). The resulting items in the scale named VSIS vary across levels of complexity in terms of tasks that necessitate interacting with people. Items that tap into lower level complexity tasks made up the scale of “serving,” moderate-complexity tasks made up the scale of “supervising,” and high-complexity tasks were included in the scales of “leading” and “communication.” Initial evidence for construct validity was shown based on associations with social and enterprising interests and extraversion in student samples and an employed sample. Distinctions were observed across the patterns of associations for the low-, moderate-, and high-complexity scales such that the high-complexity scales were more highly associated with an inclination for enterprising pursuits and being extraverted, and the low-complexity scale was more associated with social pursuits. Enterprising interests have been shown to have larger meta-analytic associations with extraversion than social interests (Barrick, Mount, & Gupta, 2003); thus, it is not surprising to see that individuals who indicated higher interests in highly complex tasks tended to be more extraverted.
The scale for supervising interests, designed as a moderate-complexity scale, had moderate-to-high associations with enterprising interests, but moderate associations (smaller than those of the higher complexity scales) with enterprising self-confidence. Such a pattern of correlations support the distinctions between levels of complexity, as the literature also points out that enterprising interests, as compared to social interests, are better predictors of the motivation to lead and supervise (Chan, Rounds, & Drasgow, 2000), which are inherently more complex. The usefulness of the newly developed complexity measure over the already available scales of interests and self-confidence has also been supported. Thus, albeit being associated with traditional assessments, the new scale is not statistically redundant in predicting relevant criteria.
Support for criterion-related validity comes from the high-complexity scales predicting academic domain satisfaction among social majors and predicting AOC among the employed sample. Especially the Communication Scale was the most important in explaining satisfaction with being in a social major. Although STEM and non-STEM majors did not differ on their interests toward tasks heavy on communication, such interests was the most important vocational interest determinant of domain satisfaction for social majors. The scale of communication is thought to be an important contribution to the literature.
Despite showing promise as a valid measure of interests in social and enterprising fields, there were a few limitations with the study which provide opportunities for further research. First, the VSIS could benefit from additional research testing its usefulness in varying samples and with different criteria. For example, given the scale has been developed and validated on Turkish-speaking samples, future research is needed testing the generalizability of the scale to Western societies. One related limitation was that despite the validity of the scale being tested in an employed adult sample, the sample size of that study was quite low. Accordingly, VSIS is in need of further validation with more diverse samples of employed individuals working in occupations with varying levels of people complexity, potentially using other important criteria such as job performance.
Footnotes
Declaration of Conflicting Interests
The author(s) declared no potential conflict of interest with respect to the research, authorship, and/or publication of this article.
Funding
The author(s) received no financial support for the research, authorship, and/or publication of this article.