
Abstract
Societal trust is widely believed to be a fundamental component of prosperous societies, but geographical determinants of societal trust have not been examined in depth. This study examines hypothesized pathways between geography and societal trust.
Strongest support is found for the hypothesis that higher geographical latitude leads to lower disease prevalence, lower income inequality, and less ethnic and less linguistic heterogeneity. Lower disease prevalence, lower income inequality, and less ethnic and less linguistic heterogeneity in turn appear to determine the viability of a “virtuous circle” of mutually reinforcing societal characteristics, including greater wealth, greater life expectancy, greater political rights, greater civil liberties, greater societal trust, less religiosity, and less corruption.
Generalized societal trust is widely believed to be a fundamental component of prosperous societies (Arrow, 1972; Fukuyama, 1996; Yamagishi, 2011), but the geographical determinants of trust, if any, are largely unknown. Numerous determinants have been proposed, but disentangling the pathways affecting trust has proven to be difficult (Delhey & Newton, 2005). The strategy taken in this article is as follows: pathways affecting societal trust that have been proposed in previous literature are mapped using structural equation modeling (SEM), and the resulting models are then analyzed for fit to actual data.
There are a number of theoretical channels by which geographical factors may affect societal trust. Four major channels linking geography to trust have been widely mention discussed in recent literature: disease, ethnic heterogeneity, income inequality, and economic growth. We briefly review these channels below.
Disease
Higher absolute geographical latitude leads to less infectious disease burden due to lower abundance of transmission vectors, including primates and other mammals, and insects; and because sub-Arctic regions lack the agricultural resources to support large population densities, which limits the spread of crowd diseases (Wolfe, Dunavan, & Diamond, 2007). Lower disease burden may facilitate economic growth and social stability because disease prevalence is hypothesized to exacerbate ethnocentric, in-group tendencies at the individual psychological level (Navarrete & Fessler, 2006) and societal level (Fincher, Thornbill, Murray, & Schaller, 2008); and decrease economic growth (Gallup, Sachs, & Mellinger, 1999; Snowden, 2006).
Income Inequality
Higher latitude correlates with less income inequality, and an assortment of pathways have been proposed, including wage productivity, returns-to-scale on plantations, the crowding-out effect of natural resources, concentration of land ownership, and natural resource price fluctuations (Inter-American Development Bank, 198).Income inequality may lead to lower levels of trust (Uslaner & Brown, 2005; You & Khagram, 2005), higher levels of homicide (Daly, Wilson, &Vasdev, 2001), and higher levels of corruption (You & Khagram, 2005).
Ethnic Heterogeneity
Higher latitude is correlated with decreased ethnic diversity (Cashdan, 2001; Nettle, 2009, 1998). Nettle (1998) argued that climatic variability (as indicated by length of growing season) leads to loss of language diversity because groups must interact in order to buffer themselves against the harmful effects of climatic variation. Cashdan (2001) proposed that habitat diversity leads to ethnic diversity due to greater niche availability (see also Nettle, 2009). Ethnic diversity in turn is hypothesized to decrease trust (Delhey & Newton, 2005) and decrease economic growth (Alesina, Devleeschauwer, Easterly, Kurlat, & Wacziarg, 2003; Easterly, 2001; Easterly & Levine, 1997), due to social cleavages generated by dissimilarity in beliefs, or more fundamental evolved psychological in-group favoritism/out-group derogation triggered by differences in appearance, language, and behavior.
Economic Growth
The aforementioned factors (disease burden, income inequality, and ethnic diversity) may also influence trust indirectly, by affecting long-term economic development. Economic development has been proposed to weaken the influence of religious institutions (Verweij, Ester, & Nauta, 1997), and there is a strong negative correlation between religiosity and trust (Berggren & Bjørnskov, 2009), perhaps due to the in-group/out-group boundaries generated by religious institutions. Higher trust, greater economic wealth, less religiosity, and lower income inequality may operate in a feedback loop, accelerating societal stability and prosperity. Gallup et al. (1999) consider the effect of geography on economic growth. Using regression analysis and economic growth models, they find that countries whose populations have access to coastal areas or ocean-navigable rivers, and are located in temperate regions, have higher growth rates, presumably due to greater trade and lower disease burdens. Diamond (1997) considers the effect of North–South (such as South America and Africa) versus East–West (ex. Eurasia) geographical axes on the long-term development of societies, and argues that North–South axes hindered societal development, because crop plants adapted to one particular latitude could not be easily transported and then grown in different latitudes. Also, Diamond argues that the distribution of domesticable plants and animals happened to favor Eurasia but not Africa. Miller and Diamond (2006) analyze differences in income between countries within the Americas. They consider a variety of geographical effects: disease burden, agricultural productivity, air-conditioning costs, access to oceans, population density, and mineral abundance. They posit that population density and mineral abundance in turn affected the type of institutions that were fostered by European settlers, with lower population densities and less mineral abundance leading to lower levels of inequality.
The Institutional View
Institutions may constitute another intermediate pathway between geography and societal development. Acemoglu, Johnson, and Robinson (2001) argue that in colonies with high settler mortality due to tropical diseases such as malaria and yellow fever, colonial governments implemented institutions that exploited natural resources and the populace, and these institutions have persisted to this day, slowing economic growth. By contrast, in colonies with low settler mortality, such as Australia and Canada, large numbers of Europeans arrived and succeeding in setting up governments that protected private property and ensured relatively fair distribution of goods. Acemoglu et al. (2001) argue that geographical latitude and culture have no effect on economic growth once institutions are included in regressions on economic growth. Acemoglu et al. (2001) use risk of expropriation as a proxy for institutions that are conducive to economic growth. Acemoglu et al. (2001) reason that tropical diseases have not decreased economic growth because local populations have evolved significant immunity to tropical diseases (leaving only young children vulnerable to malaria, etc.); and tropical regions have had historically high population densities, which, according to Acemoglu et al. (2001), implies that these regions had high levels of economic growth relative to less-populated areas. Acemoglu, Johnson, and Robinson (2002) argue that the historical reversal of fortunes, in which previously prosperous empires such as China and the Ottomans experienced lower economic growth in the last 500 years, was principally a consequence of colonial governments implementing extractive institutions.
The impact of institutions can certainly be seen in the case of North versus South Korea (Acemoglu, Johnson, & Robinson, 2005), and more generally in the poor economic outcomes of communist countries. Acemoglu et al. (2002) argue that settler mortality influenced long-term economic outcomes through the channel of fostering economically conducive or harmful institutions. However, disease may have many other effects on society, by triggering ethnocentrism (Navarrete & Fessler, 2006), reducing the knowledge base provided by the elderly, reducing human capital (from attrition of skilled workers), and so on. If this is true, then the high correlation between disease and risk of expropriation could reflect the multiple pathways in which disease undermines societies, rather than just the effect of settler mortality. Acemoglu et al. (2001) attempt to deal with this potential problem by including controls for current disease level, and using over-identification tests.
Method
The general strategy taken in this study is to compare hypothesized models of geography, trust, and related variables. OLS (Ordinary Least Squares) multiple regressions may be employed to try to assess the effect of latitude and societal variables such as disease burden, ethnic heterogeneity, income/social inequality, life expectancy, religiosity, wealth, and corruption, on trust. However, as can be seen from the correlation matrix in Figure 3, these variables are highly correlated among themselves. 2SLS (Two-Stage Least Squares) analysis may also be attempted, but this depends on the availability of appropriate instrumental variables. Acemoglu et al. (2002) used settler mortality as a proxy for good institutions, in a regression of institutions on economic growth; Berggren and Bjørnskov (2009) used log GDP (Gross Domestic Product) as an instrumental variable for a regression of religiosity on trust. From a theoretical perspective, both of these instruments are potentially problematic, because, as mentioned earlier, disease may have multiple pathways affecting economic growth, other than through settler mortality and institutional development; and GDP may be endogenously affected by trust, similar to the reasoning behind the theory of social capital (ex Arrow, 1972; Fukuyama, 1996, Putnam, 2000).
An alternative strategy is to use SEM. SEM may be regarded as a method of statistical analysis that compares observed covariances with covariances implied by a set of hypothesized relationships. Structural equation models allow for modeling of unobserved variables (i.e., “latent” variables) as well as multilayered causal structures (i.e., “path analysis”). (An introduction to the basic concepts of SEM may be found at http://www.methods.manchester.ac.uk/methods/sem/.) SEM is attractive for the purpose of studying the relationship between geography and trust, due to its ability to include latent variables. The chief point of contention among researchers studying the determinants of societal development concerns causality. Few would dispute that wealth, life expectancy, societal trust, control of corruption, disease burden, and religiosity covary. The problem is in assigning causality: is it low religiosity that leads to increase in trust (Berggren & Bjørnskov, 2009), or vice versa? Is it disease that leads to lower economic growth (Gallup et al., 1999), or the other way around? Conceptually, one may regard some of these societal characteristics as being indicators of underlying latent factors, such as societal heterogeneity or the viability of a society. In this study, three different models of relationships between societal trust, geographical factors, and related key societal variables (disease burden, income inequality, ethnic, linguistic and religious heterogeneity, wealth, life expectancy, control of corruption, and religiosity) are compared in terms of fit.
Mplus ver. 6 was used to conduct SEM analyses. Mplus uses the method of “full information maximum likelihood (FIML)” to generate predicted matrices of correlations/covariances for cases of missing data points (Muthen and Muthen, 2010). This method assumes a multivariate normal distribution (Enders, 2001).
Description of Variables
Data was gathered from the following sources:
Trust (avg_wv): World Values Survey, http://www.worldvaluessurvey.org/. Five waves: 1981-1984, 1989-1993, 1994-1999, 1999-2004, 2005-2008. The World Values Survey (WVS) is a large cross-country survey coordinated by the Institute for Social Research of the University of Michigan. Approximately 1,000 people from each country are surveyed, preferably by face-to-face interviews, although some postal interviews were done (e.g., in Japan, 2001 survey: http://www.wvsevsdb.com/wvs/WVSTechnical.jsp?Idioma=I). The following question was used from the WVS: “Generally speaking, would you say that most people can be trusted or that you need to be very careful in dealing with people?” Possible responses were as follows: (a) “Most people can be trusted,” (b) “Can’t be too careful,” (c) “Don’t know,” (d) “No answer.” Data was obtained from 99 geopolitical entities. Each data point consists of the proportion of people in each country who chose answer 1 relative to the proportion of people who chose either answer 1 or answer 2. A striking pattern (see Figure 1) is that in countries located further from the equator, a greater proportion of respondents select answer 1, “Most people can be trusted,” relative to answer 2, “Need to be very careful” (Spearman’s rho = 0.487, p < .001, n = 99). SEM modelers generally prefer sample sizes of 200 or more cases, and thus the availability of 99 countries with data on this WVS measure of trust is an important limitation. Use of smaller datasets can provide convergent solutions, however (ex. Iacobucci, 2010). As the available data for WVS trust increases with subsequent waves of surveys, the stability of SEM models in this area will improve.
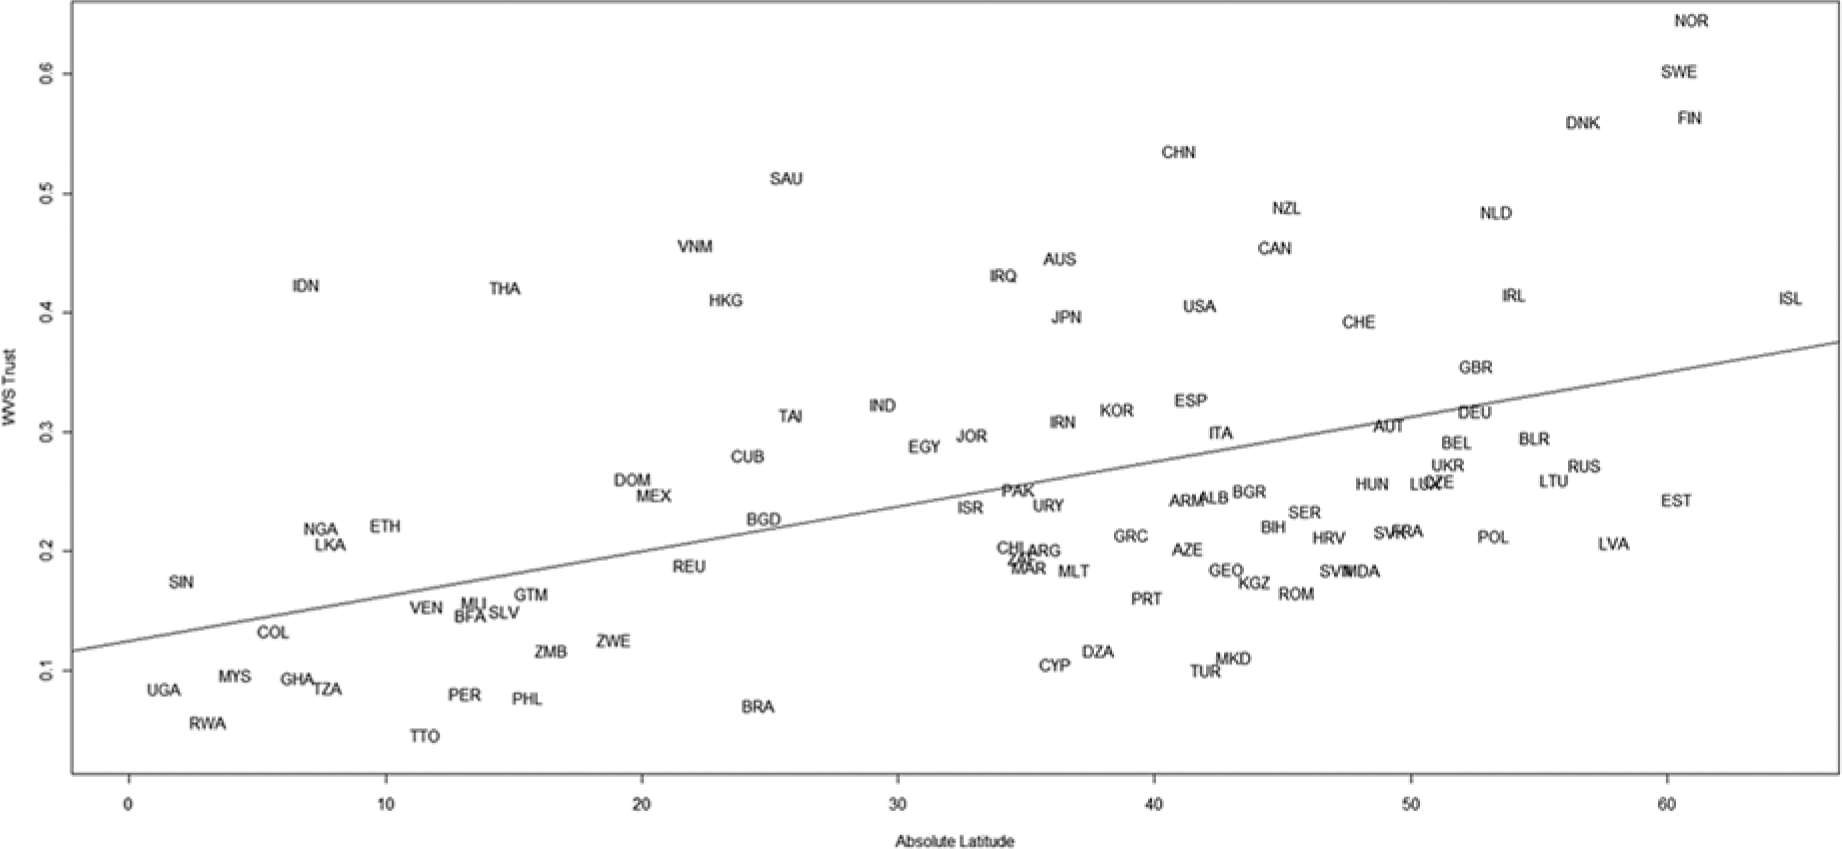
Spearman’s correlation between absolute latitude and WVS trust question, for world: rho 0.487, p < .001, n = 99.
The positive relationship between latitude and trust holds true even within subregions of the world (see Figure 2).
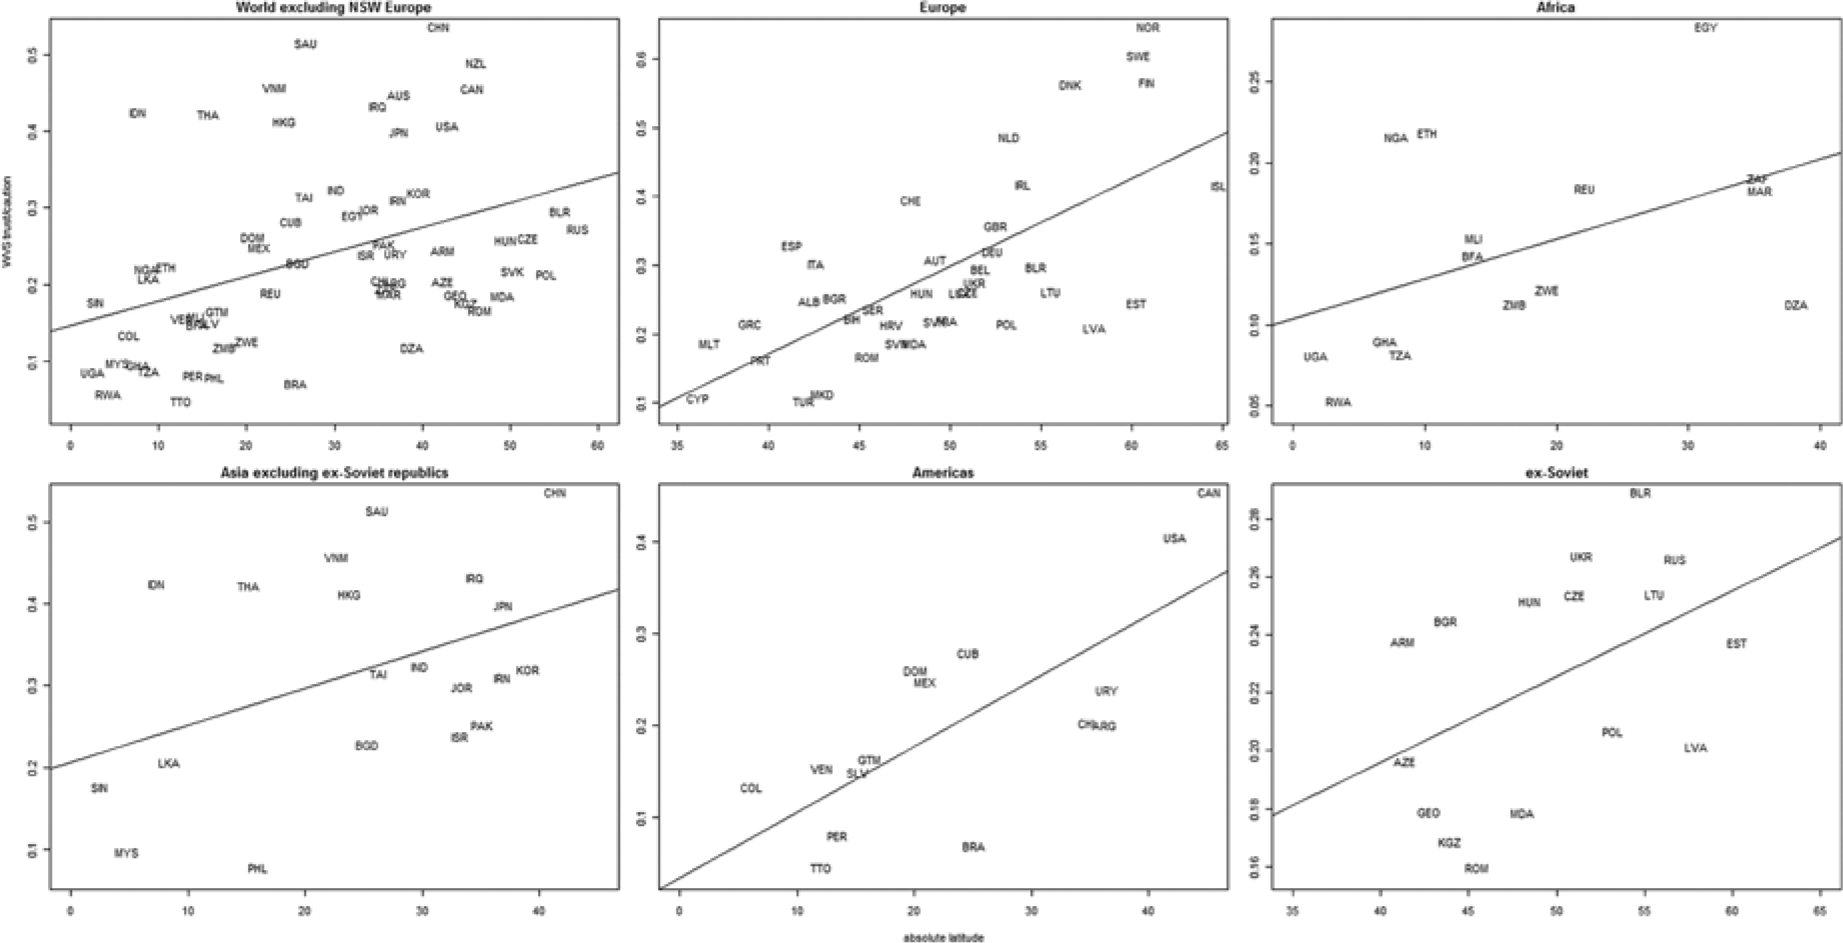
Spearman’s correlation between absolute latitude and WVS trust question, for: world excluding Northern, Southern, and Western Europe: Spearman’s rho = 0.462, p < .001, n = 65; Europe: Spearman’s rho = 0.648, p < .001, n = 40; Africa: Spearman’s rho: 0.479, p = .071, n = 15; Asia excluding ex-Soviet Republics: Spearman’s rho = 0.355, p-value = .19, n = 20; Americas: Spearman’s rho = 0.7, p = .003, n = 16; ex-Soviet republics: rho = 0.441, p = .089, n =16.
Geographical latitude (lat_abs): Centre d’Etudes Prospectives et d’Informations Internationales, http://www.cepii.fr/anglaisgraph/bdd/bdd.htm. Latitude was provided for either the capital city or the most populated city. The absolute value of the latitude was obtained. Data was obtained for 243 geopolitical regions (countries or territories).
Heterogeneity: Alesina et al. (2003). Probability that two randomly selected individuals belong to different ethnic (ethnfrac), language (langfrac), and religious groups (relifrac). Language and religious data was obtained from Encyclopedia Britannica; ethnic data from Encyclopedia Britannica, CIA Factbook, and other sources. Data on ethnic, linguistic, and religious heterogeneity was obtained for 190, 200, and 212 geopolitical regions respectively. These data are in the form of proportions.
Religiosity (gallup09): Gallup survey 2009, https://worldview.gallup.com/signin/login.aspx. Response to question, “Is religion an important part of your life?” 1,000 respondents were interviewed face-to-face or by telephone in each of 143 countries. The methodology employed by Gallup for such polls is described at http://www.gallup.com/poll/105226/world-poll-methodology.aspx.
Disease (dis_6): Murray and Schaller (2010). Six-disease index (leishmanias, schistosomes, trypanosomes, typhus, filariae, dengue) obtained from medical atlases. A 4-point coding scheme was employed: 0 = completely absent or never reported, 1 = rarely reported, 2 = sporadically or moderately reported, 3 = present at severe levels or epidemic levels at least once. All disease prevalence ratings were standardized by conversion to z scores. Each overall disease prevalence index was then computed as the mean of z scores of the items included in the index. Hence, for each overall index, the mean is approximately zero; positive scores indicate disease prevalence that is higher than the mean, and negative scores indicate disease prevalence that is lower than the mean. Data was obtained for 229 geopolitical regions. Disease index scores ranged from −1.18 (Canada) to 1.2 (Cameroon).
Gini coefficient (measure of inequality; gini), average life expectancy (avg_life), and gross domestic product (GDP, purchasing price parity, Atlas Method) values were obtained from the World Bank World Development Indicators, for all years from 1981 to 2008 (http://ddp-ext.worldbank.org/ext/DDPQQ/member.do?method=getMembers&userid=1&queryId=6), and averaged.
Corruption (avg_corr): World Bank Worldwide Governance Indicators (WGI) Project, http://info.worldbank.org/governance/wgi/index.asp. The Control of Corruption index was intended to denote “perceptions of the extent to which public power is exercised for private gain, including both petty and grand forms of corruption, as well as ‘capture’ of the state by elites and private interests” (Kaufmann et al., 1999, p. 6). An unobserved components model was used to construct an estimate of perceived corruption, using a weighted average of the standardized scores from each data source, with the weight proportional to the precision of the data source. To construct the index 2,125 data points were used. To compile the WGI data, 35 separate data sources constructed by 33 different organizations were used. Corruption estimates from 1996 to 2008 (1996, 1998, 2000, 2002-2008) were obtained and averaged. Average corruption scores were available for 209 geopolitical entities. Values ranged from a low of −1.788 (Somalia) to 2.400 (Finland).
Terrain ruggedness (rugrt3): Nunn and Puga (2012) obtained their terrain ruggedness index by calculating the square root of the sum of the squared differences in elevation between a central point and eight adjacent points corresponding to the major directions of the compass, 30 arc-sec apart. Measurement units are in hundreds of meters of elevation difference for grid points 30 arc-sec (926 m on a meridian) apart.
Coastal access (pop100cr): Gallup et al. (1999) calculated this index by finding the proportion of a country’s population in 1994 within 100 km of the coast or an ocean-navigable river, excluding coastline in the Arctic.
Institutional development: Freedom House is an NGO based in Washington, DC, which assigns ratings of political rights and civil liberties to 194 countries (Puddington, 2011). The score used in this study was the average of political rights and civil liberties, from 1972 to 2010. This time period represents the broadest range of data available for this measure. As with all measures used in this study, an average of the broadest range available was selected in order to obtain a measure representative over a long time interval; this study is concerned with long-term changes on the scale of decades and centuries, rather than short-term fluctuations.
All geopolitical regions with data for the corruption score were selected for analysis in this study, which gave a total of 209 geopolitical regions. Missing data points are handled in Mplus using FIML estimation (Muthen & Muthen, 2010). This method assumes that missing data points are missing at random (MAR); in other words, missing values are assumed to be functions of observed covariates and observed outcomes (Muthen & Muthen, 2010). The SEM analyses were also rerun with only geopolitical regions that had data on the WVS scores on societal trust, which yielded a total of 99 geopolitical regions; SEM results were qualitatively similar to those described below.
Figure 3 presents Spearman’s correlation results for absolute latitude, terrain ruggedness, coastal access, and a number of societal variables. Observations are restricted to geopolitical entities with populations of greater than one million people.

Spearman’s correlation results for variables of interest. Observations are restricted to geopolitical entities with populations of greater than one million people. ***p < .001, **p < .01, *p < .05, ∙p < .1.
Higher absolute latitude correlates with less ethnic heterogeneity, less linguistic heterogeneity, lower Gini income inequality, lower historical disease burden, lower religiosity, higher life expectancy, greater trust in strangers, greater control of corruption, and higher GDP (averaged over the period 1981 to 2008), in the expected directions (see Introduction). The proportion of people living within 100 km of ice-free coast or navigable river correlates moderately with absolute geographical latitude; thus, even this variable is endogenously related to latitude. This makes sense, considering the difficulty of practicing agriculture or transportation far from coastline or rivers in sub-Arctic regions in countries such as Russia, Canada, and so forth; temperatures are moderated by large bodies of water. Control of corruption is highly correlated with wealth; this may be due to the beneficial impact of wealth in paying officials sufficient salaries to mitigate corruption; it may also reflect the fact that the control of corruption measure is based on third party assessments, and these assessors may have theories of modernity and the link between corruption and wealth in their minds when they conduct their ratings (Treisman, 2007); in other words, these ratings may be biased by the raters’ subjective theories regarding corruption. We also note that the correlation between these variables may represent feedback effects between these characteristics. The issue of feedback will be addressed in the discussion section.
Model A
In this study, three SEM models of hypothesized relationships between geographical variables, trust, and related variables are compared. Model A (Figure 4) allows variables to interact according to the hypotheses presented in the literature review section. Causation is hypothesized to run from left to right. The leftmost variable is geographical latitude, which is hypothesized to reduce inequality, reduce historical disease burden (Wolfe et al., 2007), and reduce social heterogeneity (a latent variable representing ethnic, linguistic, and religious heterogeneity) (Cashdan, 2001; Nettle, 1998, 2009). Historical disease burden is hypothesized to increase social heterogeneity (Fincher et al., 2008; Navarrete & Fessler, 2006). Less income inequality, less historical disease burden, and less social heterogeneity in turn are hypothesized to increase economic wealth (ex. Easterly, 2001; Easterly & Levine, 1997; Alesina et al., 2003); less historical disease burden and higher GDP are hypothesized to increase life expectancy; greater economic wealth is hypothesized to decrease religiosity (Verweij et al., 1997). Both higher GDP and higher life expectancy are hypothesized to decrease religiosity. Higher GDP, and less income inequality, less historical disease burden, less social heterogeneity, and less religiosity are hypothesized to increase control of corruption and increase trust (Delhey & Newton, 2005; Uslaner & Brown, 2005; You & Khagram, 2005), and greater control of corruption is hypothesized to increase trust. Note that in model A, the interactions between GDP and trust, between GDP and control of corruption, and between control of corruption and trust, may be 2-way interactions; model B will address this issue.

SEM Model A. Straight arrows represent regression paths, with standardized regression estimates given above; all estimates are significant at p < .05, except dotted arrows, which represent nonsignificant paths. Residual variances indicated by arrows for manifest variables. Variables described in detail in text. Results of model given in Appendix.
Model B
In model B (Figure 5), a latent factor labeled virtuous is used to represent a set of societal characteristics—wealth, increased life expectancy, greater trust, and lower religiosity—that are hypothesized to have positively reinforced one another over historical time in a feedback circuit. This reflects the specific hypotheses presented in the literature review section, and tries to address the concern of Delhey and Newton that
generalized social trust is tightly integrated into a single syndrome of ethnical/cultural, social, economic, and structural conditions which are either theoretically or empirically linked, and usually both . . . Trust is tangled up as both cause and effect with these conditions (Delhey and Newton, 2005).
SEM Model B. Straight arrows represent regression paths, with standardized regression estimates given above; all estimates are significant at p < .05, except dotted arrows, which represent nonsignificant paths. Residual variances indicated by arrows for manifest variables. Variables described in detail in text. Results of model given in Appendix.
Rather than trying to disentangle the syndrome of conditions associated with trust, the latent variable virtuous captures the feedback effects among these variables over historical time. Trust is chosen as the indicator variable that most closely reflects the concept of the latent factor virtuous, in line with recent research highlighting the centrality of societal trust in the development of societies, as noted earlier; trust is given a factor loading of 1 on virtuous.
Model C
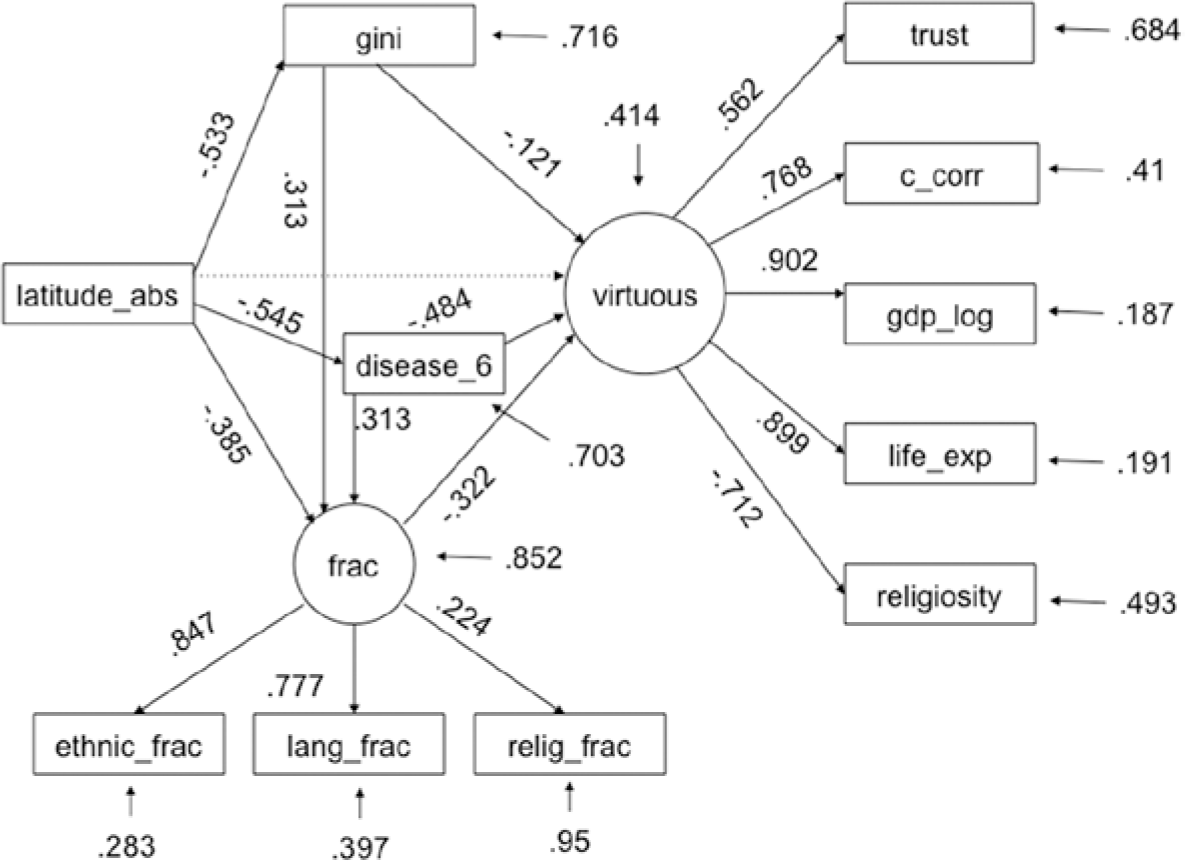
Model C (Figure 6) adds a series of refinements to Model B, according to theory: religious heterogeneity is hypothesized to correlate positively with religiosity, GDP correlates positively with control of corruption, life expectancy correlates positively with GDP, trust correlates positively with control of corruption, life expectancy positively affects control of corruption (shorter time horizons may result in increased tendency to cheat on public goods). The path between greater control of corruption and higher GDP reflects the idea that increased wealth may improve a government’s ability to pay higher salaries to government officials and thereby mitigate official corruption. The path between greater control of corruption and higher GDP may also reflect the bias of observers, whose judgments may be influenced by their own theories of modernization and corruption (Treisman, 2007). The path between higher GDP and higher life expectancy embodies the notion that improved wealth and improved life expectancy may mutually reinforce one another beyond the general societal feedback effect implied by the virtuous circle factor.

SEM Model C. Straight arrows represent regression paths, with standardized regression estimates given above; all estimates are significant at p < .05, except dotted arrows, which represent nonsignificant paths. Residual variances indicated by arrows for manifest variables. Curved arrows represent correlations. Variables described in detail in text. Results of model given in Appendix.
Results
Following analysis of normality in Stata 10.1 and Excel, the following variables were transformed using the square root function to obtain a normal distribution: absolute latitude, linguistic heterogeneity, and the World Values survey proportional measure of trust. Log of GDP was used to derive a normal distribution of GDP. pop100cr was transformed using a cubic root transformation. Models A through C were analyzed in Mplus ver. 6.11. Unstandardized and standardized effect sizes, standard errors, and R2 values are reported in the Appendix.
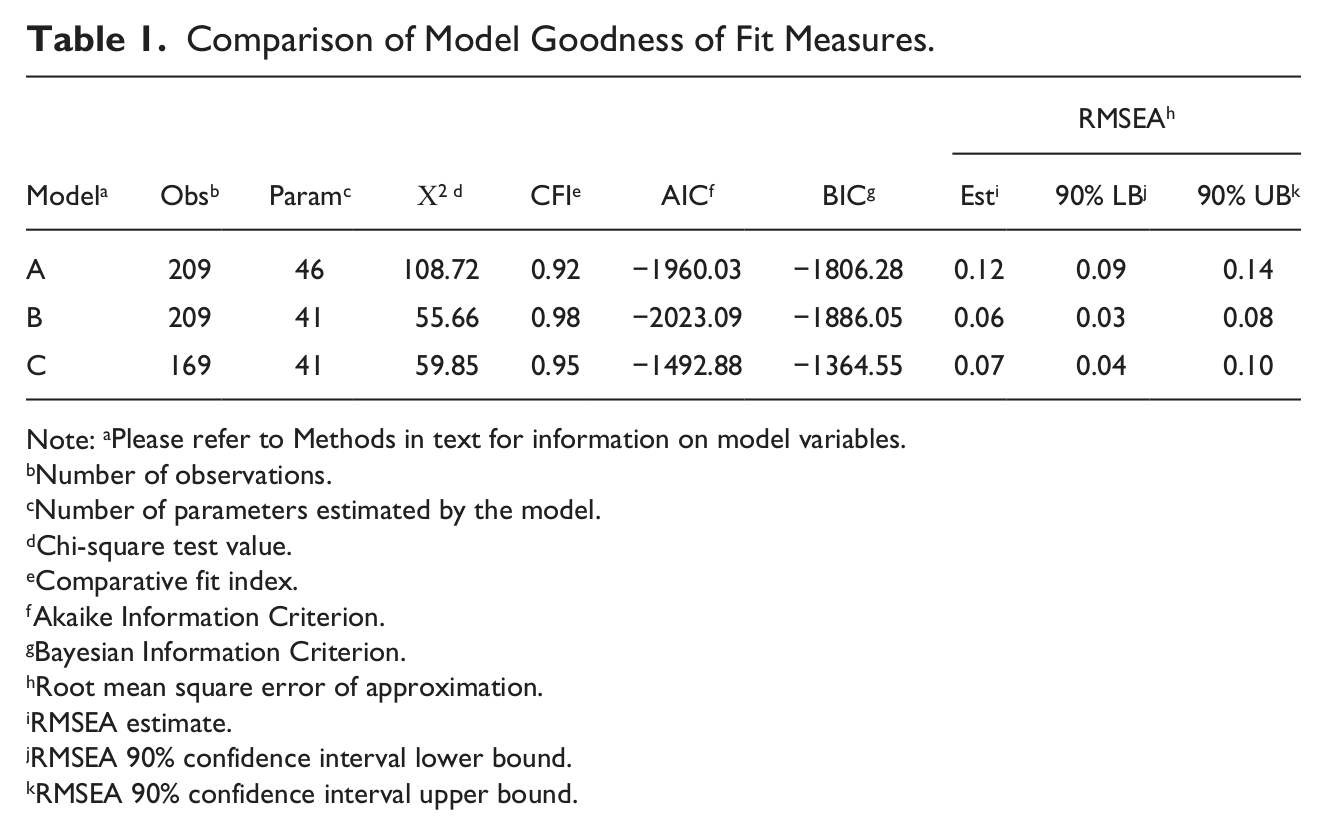
Considering parsimony-adjusted indices (see table 1), Model C, the model that has the latent variable of “virtuous” and has corrections for additional correlations among endogenous manifest variables, fares best, with the highest CFI (comparative fit index) score, and the lowest AIC (Akaike information criterion), BIC (Bayesian information criterion), and RMSEA (root mean square error of approximation) values, and thus provides the best fit of model to data, controlling for the addition of free parameters (Kline, 2005). Model A, a path model without the latent variable “virtuous,” also fares well among the models in terms of the CFI, AIC, and BIC indices, but poorly with respect to the RMSEA confidence interval.
Comparison of Model Goodness of Fit Measures.
Note: aPlease refer to Methods in text for information on model variables.
Number of observations.
Number of parameters estimated by the model.
Chi-square test value.
Comparative fit index.
Akaike Information Criterion.
Bayesian Information Criterion.
Root mean square error of approximation.
RMSEA estimate.
RMSEA 90% confidence interval lower bound.
RMSEA 90% confidence interval upper bound.
In addition, a number of robustness checks were carried out (parameter estimates not reported in Appendix; available upon request). Model C was run with Europe excluded from the dataset, since conditions unique to Europe may have allowed it to exert a disproportionate effect on the outcome of societies. Removing Europe from the dataset results in slight loss of model fit. To test continental effects, four dummy variables representing continents (Africa, Americas, Asia, and Europe; Oceania is the reference continent) were added as exogenous variables alongside geographical latitude in Model C. Adding dummy variables representing continents results in improved AIC and BIC scores compared to Model C.
To test the effects of terrain ruggedness and access to coastline, these variables were added to Model C, but this does not improve model fit. Finally, the Freedom House measures of political rights and civil liberties were added to Model C, in order to test whether the inclusion of a measure of institutional development improves model fit. The addition of the Freedom House measures of political rights and civil liberties results in a slight decrease in model fit with respect to the AIC, BIC, RMSEA, CFI, and TLI measures.
Discussion
Among the various models examined in this study, strongest support was found for the hypothesis that higher absolute geographical latitude leads to lower levels of disease burden, less ethnic and linguistic heterogeneity, and less income inequality. More terrain ruggedness leads to greater ethnic and linguistic heterogeneity, while population living with 100 km of ice-free coastline or navigable rivers had no effect on disease burden, ethnic, linguistic, or religious heterogeneity, or income inequality when included in SEM models with geographical latitude and terrain ruggedness. Lower disease burden, less ethnic and less linguistic heterogeneity, and less income inequality in turn then apparently set the conditions for a virtuous, mutually reinforcing circle of endogenous variables: greater economic wealth, higher life expectancy, greater control of corruption, and greater trust. The reason these models achieved high fit is in part because a latent variable called virtuous captures the high correlation among the endogenous variables. The same effect can be achieved by “hand-wiring” paths among many variables, but the addition of parameters in this fashion will cause the model to achieve poorer fit in parsimony-adjusted indices.
Disease Burden
Historical disease burden turns out to be the most robust predictor of the latent construct virtuous, with highly significant (p < .001) standardized effect sizes. Disease is thus a surprisingly robust predictor of the development of societies. Besides the costs inflicted by increased health care burden, infectious diseases may exacerbate mistrust at a psychological level, and also increase the tendency toward ethnic, linguistic, and religious heterogeneity, as previously noted. However, since the measure of disease burden was necessarily constructed from fairly recent medical data, this measure of disease burden may also suffer from problems of endogeneity with economic growth and life expectancy, and therefore present an inflated correlation with the latent construct virtuous. More reliable estimates will be obtained as deeper historical data on disease burden becomes available.
Income Inequality
The link between income inequality and the virtuous circle appears relatively weak, with standardized effect sizes about 1/3 that of historical disease burden across all models with virtuous included. As mentioned previously, empirical studies show that income inequality may exacerbate mistrust and be causally linked to homicide rates, and thus it seems surprising that inequality should have such weak links to societal development. One possible reason for this situation may be that income inequality promotes status competition, and therefore leads to stronger economic growth, though potentially at a cost to net social and environmental welfare. Conversely, income redistribution is often theorized to act as a brake on economic growth by reducing marginal profit or income accumulation. Future studies could consider curvilinear relationships between income inequality and societal development, to see which levels of inequality are optimal for fostering societal development.
Continental Effects
As a robustness check, analysis of continental effects (Africa, America, Asia, Europe, and Oceania) on disease burden, ethnic, linguistic, and religious heterogeneity, income inequality, and the virtuous circle was carried out. Africa has the largest standardized effect sizes for disease burden (0.207, p < .000), and also for the latent variable representing ethnic, linguistic, and religious heterogeneity (0.207, p < .000). Europe is the only continent with a significant dummy standardized effect on inequality (−1.00, p < .011). Even with continental effects added, latitude still remains a significant predictor of disease burden and ethnic, linguistic, and religious heterogeneity, but not income inequality.
The Case of Russia/USSR
In discussions of this article with academic audiences, the question often arises: if geographical latitude predicts societal trust and societal development, how can we explain the case of Russia/USSR? In a simple regression of the WVS measure of trust on geographical latitude, with ex-Soviet bloc status added as a dummy variable, ex-Soviet bloc status predicts a reduction of 12% points in the WVS trust score (β = −0.12, t(96) = −3.75, p = .00031). However, even within the ex-Soviet bloc, geographical latitude correlates with WVS societal trust in the predicted direction, albeit at a marginal significance level (β = 0.0030, t(14) = 1.97, p = .070). Thus, a possible interpretation is that the imposition and/or subsequent dissolution of communism resulted in a net reduction of societal trust, independent of the trend between geographical latitude and societal trust.
Religious Heterogeneity
Across models, religious heterogeneity fits poorly within the social heterogeneity latent factor (comprised of ethnic, linguistic, and religious heterogeneity). Alesina et al. (2003) argue that religious diversity flourishes in tolerant, economically developed societies such as the United States, due in significant part to government intervention. On the other hand, in such societies, there is a tendency toward ethnic and linguistic homogenization. Thus, the link between religious heterogeneity on the one hand, and ethnic and linguistic heterogeneity on the other hand, is weakened.
Institutions
The effect of institutions was modeled using free, based on the Freedom House measures of political rights and civil liberties. This measure was found to correlate moderately with the other indicator variables of virtuous. In other words, political rights and civil liberties may be interpreted as endogenous with the other factors that lead to economic and societal development.
General Trust Versus Reassurance
Yamagishi (2011) notes that the WVS societal trust survey measure has a potential problem. The first part of the question asks whether people can be trusted; the second part asks whether caution is required in dealing with people. Trust and caution are not necessarily two ends of a spectrum. Person A may feel reassured that Person B will not rob her, but since Person B may be restrained by police and general security, this is distinct from whether Person B has fundamentally good intentions toward Person A. Accordingly, Yamagishi (2011) distinguishes between general trust and reassurance. Other, more recent survey questions in the WVS may be more suitable for tapping into general trust. For example, the most recent wave of the World Values Survey (2005-2008) posed the following question: “I’d like to ask you how much you trust people from various groups. Could you tell me for each group whether you trust people from this group completely, somewhat, not very much or not at all? People you meet for the first time.” Responses of “completely” or “somewhat” to this question were coded as a single variable called trust_strangers. Fifty-one countries provided data on this survey question. A regression of trust_strangers on latitude is significant (β = 0.0025, t(48) = 2.103, p = .041), but when a dummy for Northern, Western, and Southern Europe is added, neither latitude nor the dummy variable are significant predictors of trust_strangers. This raises the possibility that the relationship between trust in strangers and latitude was driven by historical circumstances unique to Northern, Western, and Southern Europe, such as the development of democracy, while the relationship between trust plus reassurance with latitude was driven by differences in economic development among countries. Similarly, Asia emerges as a significant dummy predictor variable when regressing the trust question that asks about both trust and reassurance (avg_wv) on latitude, but is no longer significant in a regression of trust_strangers on latitude.

A possible interpretation of this result is that governments in Asia have been able to create peaceful societies through top-down administration, but this type of trust is relatively thin, and people actually mistrust one in the absence of institutional safeguards. This interpretation is consistent with research conducted by Yamagishi and colleagues (summarized in Yamagishi, 2011). The question about trust in strangers was only recently added to the World Values Survey, and hence data is available for only a small sample of countries for this measure. Future studies will have access to more data on trust in strangers, and allow researchers to delve into this issue in more detail.
Feedback Loops
A limitation of using SEM techniques in a cross-sectional analysis involving feedback loops is that the systems being analyzed are ideally at equilibrium (Kline, 2005). Snapshots of systems at various points in oscillatory cycles may yield different estimates of effect sizes. Since the data for this study were collected from countries at different points in their oscillatory societal cycles, and some traits (GDP, Gini, societal trust, and average life expectancy; and to a more limited extent, corruption) were averaged over two decades, effect sizes will tend to average out. However, if there is correlation between oscillatory societal phases, then effect sizes may shift depending on the point of data collection. The most vulnerable variable in this regard is religiosity, for which only one data point could be collected for each country, and hence effect sizes associated with religiosity need to be replicated in future studies.
Footnotes
Appendix
Parameter coefficients for model C.
| Parameter 1 | Parameter 2 | U | USE | S | SE |
|---|---|---|---|---|---|
| FRAC.BY | LANGFRAC | 1 | 0 | 0.715 | 0.054 |
| FRAC.BY | ETHNFRAC | 1.293 | 0.17 | 0.915 | 0.053 |
| FRAC.BY | RELIFRAC | 0.203 | 0.095 | 0.161 | 0.076 |
| VIRTUOUS.BY | GDP | 1 | 0 | 0.687 | 0.045 |
| VIRTUOUS.BY | AVG_LIFE | 0.087 | 0.005 | 0.765 | 0.036 |
| VIRTUOUS.BY | AVG_WV | 0.094 | 0.015 | 0.624 | 0.066 |
| VIRTUOUS.BY | AVG_CORR | 0.042 | 0.011 | 0.37 | 0.096 |
| VIRTUOUS.BY | GALLUP09 | −0.23 | 0.024 | −0.825 | 0.033 |
| VIRTUOUS.ON | FRAC | −1.565 | 0.355 | −0.331 | 0.069 |
| FRAC.ON | LAT_ABS | −0.212 | 0.086 | −0.211 | 0.083 |
| FRAC.ON | DIS_6 | 0.952 | 0.265 | 0.324 | 0.082 |
| VIRTUOUS.ON | DIS_6 | −6.56 | 1.094 | −0.473 | 0.067 |
| VIRTUOUS.ON | GINI | −1.707 | 0.599 | −0.191 | 0.066 |
| VIRTUOUS.ON | LAT_ABS | 0.902 | 0.363 | 0.19 | 0.076 |
| DIS_6.ON | LAT_ABS | −0.186 | 0.02 | −0.546 | 0.049 |
| GINI.ON | LAT_ABS | −0.28 | 0.036 | −0.529 | 0.057 |
| AVG_CORR.ON | AVG_LIFE | 0.379 | 0.093 | 0.377 | 0.09 |
| RELIFRAC.WITH | GALLUP09 | −0.014 | 0.003 | −0.467 | 0.079 |
| GDP.WITH | AVG_CORR | 0.022 | 0.004 | 0.345 | 0.051 |
| AVG_LIFE.WITH | GDP | 0.039 | 0.006 | 0.685 | 0.045 |
| AVG_WV.WITH | AVG_CORR | 0.001 | 0.001 | 0.13 | 0.091 |
| Intercepts | GDP | −2.772 | 0.359 | −2.237 | 0.315 |
| Intercepts | AVG_LIFE | 0.68 | 0.031 | 7.009 | 0.466 |
| Intercepts | DIS_6 | 0.095 | 0.01 | 1.544 | 0.131 |
| Intercepts | GALLUP09 | 0.67 | 0.083 | 2.819 | 0.382 |
| Intercepts | ETHNFRAC | 0.547 | 0.056 | 2.148 | 0.231 |
| Intercepts | LANGFRAC | 0.651 | 0.045 | 2.584 | 0.202 |
| Intercepts | RELIFRAC | 0.459 | 0.02 | 2.024 | 0.128 |
| Intercepts | GINI | 0.544 | 0.019 | 5.716 | 0.268 |
| Intercepts | AVG_CORR | −0.243 | 0.065 | −2.495 | 0.659 |
| Intercepts | AVG_WV | 0.473 | 0.035 | 3.695 | 0.373 |
| Residual.Variances | GDP | 0.812 | 0.102 | 0.529 | 0.062 |
| Residual.Variances | AVG_LIFE | 0.004 | 0.001 | 0.415 | 0.056 |
| Residual.Variances | DIS_6 | 0.003 | 0 | 0.702 | 0.053 |
| Residual.Variances | GALLUP09 | 0.018 | 0.003 | 0.319 | 0.055 |
| Residual.Variances | ETHNFRAC | 0.011 | 0.006 | 0.162 | 0.097 |
| Residual.Variances | LANGFRAC | 0.031 | 0.005 | 0.489 | 0.077 |
| Residual.Variances | RELIFRAC | 0.05 | 0.005 | 0.974 | 0.025 |
| Residual.Variances | GINI | 0.007 | 0.001 | 0.72 | 0.06 |
| Residual.Variances | AVG_CORR | 0.005 | 0.001 | 0.507 | 0.053 |
| Residual.Variances | AVG_WV | 0.01 | 0.002 | 0.611 | 0.083 |
| Residual.Variances | FRAC | 0.025 | 0.005 | 0.776 | 0.058 |
| Residual.Variances | VIRTUOUS | 0.14 | 0.045 | 0.194 | 0.053 |
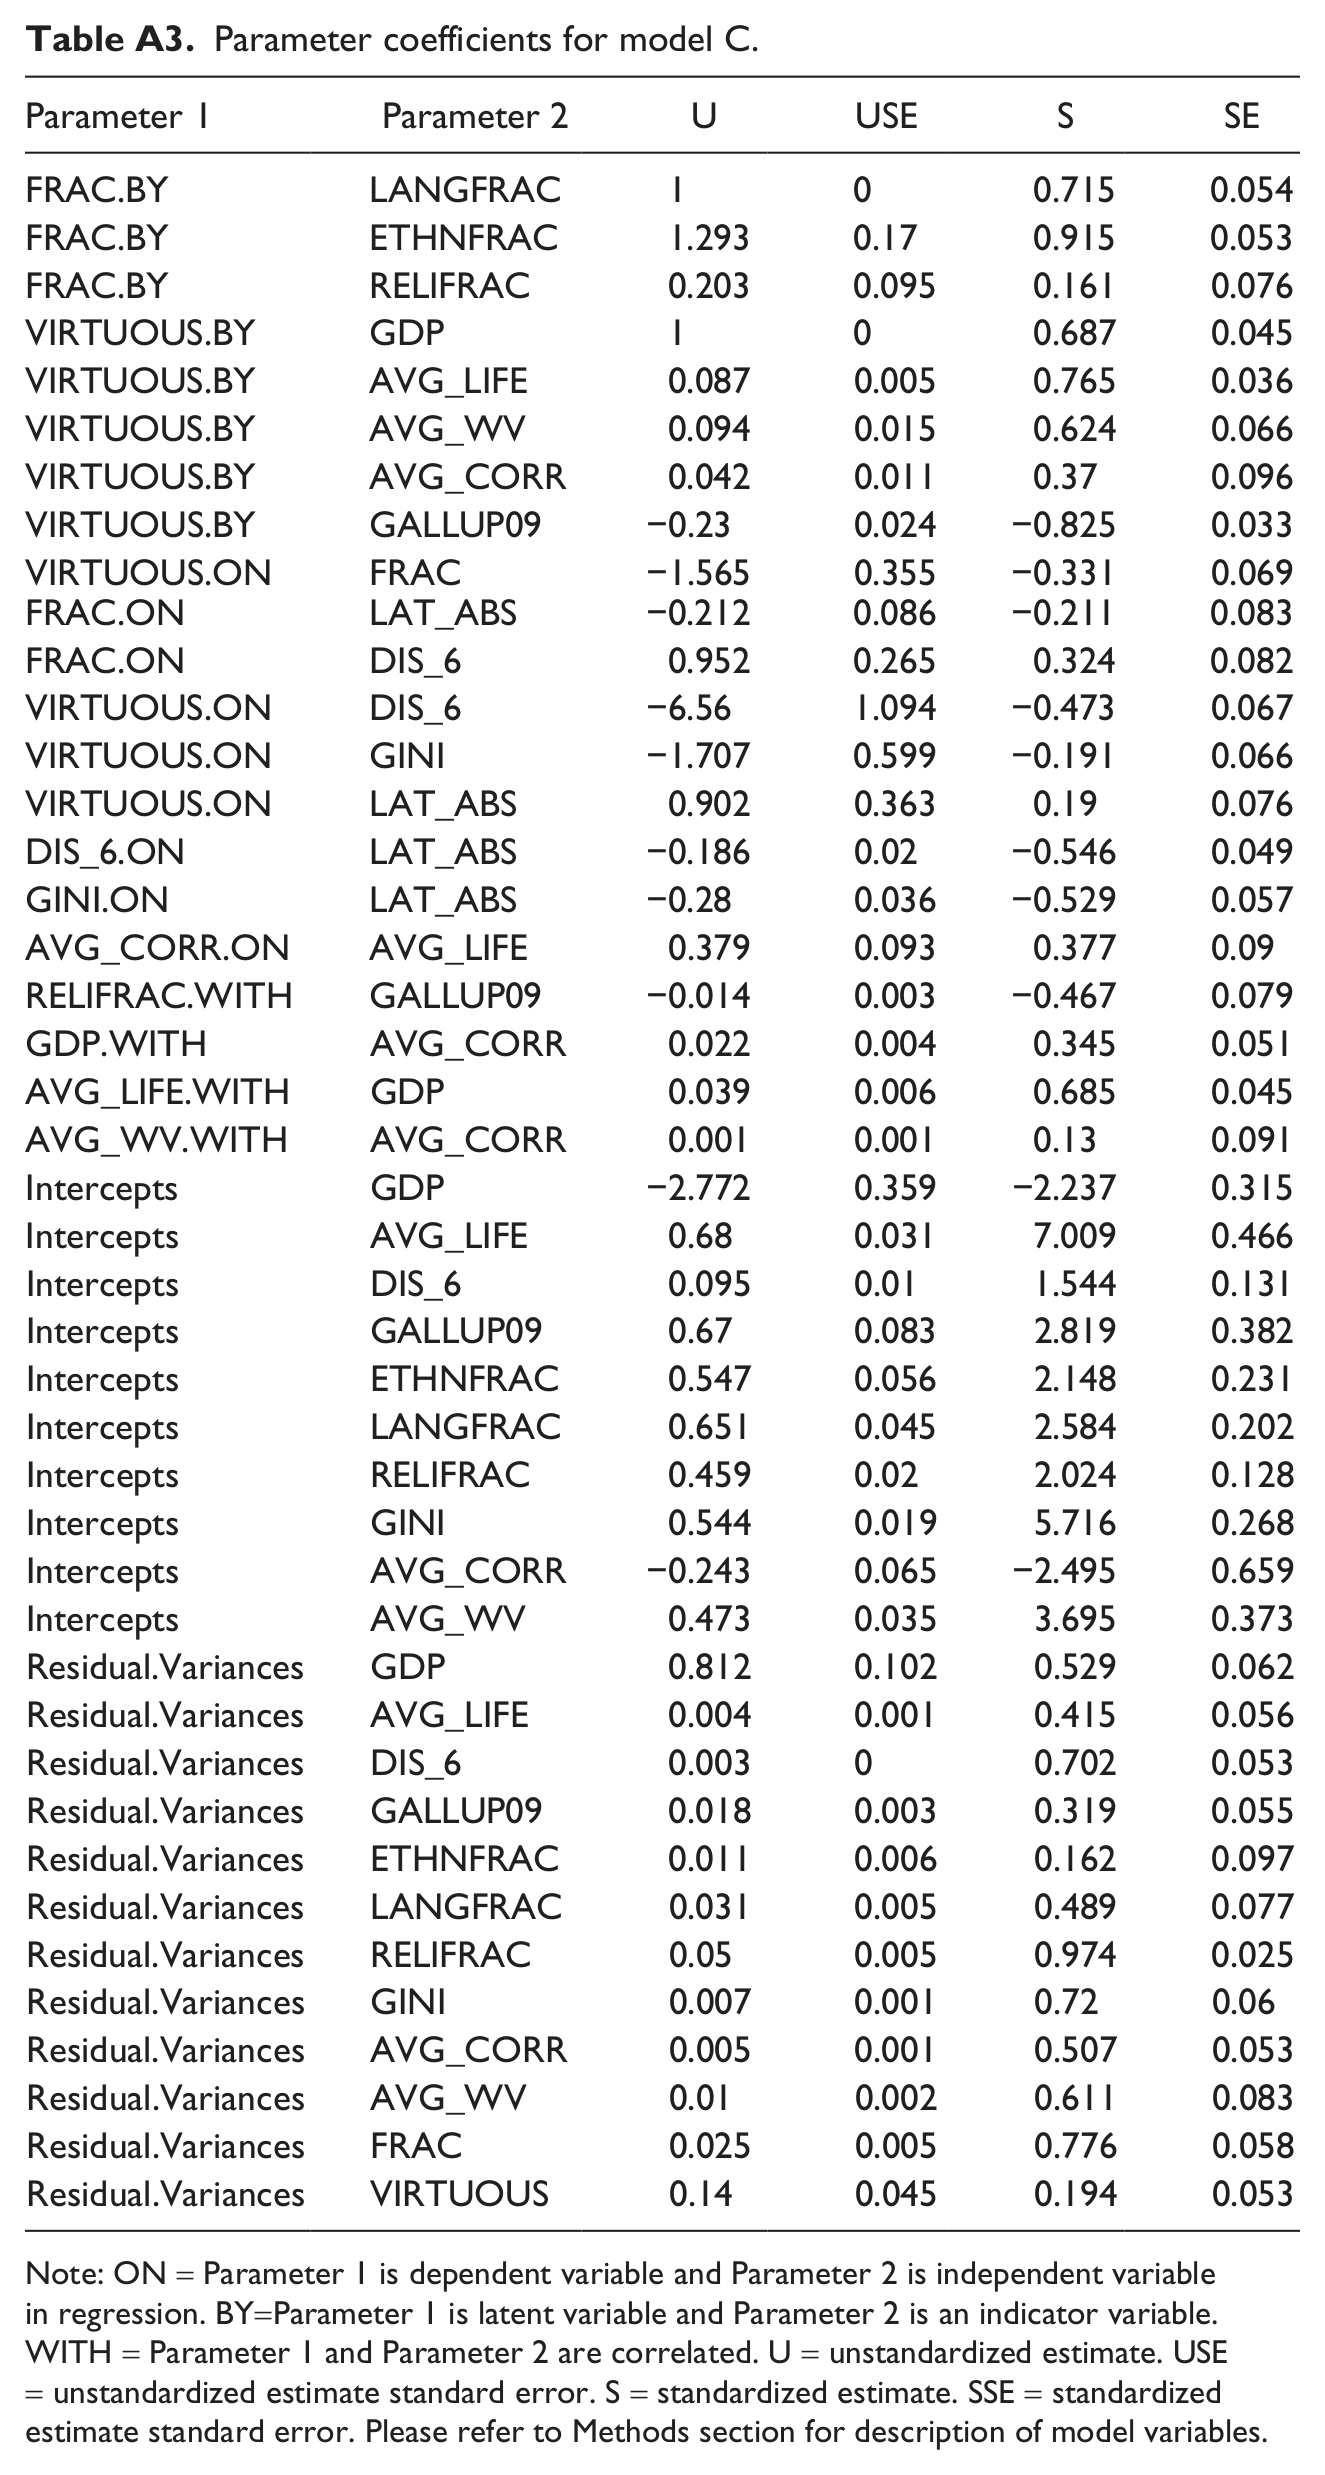
Note: ON = Parameter 1 is dependent variable and Parameter 2 is independent variable in regression. BY=Parameter 1 is latent variable and Parameter 2 is an indicator variable. WITH = Parameter 1 and Parameter 2 are correlated. U = unstandardized estimate. USE = unstandardized estimate standard error. S = standardized estimate. SSE = standardized estimate standard error. Please refer to Methods section for description of model variables.
Acknowledgements
The author would like to thank Keigo Inukai, Toshio Yamagishi, Rob Boyd, Joan Silk, Dan Fessler, Jared Diamond, Helena Pettersson, Linus Holm, and Daniel Treisman for helpful comments.
Declaration of Conflicting Interests
The author declared no potential conflicts of interest with respect to the research, authorship, and/or publication of this article.
Funding
The author disclosed receipt of the following financial support for the research, authorship, and/or publication of this article: This research was supported in part by the Japan Society for the Promotion of Science (grant ID number PE11030).