
Abstract
Since Hofstede introduced his approach to understanding cultural differences through dimensions of national culture, various authors have presented their own dimensions, sometimes similar, sometimes different, and sometimes partially overlapping. The status quo in the development of research on cultural dimensions can now be qualified by two words: enriched and messy. Some scholars have attempted to bring the most likely common denominators of the dimensions together in an overview, but these attempts were based on ad hoc considerations and common sense. The goal of this article is to come to a synthesis of the insights from relevant authors and present a set of clusters of cultural dimensions based on systematic theoretical and statistical analysis. This is done by testing the conceptually established clusters through an ecological factor analysis. We included the work produced by Hofstede, Inglehart, Schwartz, GLOBE (Global Leadership and Organizational Behavior Effectiveness), Minkov, and a number of well-known qualitative authors, ending up with nine exclusive clusters: Individualism versus Collectivism, Power Distance, Uncertainty Avoidance (UA), Mastery versus Harmony, Traditionalism versus Secularism, Indulgence versus Restraint, Assertiveness versus Tenderness, Gender Egalitarianism, and Collaborativeness.
Introduction
Although there are many definitions, there is common emphasis that “culture” consists of shared elements (attitudes, beliefs, values, self-definition) of a community (Triandis, 1996). Hofstede defines culture as “the collective programming of the mind that distinguishes the members of one group or category of people from another” (2001, p. 9). Human mental programs can not be observed directly, but only established through words, attitudes to real and hypothetical dilemmas or actual deeds. Although some social theorists like Parsons and Shills (1951) and Kluckhohn and Strodtbeck (1961) had used the concept of cultural orientations/dimensions, their application of the concept was still mainly qualitative. “Dimensionalization” of culture in a quantitative sense by applying it at the ecological level of nations has become a popular approach, for establishing core values underlying mental programs and understanding cross-cultural differences, since Hofstede’s statistics-based cross-national comparative study. Measuring values by asking people’s opinions through questionnaires and classifying them by statistical methods is the first step to translating “dimensions” of national cultures into numbers allowing for large-scale cross-national comparison. Cultural dimensions allow us to distinguish aspects of a national culture that can be measured relative to other national cultures (Hofstede, 2006). More qualitatively oriented anthropologists have often vehemently criticized this line of thought as overly simplistic, methodologically flawed, lacking in nuance and complexity, and failing to demonstrate how underlying social mechanisms operate (Heine, Lehman, Peng, & Greenholz, 2002). Nonetheless, during the past three decades, the academic literature where sets of dimensions are applied to cultural differences has seen an impressive evolution, especially when it comes to generating country scores.
During the past three decades, other authors have introduced different dimensions, sometimes similar, sometimes different, and sometimes overlapping ones. Some of these authors explicitly intended to verify, improve, or correct Hofstede’s work, while others show a face resemblance in spite of the fact that they have different academic backgrounds, different points of departure or different goals. Different researchers made attempts to explain sometimes different phenomena from different perspectives and the sets of cultural dimensions coming out of their work were extracted from different data sets, which led to a rich, but somewhat disorderly variety of approaches and dimensions. Hofstede himself (later supplemented by his son Gert-Jan and Michael Minkov) has revised and readjusted his dimensions to fit new insights.
The status quo of theoretical and methodological development in this field can now be qualified by two words: enriched and messy. The final result of the 30-year evolution has not so much been a convergence of the dimensions from various authors into one final and definitive model or set, but a collection of partly complementary, partly overlapping, and partly conflicting axes. This situation has the advantage of providing heuristic richness (culture is a multifaceted phenomenon that can not possibly be covered by a small number of linear dimensions) and the disadvantage of leading to incompatibility, inconsistency among these dimensions, and a lack of clarity. Until Minkov (2013) published his most recent monograph with an overview of all major cultural dimensions, scholars and professionals had no publication to turn to for a more or less complete overview of all relevant cultural dimensions in their research or work practice. The question that we will ask ourselves here is whether it is possible not only to generate such an overview, but in addition to group the major cultural dimensions into clusters.
Attempts have been made by Schneider and Barsoux (2003) and Nardon and Steers (2006, 2009) to bring the most likely common denominators of the cultural dimensions together in an overview. However, their sets of 16 and 5 dimensions, respectively, were not so much based on any systematic matching, statistically or heuristically, of insights generated by other scholars, but on ad hoc considerations or common sense. The methodology through which they derive this selection is opaque and it is unlikely that it covers all relevant elements contained in all other series of dimensions. Their objective to synthesize insights from different authors and present a manageable and condensed set of cultural dimensions is laudable, but according to us, this could be done in a more methodologically transparent fashion. We will try to do this by systematically matching the dimensions of various studies with each other, first conceptually and then statistically. Using this “matching analysis,” we will present our nine clusters of dimensions. We present these nine as clusters of dimensions rather than as new single dimensions, because they may refer to similar and strongly related dimensions from different studies, which are however not identical. In this fashion, we hope to do justice to the original authors and also avoid the trap of collapsing phenomena into single dimensions that should not be completely collapsed. We have no intention to dismiss any cross-cultural theory in favor of another, but simply aim to show how the comparison and aggregation of all dimensions from different authors can lead us to identify a consistent framework in which all dimensional features contained in the previous work reappear.
Many Dimensions of Culture
In this section, cultural models and dimensions theorized, defined, and empirically measured by leading research groups on the subject are briefly introduced and summarized. The aim of the paper is to introduce, compare, and classify the cross-cultural studies for those researchers from different disciplines wishing to apply cultural dimensions in their comparative analysis. Although we take into account qualitative as well as quantitative dimensions in this study, we focus mainly on five distinguished cultural theories with accessible country scores based on their empirical quantitative analysis. In Table 1, readers can find a breakdown of some essential information on the five research groups.
The Summary of General Information About Major Empirical Cross-Cultural Theories.

Note. LTO = long (vs. short)-term orientation; WVS = World Value Survey; GLOBE = global leadership and organizational behavior effectiveness.
We should mention that there are two other recognized cross-cultural researches, namely, works by Smith, Dugan, and Trompenaars (1996) and Bond et al. (2004), each of which introduced two empirically based cultural dimensions not covered in this study. This is due to the fact that they share fewer than 30 countries with other studies, which is problematical for the sampling adequacy of the ecological factor analysis.
Hofstede’s Cultural Model and Minkov’s Work
Using survey data from IBM employees, Hofstede empirically derived four cultural dimensions and called them Individualism versus Collectivism, Power Distance, Uncertainty Avoidance (UA), and Masculinity versus Femininity. Later on, he added a fifth dimension, Long (vs. Short)-Term Orientation (LTO), inspired by a group research called Chinese Culture Connection (1987) across 22 countries. Hofstede recently recalculated the LTO dimension using items from the World Value Survey (WVS) database and extended LTO scores to 93 countries (Hofstede, Hofstede, & Minkov, 2010).
Collaborating with Michael Minkov, Hofstede adopted one of the Minkov’s three dimensions, Indulgence versus Restraint, as the sixth dimension in his latest book (Hofstede et al., 2010). In his book, Minkov (2007) introduced three cultural dimensions, namely, Exclusionism versus Universalism, Indulgence versus Restraint, and Monumentalism versus Flexumility. He extracted them from the WVS database. In the appendix (Table A1), Hofstede’s cultural dimensions as well as Minkov’s are briefly described.
Inglehart’s World Value Survey
Ronald Inglehart, the director of the WVS, factor analyzed the national-level data from the 43 societies obtained in the 1990 survey and found that two main dimensions, Traditional versus Secular-Rational and Survival versus Self-Expression, accounted for more than 70% of the cross-national variance in more than 20 variables. When the factor analysis was replicated with the data from 1995 and 2000 surveys, the same two dimensions of cross-cultural variation emerged, even though the new analysis included more additional countries compared with the earlier study. Hence, Inglehart asserted that these dimensions of cross-cultural variation are robust (Inglehart, 2006; Inglehart & Baker, 2000; see Table A2 in the appendix for the description of dimensions).
Schwartz’s Cultural Value Orientations
Shalom Schwartz defines (cultural) values as “conceptions of the desirable that guide the way social actors select actions, evaluate people and events, and explain their actions and evaluations” (Schwartz, 1999, p. 24). Like Hofstede, Schwartz also acknowledges that cultural value orientations are relatively stable although cultural values do change gradually (Schwartz, 2006). While Hofstede derived his framework empirically (i.e., he had some empirical data and based on them he developed his theory), Schwartz developed his framework theoretically, after which he empirically examined it using large-scale multicountry samples.
Contrary to the method of inferring basic value priorities from responses to specific attitude and opinion items (used by Hofstede and Inglehart), Schwartz used his own value survey (SVS), which included 56 value items to operationalize the value priorities of individuals. Respondents were asked to rate the importance of each value items “as a guiding principle in MY life” (Schwartz, 1992). Schwartz (1999) argues that individual value priorities are a mixture of shared culture and of unique personal experience. Therefore, the average priorities attributed to different values by members of a society reflect the essence of their shared culture and reveal the underlying common cultural value (Schwartz, 2006).
Unlike Hofstede and Inglehart who conceptualized their dimensions as independent and orthogonal factors, Schwartz (2006) considers interrelation of cultural value orientation based on compatibility among them in a circular structure. Such a structure reflects cultural orientations (or dimensions) which are compatible (adjacent in the circle) or incompatible (distant around the circle). Considering important issues that confront all societies, Schwartz derived seven dimensions of national culture, which in turn can constitute three bipolar cultural dimensions: Embeddedness (or Conservatism) versus Autonomy; Hierarchy versus Egalitarianism; and Mastery versus Harmony (see Table A3 in the appendix for the definition of dimensions).
The GLOBE Project
The GLOBE (Global Leadership and Organizational Behavior Effectiveness) research program defines culture as “shared motives, values, beliefs, identities, and interpretations or meanings of significant events that result from common experiences of members of collectives and are transmitted across age generations” (House, Javidan, Hanges, & Dorfman, 2002, p. 5). The research by GLOBE is asserted to extend Hofstede’s work in a theory-driven fashion (like Schwartz). The authors first specified the general nature of the constructs they wanted to measure before writing down cultural items for each dimension and developing GLOBE scales (Javidan, House, Dorfman, Hanges, & Sully de Luque, 2006).
The methodology used in GLOBE project to measure cultural dimensions entails two major peculiarities. First, in an attempt to resolve the logical problems inherent in aggregation of individual-level self-reports, GLOBE respondents were asked to give ratings that described not themselves but their society. Therefore, they assumed that the aggregation of respondents’ ratings to higher levels would not be implicitly defining culture as the aggregate of individuals’ self ratings, but as the aggregate of their perceptions of others as a social group (Javidan et al., 2006; Smith, 2005). Second, respondents completed two sets of ratings, one describing their society “as it is” to measure practices and second, “as it should be” to measure values of a society (House, Hanges, Javidan, Dorfman, & Gupta, 2004). GLOBE has introduced nine cultural dimensions: Performance Orientation, Future Orientation, Gender Egalitarianism, Assertiveness, Institutional Collectivism, In-Group Collectivism, Power Distance, Humane Orientation, and Uncertainty Avoidance (see Table A4 in the appendix).
Dimensions From Conceptual Cultural Theories
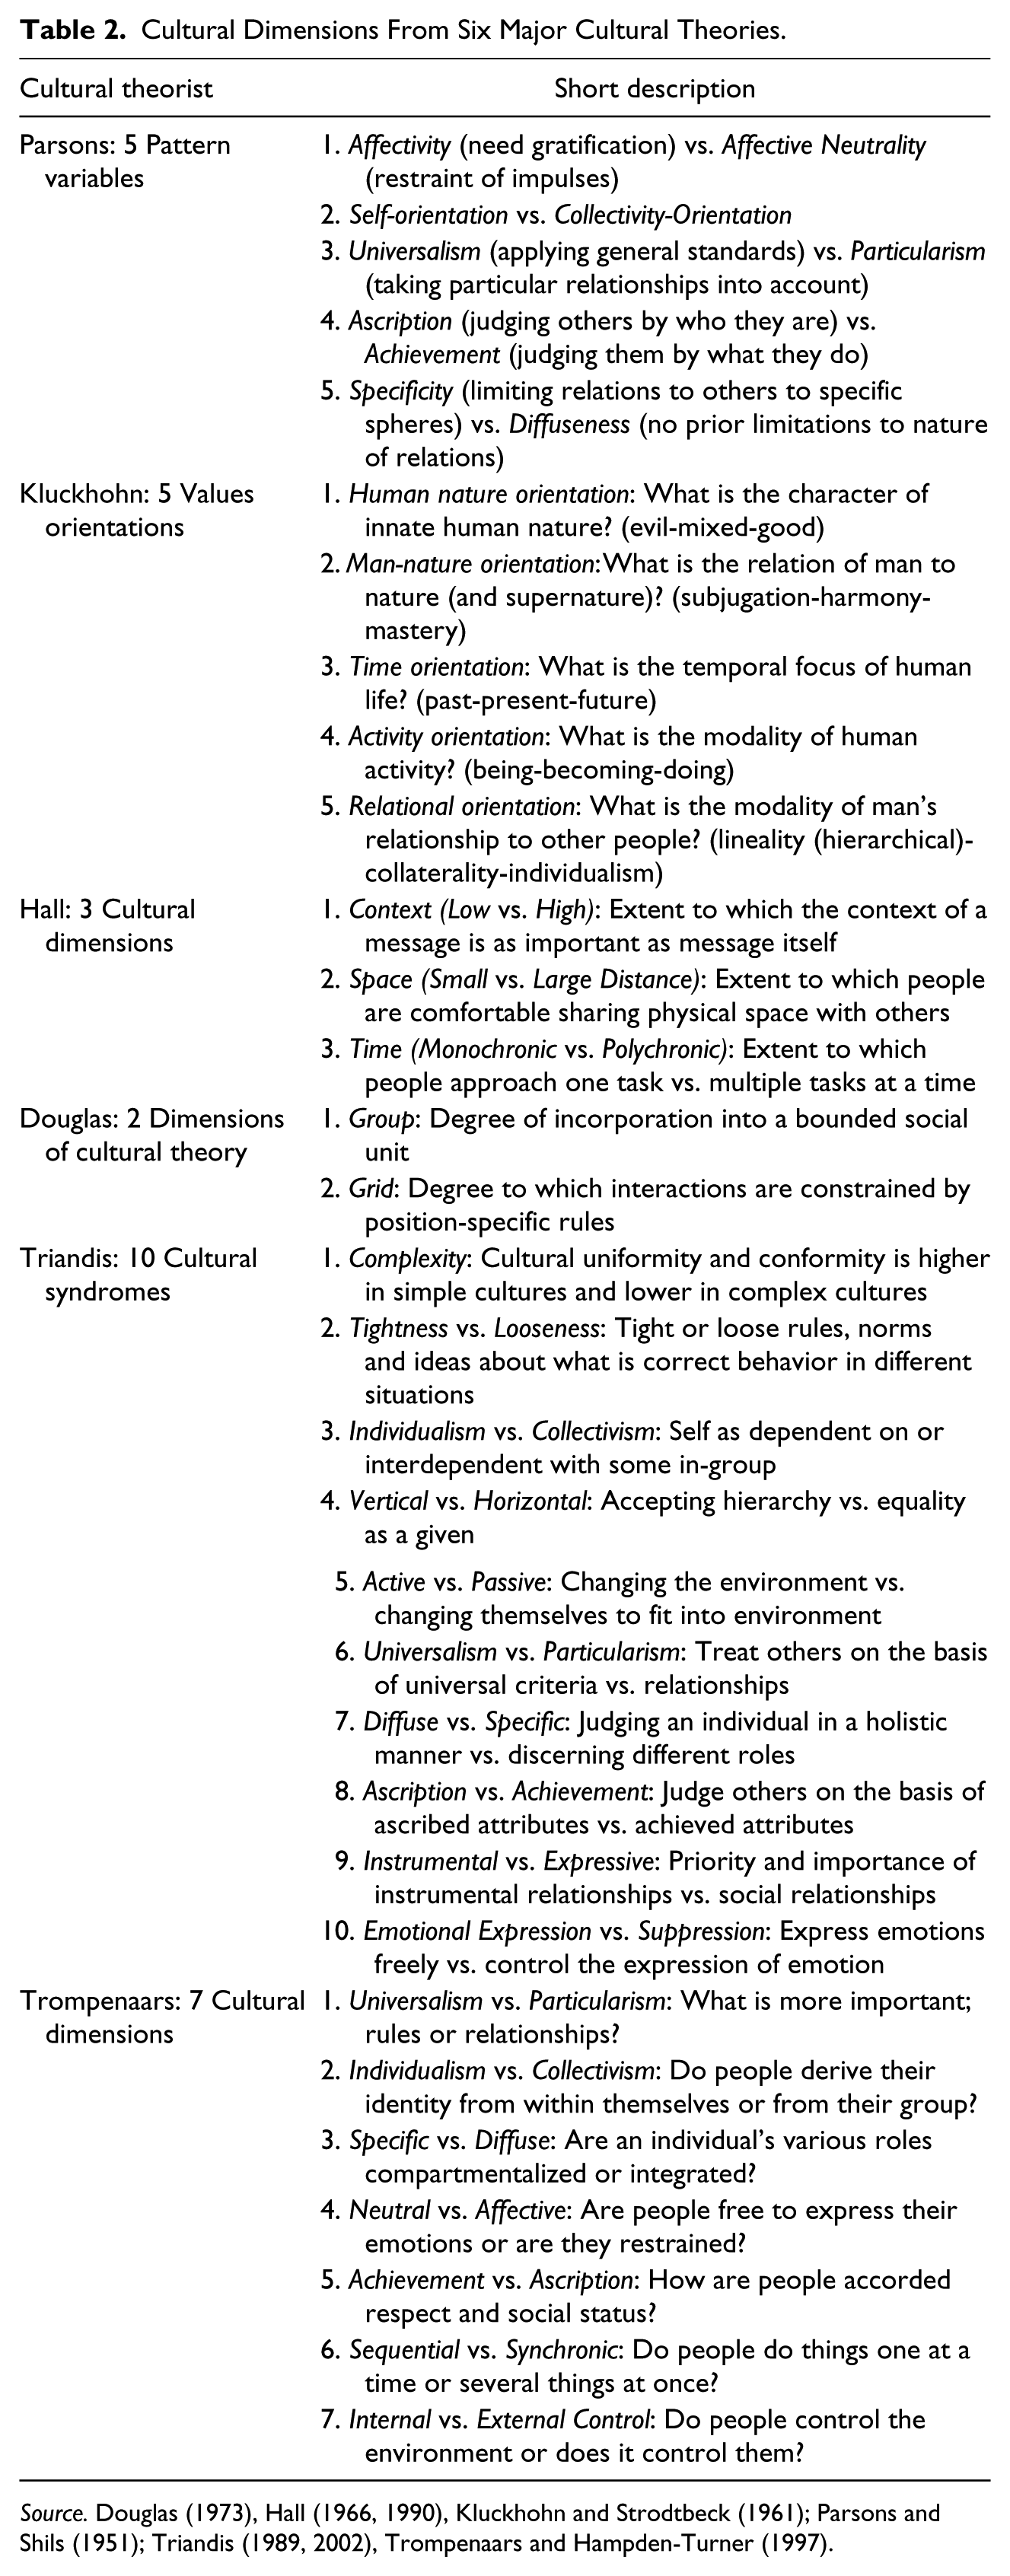
Apart from the aforementioned empirically based cultural dimensions, there are many other dimensions of culture which should be taken into consideration in any thorough review of cultural theories. In this section, we will briefly list a number of major and well-known conceptual cultural theories by Parsons, Kluckhohn, Hall, Douglas, Triandis, and Trompenaars in each of which some cultural dimensions (even though the relevant authors do not always call them “dimensions”) have been introduced and theorized. The main distinction between cross-cultural theories introduced in the previous sections and these theories is that the former enjoy a systematic and quantitative analysis of dimensions for national culture, while the latter proposed conceptual and qualitative analysis of cultural dimensions. However, as we will see, there are some significant similarities between definitions and concepts of many dimensions from different theories. Table 2 gives the list of distinguished theorists and their cultural dimensions as well as a short description of each dimension.
Cultural Dimensions From Six Major Cultural Theories.
A Proposal for Clusters of Cultural Dimensions
To generate a validated set of exclusive clusters of dimensions, we have to analyze the interrelations among these many dimensions. In this section, through discussing and explaining conceptual interrelations, we propose nine clusters of cultural dimensions and label them.
Cluster 1: Individualism Versus Collectivism
The first distinguishable cluster of cultural dimensions is comprised of those dimensions that represent the most famous cultural construct of individualism versus collectivism (I-C), which characterizes the interrelatedness of individuals. Indeed, all cultural models have this dimension under different labels, namely, individualism versus collectivism (Hofstede and Triandis), universalism versus exclusionism (Minkov), embeddedness versus autonomy (Schwartz), in-group collectivism (GLOBE), individualism versus communitarianism (Trompenaars), self-orientation versus collectivity-orientation (Parsons), relational orientation (Kluckhohn), and group (Douglas). Moreover, the cultural dimension of self-expression versus survival by Inglehart, which entails many different cultural traits in one dimension, includes the attribute of individual autonomy, and hence is associated with I-C.
Furthermore, there are some other cultural dimensions considered as facets/features of the I-C dimension. Three cultural dimensions used by Parsons, Triandis, and Trompenaars are among such dimensions: (a) universalism versus particularism, which is about treating others on the basis of universal criteria versus relationships. It can be conceptually considered as an attribute of I-C, since in a collectivist cultures the relationship and the loyalty to the in-group is a matter of importance, while in individualistic cultures, no such strong commitment exists and the universal rules should be ideally applied; (b) ascription versus achievement, which indicates whether others are judged by “who they are” (ascribed attributes) or by “what they do” (achieved attributes). It is argued that ascription is important in cultures where one’s ties and relations are more important than one’s individuality; (c) specificity versus diffuseness represents the cultural trait that determines whether individuals should be judged in a holistic manner or by discriminating the different roles they play in various social settings. In diffuse cultures, relations to others are not restricted to any specific sphere (e.g., work, family life), but taken as a whole. Hofstede (2001) and Triandis (2001, 2004) considered these three dimensions as attributes of I-C.
Moreover, Hall (1966) introduced a dimension called monochronic versus polychronic (time conception), similar in definition to what Trompenaars and Hampden-Turner (1997) labeled sequential versus synchronic. It refers to the extent to which people approach one task or multiple tasks at the same time. At the first glance it may seem unclear how this dimension can be related to I-C; however, in a collectivist culture normally people prefer not to reject tasks offered by different friends or relatives since the rejection could weaken this relationship. Thus, accepting different tasks at a time is unavoidable in many occasions for a person in collectivist cultures, while this is not the case in individualistic cultures. Adair, Buchan, and Chen (2009) used Hall’s time theory and realized that polychronicity and monochronicity are, respectively, seen in collectivist and individualistic environments.
There are two other well-known cultural dimensions by Hall, context and space, which are arguably associated with I-C. “Context” indicates the importance of context versus content of a message in different cultures, whereas “space” designates what is felt to be a comfortable physical distance from others in various cultures. It is argued that preferences of high-context and small-distance communication are features of collectivist cultures. Adair et al. (2009) have shown that small-distance communication is practiced mostly in high context cultures. Moreover, Gudykunst, Ting-Toomey, and Chua (1988) mention the parallel between low versus high context dimension and individualism versus collectivism. A very recent empirical study by a large group of researchers (Owe et al., 2012) also confirmed a significant correlation between contextualism and I-C.
The last cultural dimension related to I-C is what Triandis called instrumental versus expressive which indicates the priority of instrumental activity (e.g., doing one’s job) versus expressive activity (e.g., enjoying social relationships). Triandis (2000) asserted that “in general, individualists are more instrumental and collectivists are more expressive” (p.148), although he applied cultural dimensions to the individual and not to the ecological level.
All things considered, individualism versus collectivism is a very rich and broad dimension, absorbing much theoretical and empirical work. However, some of the dimensions mentioned are provisionally assumed facets of I-C and more empirical research is needed to confirm these propositions.
Cluster 2: Power Distance
The second cultural cluster is known as the famous dimension of power distance or hierarchy, which reflects the extent to which hierarchical relations and position-related roles are accepted. Hofstede’s and GLOBE’s power distance and Schwartz’s hierarchy/egalitarianism belong to this cluster. Among conceptual theories of culture, the grid dimension by Douglas and the vertical dimension by Triandis represent the same cultural feature. The dimension of survival/self-expression by Inglehart consists of the cultural attribute of hierarchy as well.
Although the first and second clusters can be conceptually distinguished, in many empirical studies beginning with Hofstede (1980), their corresponding dimensions are significantly and strongly correlated. Consequently, in some cultural models, these two constructs are merged into one dimension (i.e., Inglehart’s self-expression). Some scholars even consider individualism and power distance two sub-dimensions of a broader definition of individualism/collectivism (Triandis, 1998). Kluckhohn and Strodtbeck (1961), who were one of the first theorists to introduce cultural orientations, considered these two cultural dimensions as different modes of a construct called relational orientation, characterized by three possible modalities: lineality (hierarchical), collaterality, and individualism. It is likely that in individualistic cultures people expect and accept more egalitarianism, since the loyalty to a social unit is weaker and hierarchy is not a desirable way of ordering relationships, while in many collectivist cultures hierarchy is seen as a justified mechanism to create order in a group. Consequently, a meaningful relation between these two cultural orientations is expected.
Cluster 3: Uncertainty Avoidance
The third cluster is known as uncertainty avoidance, which indicates to what extent people feel uncomfortable with uncertain, unknown, or unstructured situations. Hofstede (2001) mentioned that in uncertainty avoidant cultures, many rules, prescriptions, and proscriptions exist, even though they may not always be followed.
GLOBE has also introduced a dimension with the label UA; however, it measures something conceptually different. Venaik and Brewer (2010) have convincingly argued that according to the associated question items for this dimension, the measured country scores and its correlations with other dimensions and phenomena, GLOBE’s UA represents the cultural trait of “rule-orientation.” As we discussed in Cluster 1, a number of scholars (Parsons & Shills, 1951; Triandis, 2002; Trompenaars & Hampden-Turner, 1997) have introduced a cultural dimension of rule- versus relationship orientation (or universalism vs. particularism). This dimension, which resembles GLOBE’s UA, is normally considered a facet of individualism versus collectivism.
Furthermore, Triandis (1989) presents the cultural dimension of “tightness” (vs. looseness), which represents to what extent rules and norms exist and are respected in a society. This dimension has a conceptual commonality with UA as well as rule-orientation. It has also been assumed to be a feature of other cultural constructs, that is, individualism (Triandis, 2004) and indulgence (Minkov, 2007). 1
Among other dimensions, we can argue that those related to the issue of dealing with the future can be conceptually associated with this cluster. Avoiding any unknown and uncertain condition is the main feature of UA, and since the future is the most uncertain aspect of human living, it can be expected that attributes of future orientation are pertinent to this dimension. Thus, future orientation by GLOBE, which is about planning for future, and time orientation (future mode) by Kluckhohn can be categorized in this cluster.
The idea that uncertainty-avoiding societies prepare for an uncertain future by reverting to all sorts of laws and rules (Hofstede, 2001) seems in contradiction with our argument. However, we argue that being simultaneously uncertainty-avoiding and future-oriented does occur in cultures with a strong rule-orientation (e.g., Japan and Germany). In fact, generating certainty that plans and rules will be indeed respected fully compensates for avoiding an uncertain future, and this makes such societies future-oriented.
Among other dimensions of GLOBE, the question items regarding performance orientation indicate their relevance to future orientation and UA. “Being innovative to improve performance” and “encouraged to strive for continuously improved performance” have conceptual elements (emphasized in italic) relevant to low UA and high future orientation.
Cluster 4: Mastery Versus Harmony
The fourth distinctive cluster of cultural dimensions consists of those constructs which manifest the cultural attributes of competitiveness, achievement, and self-assertion versus consensus, equity, and harmony. Mastery (vs. harmony) by Schwartz, masculinity (vs. femininity) by Hofstede and (doing) activity orientation by Kluckhohn (i.e., demand for activity which results in accomplishment) are conceptually associated with this cluster. Moreover, the relation of humans to nature is another facet of this cultural attribute. The distinction between an orientation where people try to control and change the environment and one where being in harmony with it is preferred has been recognized by Kluckhohn (man–nature orientation), Triandis (active vs. passive), and Trompenaars (internal vs. external control).
We believe that Hofstede’s masculinity, based on its definition, is a so-called big-dimension combining cultural features of mastery, assertiveness, and gender egalitarianism. We will argue that the two cultural traits of assertiveness and gender egalitarianism should be embodied into two separate clusters. Masculinity is a problematical dimension in that it combines different cultural features. For instance, we can recognize cultures which have high mastery orientation, but at the same time have high gender egalitarianism and low assertiveness (or any other combination of these three features). Combining cultural features of mastery, assertiveness, and gender inequality in one dimension can thus be conceptually misleading.
Cluster 5: Traditionalism Versus Secularism
The fifth distinguishable cluster of dimensions accounts for the cultural traits of religiosity, self-stability, feelings of pride and, consistency between emotion felt and their expression versus secular orientation and flexibility. Inglehart’s traditional/secular, Minkov’s monumentalism, and Hofstede’s long-term orientation are three empirical dimensions relevant to this cluster. They share the common features of religiosity, traditionalism, pride, and self-stability versus secularism and self-effacement. We can argue that Schwartz’s embeddedness, which has a feature of conservatism, is partly related to this cultural orientation.
Hofstede’s long-term orientation (LTO) is an amalgamation of different cultural traits (Fang, 2003), including traditionalism and two other cultural orientations that makes it a so-called big dimension. From the explanation of LTO in Hofstede’s recent book (2010), we learn that LTO is construed based on the three items of “thrift,” “national pride,” and “service to others.” The latter item represents the cultural trait of “humane orientation,” which is conceptually a distinct cultural feature from traditionalism. Among these three items, only “thrift,” which has the lowest loading in the LTO dimension (Hofstede et al., 2010), shows conceptual relevance to the cultural feature of future/long-term orientation. However, it can be argued that “thrift” is a questionable indicator for future orientation since this trait can be partially explained by survival factors. 2 Therefore, the feature of future-orientation is not a dominant and main element of LTO making the label of this dimension a misleading one. 3
Among qualitative dimensions, the temporal focus on the past in Kluckhohn’s time orientation can be related to the feature of traditionalism.
Cluster 6: Indulgence Versus Restraint
The sixth exclusive dimension is indulgence vs. restraint which reflects the extent to which gratification of desires and feelings is free or restrained. This dimension was extracted by Minkov out of items making up Inglehart’s big dimension of self-expression. Self-expression incorporates a number of distinct cultural dimensions (i.e., individualism, power distance, and indulgence) in one dimension. Among theoretical dimensions, the one which is conceptually congruent with this cultural orientation is Parsons’ affectivity versus affective neutrality, which indicates the choice between gratification and evaluation, permissiveness and discipline (Parsons & Shills, 1951). Moreover, two dimensions proposed by Triandis (emotional expression) and Trompenaars (neutral vs. affective), which indicate whether people express emotions openly or control the expression of emotions, are conceptually related to the cultural feature of this cluster. 4
Cluster 7: Assertiveness Versus Tenderness
The seventh cluster of cultural dimensions refers to the cultural feature of being assertive and aggressive versus kind and tender in social relationships, manifested also in communication styles. GLOBE’s assertiveness and humane orientation are two dimensions embodying this attribute. These two constructs are remarkably distinct from other empirical dimensions and have meaningful commonalities in their question items.
Although some scholars assume that assertiveness and mastery are two facets of the same construct (e.g., Hofstede in masculinity), these two features do not necessarily co-occur. Thus, assertiveness is a distinguishable feature of culture that can not be mixed with “mastery.” Moreover, as we discussed earlier, the item of “service to others” loaded on to Hofstede’s LTO, is a cultural trait pertinent to “humane orientation.”
Kluckhohn’s human–nature orientation, which refers to the conception of innate human nature (evil, mixed, or good) is a conceptual dimension that can be tentatively assumed to be relevant to this cluster.
Cluster 8: Gender Egalitarianism
The eighth distinct cultural construct concerns gender egalitarianism. GLOBE’s gender egalitarianism is the representative dimension of this cluster. The item to assess discriminatory gender roles has been embedded in Hofstede’s masculinity. Although it can be argued that in individualistic and low-power distant cultures, gender equality is expected and accepted, so this dimension is conceptually distinct. This dimension of culture might be drastically changed as a result of modernization, but we can still identify some modern societies with a strong role division between genders.
Cluster 9: Collaborativeness
The ninth and final discernable cultural attribute is the spirit of “team-work.” The empirically based cultural dimension for collaborativeness is institutional collectivism by GLOBE, which represents the precedence of group loyalty, group interest, and group acceptance beyond individual goals. The main cultural feature this dimension would measure is the inclination of people to collaborate with each other in conducting social tasks. This feature can not be exclusively covered by any other dimension, although some theoreticians (in our view erroneously) believe that it is an aspect of collectivism. There are several individualistic cultures, to the best of our knowledge, which are very good at team-working (The Netherlands, Nordic countries) and many collectivistic environments in which the team-work is not strongly developed (Greece, Iran, Colombia). Theoretically speaking, societies enjoying higher interpersonal trust, and consequently lower UA, should practice team-work more easily.
We could also argue that those who are concerned about the future should be more open to collaboration with others. Moreover, team-work is likely to be easier in cultures that are less aggressive and more focused on harmony, whereas this would be difficult within cultures characterized by high self-stability and low flexibility. Therefore, we expect that this cultural construct may have interrelations with dimensions from other clusters, namely, UA, assertiveness, and traditionalism. Nonetheless, we believe that this cultural attribute can not be meaningfully merged in any of the other clusters and it should not be deemed strange if institutional collectivism “measures mostly itself” (Minkov & Blagoev, 2011). That is why we propose that it can constitute a cluster of its own, labeled collaborativeness.
In the next section, this conceptually grounded clustering of dimensions will be examined using a systematic analysis of empirically based dimensions. We will see whether these clusters can be justified on the basis of statistical analysis among quantified dimensions.
An Empirically Based Examination of the Proposed Clusters
Having proposed nine clusters of cultural dimensions, we examined the credibility of these clusters through analyzing statistical correlations and conducting an ecological factor analysis of the existing empirical dimensions. In a great many publications, the empirically based cultural dimensions have been separately and selectively compared and their correlations discussed (Hofstede, 2001; House et al., 2004; House et al., 2002; Inglehart, 2006; Javidan et al., 2006; Littrell, 2008; Minkov, 2007; Ng, Lee, & Soutar, 2007; Schwartz, 2006; Smith, 2005). To have a comprehensive comparison of all dimensions and interpret their correlations, we gathered all country scores of national cultures from five major empirical studies, using the most updated published data sources (see appendix), and calculated correlations among all dimensions. The numbers in Table 3 reveal these correlations.
Significant Correlations Between Empirical Cultural Dimensions.

Note. All correlations are significant at the level of <.01 except those with an asterisk, which are significant at the level of <.05. A correlation in [] brackets is at the level of .1. Figures in parentheses indicate the number of common countries.
References for countries score: Hofstede, Hofstede, and Minkov (2010) and Minkov (2008) (for Hofstede and Minkov dimensions); House, Hanges, Javidan, Dorfman, and Gupta (2004) (for GLOBE dimensions); Inglehart (2007) (most updated available country scores); Licht, Goldschmidt, and Schwartz (2007) (for Schwartz dimensions).
While conducting our analysis and generating this table, we had the following considerations. First of all, considering the peculiarities and debates on the puzzlement of GLOBE’s cultural “values,” which are exhaustively discussed in the literature (Hofstede, 2006; Smith, 2006, 2011), we decided to use only GLOBE’s societal “practices” in our analysis. We are convinced that GLOBE’s practices have a stronger conceptual basis and face validity for our study.
Second, having discussed the problematical meaning of GLOBE’s UA (discussed in Cluster 3), we exclude this dimension from our analysis.
Third, considering many publications concerned with the methodological challenges regarding response bias style (Fischer, 2004; Smith, 2004, 2011), we acknowledge that different cross-cultural models have diverging approaches to the issue. Cultural models by Hofstede (2001), Schwartz (2004), and GLOBE (House et al., 2004) have used various procedures of standardization (i.e., response bias correction). While Hofstede and Schwartz have only provided standardized country scores in their publications, GLOBE study has provided both unstandardized (in the body text of the book) and standardized scores (in the appendix; House et al., 2004). On the other hand, Inglehart did not correct for the response bias and used the method of comparing extreme positions to extract his dimensions (Inglehart & Baker, 2000). Minkov and Hofstede applied Inglehart’s methodology for extracting cultural dimensions of Monumentalism, Indulgence, and LTO, all based on the WVS data set (Hofstede et al., 2010; Minkov 2008). They argue that although the concern about response bias may be problematical, constructing cultural dimensions based on raw scores is justified, if nationally representative samples are used and the extracted dimensions have predictive power with respect to many external variables (Hofstede et al., 2010; Minkov, 2008). Taken together, we are convinced that dimensions with unstandardized scores should not be disregarded from our analysis. In generating Table 3, we used all available standardized scores of cultural dimensions by Hofstede (except LTO), Schwartz, and GLOBE, and unstandardized scores by Inglehart and Minkov. Scanning the correlations among different dimensions, we can provisionally confirm that the proposed clusters are plausible.
After generating the proposal with nine clusters through reasoning and establishing the statistical correlations among the dimensions, we will examine our clusters by conducting an ecological factor analysis of existing dimensions. We hypothesize that our proposed clusters should also emerge from the factor analysis of empirically based dimensions.
To conduct a principal component factor analysis, we had to use only those cultural models that had adequate number of common countries for a list-wise analysis of dimensions. As a test of data appropriateness, we checked the Kaiser–Meyer–Olkin (KMO) measure of sampling adequacy with the minimum acceptable level of 0.60. The number of common countries between Minkov’s exclusionism and other cultural dimensions was not adequate, and consequently, the KMO measure was too low (<0.5). Thus, we decided to remove this dimension from the factor analysis. 5
We performed ecological factor analyses of dimensions in two ways: (a) considering all dimensions and (b) considering dimensions with the largest number of common countries. For each case, we have replicated factor analyses for different conditions to ensure that the extracted factors are reliable and consistent.
Factor Analysis of All Dimensions
We performed the principal component factor analysis of dimensions of cultural models from Hofstede (five dimensions), Inglehart (two dimensions), Schwartz (three bipolar dimensions), GLOBE (seven dimensions), and Minkov (two dimensions), for 33 common countries across the world (see Table A5 in the appendix). Using the scree plot test as a recommended methodology appropriate for the theoretical interpretation (Fabrigar, Wegener, MacCallum, & Strahan, 1999), seven independent factors were extracted, accounting for 87% of the variance. The KMO sampling adequacy of this analysis was 0.64 and Bartlett’s Test of Sphericity was significant. After doing a varimax rotation and considering a cutoff point of 0.5, all dimensions, except GLOBE’s institutional collectivism, loaded highly on only one factor, as seen in Table 4. Factor 1 consisted of six dimensions from two first clusters of individualism and power distance, Factor 2 embodied the cluster of UA, Factor 3 contained dimensions of the cluster traditionalism, and Factors 4, 5, 6, and 7 matched the exclusive clusters of assertiveness, mastery, gender egalitarianism, and indulgence respectively. GLOBE’s Institutional collectivism, which is a representative of cluster collaborativeness, loaded moderately on both Factors 2 and 4. We hypothesized that this division might constitute evidence for the independence of this cultural construct that might emerge if more cases (common countries) were available. We will examine this hypothesis in the next mode of analysis. Except for GLOBE’s power distance, which unexpectedly loaded on Factor 2 instead of Factor 1, all other dimensions loaded on the factors predicted from our conceptual clusters. Taken together, we can observe that the proposed clustering has an acceptable empirical basis.
Results of an Ecological Factor Analysis of 20 Cultural Dimension Scores for 33 Common Countries, Varimax Rotated With 7 Factors.

Note. Total variance explained: 87%.
Moreover, for testing the sensitivity to standardization (response bias correction), we repeated this factor analysis using GLOBE’s unstandardized scores. Similar factors and loadings (with very minor changes) were replicated, which revealed that the results were reliable and that unstandardized scores did not have significant influence on the findings. Furthermore, we repeated the factor analysis using the oblique method of factor rotation. We observed that all dimensions loaded on the same factors as emerged from a varimax rotation.
Factor Analysis of Largest Common Countries
This time, we only utilized the two cultural theories by Hofstede and GLOBE, which have the largest number of common countries. We examined whether the increase in the number of countries, and consequently common variances, would bring about any new exclusive factors. For the sake of methodological consistency, we performed the factor analysis without unstandardized dimensions (i.e., Hofstede’s LTO). The factor analysis was conducted with 12 dimensions for 51 common countries, covering all continents and different regions in the world (see Table A5 in the appendix). Using the scree plot, six factors were extracted, explaining 85.1% of total variance. The KMO sampling adequacy was remarkably high (0.73). As seen in Table 5, after a varimax rotation, all dimensions loaded highly on only one factor.
Results of an Ecological Factor Analysis of 12 Cultural Dimension Scores From Hofstede and GLOBE Models for 51 Common Countries, Varimax Rotated With 6 Factors.

Note. Total variance explained: 85.1%.
Factor 1 embodied two first clusters of individualism and power distance, Factor 2 represented the cluster of UA, Factor 3 is relevant to the clusters of assertiveness, and Factors 4, 5, and 6 matched to the exclusive clusters of gender egalitarianism, mastery, and collaborativeness, respectively. The main feature of this analysis was the emergence of GLOBE’s institutional collectivism as an independent factor. This confirmed our hypothesis that the larger number of countries might lead to manifestation of this construct as an independent factor.
Given that the two first clusters are embedded in one factor, seven out of the nine proposed clusters appeared in this factor analysis. Indeed, all dimensions relevant to two absent clusters, traditionalism and indulgence, had been excluded in this case, since we only used those dimensions with standardized scores and the largest number of countries in common.
Adding Hofstede’s LTO, which also had a large number of common countries (47) with other dimensions, we replicated the factor analysis and found seven independent factors explaining 90% of the variance. Since GLOBE’s power distance was the only dimension which loaded on an unexpected factor inconsistent with the conceptual clustering, we removed it from this analysis. This time an independent factor for the LTO emerged and was added to the six former extracted factors. This replication affirmed the reliability of the extracted factors and the plausibility of having the exclusive cluster of collaborativeness. All in all, we can assert that the proposed clustering has a convincing empirical basis.
To sum up our observations from the above:
All dimensions from the first two clusters (individualism and power distance) loaded highly on only one factor that indicated their high interrelatedness. This might support the skepticism of those who believe that individualism and power distance can not be treated as different dimensions (Smith, 2002). However, as we argued earlier, the conceptual difference between these two dimensions is undeniable. At this stage, we cannot yet come to a final judgment about this unity since there is still some theoretical and empirical evidence lending support to their distinctness. For instance, GLOBE’s power distance dimension is one of the most recent empirical researches that shows an exclusive dimension for power distance. Moreover, because some researchers and practitioners might need to focus on one of these two concepts, the separation of dimensions related to each of these two concepts might be more helpful and explanatory. Furthermore, we can still name some countries with virtually the same level of individualism but distinguishable level of power distance (e.g., France, The Netherlands, Germany). Instead of drawing any final conclusion, we prefer to suggest further research on this subject.
We found no evidence that the combination of standardized and unstandardized scores made any difference to the consistency of the empirical results of this study. Replication of the factor analysis with unstandardized scores of GLOBE’s dimensions in the first analysis and performing a factor analysis of only standardized dimensions in the second analysis gave highly similar outcomes, which we believe justifies our methodology.
GLOBE’s dimension of power distance (especially the standardized one) seems problematic, emerging under an irrelevant factor (UA). Our study reveals that unstandardized scores of GLOBE’s power distance show a higher correlation with Hofstede’s power distance (0.54, p < .01, N = 52), whereas this correlation is markedly lower for standardized scores (0.36). Moreover, GLOBE’s power distance has shown no correlation with Schwartz’s hierarchy/egalitarianism. Nevertheless, this dimension has a high correlation with Hofstede’s UA. That is why it loaded higher on the UA cluster than on power distance. However, when we replicated our factor analysis using GLOBE’s unstandardized power distance, in most cases this dimension did appear (or showed higher loading) on the factor relevant to power distance/individualism. Overall, we can not have a final judgment about the appropriateness of this dimension, since Hofstede’s power distance, as the reference construct, is itself under debate due to its high correlation with individualism.
When considering statistical correlations, we found that some so-called big-dimensions (Hofstede’s masculinity and LTO, Inglehart’s self-expression) are composed of distinguishable cultural traits. In our conceptual clustering, we discussed the inconsistent cultural items embedded in these dimensions.
We can conclude that eight exclusive factors can be extracted from empirically based cultural dimensions. These factors and the loaded dimensions were confirmed and mapped into the proposed conceptual clusters. All in all, we can assert that our proposal for clusters of dimensions have an acceptable conceptual and empirical basis.
A New Working Model of Nine Clusters of Culture
Combining the conceptual proposal with the statistical analysis, we propose a final working model of nine clusters of cultural dimensions, including all the empirical and theoretical dimensions extracted from several cultural theories. Table 6 illustrates under which cluster each dimension is positioned.
A Clustering Frame of Cultural Dimensions.

Under each cluster in Table 6, we italicized one or occasionally two empirical dimension(s), which in our speculation could be the representative of cultural features of the corresponding cluster. According to us, Hofstede’s individualism/collectivism and Schwartz’s hierarchy/egalitarianism are proper representatives for the individualism and power distance clusters, respectively, since they have less interdependence and higher face validity. Hofstede’s UA and GLOBE’s future-orientation are recommended for the UA cluster. We think the latter is a proper dimension for those who are particularly interested in the cultural feature of future-orientation. We are convinced that Schwartz’s mastery orientation better represents the mastery feature, because it has not been mixed with the attributes of other clusters. Moreover, we recommend Minkov’s monumentalism as an appropriate representative of the traditionalism cluster since the other dimensions of the cluster are mergers. However, Inglehart’s traditional/secular is, in our speculation, the second candidate for this cluster. GLOBE’s assertiveness and humane orientation seem proper dimensions for measuring the assertiveness cluster. Finally, each cluster of indulgence, gender egalitarianism, and collaborativeness has only one representative dimension to be utilized.
The above are only tentative suggestions based on the embedded features of these dimensions, their intercorrelations and our understanding based on discussions of different dimensions. The final decision about what dimensions are useful and applicable obviously depends on the analyst’s objective and focus.
Conclusion
The appropriate number of cultural dimensions has always been a matter of controversy. While some scholars believe that having many dimensions (more than seven) is confusing and not useful (Hofstede, 2006), others believe that we need more cultural dimensions to better explain the variance among different cultures (Triandis, 2001). It is possible to reduce the number of dimensions to just four or five, but we believe that this reduction weakens their explanatory power. At any rate, there may be a tradeoff between the simplicity of a classification system and its explanatory power.
Simply collapsing any set of the above distinguished nine clusters of dimensions into a smaller number of more encompassing dimensions will result in a failure to understand important cultural phenomena. The product of our synthesizing work is not a set of nine pure dimensions, but nine clusters of closely related (but not identical) dimensions generated by different authors. Nor are the importance, weight, and application of these nine clusters the same, but depend on the purpose of the cultural analysis at hand. However, jointly they generate not only a good overview of the state-of-the-art knowledge on cultural dimensions applied to cross-national comparison, but also a conceptually and statistically systematized understanding of how this multitude of dimensions hang together as shown in the clustering frame presented in Table 6.
The nine clusters of dimensions generated in this contribution are not the final word on this topic because in our statistical analysis, we had to combine different data sets in which the methods used were sometimes different. It is also true that some clusters (especially individualism vs. collectivism) are much more prominent than others. We do not know whether this is simply because they have more explanatory power or whether analysts have been biased toward this topic. Finally, we were able to disentangle power distance from individualism on conceptual grounds, but not on statistical grounds, so we retained both in our final set. But here too, presumably more work needs to be done.
We do believe that the given distinction in clusters of cultural dimensions has practical value and offers insight to those who wish to apply cross-cultural theories in different fields of study. At a more theoretical level, the clusters can reveal how some dimensions are actually a combination of different cultural features, awareness of which is crucial for the correction of the mistaken conception that a cultural dimension represents a specific cultural trait, justified by its distinct “label” (e.g., long-term orientation). The clusters can also help scholars in different fields to find the appropriate clusters or specific dimension within it for their targeted field of study. Scholars and practitioners can find inside the framework which authors have something to say on which dimension(s) or cultural phenomenon. Finally, the clusters can show how many resources are available for the evaluation of a given cultural orientation, that is, how the result for a measure of culture can be compared and cross-checked using several cross-cultural studies. Furthermore, since the quantitative approach for extracting cultural differences is often questioned by more qualitative researchers, showing that a similar cultural construct can be extracted from two distinct cross-cultural studies lends more credibility to the quantitative approach.
To build further on the framework generated in this contribution, it is conceivable that this type of analysis be replicated using databases that include more common countries. This was a limitation in our work, but as data sets grow and become more robust, future researchers can utilize them for further testing and validation of the framework. An alternative possibility is to extract more dimensions from the WVS database to examine existing dimensions (e.g., power distance) and test the validity of clusters, especially those for which conceptual and statistical exercises lead to divergent outcomes. Finally, we could imagine the Herculean task of taking the clusters as a point of departure for a completely new framework, develop new question items for each cluster and base a new series of surveys based on them. Before such a task can be justified, the framework will first require thorough testing and validation by others and with more extensive data sets.
Footnotes
Appendix
Countries Included in Ecological Factor Analysis and Their Cultural Dimensions Scores.
| Hofstede |
Minkov |
Schwartz
a
|
Inglehart |
GLOBE standardized scores (response bias corrected) |
GLOBE unstandardized scores (uncorrected) |
||||||||||||||||||||||||
|---|---|---|---|---|---|---|---|---|---|---|---|---|---|---|---|---|---|---|---|---|---|---|---|---|---|---|---|---|---|
| H1 | H2 | H3 | H4 | H5 | M1 | M2 | M3 | S1 | S2 | S3 | I1 | I2 | G1 | G2 | G3 | G4 | G5 | G6 | G7 | G8 | G1 | G2 | G3 | G4 | G5 | G6 | G7 | G8 | |
| Argentina | 46 | 49 | 86 | 56 | 20 | 311 | 62 | 28 | −0.36 | −3.30 | −0.55 | −0.66 | 0.38 | 3.63 | 3.1 | 3.44 | 4.18 | 3.66 | 5.51 | 5.56 | 3.94 | 3.65 | 3.08 | 3.49 | 4.22 | 3.66 | 5.51 | 5.64 | 3.99 |
| Australia | 90 | 36 | 51 | 61 | 21 | 174 | 71 | 35 | 0.05 | −2.77 | −0.38 | 0.21 | 1.75 | 4.37 | 4.09 | 3.41 | 4.29 | 4.31 | 4.14 | 4.81 | 4.32 | 4.36 | 4.09 | 3.4 | 4.28 | 4.29 | 4.17 | 4.74 | 4.28 |
| Austria | 55 | 11 | 70 | 79 | 60 | 191 | 63 | 40 | −1.24 | −3.40 | −0.90 | 0.25 | 1.43 | 4.47 | 4.47 | 3.18 | 4.59 | 4.34 | 4.89 | 5 | 3.77 | 4.44 | 4.46 | 3.09 | 4.62 | 4.3 | 4.85 | 4.95 | 3.72 |
| Brazil | 38 | 69 | 76 | 49 | 44 | 313 | 59 | 61 | 0.37 | −1.66 | −0.41 | −0.98 | 0.61 | 4.11 | 3.9 | 3.44 | 4.25 | 3.94 | 5.16 | 5.24 | 3.76 | 4.04 | 3.81 | 3.31 | 4.2 | 3.83 | 5.18 | 5.33 | 3.66 |
| Canada | 80 | 39 | 48 | 52 | 36 | 172 | 68 | 64 | −0.62 | −3.30 | −0.27 | −0.26 | 1.91 | 4.46 | 4.4 | 3.66 | 4.09 | 4.36 | 4.22 | 4.85 | 4.51 | 4.49 | 4.44 | 3.7 | 4.05 | 4.38 | 4.26 | 4.82 | 4.49 |
| China | 20 | 80 | 30 | 66 | 87 | 253 | 24 | −206 | −0.02 | −0.68 | 0.65 | 0.8 | −1.16 | 4.37 | 3.68 | 3.03 | 3.77 | 4.67 | 5.86 | 5.02 | 4.29 | 4.45 | 3.75 | 3.05 | 3.76 | 4.77 | 5.8 | 5.04 | 4.36 |
| Colombia* | 13 | 67 | 80 | 64 | 13 | 320 | 83 | 38 | −1.87 | 0.6 | 3.93 | 3.35 | 3.64 | 4.16 | 3.84 | 5.59 | 5.37 | 3.72 | 3.94 | 3.27 | 3.67 | 4.2 | 3.81 | 5.73 | 5.56 | 3.72 | |||
| Costa Rica* | 15 | 35 | 86 | 21 | 4.1 | 3.64 | 3.56 | 3.83 | 3.95 | 5.26 | 4.7 | 4.38 | 4.12 | 3.6 | 3.56 | 3.75 | 3.93 | 5.32 | 4.74 | 4.39 | |||||||||
| Denmark | 74 | 18 | 23 | 16 | 35 | 107 | 70 | −19 | −1.14 | −3.42 | −0.58 | 1.16 | 1.87 | 4.4 | 4.59 | 4.02 | 4.04 | 4.93 | 3.63 | 4.14 | 4.67 | 4.22 | 4.44 | 3.93 | 3.8 | 4.8 | 3.53 | 3.89 | 4.44 |
| Ecuador* | 8 | 78 | 67 | 63 | 4.06 | 3.66 | 3.09 | 3.98 | 3.82 | 5.55 | 5.29 | 4.45 | 4.2 | 3.74 | 3.07 | 4.09 | 3.9 | 5.81 | 5.6 | 4.65 | |||||||||
| Egypt* | 38 | 80 | 68 | 53 | 7 | 482 | 4 | 154 | −1.61 | −0.46 | 4.15 | 3.8 | 2.9 | 3.91 | 4.36 | 5.49 | 4.76 | 4.6 | 4.27 | 3.86 | 2.81 | 3.91 | 4.5 | 5.64 | 4.92 | 4.73 | |||
| El Salvador* | 19 | 66 | 94 | 40 | 20 | 89 | 117 | −2.06 | 0.53 | 3.72 | 3.73 | 3.23 | 4.49 | 3.74 | 5.22 | 5.56 | 3.69 | 3.72 | 3.8 | 3.16 | 4.62 | 3.71 | 5.35 | 5.68 | 3.71 | ||||
| Finland | 63 | 33 | 59 | 26 | 38 | 102 | 57 | −27 | −0.70 | −3.33 | −1.19 | 0.82 | 1.12 | 4.02 | 4.39 | 3.55 | 4.05 | 4.77 | 4.23 | 5.08 | 4.19 | 3.81 | 4.24 | 3.35 | 3.81 | 4.63 | 4.07 | 4.89 | 3.96 |
| France | 71 | 68 | 86 | 43 | 63 | 196 | 48 | −42 | −1.74 | −3.21 | −0.92 | 0.63 | 1.13 | 4.43 | 3.74 | 3.81 | 4.44 | 4.2 | 4.66 | 5.68 | 3.6 | 4.11 | 3.48 | 3.64 | 4.13 | 3.93 | 4.37 | 5.28 | 3.4 |
| Germany (West)* | 67 | 35 | 65 | 66 | 83 | 151 | 40 | −92 | 1.31 | 0.74 | 4.42 | 4.41 | 3.25 | 4.66 | 3.97 | 4.16 | 5.48 | 3.3 | 4.25 | 4.27 | 3.1 | 4.55 | 3.79 | 4.02 | 5.25 | 3.18 | |||
| Greece | 35 | 60 | 112 | 57 | 45 | 332 | 50 | 4 | −0.66 | −3.20 | −0.56 | 0.77 | 0.55 | 3.34 | 3.53 | 3.53 | 4.55 | 3.41 | 5.28 | 5.35 | 3.44 | 3.2 | 3.4 | 3.48 | 4.58 | 3.25 | 5.27 | 5.4 | 3.34 |
| Guatemala* | 6 | 95 | 101 | 37 | −1.7 | −0.17 | 3.85 | 3.35 | 3.14 | 3.96 | 3.78 | 5.54 | 5.47 | 3.91 | 3.81 | 3.24 | 3.02 | 3.89 | 3.7 | 5.63 | 5.6 | 3.89 | |||||||
| Hong Kong* | 25 | 68 | 29 | 57 | 61 | 17 | 0.27 | −1.80 | 0.32 | 1.2 | −0.98 | 4.69 | 3.88 | 3.26 | 4.53 | 4.03 | 5.33 | 4.94 | 3.72 | 4.8 | 4.03 | 3.47 | 4.67 | 4.13 | 5.32 | 4.96 | 3.9 | ||
| Hungary | 80 | 46 | 82 | 88 | 58 | 31 | −46 | −0.18 | −2.46 | −0.64 | 0.4 | −1.22 | 3.5 | 3.31 | 4.02 | 4.71 | 3.63 | 5.31 | 5.57 | 3.39 | 3.43 | 3.21 | 4.08 | 4.79 | 3.53 | 5.25 | 5.56 | 3.35 | |
| India | 48 | 77 | 40 | 56 | 51 | 26 | 18 | 0.13 | −1.12 | 0.18 | −0.36 | −0.21 | 4.11 | 4.04 | 2.89 | 3.7 | 4.25 | 5.81 | 5.29 | 4.45 | 4.25 | 4.19 | 2.9 | 3.73 | 4.38 | 5.92 | 5.47 | 4.57 | |
| Indonesia | 14 | 78 | 48 | 46 | 62 | 364 | 38 | 21 | 1.10 | −1.67 | −0.37 | −0.47 | −0.8 | 4.14 | 3.61 | 3.04 | 3.7 | 4.27 | 5.5 | 4.93 | 4.47 | 4.41 | 3.86 | 3.26 | 3.86 | 4.54 | 5.68 | 5.18 | 4.69 |
| Iran* | 41 | 58 | 59 | 43 | 14 | 339 | 40 | 114 | −1.22 | −0.45 | 4.58 | 3.7 | 2.99 | 4.04 | 3.88 | 6.03 | 5.43 | 4.23 | 4.58 | 3.7 | 2.99 | 4.04 | 3.88 | 6.03 | 5.43 | 4.23 | |||
| Ireland* | 70 | 28 | 35 | 68 | 24 | 208 | 65 | 91 | −0.40 | −3.13 | −0.06 | −0.91 | 1.18 | 4.3 | 3.93 | 3.19 | 3.93 | 4.57 | 5.12 | 5.13 | 4.96 | 4.36 | 3.98 | 3.21 | 3.92 | 4.63 | 5.14 | 5.15 | 4.96 |
| Israel | 54 | 13 | 81 | 47 | 38 | −0.14 | −2.39 | 0.52 | 0.26 | 0.36 | 4.03 | 3.82 | 3.21 | 4.19 | 4.4 | 4.63 | 4.71 | 4.07 | 4.08 | 3.85 | 3.19 | 4.23 | 4.46 | 4.7 | 4.73 | 4.1 | |||
| Italy | 76 | 50 | 75 | 70 | 61 | 248 | 30 | 5 | −0.24 | −3.91 | −1.31 | 0.13 | 0.6 | 3.66 | 3.34 | 3.3 | 4.12 | 3.75 | 4.99 | 5.45 | 3.66 | 3.58 | 3.25 | 3.24 | 4.07 | 3.68 | 4.94 | 5.43 | 3.63 |
| Japan | 46 | 54 | 92 | 95 | 88 | 233 | 42 | −80 | −0.56 | −1.88 | −0.33 | 1.96 | −0.05 | 4.22 | 4.29 | 3.17 | 3.69 | 5.23 | 4.72 | 5.23 | 4.34 | 4.22 | 4.29 | 3.19 | 3.59 | 5.19 | 4.63 | 5.11 | 4.3 |
| Korea (South)* | 18 | 60 | 85 | 39 | 100 | 353 | 29 | −96 | 0.61 | −1.37 | 4.53 | 3.9 | 2.45 | 4.36 | 5.2 | 5.71 | 5.69 | 3.73 | 4.55 | 3.97 | 2.5 | 4.4 | 5.2 | 5.54 | 5.61 | 3.81 | |||
| Kuwait* | 38 | 80 | 68 | 53 | 23 | 3.79 | 3.18 | 2.59 | 3.56 | 4.32 | 5.7 | 4.97 | 4.44 | 3.95 | 3.26 | 2.58 | 3.63 | 4.49 | 5.8 | 5.12 | 4.52 | ||||||||
| Malaysia* | 26 | 104 | 36 | 50 | 41 | 57 | 0.79 | −2.15 | 0.15 | −0.73 | 0.09 | 4.16 | 4.39 | 3.31 | 3.77 | 4.45 | 5.47 | 5.09 | 4.76 | 4.34 | 4.58 | 3.51 | 3.87 | 4.61 | 5.51 | 5.17 | 4.87 | ||
| Mexico | 30 | 81 | 82 | 69 | 24 | 325 | 97 | 99 | −0.01 | −2.48 | −0.73 | −1.47 | 1.03 | 3.97 | 3.75 | 3.5 | 4.31 | 3.95 | 5.62 | 5.07 | 3.84 | 4.1 | 3.87 | 3.64 | 4.45 | 4.06 | 5.71 | 5.22 | 3.98 |
| Morocco* | 46 | 70 | 68 | 53 | 14 | 333 | 25 | 178 | −1.32 | −1.04 | 4.31 | 3.5 | 3.08 | 4.72 | 4.18 | 6.37 | 6.14 | 4.52 | 3.99 | 3.26 | 2.84 | 4.52 | 3.87 | 5.87 | 5.8 | 4.19 | |||
| Netherlands | 80 | 38 | 53 | 14 | 67 | 1 | 68 | −55 | −0.86 | −3.09 | −0.39 | 0.71 | 1.39 | 4.46 | 4.72 | 3.62 | 4.46 | 4.62 | 3.79 | 4.32 | 4.02 | 4.32 | 4.61 | 3.5 | 4.32 | 4.46 | 3.7 | 4.11 | 3.86 |
| New Zealand | 79 | 22 | 49 | 58 | 33 | 152 | 75 | −17 | −0.69 | −2.87 | −0.34 | 0 | 1.86 | 4.86 | 3.46 | 3.18 | 3.53 | 4.96 | 3.58 | 5.12 | 4.43 | 4.72 | 3.47 | 3.22 | 3.42 | 4.81 | 3.67 | 4.89 | 4.32 |
| Nigeria* | 20 | 77 | 54 | 46 | 13 | 495 | 84 | 120 | −1.53 | 0.28 | 3.79 | 3.95 | 3.04 | 4.53 | 4 | 5.34 | 5.53 | 3.96 | 3.92 | 4.09 | 3.01 | 4.79 | 4.14 | 5.55 | 5.8 | 4.1 | |||
| Philippines | 32 | 94 | 44 | 64 | 27 | 387 | 42 | 115 | 0.63 | −2.03 | −0.36 | −1.21 | −0.11 | 4.21 | 3.92 | 3.42 | 3.85 | 4.37 | 6.14 | 5.15 | 4.88 | 4.47 | 4.15 | 3.64 | 4.01 | 4.65 | 6.36 | 5.44 | 5.12 |
| Poland | 60 | 68 | 93 | 64 | 38 | 267 | 29 | 6 | 0.41 | −2.04 | −0.60 | −0.78 | −0.14 | 3.96 | 3.23 | 3.94 | 4.11 | 4.51 | 5.55 | 5.09 | 3.67 | 3.89 | 3.11 | 4.02 | 4.06 | 4.53 | 5.52 | 5.1 | 3.61 |
| Portugal | 27 | 63 | 104 | 31 | 28 | 239 | 33 | 42 | −0.45 | −3.54 | −0.67 | −0.9 | 0.49 | 3.65 | 3.77 | 3.69 | 3.75 | 4.02 | 5.64 | 5.5 | 3.96 | 3.6 | 3.71 | 3.66 | 3.65 | 3.92 | 5.51 | 5.44 | 3.91 |
| Russia | 39 | 93 | 95 | 36 | 81 | 258 | 20 | −149 | 0.45 | −2.14 | −0.60 | 0.49 | −1.42 | 3.53 | 3.06 | 4.07 | 3.86 | 4.57 | 5.83 | 5.61 | 4.04 | 3.39 | 2.88 | 4.07 | 3.68 | 4.5 | 5.63 | 5.52 | 3.94 |
| Singapore | 20 | 74 | 8 | 48 | 72 | 287 | 46 | 11 | 0.85 | −1.96 | −0.36 | −0.54 | −0.28 | 4.81 | 4.88 | 3.52 | 4.06 | 4.77 | 5.66 | 4.92 | 3.29 | 4.9 | 5.07 | 3.7 | 4.17 | 4.9 | 5.64 | 4.99 | 3.49 |
| Slovenia | 27 | 71 | 88 | 19 | 49 | 236 | 48 | −46 | −0.36 | −3.14 | −1.31 | 0.73 | 0.36 | 3.62 | 3.56 | 3.84 | 4.01 | 4.09 | 5.49 | 5.32 | 3.75 | 3.66 | 3.59 | 3.96 | 4 | 4.13 | 5.43 | 5.33 | 3.79 |
| South Africa (White)* | 65 | 49 | 49 | 63 | 4.07 | 4.08 | 3.25 | 4.49 | 4.54 | 4.42 | 5.1 | 3.45 | 4.11 | 4.13 | 3.27 | 4.6 | 4.62 | 4.5 | 5.16 | 3.49 | |||||||||
| Spain | 51 | 57 | 86 | 42 | 48 | 244 | 44 | 20 | −0.92 | −3.36 | −0.96 | 0.09 | 0.54 | 4 | 3.52 | 3.06 | 4.39 | 3.87 | 5.53 | 5.53 | 3.29 | 4.01 | 3.51 | 3.01 | 4.42 | 3.85 | 5.45 | 5.52 | 3.32 |
| Sweden | 71 | 31 | 29 | 5 | 53 | 7 | 78 | −51 | −1.28 | −3.23 | −0.93 | 1.86 | 2.35 | 3.67 | 4.37 | 3.72 | 3.41 | 5.26 | 3.46 | 4.94 | 4.09 | 3.72 | 4.39 | 3.84 | 3.38 | 5.22 | 3.66 | 4.85 | 4.1 |
| Switzerland | 68 | 34 | 58 | 70 | 74 | 194 | 66 | −35 | −1.73 | −2.89 | −0.79 | 0.74 | 1.9 | 5.04 | 4.8 | 3.12 | 4.58 | 4.2 | 4.04 | 5.05 | 3.73 | 4.94 | 4.73 | 2.97 | 4.51 | 4.06 | 3.97 | 4.9 | 3.6 |
| Taiwan | 17 | 58 | 69 | 45 | 93 | 49 | −128 | 0.63 | −1.78 | −0.35 | 1.16 | −1.18 | 4.27 | 3.65 | 2.92 | 3.7 | 4.3 | 5.45 | 5 | 3.82 | 4.27 | 3.96 | 3.18 | 3.92 | 4.59 | 5.59 | 5.18 | 4.11 | |
| Thailand* | 20 | 64 | 64 | 34 | 32 | 45 | −0.64 | 0.01 | 3.84 | 3.27 | 3.26 | 3.58 | 3.88 | 5.72 | 5.62 | 4.87 | 3.93 | 3.43 | 3.35 | 3.64 | 4.03 | 5.7 | 5.63 | 4.81 | |||||
| Turkey | 37 | 66 | 85 | 45 | 46 | 379 | 49 | 65 | 0.34 | −1.86 | −0.53 | −0.89 | −0.33 | 3.82 | 3.74 | 3.02 | 4.42 | 4.02 | 5.79 | 5.43 | 3.92 | 3.83 | 3.74 | 2.89 | 4.53 | 4.03 | 5.88 | 5.57 | 3.94 |
| United Kingdom | 89 | 35 | 35 | 66 | 51 | 114 | 69 | −12 | −0.59 | −2.66 | 0.06 | 0.06 | 1.68 | 4.16 | 4.31 | 3.67 | 4.23 | 4.31 | 4.08 | 5.26 | 3.74 | 4.08 | 4.28 | 3.67 | 4.15 | 4.27 | 4.08 | 5.15 | 3.72 |
| United States | 91 | 40 | 46 | 62 | 26 | 172 | 68 | 148 | −0.09 | −2.73 | 0.23 | −0.81 | 1.76 | 4.45 | 4.13 | 3.36 | 4.5 | 4.21 | 4.22 | 4.92 | 4.18 | 4.49 | 4.15 | 3.34 | 4.55 | 4.2 | 4.25 | 4.88 | 4.17 |
| Venezuela | 12 | 81 | 76 | 73 | 16 | 310 | 100 | 150 | 0.22 | −2.64 | −0.17 | −1.6 | 0.43 | 3.41 | 3.43 | 3.6 | 4.26 | 3.96 | 5.41 | 5.22 | 4.19 | 3.32 | 3.35 | 3.62 | 4.33 | 3.96 | 5.53 | 5.4 | 4.25 |
| Zambia* | 27 | 64 | 52 | 41 | 30 | 42 | −0.77 | −0.62 | 4.01 | 3.55 | 2.88 | 4 | 4.41 | 5.72 | 5.23 | 5.12 | 4.16 | 3.62 | 2.86 | 4.07 | 4.61 | 5.84 | 5.31 | 5.23 | |||||

Source. Hofstede, Hofstede, and Minkov (2010), Inglehart (2007; most updated country scores from waves 1995 to 2006), Minkov (2008), Licht, Goldschmidt, and Schwartz (2007). House, Hanges, Javidan, Dorfman, and Gupta (2004; unstandardized scores from the cultural score tables in the body text and standardized scores from Appendix B, Table B2).
Note. Countries with an asterisk were not included in the ecological factor analysis of all dimensions (Table 4) due to a lack of country scores for some dimensions. H1 = individualism/collectivism; H2 = power distance; H3 = uncertainty avoidance; H4 = masculinity/femininity; H5 = long/short-term orientation; M1 = exclusionism/universalism; M2 = indulgence/restraint; M3 = monumentalism/flexumility; S1 = embeddedness/autonomy; S2 = hierarchy/egalitarianism; S3 = mastery/harmony; I1 = traditional/secular; I2 = self-expression/survival; G1 = performance orientation; G2 = future orientation; G3 = gender egalitarianism; G4 = assertiveness; G5 = institutional collectivism; G6 = in-group collectivism; G7 = power distance; G8 = humane orientation.
Schwartz’s cultural scores are based on a sample of over 15,000 urban teachers in Grades 3-12, surveyed during 1988-1998 (Licht et al., 2007, p. 667). The scores for bipolar dimensions have been calculated based on Schwartz’s procedure to subtract the scores of two poles of each bipolar dimension. For embeddedness vs. autonomy, he recommended to subtract the embeddedness score from the mean of the affective and intellectual autonomy scores (Schwartz, 2004).
Declaration of Conflicting Interests
The author(s) declared no potential conflicts of interest with respect to the research, authorship, and/or publication of this article.
Funding
The author(s) received no financial support for the research, authorship, and/or publication of this article.