
Abstract
The use of nations as units of analysis in cross-cultural studies is a controversial approach as nations may not be culturally homogeneous. However, a recent study by Minkov and Hofstede found that African, Asian, Latin American, and Anglo in-country regions tended to form homogeneous and distinct national clusters on World Values Survey (WVS) items. We extend this research to European regions, as well as randomly formed nationally homogeneous groups of European respondents, using value measures from the 2010 European Social Survey (ESS). We find that the regions of most European countries, as well as the randomly formed groups, tend to group into national clusters. We also find that large samples of randomly chosen individuals from diverse nations cannot be sorted into nations. Our findings have theoretical implications for the conceptualization of culture as something shared at the group level rather than the individual.
And, you know, there is no such thing as society. There are individual men and women and there are families.
The Sharedness of Culture
Since the publication of Hofstede’s (1980) first monograph, many authors have followed his approach of comparing modern nations on a variety of cultural indicators. However, while the use of nations as units of analysis in cross-cultural studies has many supporters, it has also drawn various criticisms (for reviews, see Minkov, 2013; Minkov & Hofstede, 2012; Peterson & Smith, 2008). The most serious argument against the use of nations as units of analysis is that they are not necessarily homogeneous: There may be so much cultural variability within a nation that viewing it as a single cultural entity is not justified.
According to Minkov (2013), this intranational cultural variability is completely irrelevant to the question of whether nations should be used as units of analysis just as the enormous diversity of cells and organs that make up a human body is completely irrelevant to the question of whether one should study individuals. Indeed, as far as we know, no psychologist has ever argued that individuals do not make good units of analysis because they consist of extremely diverse elements. A complex system, such as an individual or a nation, is not to be identified with any of its elements or even with the simple sum of those elements. However, what evidence is there that nations do indeed represent cultural systems? Are they not just loose amalgamations of individuals who happen to live on the territory of the same political unit without anything that binds them into a cultural or social unit? Might Margaret Thatcher have been right?
Apart from the political aspects of this question, it is relevant to social scientists for two reasons: practical and theoretical. The practical reason is simple: Should researchers continue to do analyses at the national level or not? Theoretically, the question has to do with the conceptualization of culture. According to Dorfman and House (2004), when the term “culture” is discussed, the focus is often on the so-called “sharedness” of the cultural indicators among members of the collective. In the view of some authors, a culture exists or emerges whenever a set of assumptions is commonly held by a group of people (e.g., Boyacigiller, Kleinberg, Phillips, & Sackman, 2007). Similarly, according to Fischer (2009), “culture is typically defined as a ‘collective’ phenomenon that is approximately ‘shared’ among members of a culture” (p. 29), whereas Inglehart (1997) stated that culture was a system of attitudes, values, and knowledge widely shared within a society (p. 15).
In view of these theoretical conceptualizations of culture, if nations turn out to be culturally heterogeneous, we have a theoretical problem. It can be resolved in two ways that seem mutually exclusive. The first solution is to abandon the concept of national culture. The second is to abandon the concept of sharedness as a defining characteristic of culture. Neither of the two solutions seems easy to adopt because national culture and sharedness are notions to which many prominent scholars are strongly committed.
The issue of cultural sharedness raises two questions. The first is exactly what cultural features can be expected to be shared by the members of a given society. The second question is what exactly we mean by sharedness: How should it be operationalized so as to be measured? The order in which we ask these two questions may seem strange, but this is in fact the historical order in which they appeared. What is shared was discussed long before any operationalizations of sharedness.
If culture is viewed mostly as a set of symbols and their meanings (Geertz, 1973; White, 1959/2007), it has a semantic character and resembles a language shared by all adult members of a particular society. However, what if culture is viewed as consisting of values, beliefs, attitudes, and other patterns of thinking and feeling—the so-called software of the mind (Hofstede, 1980, 2001)? Are these also shared? And how is sharedness to be operationalized empirically?
We must note that it is not our intention to evaluate the merits of these two conceptualizations of the contents of culture: meanings versus values, beliefs, and attitudes. They are not mutually exclusive. Consequently, culture can be viewed as consisting of meanings and values (as well as beliefs, attitudes, and whatever else cross-cultural psychologists measure). However, we focus on the latter conceptualization as it is the one that creates practical and theoretical problems for the concept of national culture. There is hardly any controversy that nearly all adult members of a given nation, who are in a normal state of mind, interpret commonly used hand signs in the same way and know the symbolic meaning of various colors (such as black for death and mourning) or common rituals.
Because cross-cultural psychologists prefer to work at the individual level, they also study and operationalize cultural sharedness at that level. Most recently, Fischer and Schwartz (2011) attempted to measure sharedness of values across individuals within modern nations. They based their operationalization of sharedness on the concept of interrater agreement (more precisely on the version proposed by Brown & Hauenstein, 2005), commonly used in organizational studies. Although there are different statistical tools that measure interrater agreement, the most commonly used ones are derived from the ratio of the observed variance to the variance of a null or uniform distribution (Brown & Hauenstein, 2005). Operationalizing sharedness as interrater agreement, Fischer and Schwartz (2011) found little individual-level agreement around values within nations and considerable consensus across countries on most values. They interpreted this as evidence of a low level of sharedness among individuals. They also believed that this challenges the concept of culture as consisting of values (and most probably also of beliefs, attitudes, and other types of mental software measured in cross-cultural psychology) that are shared by the individual members of a particular society or community and distinguish them from those of another society or community. Finally, Fischer and Schwartz stated that their study refutes claims that culture determines values. In our view, the claims that they refere to are not only controversial but also simplistic.
Studying Cultural Sharedness at the Group Level
Yet, there is a different approach to the study of national cultural sharedness. It can be done at the group level. Instead of comparing individuals, one can compare various groups inside nations and assess how similar or diverse they are. And instead of measuring sharedness in terms of agreement, one can operationalize it in terms of proximities: Subjects (groups of people in this case) who are close together on some measure of culture share a cultural space. Adopting this approach, Inglehart and Welzel (2010) reported that cultural distances between nations were considerably greater than those within nations. For instance, the average values and beliefs of university-educated Italians, taken as a single group, were closer to those of their fellow countrymen and women without university education, also taken as a single group, than to the values of university-educated French citizens. This can be construed as cultural sharedness across groups of people within Italy, as well as other countries that exhibit the same pattern.
Minkov and Hofstede (2012) carried out a different group-level analysis. Using World Values Survey (WVS) measures of values, they found that the 299 in-country regions in Asia, Africa, Latin America, and the Anglo world for which data were available could be sorted out into national clusters through hierarchical cluster analysis (HCA). They reported that these value-based clusters were quite homogeneous in the sense that each contained mostly regions from a single nation, with few regions crossing national borders to end up in a cluster where they were not expected. As a result, each national cluster of in-country regions tended to be clearly delineated from the clusters of other nations. Minkov and Hofstede concluded that if this is so, there is an invisible gravitational force that pulls together the regions of a given nation while separating it from the regions of other nations. What else could this force be if not national culture?
Thus, if cultural sharedness is construed as proximity (rather than interrater agreement), and if it is measured at the group level, not at the individual, there seems to be evidence of sharedness in a particular sense: In-country regions share membership of a particular nation not only politically but also culturally, as long as we accept that values are cultural indicators. Culture can be viewed as a gravitational force that brings the regions of a nation together, into a shared cultural space, and keeps them apart from the regions of other nations that share different cultural spaces.
As far as we know, Minkov and Hofstede’s study was the first of its kind and the only one so far. As such, it provides only limited evidence. If its results were replicable with new data, outside the WVS, they could have important consequences for the theoretical conceptualization and empirical study of culture. Therefore, we tested Minkov and Hofstede’s conclusions using new data from a different source and about a different set of countries.
One might suspect that Minkov and Hofstede’s results might not be replicated in Europe. From the fall of the Roman Empire to the end of World War II, most European regions have changed hands many times. For instance, some very old inhabitants of the city of Dubrovnik observe that without ever leaving their home place, they have lived in five states: Austria-Hungary, the Kingdom of Yugoslavia, the Independent State of Croatia, the Socialist Republic of Yugoslavia, and present-day Croatia. In addition, Eastern Europe is home to many new states, some of which have been independent for only about two decades and had never existed before. Large territories in Eastern Europe, especially in Poland and Ukraine, have experienced Scandinavian, Polish, Russian, Lithuanian, Austro-Hungarian, and Prussian rule; some have also been Turkish or Tatar provinces. Furthermore, several European countries (Belgium, Spain, Switzerland, and Ukraine) are linguistically divided. With the exception of Switzerland, these divisions are accompanied by a certain amount of political tension between the speakers of different languages, including separatist moods. Such moods exist also in the United Kingdom, especially in Scotland, whose inhabitants have always maintained a distinct identity.
This makes the European regions an interesting object of cultural investigation. We use data for 313 European regions from 23 countries plus two European countries represented as single regions: Cyprus and Luxembourg. Israel, also represented as a single region, was also included in the analysis as a 316th region. We hypothesized that these regions would form homogeneous country clusters on measures of values, forming coherent national entities that represent shared cultural spaces.
We were also inspired by the conclusions of two previously mentioned studies: Fischer and Schwartz (2011) and Inglehart and Welzel’s (2010). The former suggests that because there is considerable consensus on values across countries, and little sharedness across the individuals of a given country, if we know the values of a large sample of individuals from different countries, we cannot sort them out into clusters corresponding to their nations of origin. We tested this hypothesis using large samples of European individuals.
Vice versa, the latter study suggests that if we know the average values of groups of people from different nations, we should be able to sort out those groups into national clusters. However, do all groups have this tendency? We tested the hypothesis that randomly formed nationally homogeneous small groups of individuals from European nations will form national clusters.
Method
First Test: Clustering of European Regions
We used the latest available data (2010) from the European Social Survey (ESS) accessible on the organization’s official website http://www.europeansocialsurvey.org. On that website, the ESS defines itself as “an academically-driven social survey designed to chart and explain the interaction between Europe’s changing institutions and the attitudes, beliefs and behavior patterns of its diverse populations.” It is directed by Rory Fitzgerald of the Center for Comparative Social Surveys at the City University of London (the United Kingdom). The other institutions that participate in the management of the project are the Norwegian Social Science Data Services, GESIS–Leibnitz Institute for the Social Sciences (Germany), the Netherlands Institute for Social Research, University of Pompeu Fabra (Spain), University of Leuven (Belgium), and University of Ljubljana (Slovenia).
The ESS has so far carried out, and published the results of, five rounds of nationally representative surveys. Together, these rounds cover nearly all European countries, except some former Yugoslav and Soviet republics. However, the countries represented in the different rounds do not always overlap completely.
Although many of the items in the ESS target political issues, 21 are value items, borrowed from the work of Israeli cross-cultural sociologist and psychologist Shalom Schwartz and his associates (Schwartz; 1994, 2007, 2011; Schwartz & Bardi, 2001; Schwartz et al., 2001; Schwartz & Sagiv, 1995). The 21 items are provided in the appendix at the end of this article.
For all our tests, we used the official ESS file with 2010 data (ESS5e02), freely available from the ESS website. The ESS5e02 contains data for 50,781 individuals from 25 European countries and Israel.
For our first test, we aggregated the data to the regional level. After aggregation, we obtained data for 313 regions from 23 countries, plus Cyprus, Israel, and Luxembourg represented as single regions. Below, we list the available countries and the number of regions in each of them for which ESS 2010 data are available. In most cases, these regions are administrative units. In many cases, they have a clear geographic and historical identity, such as Bayern (Bavaria), Saarland, and Sachsen (Saxony) in Germany; Pays Vasco (Basque country), Aragon, Catalunya (Catalonia), Galicia, and Andalucia (Andalusia) in Spain; Bretagne (Brittany), Alsace, Bourgogne (Burgundy), and Haute Normandie (High Normandy) in France; Limburg, Friesland, and Zeeland in the Netherlands; or Wales, Northern Ireland, and Scotland in the United Kingdom. It is noteworthy that although the original ESS5e02 file mentions 19 Spanish regions, it produced aggregated data for 18. In addition, although the file mentions 26 Ukrainian regions, it produced aggregated data for 23. The following is the list of countries that we worked with, their WVS codes, and the number of WVS-determined regions in each of them.
Belgium (BE) 10
Bulgaria (BG) 28
Croatia (HR) 3
Cyprus (CY) 1
Czech Republic (CZ) 14
Denmark (DK) 5
Estonia (EE) 5
Finland (FI) 19
France (FR) 21
Germany (DE) 16
Greece (GR) 13
Hungary (HU) 20
Israel (IL) 1
Ireland (IE) 8
Luxembourg (LX) 1
Netherlands (NL) 12
Norway (NO) 7
Poland (PL) 15
Portugal (PT) 5
Russia (RU) 6
Slovakia (SK) 8
Slovenia (SI) 12
Spain (ES) 18
Sweden (SE) 21
Switzerland (CH) 7
Ukraine (UA) 23
United Kingdom (UK) 12
After aggregating the data to the regional level, we used HCA in SPSS 17.0 to ascertain how these regions would cluster. We used two different clustering techniques:
Euclidian distance. With this method, the clustered items are assigned positions in a multidimensional space and physical distances are calculated between them, as if they were physical objects in space. The distance between two items is the length of the straight line between them. If the two items are an ordered pair in a two-dimensional Euclidian space, and if we know their coordinates, the distance between them can be calculated using the Pythagorean formula.
Pearson correlation distance. This method transposes rows (cases) into columns (variables) and vice versa, and calculates Pearson correlations between the new columns. Thus, if after the transposition, Scotland’s column correlates highly with Wales’ column, that means that these two former cases, now treated as variables, have very similar answer patterns on the items of interest; therefore, they are culturally close.
In both cases, we used between-groups linkage, which is a bottom-up approach to clustering: It starts with the smallest possible clusters and groups them hierarchically into increasingly large clusters. For the Euclidian method, we used raw scores, yet for the Pearson method we resorted to the customary z-score standardization by variable.
Unless the number of available cases or variables is very small, the Euclidian and the Pearson method yield very similar results. Comparing the results of the two methods, we observed that the Pearson method yielded slightly clearer results for the first test, whereas the Euclidian method was slightly preferable for the third test described below. As a rule, we report only the results from the superior of the two methods, mentioning results with the other method only in controversial cases.
Second Test: Clustering of Randomly Chosen European Individuals
To test our second hypothesis, we used randomly chosen samples of individuals, each consisting of 500 to 600 individuals drawn from 25 European countries plus Israel, or approximately 20 individuals per nation. We used the same file—ESS5e02—with data from the 2010 round of the ESS. Like in the previous test, we performed a HCA, with Euclidian as well as Pearson distances and between-group linkages. Because of the exploratory nature of our analysis, we also tried other linkages, as well as various types of data standardizations (by case and by variable) and raw item scores. No matter what combination of methods we used, the results were the same.
Third Test: Clustering of Randomly Formed Nationally Homogeneous Small Groups of Europeans
To test our third hypothesis, we randomly selected 2,600 individuals from the 25 European nations in the 2010 round of the ESS plus Israel. In this way, we obtained samples of approximately 100 individuals from each of those 26 nations. Then, we split each nation’s sample into 5 or 6 randomly formed groups of approximately equal size, consisting of approximately 20 individuals each. In the end, we had 132 randomly formed, nationally homogeneous groups of about 20 individuals each, coming from 26 nations. We performed a HCA with Euclidian distances, raw scores, and average linkage between groups. We tried other combinations of methods as well, but this one seemed to yield the clearest results.
Results
Test 1
Our analysis produced a hierarchical clustering dendrogram showing how all available 316 European regions clustered. Because the whole dendrogram is too large to show in a single graph, we divided it into 10 sections, each containing a more or less clearly delineated supranational cluster. We show those 10 dendrogram sections in 10 graphs. We also provide details for each country.
Figure 1 shows a large supranational cluster consisting of Dutch, Danish, Swedish, Norwegian, and Finnish regions clearly grouped into distinct national clusters, as well as a vagrant Swedish region.
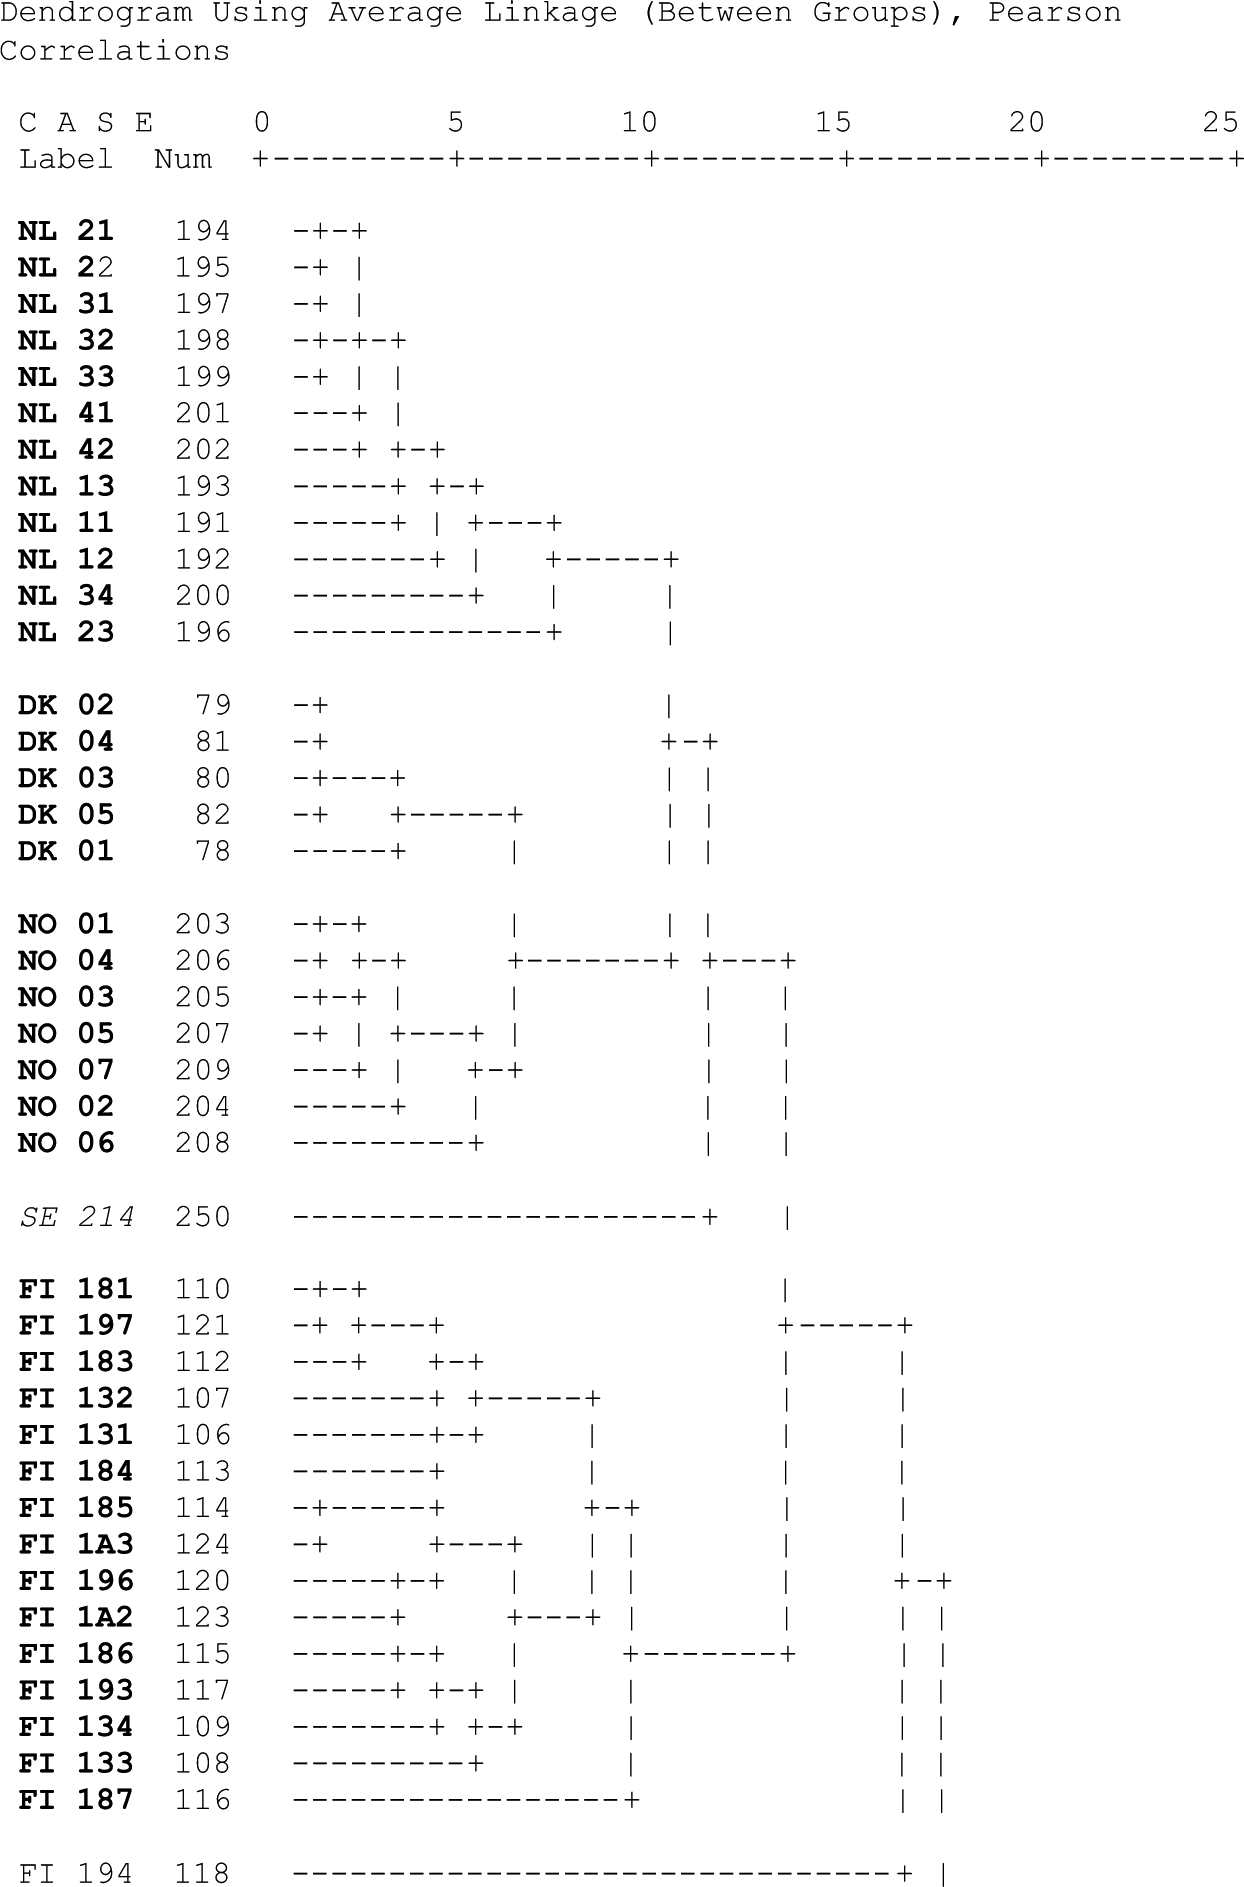
Hierarchical clustering of European regions on 21 measures of values: Section of the Netherlands (NL), Denmark (DK), and Norway (NO).
Netherlands
All 12 Dutch regions (100%) form a homogeneous and clearly delineated national cluster.
Denmark
All five Danish regions (100%) form a homogeneous and clearly delineated national cluster.
Norway
All seven Norwegian regions (100%) form a homogeneous and clearly delineated national cluster
Finland
Fifteen of the 19 Finnish regions (79%) form a homogeneous and clearly delineated national cluster. Two of the remaining four regions gravitate toward the Swedish cluster and one gravitates ambiguously toward Germany or Switzerland. One Finnish region seems equally close to the Finnish and the Norwegian cluster.
Figure 2 shows a Spanish cluster, plus a vagrant German region attached to it.

Hierarchical clustering of European regions on 21 measures of values: Section of Spain (ES).
Spain
Fifteen of the 18 Spanish regions (83%) form a homogeneous and clearly delineated national cluster. One of the remaining three region (ES 53 “Illes Balears”) is attached to the Estonian cluster, one (ES 13 “Cantabria”) is linked to the Swedish cluster, and one (ES 42 “Castilla - La Mancha”) to the Irish cluster.
Figure 3 here shows a supranational cluster consisting of German and Swiss regions as well as a vagrant Finnish region attached to them.
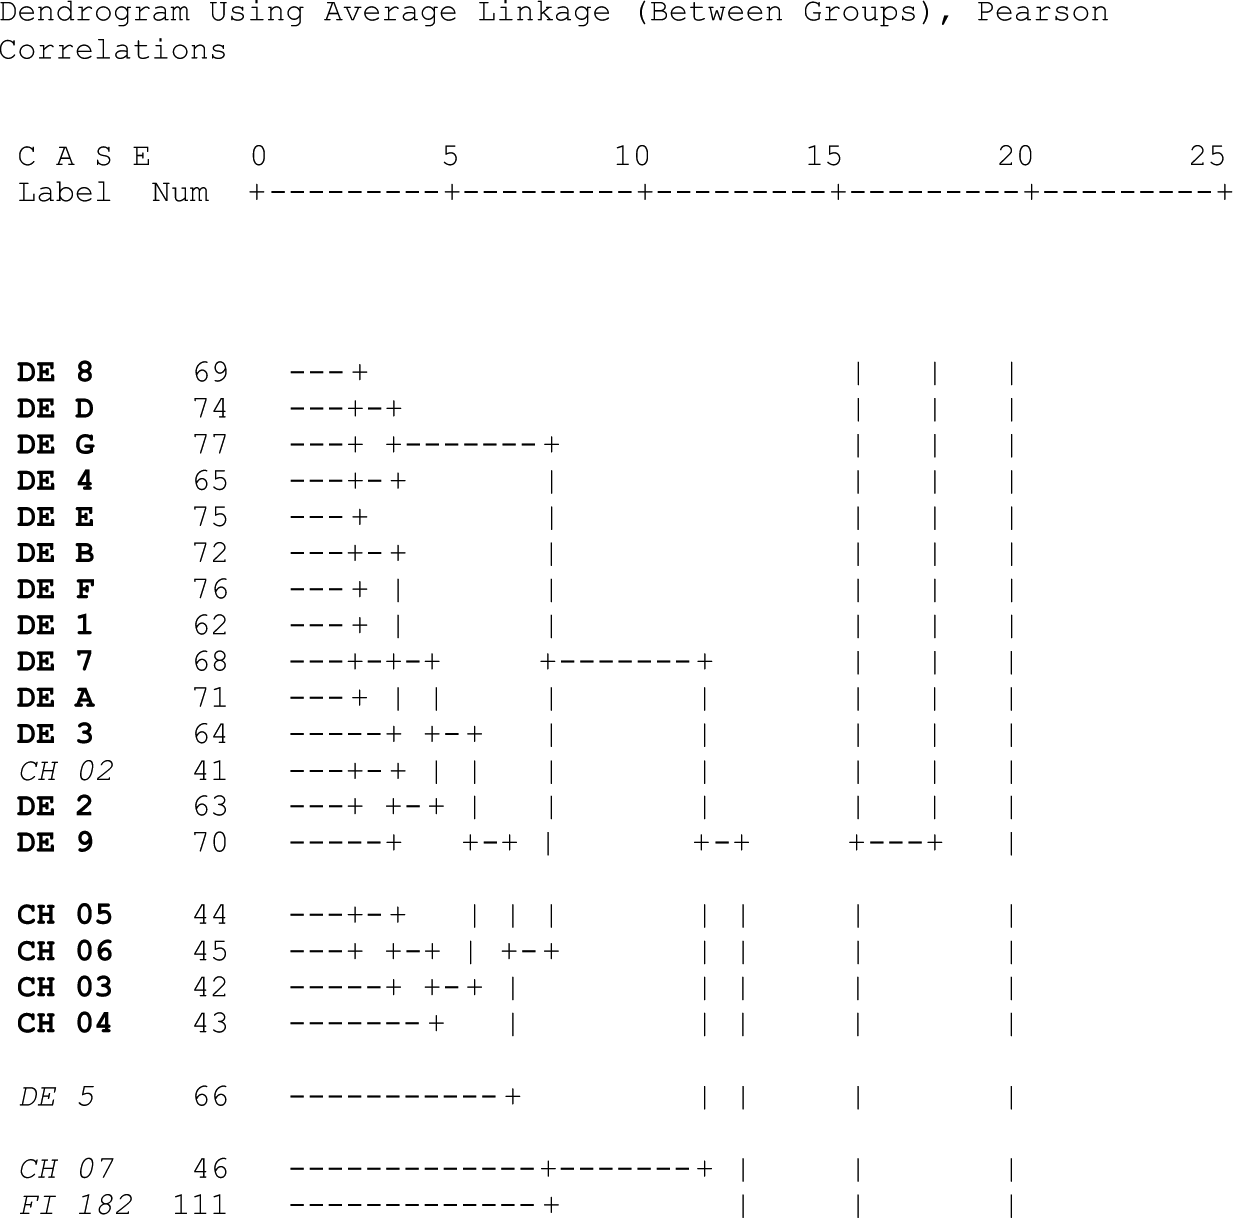
Hierarchical clustering of European regions on 21 measures of values: Section of Germany (DE) and Switzerland (CH).
Germany
Thirteen of the 16 German regions (81%) form a national cluster, yet one Swiss region is embedded in it. One of the remaining German regions is attached to the Slovene cluster and one to the Spanish. One German region seems equally close to the German and the Swiss cluster.
Switzerland
Four of the seven Swiss regions (57%) form a homogeneous and clearly delineated national cluster, albeit closely linked to the German cluster. One of the remaining Swiss regions (CH02 “Espace Mittelland”) is embedded in the German cluster, one (CH01 “Region lemanique”) is attached to the French cluster, and one (CH07 “Ticino”) seems to be equally close to Switzerland and Germany.
Figure 4 shows a supranational cluster consisting of two clearly delineated clusters: the regions of Belgian Wallonia and the regions of France. Luxembourg (LX) and one Swiss region are attached to them. It is noteworthy that the regions of Belgian Flanders are not part of this supranational cluster.
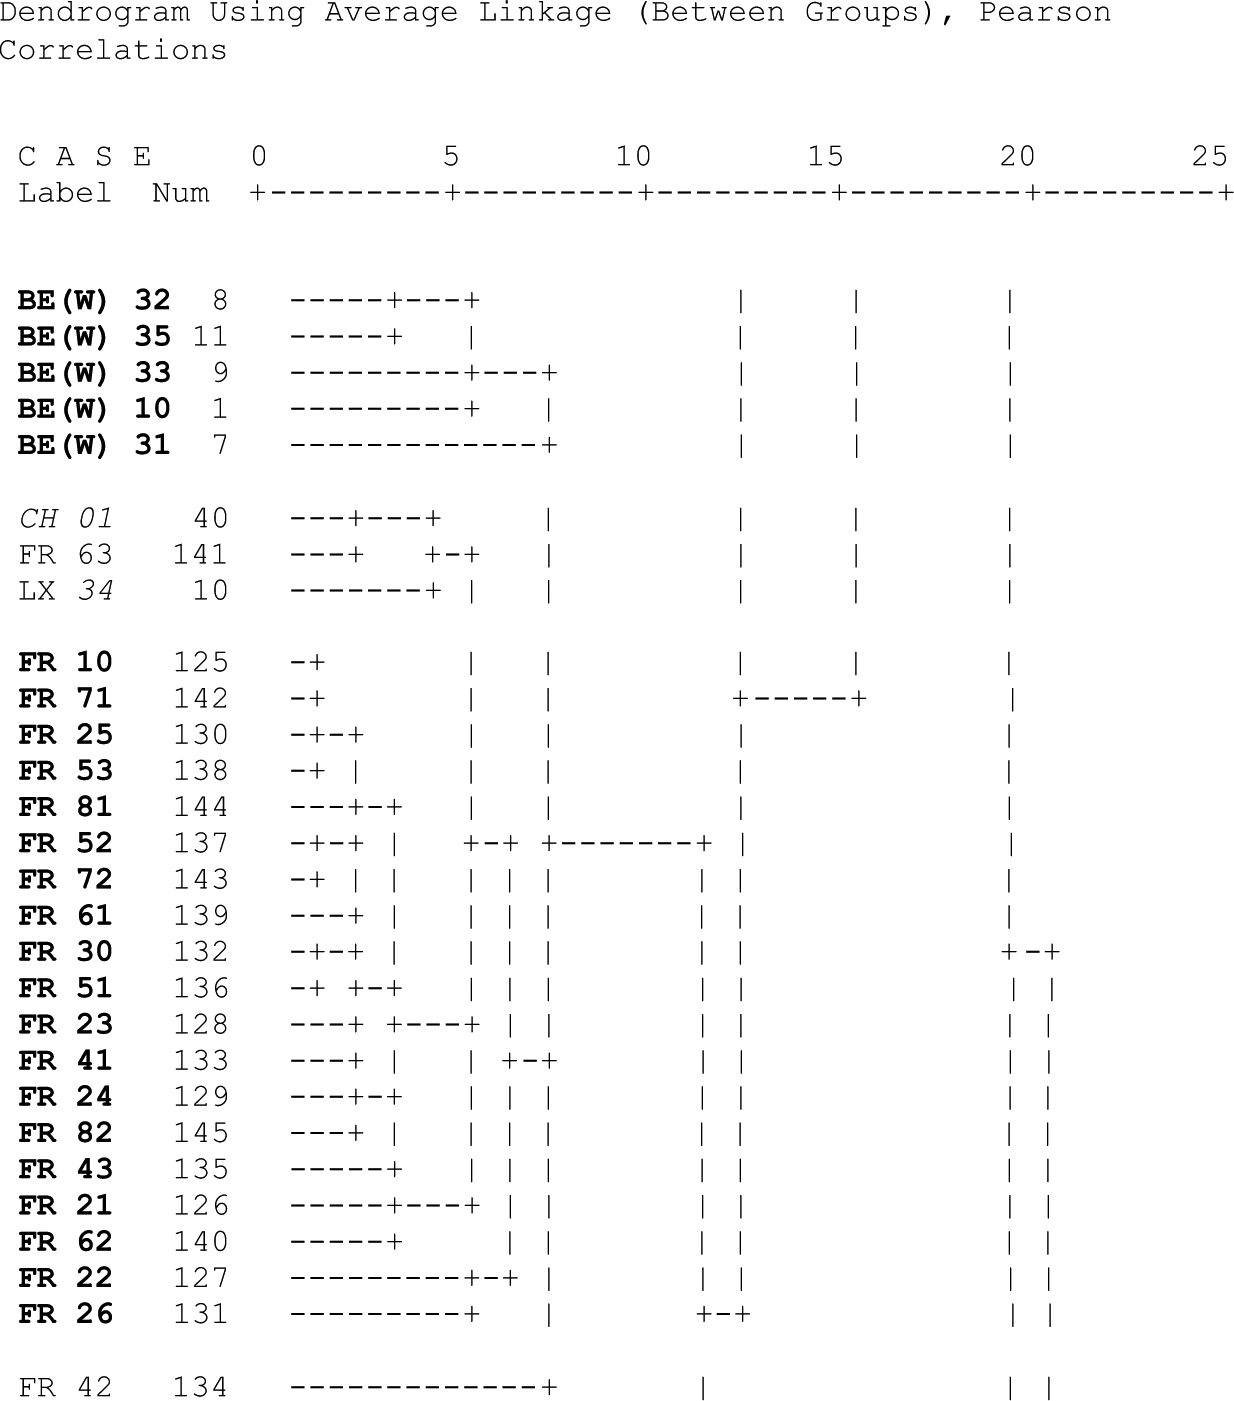
Hierarchical clustering of European regions on 21 measures of values: Section of Belgian Wallonia (BE(W)) and France (FR).
Belgium–Wallonia
The regions of Belgium form two clearly separated clusters: Flanders (Dutch speaking) and Wallonia (French speaking). All the five Walloon regions (100%) form a homogeneous and clearly delineated cluster, closely attached to the French cluster. The cluster of Flemish regions is also attached to the French cluster, albeit at a greater distance than that between Wallonia and France. According to our results, the closest cultural neighbor of Flanders is Sweden; this is shown in Figure 5 below. However, the Euclidian method does not confirm either Wallonia’s cultural attachment to France or Flanders’ linkage to Sweden.
Hierarchical clustering of European regions on 21 measures of values: Sections of Belgian Flanders (BE(F)) and Sweden (SE).
France
Seventeen of the 21 French regions (81%) form a homogeneous and clearly delineated national cluster. The remaining four regions are attached to it.
Luxembourg
This country is represented as a single region, coded by the WVS as a region of Belgium. It clusters together with a Swiss and a French region. This three-member cluster is linked to the French cluster.
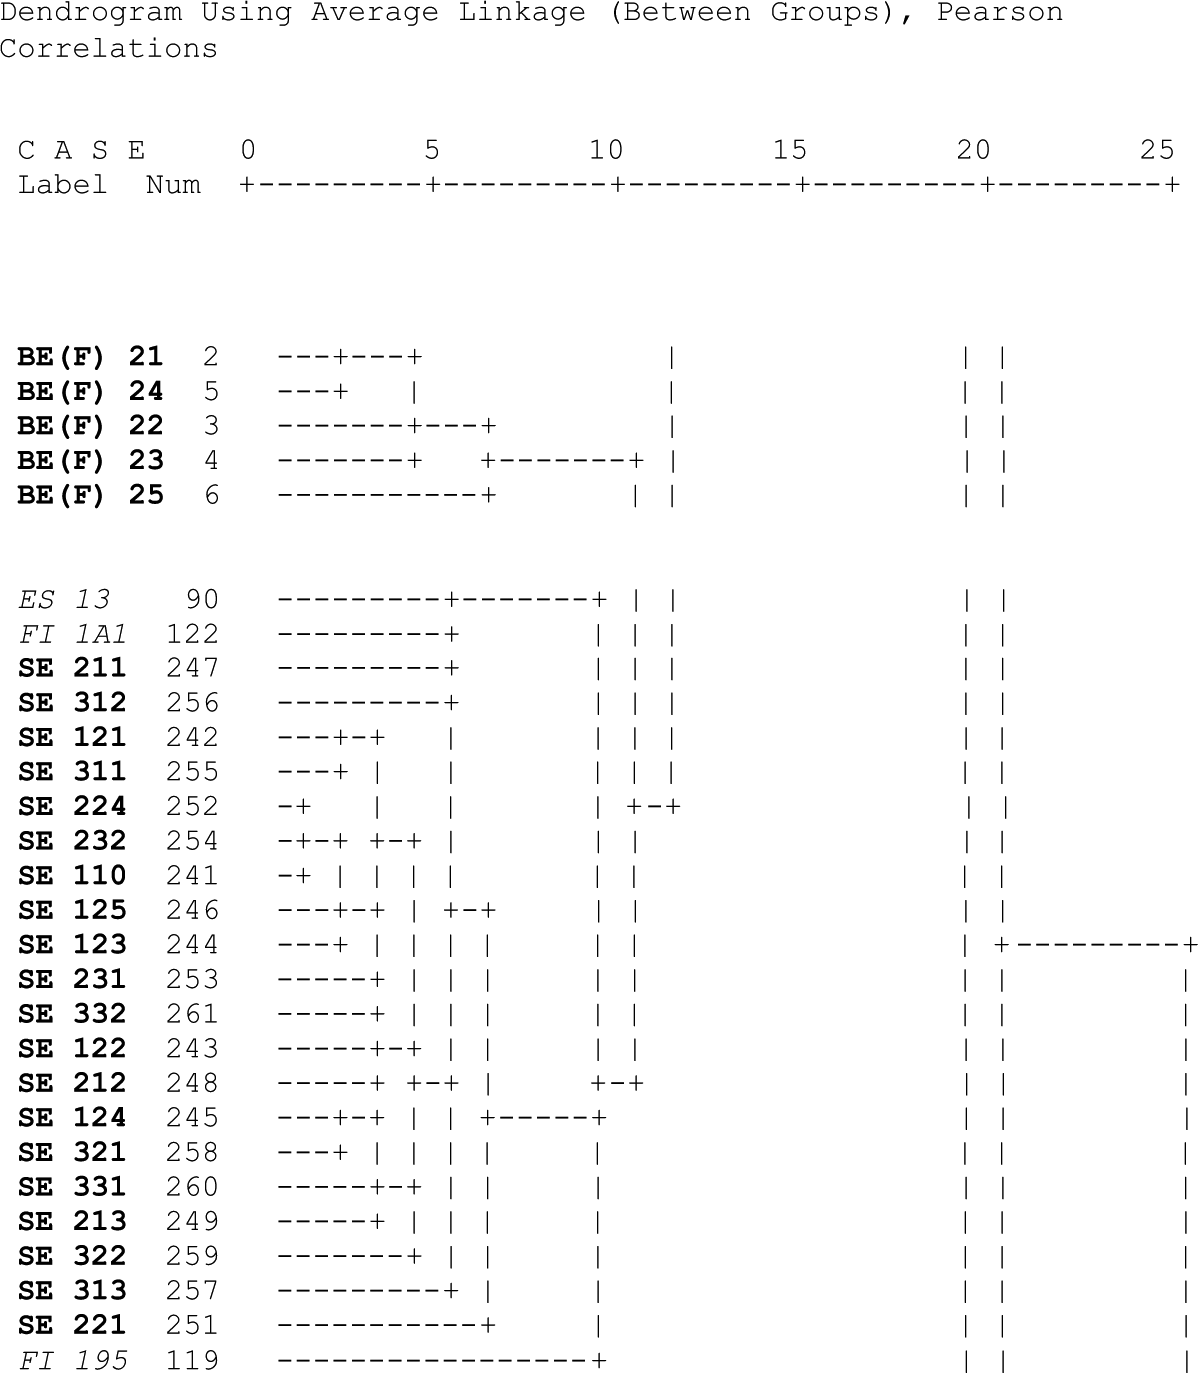
Figure 5 shows a supranational cluster consisting of two national clusters: the regions of Belgian Flanders and those of Sweden.
Belgium–Flanders
All the five Flemish regions (100%) form a homogeneous and clearly delineated cluster attached to the Swedish cluster.
Sweden
Twenty of the 21 Swedish regions (95%) form a homogeneous national cluster. Yet, one Spanish region and two Finnish regions are laterally linked to the Swedish cluster and the linkage is so close that they could be part of Sweden. The remaining Swedish region (SE 214 “Gotland”) is on its own remotely linked to the Norwegian, Danish, and Dutch clusters.
Figure 6 shows an Estonian cluster with a vagrant Spanish region attached to it.

Hierarchical clustering of European regions on 21 measures of values: Section of Estonia (EE).
Estonia
All five Estonian regions (100%) form a homogeneous and clearly delineated national cluster. This is the only former Soviet bloc member included in our data that is part of the West European mega cluster. We did not have data for the other Baltic republics.
Figure 7 shows a supranational cluster consisting of two national clusters: United Kingdom regions and Greek regions. There is also a mixed cluster of United Kingdom regions, Irish regions, and Cyprus (CY).
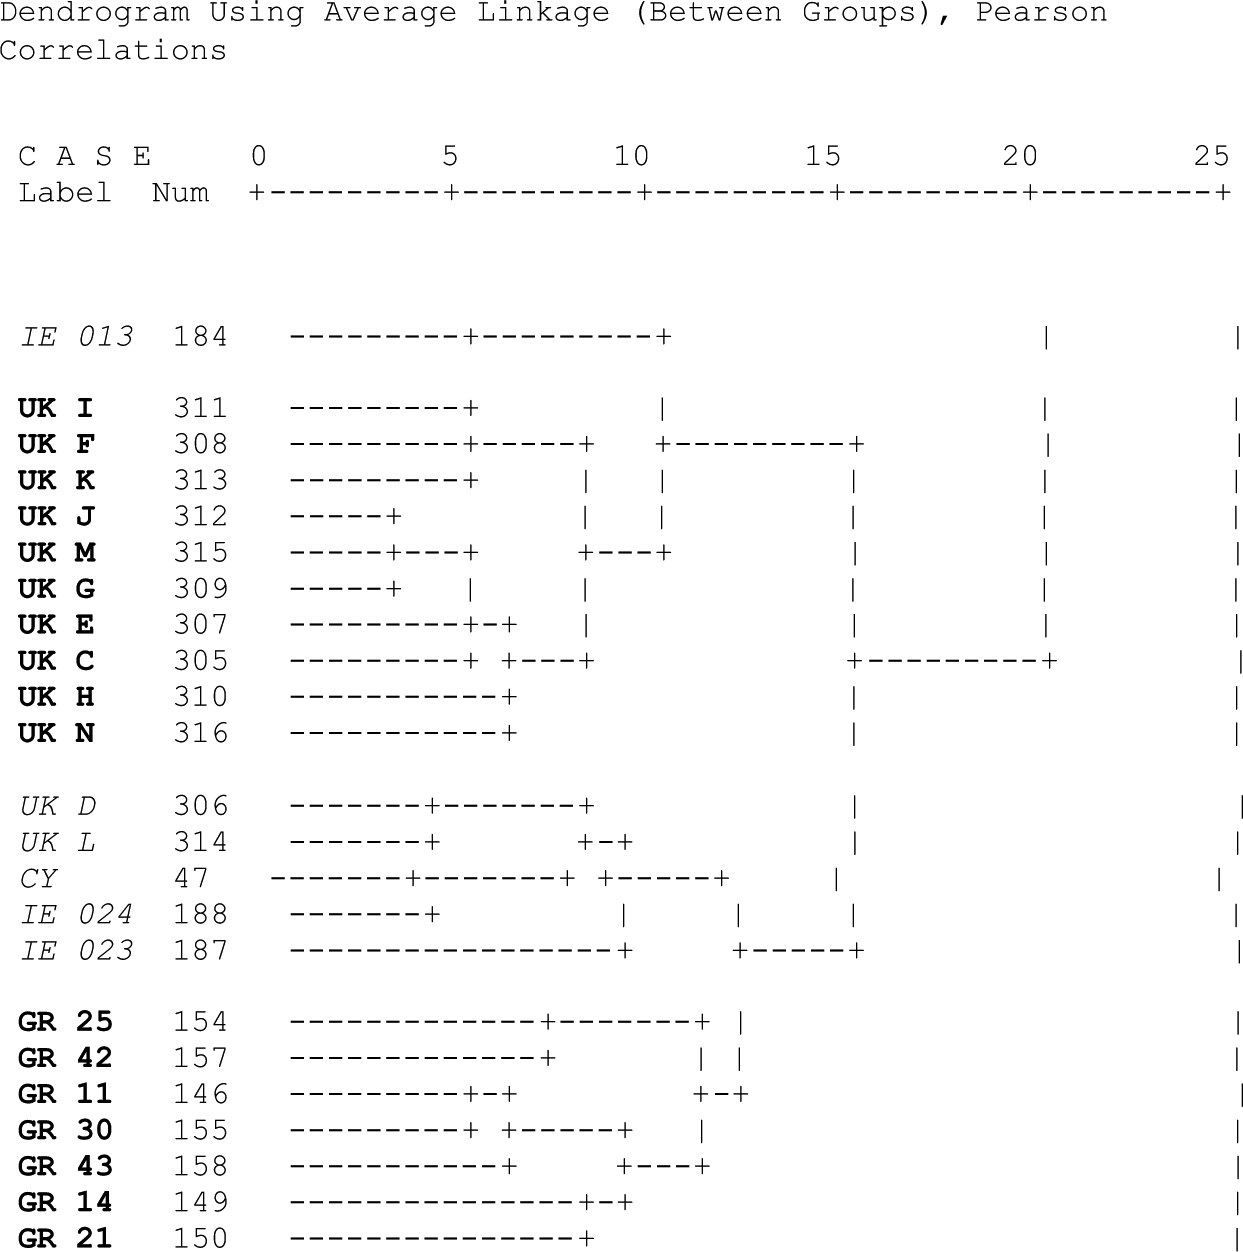
Hierarchical clustering of European regions on 21 measures of values: Section of United Kingdom (UK) and Greece (GR).
United Kingdom
Ten of the 12 British regions (83%) form a homogeneous and clearly delineated national cluster. The remaining two regions (UK D “North-West (England)” and UK L “Wales”) are attached to that cluster, together with Irish regions and Cyprus. There is no evidence that Scotland and Northern Ireland are culturally distinct from the English regions in terms of values.
Greece
Seven of the 13 Greek regions (54%) form a homogeneous and clearly delineated national cluster. One of the remaining six regions (GR22 “Ionia Nisia”) is attached to the Irish cluster, whereas the other ones are members of diverse mixed clusters of East European regions.
The Euclidian method produces similar results, although the vagrant Greek regions are members of other mixed clusters.
Cyprus
Represented as a single region, Cyprus is assigned a place in a mixed cluster consisting of British and Irish regions.
According to the Euclidian method, Cyprus is amid the Greek cluster.
Figure 8 shows a supranational cluster consisting of national clusters containing Croatian regions, Bulgarian regions, Ukrainian regions, Slovak regions, and Polish regions, as well as a mixed Ukrainian-Polish cluster, and a very small mixed cluster with regions from Slovenia, Portugal, Ukraine, Russia, Greece, and Bulgaria.

Hierarchical clustering of European regions on 21 measures of values: Section of Croatia (HR), Bulgaria (BG), Ukraine (UA), Slovakia (SK), and Poland (PL).
Croatia
All three Croatian regions (100%) form a homogeneous and clearly delineated national cluster.
Bulgaria
Twenty-one of the 28 Bulgarian regions (75%) form a homogeneous and clearly delineated national cluster. The remaining seven regions are members of mixed clusters containing diverse East European regions.
Ukraine
Eleven of the 23 Ukrainian regions (48%) form a clearly delineated cluster, also containing two Russian regions (RU05 “Volga” and RU06 “North Caucasus”), and one Polish region (PL61 “Kujawsko pomorskie”). Two of the remaining 12 Ukrainian regions (UA19 “Ternopilska oblast” and UA23 “Cherkasska oblast”) are laterally linked to the Slovak cluster. The other 10 Ukrainian regions are members of diverse mixed clusters, containing Polish, Slovak, and Bulgarian regions.
The Euclidian method confirms this relatively high degree of dispersion of the Ukrainian regions among various East European clusters.
Slovakia
Six of the eight Slovak regions (75%) form a homogeneous and clearly delineated national cluster. The remaining two (SK022 “Trencianski kraj” and SK031 “Zilinski kraj”) are separate and linked to the Russian cluster, as well as a mixed East European cluster.
Poland
Eight of the 15 Polish regions (53%) form a homogeneous and clearly delineated cluster. The remaining 7 regions are split into two. One group of 4regions is linked to the Slovak cluster. The other group, consisting of 3 regions is remotely linked to a supranational cluster formed by the Czech cluster, the Russian cluster, and a mixed Ukrainian-Bulgarian cluster.
Figure 9 shows a supranational cluster consisting of national clusters of Portuguese regions, Irish regions, Czech regions, and Russian regions. In addition, we observe a cluster of Ukrainian, Russian, and Bulgarian regions, a cluster of Slovak, Greek and Portuguese regions, and a cluster of Polish and Ukrainian regions. Of note, Israel is also part of this supranational cluster as well as a vagrant Spanish region and a Slovene region.
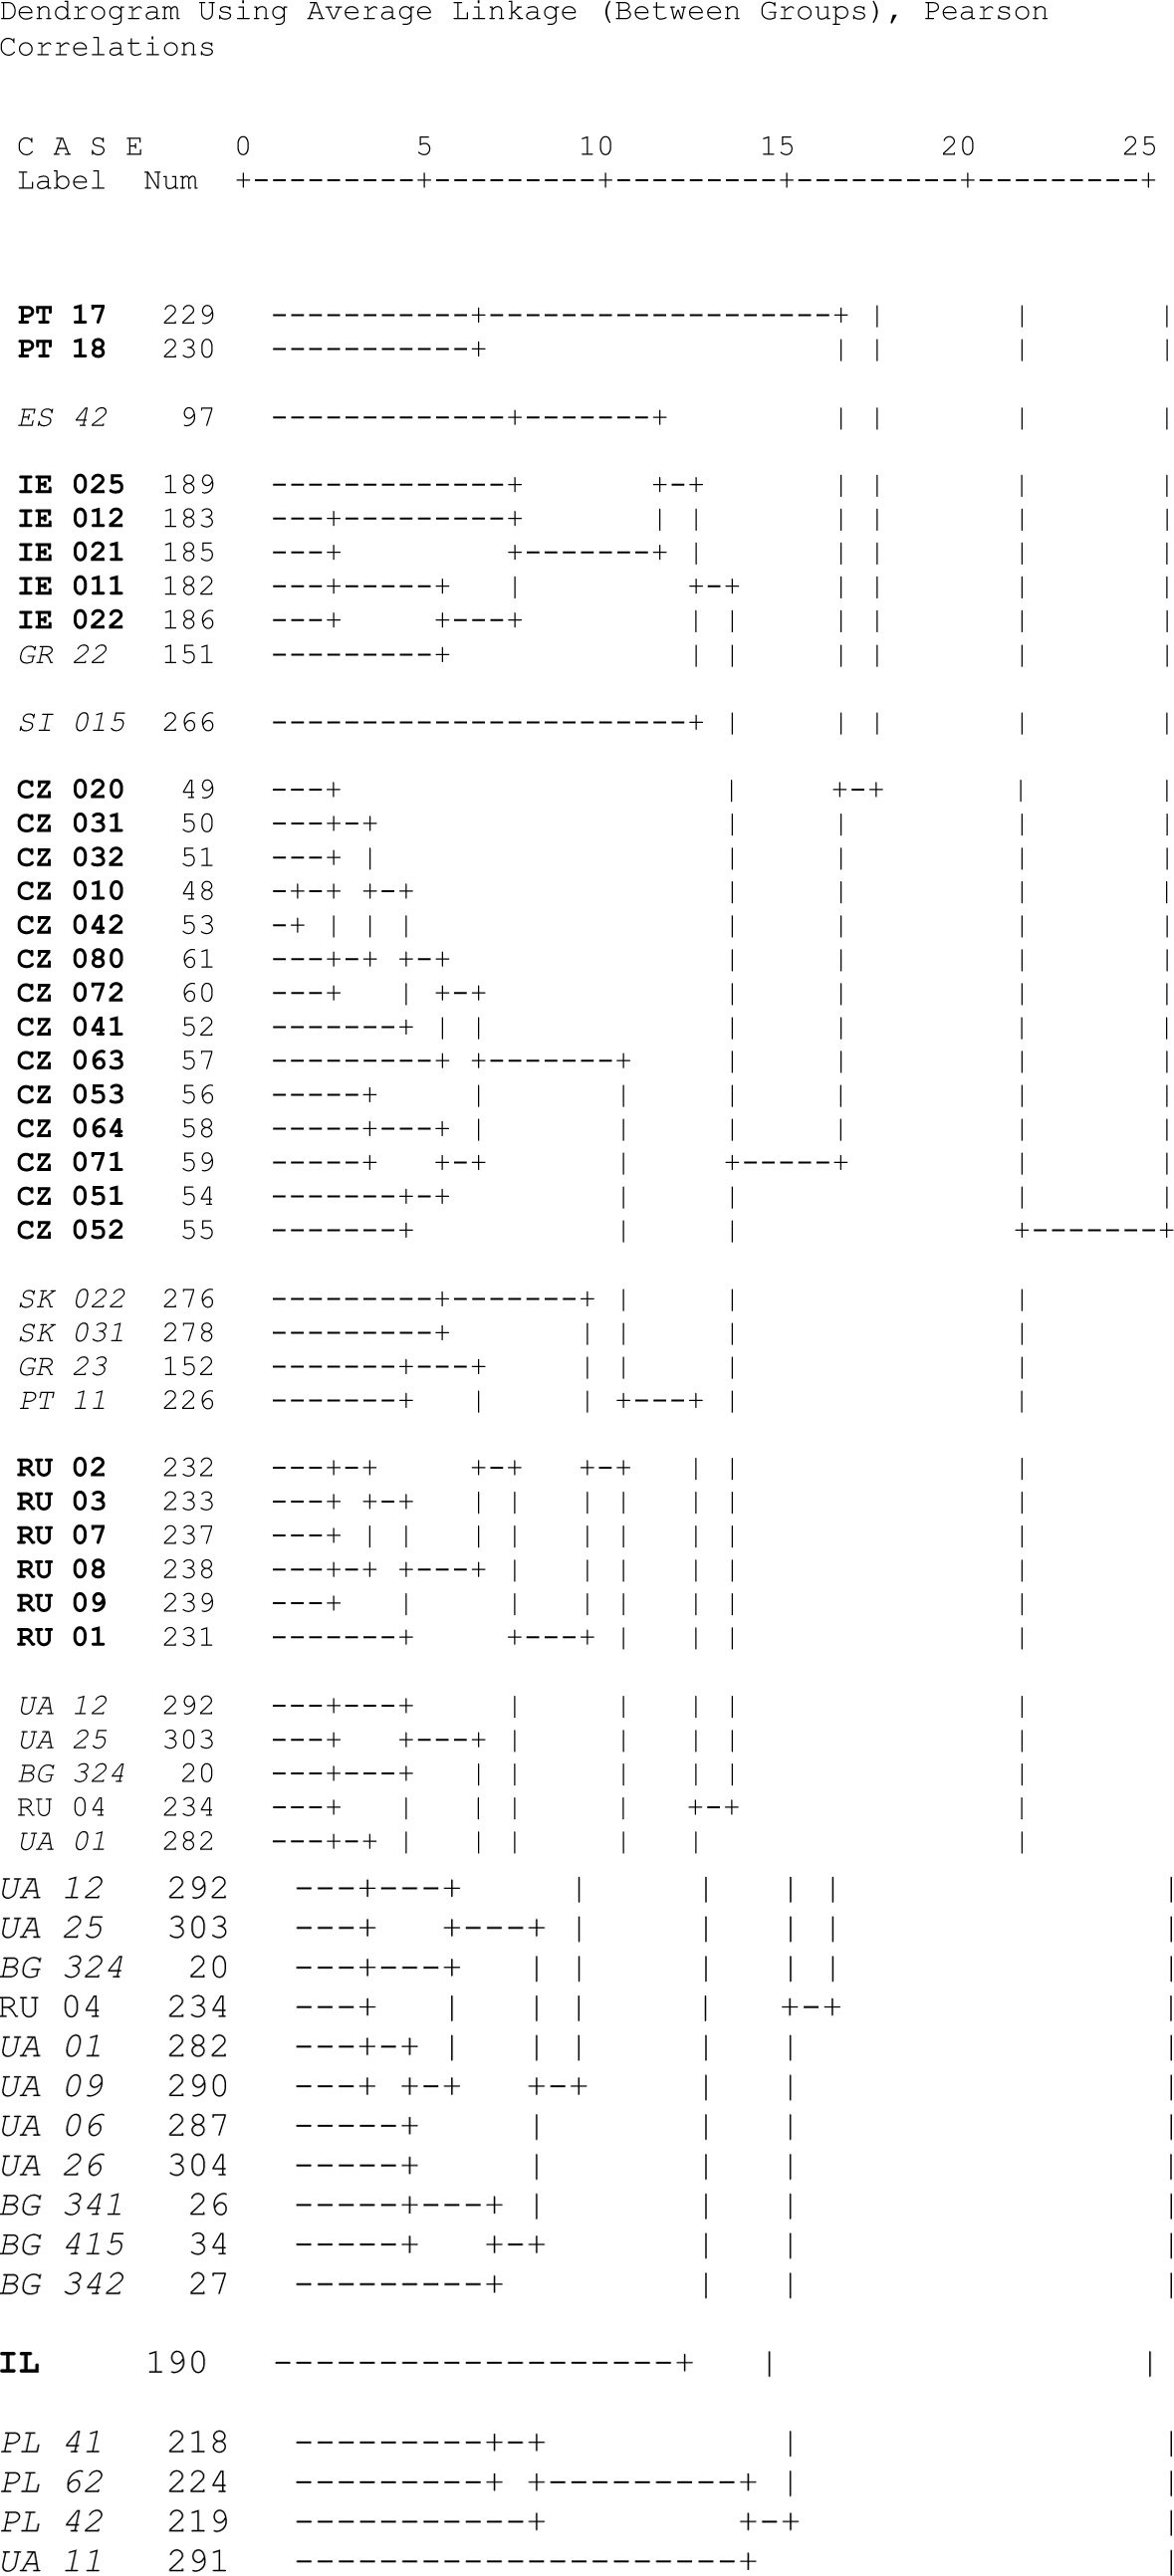
Hierarchical clustering of European regions on 21 measures of values: Section of Portugal (PT), Ireland (IE), Czech Republic (CZ), and Russia (RU).
Portugal
Only two of the five Portuguese regions (PT17 “Lisboa” and PT18 “Alentejo”) (40%) cluster separately into what might arguably be considered a national cluster. The remaining three regions are members of mixed East-European clusters.
The Euclidian method outlines a homogeneous and clearly separated Portuguese cluster, consisting of three regions, linked to the British-Irish cluster. The remaining Portuguese regions are in the East European domain.
Ireland
The eight Irish regions are surprisingly split between the West European and East European mega clusters. Five of them (63%) form a national cluster, amid Eastern Europe, with one Greek region closely linked to it. The remaining three are attached to the cluster of the United Kingdom.
The Euclidian method creates a mixed British-Irish cluster, composed of nearly all British and Irish regions. This suggests that the splitting of the Irish regions between Western and Eastern Europe that we obtained with the Pearson method may be a statistical artifact.
Czech Republic
All 14 Czech regions (100%) form a homogeneous and clearly delineated national cluster.
Russia
Six of the 10 Russian regions (60%) form a homogeneous and clearly delineated national cluster. Two of the remaining four are in the Ukrainian cluster. The other two (RU10 “Far East” and RU04 “Central Chernozem”) are members of two mixed East European clusters.
The Euclidian method creates a cluster of eight Russian regions plus one Greek and one Portuguese.
Israel
Represented as a single region, Israel is on its own, linked to various East European clusters.
The Euclidian method assigns Israel a place in the Slovene cluster.
Figure 10 shows a supranational cluster consisting of two national clusters: Slovenian regions and Hungarian regions. It also contains a small cluster of regions of Greece, Hungary, and Bulgaria, as well as a vagrant Portuguese region and a German region.

Hierarchical clustering of European regions on 21 measures of values: Section of Slovenia (SI) and Hungary (HU).
Slovenia
Ten of the 12 Slovene regions (83%) form a homogeneous and clearly delineated national cluster. The remaining two (SI 015 “Zasavska” and SI 016 “Spodnjeposavska”) are separate within the East European domain.
Hungary
Nineteen of the 20 Hungarian regions (95%) form a homogeneous and clearly delineated national cluster. The remaining region (HU 312 “Hajdu Bihar”) is a member of a mixed cluster with Greek and Bulgarian regions.
Essentially, our first hypothesis is confirmed:
Test 2
Regardless of the combination of methods that we used, none of our random selections—each of 500 to 600 individuals—resulted in anything that resembled country clusters. Our second hypothesis is also confirmed:
Test 3
The third test produced a dendrogram of 132 randomly formed nationally pure groups of 20 individuals each, shown in Figure 11. In view of the small number of groups per nation (five for most nations), precise estimates of the homogeneity of each cluster would be misleading. Yet, we found that despite the presence of some mixed clusters, there were 11 clusters consisting of at least 4 groups from a single nation and no groups from other nations: Germany, Spain, Denmark, Sweden, Norway, Slovakia, Croatia, Ukraine, Russia, Israel, and France. In addition, there were five clusters consisting of at least four groups from a single nation and no more than one group from another nation: Czech Republic, Estonia, Switzerland, Bulgaria, and Poland. There is also a cluster consisting of all five Greek groups and two from Cyprus. Thus, approximately two thirds of the European nations are recognizable by their clusters. This confirms our third hypothesis.

Hierarchical clustering of 132 randomly formed nationally pure groups, of 20 individuals each, from 25 European nations and Israel on 21 measures of values.
Discussion
Although we used an entirely different database, our results concur with those presented by Minkov and Hofstede (2012): just like the in-country regions of Asia, sub-Saharan Africa, Latin America, and the Anglo world, those of Europe tend to form homogeneous and clearly delineated national clusters on measures of values, albeit with some important exceptions.
In our analysis of national regions, language and the translation of the questionnaire play an important role. The EVS questionnaire was issued in different language versions, all based on the original English version. The Schwartz value items are relatively complex, often consisting of two parts, with “and” in between and, by their very nature, emotionally loaded. Perfect equivalence in translation is an unattainable ideal, and “the impact of culture on our findings starts in the translator’s mind” (Hofstede, 2001, p. 22). Translations may account for part of the clustering by nation, but the Belgian case shows that this is not the whole story.
It is interesting to note that despite the linguistic similarity and close political, economic, and historical ties between the Scandinavian countries, their regions form very distinct national clusters. Similarly, the Dutch and Flemish regions are distinct and wide apart. This supports Hofstede’s (1980) observation that the Dutch and Flemish cultures are quite different. It is also clear that Belgium consists of two markedly distinct cultures, at least in terms of values: Flanders and Wallonia. This split mirrors the linguistic split between the French and Dutch-speaking parts of Belgium. Still, the Flanders cluster is closer to the Wallonia cluster than to the Netherlands, and both Belgian clusters are found close to France.
The situation on the British Isles and in Ireland is far less clear-cut. English and Irish cultures are marginally distinct in terms of regional proximity on values, and the distinction is contingent on the analytical method that the researcher uses.
As expected, the situation in Eastern Europe is complex. While some countries have clearly identifiable national cultures in terms of values, others do not exhibit this pattern. It is possible to identify core clusters of Ukrainian and Polish regions that can be viewed as main representatives of those countries’ national cultures, yet so many of the Ukrainian and Polish regions cluster separately from the core that, according to our first test, Ukraine and Poland do not seem to have very strong and distinct cultural identities in terms of values. Surprisingly, the same is true of Portugal and Greece even though these two countries are European geographic outposts whose territories have not been regularly torn apart by diverse European powers. It is equally surprising that many Portuguese regions are members of East European clusters, suggesting the possibility of measurement error or artifact.
At this point, we cannot provide a full explanation of the reasons for these apparent differences in cultural homogeneity across Europe. Yet, we suspect that some part of the answer is hidden in the wording of Schwartz’s values. Schwartz and Sagiv (1995) published national estimates of deviations from Schwartz’s theoretical individual-value model. Minkov (2013) reported that one of these estimates—“deviation of value locations”—is highly and negatively correlated with Hofstede’s individualism index. In other words, the more individualist a country is, the better the replication of Schwartz’s individual-level model in that country. Thus, it is empirically clear that Schwartz’s model works almost perfectly in Anglo-Germanic countries but is somewhat less reliable outside them. It is not quite clear why this is so, but it is likely that outside the Anglo-Germanic world, there is a comprehensibility issue: Respondents either do not understand all Schwartz items exactly like Anglos or Scandinavians or do not have the same experience with multiple-choice tests and surveys. As a result, there is an element of randomness in their answers. Ultimately, what seems as a relative lack of cultural homogeneity in Portugal, Greece, or Ukraine may actually be a statistical artifact: noise from partly random responses to a research tool for which respondents do not have fully adequate preparation.
As we expected, individuals cannot be sorted out into nations on the basis of their values, but randomly formed national homogeneous groups of people can. Thus, our study further legitimizes the emerging concept of culture as something shared between groups, such as regional populations, or any groups for that matter, that are part of a larger group, such as a nation, but not necessarily between the individuals of any nation. Hence, culture allows distinctions to be made between groups of people, not necessarily between individuals.
Our study shows that despite the partial limitations of the use of nations as units of analysis in comparative cross-cultural studies, this approach is largely justifiable. As long as in-country regional data are available, using regions as units of analysis is also acceptable, yet it is not at all imperative. Nations can provide fairly adequate pictures of cross-cultural variation, at least in terms of values. Because values, aggregated to the national level, are often strong predictors of various national statistics reflecting behaviors (Hofstede, 2001; Minkov, 2011, 2013), national indicators of values can be used to explain these national statistics.
Finally, our findings suggest that despite some political rhetoric, the concept of common European values is controversial. Differences in national wealth seem to be one of the main factors that account for differences in values.
Footnotes
Appendix
Declaration of Conflicting Interests
The author(s) declared no potential conflicts of interest with respect to the research, authorship, and/or publication of this article.
Funding
The author(s) received no financial support for the research, authorship, and/or publication of this article.